 Zuguo Mo
 Jianhai Zhang
95% of researchers rate our articles as excellent or good
Learn more about the work of our research integrity team to safeguard the quality of each article we publish.
Find out more
ORIGINAL RESEARCH article
Front. Earth Sci. , 22 February 2023
Sec. Earth and Planetary Materials
Volume 11 - 2023 | https://doi.org/10.3389/feart.2023.1138302
Time-dependent deformation and long-term stability of rocks are important issues in water conservancy and geotechnical engineering. Currently, there are no well-accepted theoretical criteria with which to predict stability and damage considering time-dependent deformation. In-depth research is still needed. Multilevel creep experiments were performed on micritic bioclastic limestone obtained from a continuously deforming tunnel in Xinjiang, China. Based on crack strain theory, the axial crack strain evolution characteristics during loading and creep processes were investigated. The evolutionary characteristics of the crack dissipation energy density, which was obtained via integration of the crack strain during loading and creep, were revealed. The energy dissipation leading to rock fracture in each multilevel creep experiment was identified and used to calculate the total energy dissipated at the point at which the rock loses strength. A rock instability index based on the creep crack dissipation energy density was proposed. An instability index evolution model was proposed, expressed as a surface for the change in instability index with the bearing state (Rd) and time. Based on the instability index surface, the stress threshold creep-sensitive stress σcs was defined. The time-dependent instability index surface was divided into a long-term stability zone (Z1), an initial time-dependent instability zone (Z2), a time-dependent instability stable evolution zone (Z3) and a time-dependent instability sensitive zone (Z4) by the crack initial stress, crack damage stress, and creep sensitive stress. The instability index model was established as an energy instability evolution criterion to evaluate and predict the rock instability and lifespan under specific stress states.
Underground excavation changes the initial stress state of rock masses, leading to stress redistribution, which potentially causes instability over time and space. At the exit of drainage tunnel No. 1 of the Artashi Water Conservancy Project in Xinjiang, China, unexpectedly large and persistent deformation of the surrounding rock has led to safety problems with the tunnel and slopes (Mo et al., 2022). The local rock has been identified in thin sections as micritic bioclastic limestone, which is rare and has not been adequately studied regarding its mechanical properties. The surrounding rock showed significant creep deformation during the construction period. The continued large deformation of the rock surrounding the tunnel resulted in the yielding of the steel arch and the fracture of the concrete revetment of the slope, as shown in Figure 1A. After implementing anchor cable reinforcement and concrete anchor support for the slope and tunnel exit, on-site monitoring showed that slope deformation was continuing and that crack failures were occurring in the support structure (Figures 1B, C). The significant time-dependent deformation of the surrounding rock and the damage to the support structure during construction are worrying. Thus, studying, predicting and evaluating the safety and stability of tunnels and slopes is an important scientific endeavour.
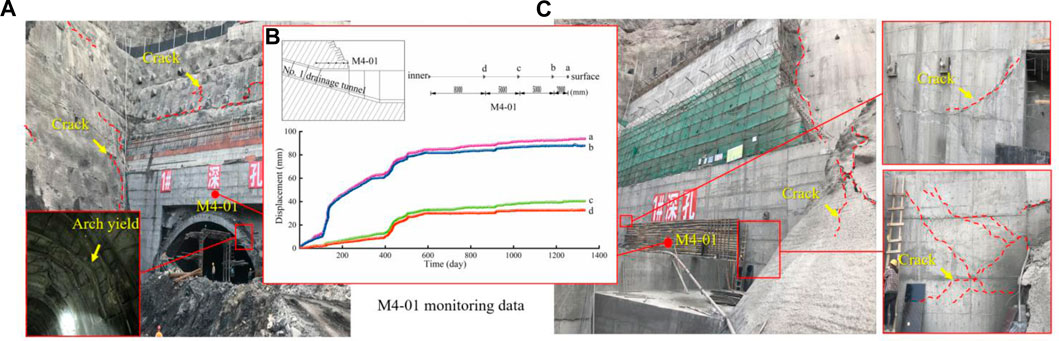
FIGURE 1. Ageing deformation and failure issues of the tunnel: (A) steel arch yield and shotcrete crack, (B) M4-01 displacement monitoring, and (C) concrete support crack failure.
As an inherent mechanical property of rocks, creep has been important to research to clarify the ageing deformation characteristics and long-term stability of rock. In recent years, various laboratory experiments have been conducted to study the time-dependent mechanical properties of rock. Lyu et al. (Lyu et al., 2021) conducted a series of very long-term rock salt uniaxial creep tests (875 days) to understand the deformation of salt rocks under long-term testing at depth. Zhao et al. (Zhao et al., 2019a) conducted true triaxial creep experiments on Jinping marble and microscopically observed many rock microcracks that occurred during the creep process. Zhao et al. (Zhao et al., 2017a) carried out extensive multistage cyclic incremental loading and unloading creep experiments on rock to investigate the non-linear creep properties of hard rock. Based on the multilevel loading and unloading experimental data and appropriate assumptions, the instantaneous elastic strains, instantaneous plastic strains, visco-elastic strains and visco-plastic strains of rocks were distinguished. A model suitable for characterizing the elasto-viscoplastic rheological non-linear properties of rocks was proposed. Zhao et al. (Zhao et al., 2017b) investigated the creep characteristics of intact and cracked limestones by carrying out multilevel loading and unloading creep laboratory experiments. The evolutions of the transient strains, visco-elastic strains and visco-plastic strains of the rocks were analysed, and the difference in creep properties between intact and cracked limestone was revealed. Yang et al. (Yang et al., 2022) carried out cyclic loading and unloading creep experiments on granite. The variation characteristics of transient strain, visco-elastic strain and visco-plastic strain of granite were analysed, and a model for the time-dependent damage evolution was proposed. Zhou et al. (Zhou et al., 2022) studied the shear creep properties of rocks with joints by numerical experimental methods using Particle Flow Code (PFC) and analysed the effects of creep parameters and bolts on rock shear creep. Zhou (Zhou, 2005; Zhou, 2006; Zhou et al., 2008; Zhou and Yang, 2018) proposed a micromechanical model and found that the mechanical properties of rocks are related to parameters such as crack direction length density. The direction and conditions of shear damage in rocks subjected to compression with preexisting cracks were investigated by applying an energy density factor approach. Damage localization initiation conditions for rocks containing periodically distributed cracks were also investigated. Yu et al. (Yu et al., 2021) used a disturbed creep test bench to investigate the mechanical response of disturbed creep in mudstone specimens with different moisture contents by performing a graded loading creep disturbance test. Zhao et al. (Na et al., 2022) carried out numerical experiments using the continuous and discontinuous software GDEM to investigate the creep mechanical characteristics and fracture evolution of rock masses with different fracture angles, lengths and dips of rock bridges. Zhao et al. (Zhao et al., 2019b) assessed the rheological behaviour of rocks containing cracks under the action of water pressure and stress fields. The wing crack evolution was studied, and a model for the rheological fracture of rock cracks was proposed. As revealed by scholars in the field of rock mechanics, the essence of rock fracture is the closure, initiation, propagation and coalescence of rock microcracks (Bieniawski, 1967; Li and Shao, 2016). The study of prefabricated single or multiple cracks in rocks reveals the evolutionary properties of rock fractures. However, the randomness and uncertainty in the geometry, distribution and evolution of microcracks makes it difficult to clearly determine the microcrack evolution patterns. The use of the proposed crack strain (Martin, 1993) effectively avoids the difficulty of studying microcrack evolution (Huang et al., 2022). Therefore, the study of rock fracture evolution characteristics from the perspective of crack strain can provide a deep understanding of the time-dependent evolution of rock.
The application of infrared thermal imaging equipment in rock mechanics experiments has revealed the accompanying energy evolution of rock damage processes (Luong, 1993; Lixin and Jinzhuang, 1998; Wu et al., 2000; Wu et al., 2006). Research (Irwin, 1956) has shown that the crack tip stress intensity factor is related to energy release once infinitely small displacements occur. Hussain MA (Hussain et al., 1974) calculated the energy release rate for a crack subjected to both Mode I and Mode II conditions and obtained the initial propagation path for such a crack from the maximum value of the energy release rate. Xie et al. (Heping et al., 2005; Xie et al., 2011) studied the energy change during rock damage and discussed the intrinsic link between energy dissipation and rock damage. When a rock specimen is compressed, part of the input energy is stored in the rock as elastic energy, and the rest of the energy is dissipated, leading to rock damage. Meng et al. (Meng et al., 2016) studied the energy evolution of rocks during cyclic loading and pointed out that the input energy leads to irreversible initiation and extension of microcracks in the rock mass. Shi (Sih, 2014) revealed the macroscopic stress‒strain process caused by microcrack extension by means of strain energy theory.
Given this knowledge, the study of the crack strain and energy evolution of rocks promotes an in-depth understanding of the evolution of rock fractures. The rock failure criterion based on the crack and energy evolution mechanism can be further developed to assess the stability of a rock mass as it ages. In this study, samples from the surrounding rocks of the Artashi Water Conservancy Project, which exhibit long-term persistent deformation, were collected. Multilevel creep experiments were carried out to investigate the time-dependent deformation properties of the rock. Based on crack strain theory, the crack strain characteristics of the rock during loading and creep were investigated. The crack energy dissipation in multilevel creep was analysed, and a rock instability index was proposed. Burgers-like instability index evolution models were proposed, and the surface of the change in the instability index in stress‒time space was exhibited, which can be used as a criterion for rock instability and rock life prediction.
The rock is black in colour and can be carved with a knife. Thin section identification techniques are used to study the composition of the rocks. As shown in Figure 2, the bioclastic structure of the rock is revealed under polarizing microscopy, with a composition of 55% bioclastic material and 45% interstitial material (micrite calcite). Small amounts of carbonaceous material and clay are also present in the interstitial material, which is unevenly distributed. The bioclasts are mostly irregular in shape and vary in particle size. The rock has therefore been named micritic bioclastic limestone.
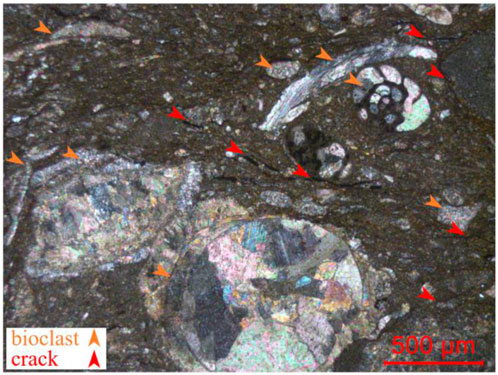
FIGURE 2. Rock identification by polarizing microscopy.
A large block of rock was taken and used to produce specimens. All the specimens were drilled in the same direction to reduce variability. The specimens were carefully made into standard cylinders (50 mm diameter and 100 mm height) with a height to diameter ratio of 2.0. The allowable error of the unevenness of the ends of the specimen was ±0.01 mm, the end surfaces were perpendicular to the axis of the specimen, and the allowable deviation angle was controlled at 0.001 rad. After wave velocity measurements, specimens with similar wave velocities were selected for the experiments. The MTS815 testing machine at Sichuan University was used to carry out the multilevel creep experiments. The multilevel creep experimental scheme is shown in Figure 3, and the procedure for conducting multilevel creep experiments has been given in detail previously (Mo et al., 2022). In contrast to previous works, the multilevel creep experiments carried out in this paper are based on micritic bioclastic limestone, a particular rock that has not been studied in depth regarding its creep properties. In addition, the loading stress levels of the creep experiments were set with reference to rock stress thresholds.
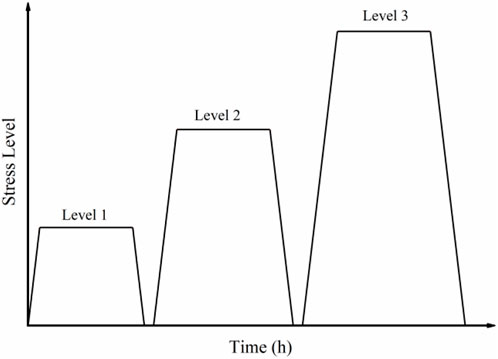
FIGURE 3. Loading and unloading scheme of the multilevel creep test.
The results of the rock creep experiments are shown in Figure 4. The first level of creep is more obvious, and the steady creep rate (slope of the curves) of the rock gradually increases with increasing stress levels.
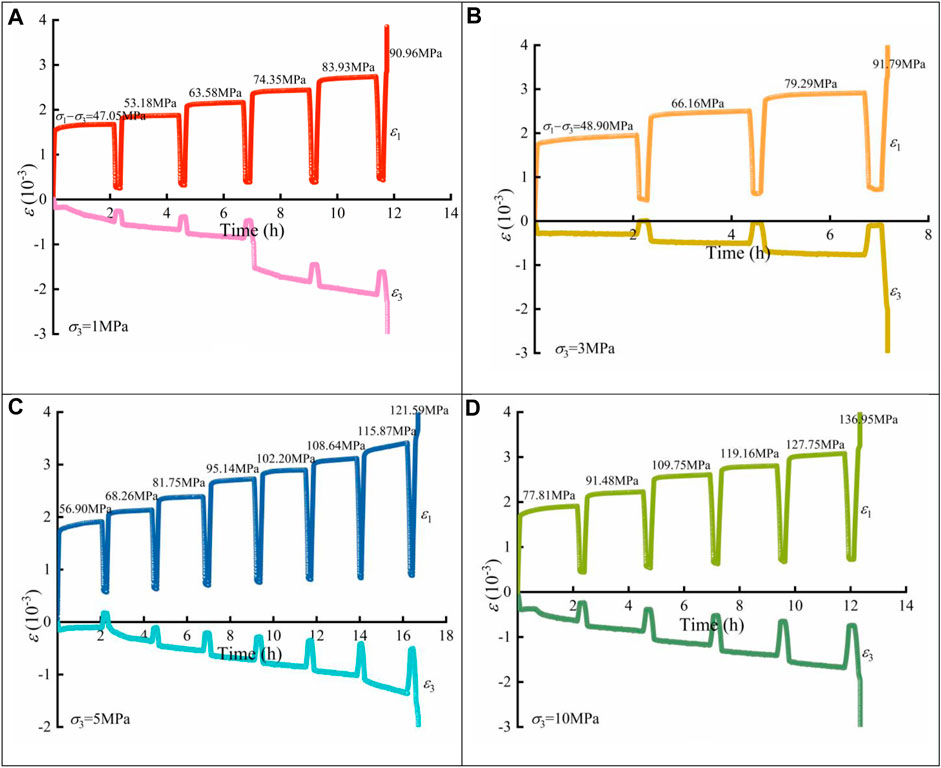
FIGURE 4. Multilevel creep test results.
To reasonably analyse the rock crack evolution characteristics on a macroscopic scale in multilevel loading creep experiments, basic assumptions are adopted as in the reference (Mo et al., 2022). The non-linear deformation of the rock is the evolution of crack strain caused by the rock crack closure, propagation and coalescence (Zuo et al., 2020). Therefore, the elastic and crack strains make up the rock strain.
where ε1 denotes the axial strain and ε1c is the axial crack strain.
According to Hooke’s law, the rock axial crack strain can be expressed as follows:
where E represents the elastic modulus, μe refers to the elastic Poisson’s ratio, σ1 pertains to the axial stress, and σ3 denotes the confining pressure.
To obtain the crack strain of the rock in the multilevel creep tests, the rock elastic parameters E and μe at each loading level were redetermined by the moving point regression technique (Eberhardt et al., 1998). As shown in Table 1, the elastic modulus of the multilevel creep level increases first and then decreases. The variation in the rock elastic modulus illustrates the multilevel creep crack evolution. The weak rock structures are compressed, and initial cracks close at the first few loading and creep levels, making the rock harden. When the rock bearing state exceeds the rock crack evolution threshold, rock crack evolution leads to a decrease in the rock elastic modulus.
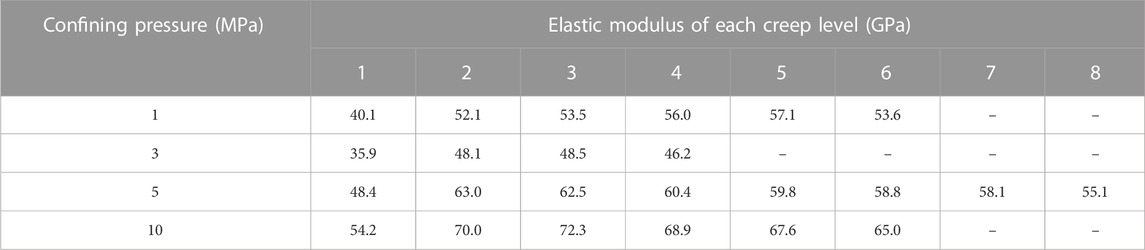
TABLE 1. Variation in the rock elastic modulus in multistage loading creep tests.
Based on Eq. 2 and the elastic parameters determined for each loading level above, the ε1c curve of the multilevel creep tests is plotted in Figure 5. The axial crack strain increases rapidly at the beginning of the loading and stabilizes in the elastic stage. When the deviatoric stress exceeds the damage stress threshold, the new crack strain increases. When the deviatoric stress reaches the set value, the creep state begins.
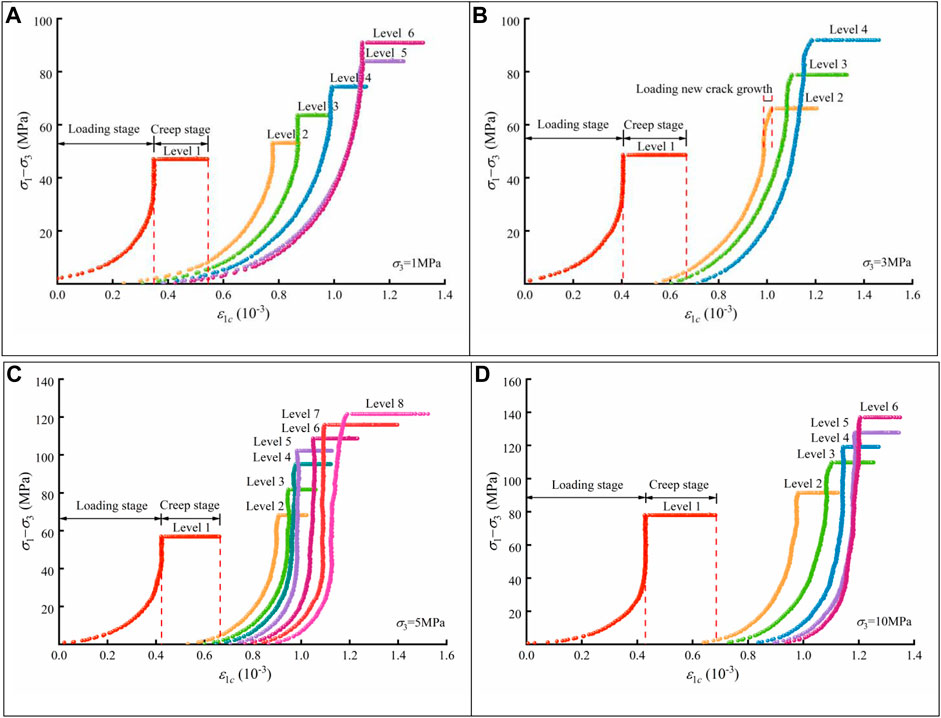
FIGURE 5. Axial rack strain under multilevel creep tests.
The failure process of the rock specimens is closely related to the energy dissipation. The multilevel loading creep experiments in this study are conducted by unloading at the end of each stress level and reloading to the next predetermined deviatoric stress. Therefore, the energy evolution of the rock specimen during the test can be obtained by integrating the loading and unloading deviatoric stress‒strain curves (Heping et al., 2005). The multilevel deviatoric stress‒axial strain curve is shown in Figure 6A, where the area of ABCD represents the total energy density input to the rock specimen during the loading and creep stages and the area of CDE represents the elastic energy density recovered during unloading of the rock. The area difference ABCE represents the energy dissipation density of the rock specimen during a single loading-creep-unloading cycle.
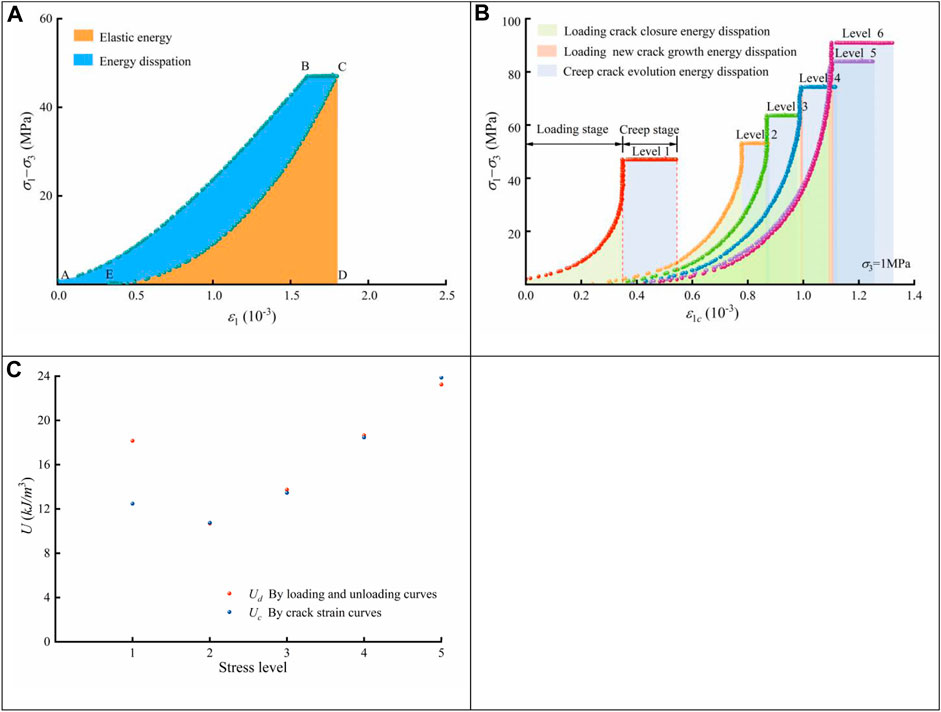
FIGURE 6. Sketch of rock energy dissipation density (A), crack energy dissipation density (B), comparison of energy dissipation density obtained by different methods (C).
Considering that rock failure is characterized by the closure, growth and convergence of cracks, the crack evolution can be presented macroscopically with crack strain curves. Therefore, the energy dissipation density obtained by the crack strain curve, defined as Uc, clearly reflects the failure process of rocks. As shown in Figure 6B, the rock crack energy dissipation density Uc of the multilevel creep tests based on axial crack strain consists of the loading-induced crack closure energy dissipation density, loading-induced new crack growth energy dissipation density and creep crack evolution energy dissipation density. The initial axial crack closure energy dissipation is used for existing crack closures. The loading may lead to new crack growth, and this part of the energy dissipation is responsible for the fracture of the rock specimen. During creep, the elastic energy of the rock remains constant, and any external energy input to the rock specimen is dissipated as creep crack energy. This energy dissipation leads to the gradual development of rock cracks, showing time-dependent deformation.
Taking the multilevel creep test at 1 MPa confining pressure as an example, the deviatoric stress-loading and unloading curve integration method and deviatoric stress-crack strain curve integration method are used to obtain the energy dissipation at each level, as shown in Figure 6C. The results show that the energy dissipation of the first level using the loading and unloading curve is larger than that of the crack strain curve. After the first loading level, the initial cracks and pores of the rock specimen closed, and new cracks were generated. The loading leads to surface contact as the initial cracks and pores close. The closed crack surface rubs and slides during unloading, increasing some of the energy dissipation. Sliding causes a reduction in the roughness of the crack and pore surfaces, resulting in less energy dissipation for subsequent unloading. Consequently, the results for the remaining stages are essentially the same for both methods.
Accordingly, the energy dissipation density of the loading and creep stages can be obtained by integrating the deviatoric stress-crack strain curves, avoiding the energy dissipation effect of the unloading process. The crack energy dissipation density in the multilevel creep tests is shown in Figure 7. The crack energy dissipation density at the loading stage increases with the loading level because of the rock crack accumulation. In the loading stage, some curves deviate from horizontal, showing that part of the energy dissipation occurs due to new crack growth, which is the same as the loading-induced new crack growth energy dissipation in Figure 6B. The total crack and creep crack energy dissipation for each loading-creep stage increases with the stress levels. Notably, the energy dissipation in the first level is greater than that in the subsequent levels due to the initial crack closure.
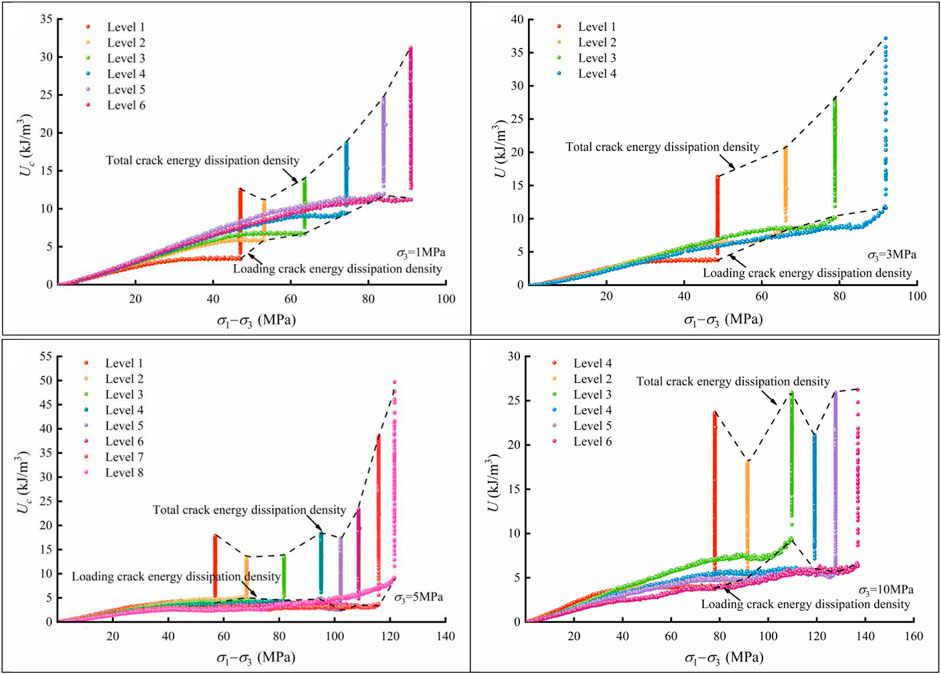
FIGURE 7. Crack energy dissipation density in the multilevel creep tests.
The essence of rock damage is crack growth, coalescence and crossing. The energy dissipation that leads to crack evolution is the fundamental cause of rock fracture. Consequently, the initial energy dissipation of crack closure is not accounted for by the rock damage dissipation energy density. The energy dissipation leading to rock fracture in the multilevel creep test is attributed to loading-induced new crack growth energy dissipation and creep crack energy dissipation. Figure 8 shows the rock crack energy dissipation density evolution curves in multilevel creep tests before tertiary creep. The energy dissipation densities of the loading-induced new crack growth and creep are considered to investigate the energy leading to rock failure. It can be seen from the plots in Figure 8 that the energy dissipation density gradually increases with loading level and time.
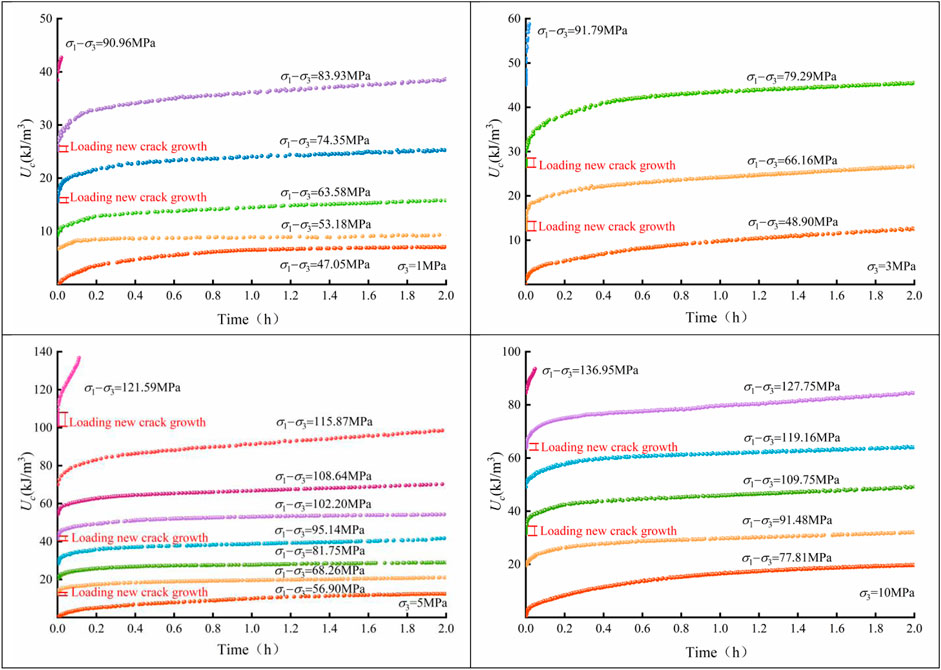
FIGURE 8. Rock energy dissipation density in multilevel creep tests.
The process of crack growth and damage accumulation within the rock is accompanied by energy dissipation. The energy input to the rock during compression is converted into two components: the elastic energy and energy dissipation associated with rock failure. As mentioned above, the process of rock failure involves the evolution of microcracks in the rock, and the energy dissipated by cracking can be calculated based on the rock crack strain. It should be clarified that the rock tests in this study are carried out at low confining pressures. The work done by the confining pressure is much less than the axial stress. Therefore, in this study, the approximate rock crack energy dissipation is calculated by considering only the axial component. Figure 9 shows the plots of the accumulated crack energy dissipation of the tests. The cumulative crack energy dissipation curve grows fast as the stress level increases, indicating that the crack energy dissipation of the rock specimen accelerates.
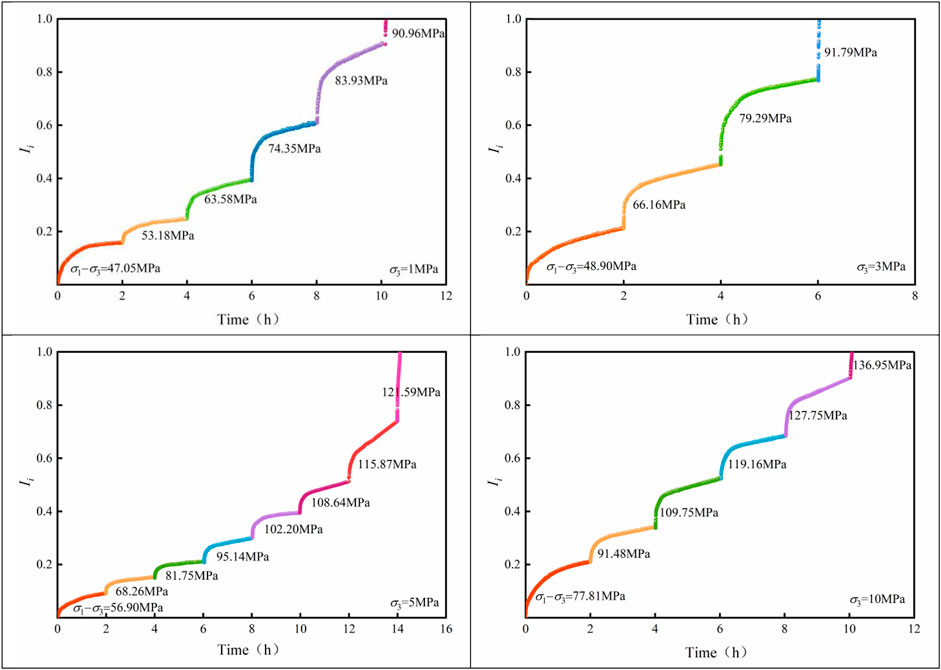
FIGURE 9. Accumulated instability index evolution of rock specimens in multilevel creep tests.
The damage process of rock specimens is intrinsically linked to energy dissipation. After a certain degree of creep and crack energy dissipation has accumulated, the rock specimen enters the tertiary creep stage. Predicting the time at which a rock enters the tertiary stage can help to evaluate lifespan and guide design. To represent the rock damage and loss in rock strength, an instability index calculation method is proposed based on the crack energy dissipation density, as given by Eq. 3.
where Ii denotes the instability index; Uic is the crack energy dissipation density of each level of the creep test; Utotalc denotes the total crack energy dissipation density of the multilevel creep test (excluding tertiary creep); I, j and k are test levels; and εt1c is the axial crack strain at time t.
The damage evolution behaviour of sandstone compression processes has been investigated by using acoustic emission (AE) spatial localization techniques in References (Zhang and Zhou, 2020; Niu and Zhou, 2021), and the rock damage acceleration behaviour has been retrospectively identified by the evolution of normalized AE parameters of the rock. Using a similar approach, here, normalized AE parameters are obtained for a multilevel loading and unloading creep process of micritic bioclastic limestone. As shown in Figure 10A, the normalized cumulative counts, normalized cumulative energy, normalized cumulative amplitude, and normalized cumulative rise time of the multilevel creep tests at 1 MPa of confining pressure gradually increase as the level of creep increases. The evolution curves of the normalized cumulative counts, energy and amplitude are similar. The curves indicate that the evolution of rock cracks and damage are continuous at all levels of creep. The normalized cumulative energy curves show that the higher the deviatoric stress is, the greater the AE energy produced (the cumulative energy curve grows faster at the same time). The rapid increase in the cumulative AE energy curve (the marked part by ellipses) indicates that a substantial amount of rock rupture is generated, corresponding to a large amount of creep crack dissipation energy. The rapid increase in AE energy and count curves is found to match well with the rock crack strain and crack energy dissipation described in Figure 6B, showing the strong relationship of rapid energy release with new crack growth.
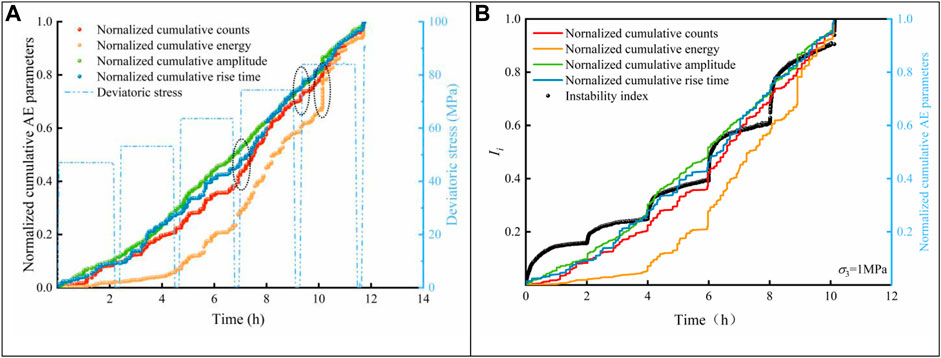
FIGURE 10. Evolution of the normalized AE parameters and instability index in the 1 MPa confining pressure creep test.
Ignoring the duration of the unloading and loading process, Figure 10B illustrates the evolution of the proposed instability index and normalized cumulative AE parameters during creep. The calculation of the crack dissipation energy considers the presence of initial cracks, pores and weak structures in the rock, which have a large dissipation energy during the first creep level. However, the initial pore closure and sliding produce less AE (also related to the Kaiser effect). Therefore, the curves differ for the first level of creep. Overall, the AE curves and the instability index curve evolve in the same pattern with time, validating the reasonableness of the instability index.
Multilevel creep tests can help to reduce the duration and cost of tests, but the later test levels are influenced by the earlier levels, and the rock creep deformation cannot be directly characterized under specific stress conditions. The superposition principle can be adopted to process multilevel creep data to represent the creep deformation properties of a single stage under specific stress conditions (Tan and Kang, 1980). The instability index evolution curve of the rock at different stress levels after the superposition process is shown in Figure 11.
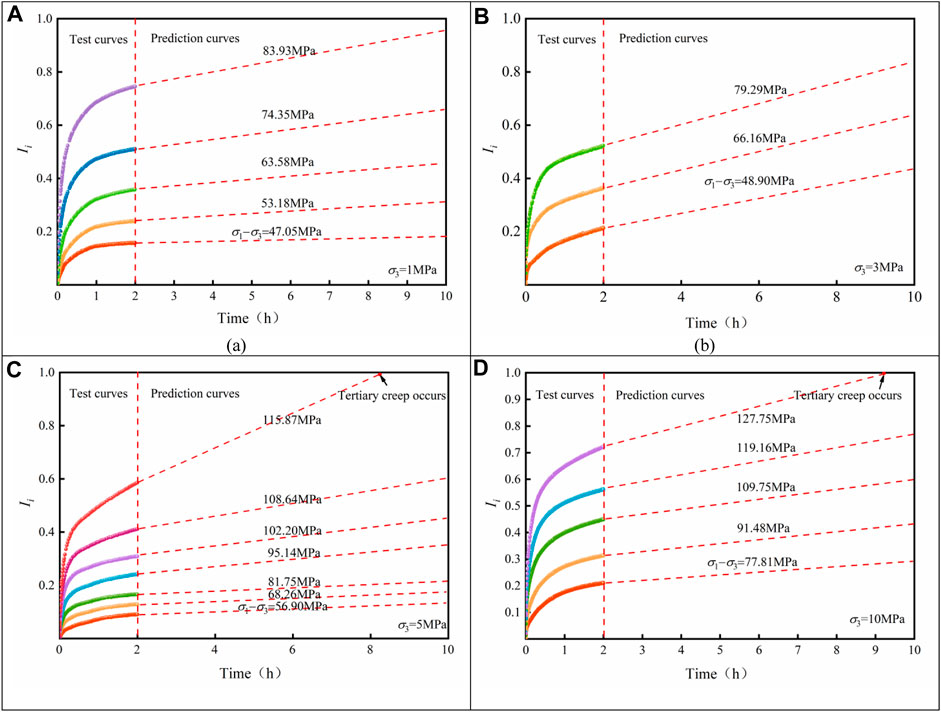
FIGURE 11. Rock tertiary creep prediction based on the instability index.
As defined by Eq. 3, the rock instability index is the ratio of the crack dissipation energy density before tertiary creep. Considering that the slope of the secondary creep curve remains constant, it is assumed that the rock creep instability index curve will evolve with a constant slope until the tertiary creep stage. A prediction method for the unstable creep stage time can be obtained by extending the creep instability index evolution curve. When the instability index curve reaches 1, the rock specimen enters the accelerated creep stage, and breakdown occurs rapidly. Accordingly, the prediction of the creep instability of the rock is shown in Figure 11. The extension of the instability index test curve reaches 1 at the time when tertiary creep is predicted to occur in the rock. The rock specimens are predicted to enter the accelerated creep stage after approximately 8.3 h at loading level 7, according to Figure 11C, and after 9.2 h at loading level 5, according to Figure 11D.
The deviatoric stress‒strength ratio (Rd), which characterizes the bearing state of the rock, is defined as the ratio of the deviatoric stress to the peak deviatoric stress. To validate the method of predicting the instability index evolution proposed here, a single-level creep test at a confining pressure of 10 MPa is carried out under Rd = 0.851 and Rd = 0.948. The instability index evolution curves of the rock specimens at different deviatoric stress‒strength ratios (Rd) are shown in Figure 12. The instability index curve of Rd = 0.851 evolves with a constant slope, justifying the extension line. In the Rd = 0.948 curve, the rock instability index rate gradually stabilizes with time. Once the rock instability index reaches 1, the slope of the creep curve begins to increase, and the rock specimen enters the tertiary creep stage (at 4.3 h), followed by accelerated rock damage and failure.
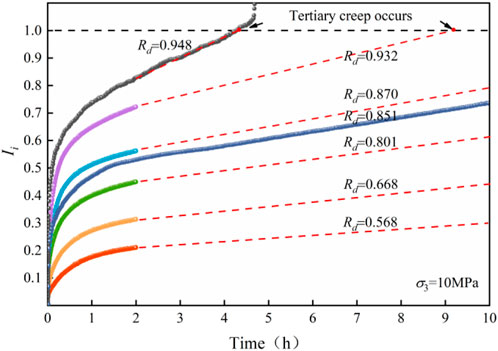
FIGURE 12. Validation of the rock creep instability index evolution.
The instability index evolution curves can be used to predict the time at which accelerated creep will occur in rock specimens. An equation for characterizing the instability evolution is necessary to obtain the timing of the start of long-term rock stability. With reference to the Burgers equation that describes the creep behaviour of rocks, the instability index evolution equation can be written as:
where B, C and F are material parameters; Rd is the deviatoric stress‒strength ratio; and Ili is the instability index caused by loading.
The standard particle swarm optimization (SPSO) algorithm is adopted for fitting the experimental instability index data. The parameters of the instability index evolution equation Eq. 4 under confining pressures of 1 MPa and 10 MPa are determined by fitting, as shown in Figure 13. The rock instability index subjected to loading Ili shows an exponential evolution pattern with Rd. Parameter B shows a special non-linearity and can be represented by a composite exponential and polynomial function. With a small Rd, the creep rate of the rock is very low, and parameter B tends to be infinite. At large Rd, the creep rate of the rock increases significantly, and parameter B decreases. Parameter C shows a clear exponential distribution, and parameter F can be well characterized by polynomials. The clarity of the relationship between the parameters and Rd indicates that the rock instability evolution is closely related to the rock bearing state and time, which can well characterize the instability evolution properties of rocks under load and over time.
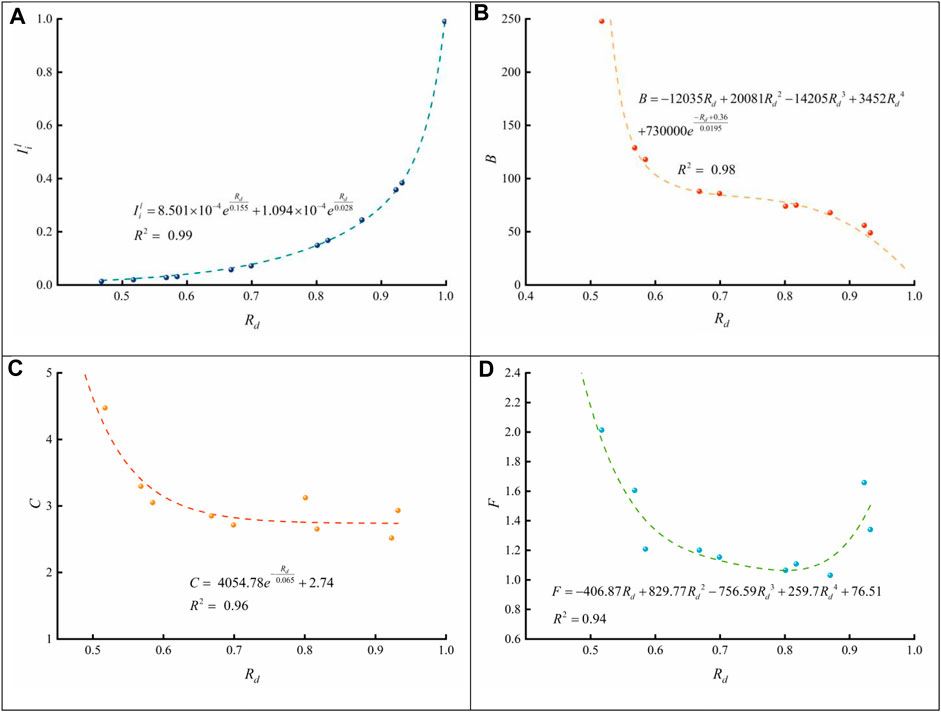
FIGURE 13. Instability index equation parameter fitting.
As shown in Figure 13A, the rock instability index is related to Rd (loading state) and time, which presents as a surface in space. The larger Rd is, the greater the rock instability index due to initial loading, which shows an exponential relationship. For a given Rd, the rock instability index increases with time, and the instability index rate gradually decreases and stabilizes. When the instability index reaches 1, the rock undergoes accelerated creep, followed by failure. The change in the rock instability index with the complex loading path (short-term loading and time-dependent deformation) follows the instability index surface. Once the instability index reaches 1, the rock loses strength. This is independent of the rock instability index evolution path; therefore, the energy instability evolution criterion can be expressed as:
The instability index evolution of a rock specimen can be represented by the dotted line in Figure 14A. The loading and creep path from point (a) to (j) corresponds to the rock specimen under a confining pressure of 10 MPa. When the rock specimen is subjected to a relatively low deviatoric stress, namely, Rd=0.568 [point (a)], the loading instability index I occurs in the rock specimen. Over 2 h of creep, the rock instability index increases and gradually stabilizes [point (b)]. At this point, continuing to add deviatoric stress (Rd=0.668), the rock instability index increases to point (c). By maintaining the deviatoric stress, the rock instability index will develop to point (d) at a rate corresponding to Rd over 2 h. By again adding the deviatoric stress, the instability index increases by loading from point (d) to point (e), and the rock creep instability index evolves at a larger rate. From point (h) to point (i), the greater the load is, the greater the increment in the instability index due to loading, following a greater rate of evolution [points (i) to (j)]. When Rd is 0.851 at first, the initial loading instability index reaches point (k) and evolves to approximately 0.65 after 10 h of creep, which is consistent with the experiment. When the rock is subjected to a higher deviatoric stress, e.g., Rd = 0.948, the rock instability index increases along the initial loading instability index curve to point (l). The creep instability index evolves from point (l), along the dashed line, to point (m), where the rock enters the tertiary creep stage.
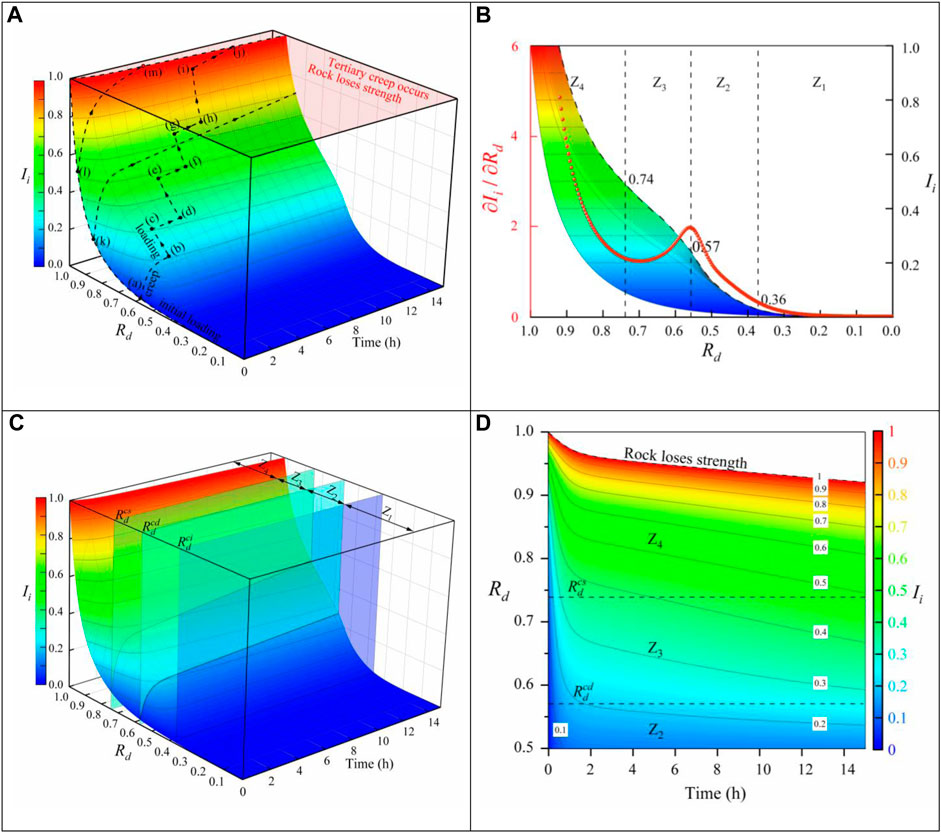
FIGURE 14. Instability index evolution surface.
Figure 14B shows a projection of the Ii surface that plots the Rd versus Ii curve to explore the influence of Rd on the evolution of the rock instability index. The slope of the instability index curve (∂Ii/∂Rd) shows that when Rd is less than 0.36, the evolution of the time-dependent instability index of the rock specimen is insignificant and can correspond to no creep in the rock; this part can be designated the long-term stability zone (Z1). When Rd is between 0.36 and 0.57, the slope of the rock instability index curve increases as Rd increases. This part, where the rock shows creep behaviours, is designated the time-dependent instability initial zone (Z2). When Rd is between 0.57 and 0.74, the slope of the rock instability index curve remains essentially constant. The rock instability index increases steadily with increasing Rd. This part is defined as the time-dependent instability stable evolution zone (Z3). Once Rd is greater than 0.74, the slope of the rock instability index curve increases rapidly with Rd. The rock is in a loading-sensitive state in which increasing the loading causes a significant increase in the rock creep and instability index evolution rate. This part is defined as the time-dependent instability sensitive zone (Z4).
Figure 14C illustrates the spatial division of the time-dependent instability index. According to previous studies (Mo et al., 2022), the mean values of the stress threshold of the micritic bioclastic limestone are initial crack stress σci=0.36 and crack damage stress σcd=0.57. Accordingly, Z1 and Z2 are divided at the point of initial crack stress σci (corresponding to Rcid), and Z2 and Z3 are divided by the crack damage stress σcd (corresponding to Rcdd). The stress threshold between Z3 and Z4 is defined as the creep-sensitive stress σcs (corresponding to Rcsd), above which the rock creep rate becomes significantly sensitive to loading. Figure 14D shows a top view of the instability index surface, expressing the evolution of Ii with time for a given Rd. The curve of the loss in rock strength exhibits non-linear properties. As time increases, Rd corresponding to the loss in rock strength decreases. That is, the rock stability time increases as Rd decreases. When Rd of the rock is 0.85, the instantaneous instability index due to loading is 0.2. As time passes, the rock instability index increases to 0.7 after 15 h.
In laboratory creep tests, when the loading is increased to a certain level, the brittle rock specimen fractures after a very short creep time or even breaks suddenly during the loading process. In underground power station projects, the surrounding rock often shows stability and integrity in the short term after excavation. However, the surrounding rock usually shows time-dependent failure, such as slabbing, wall spalling, rock burst and large creep deformation, especially in the case of high ground stress or stress-concentrated rock masses. As a result, the disaster prediction for underground engineering under specific stress conditions can be calculated via the energy instability evolution criterion presented in this paper.
Multistage creep experiments based on micritic bioclastic limestone were carried out. The crack strain characteristics and crack energy dissipation evolution of micritic bioclastic limestone were investigated. An instability index and evolution equation based on crack energy dissipation was proposed for predicting rock failure times. The conclusions are as follows:
(1) The crack energy dissipation density was obtained by integrating the deviatoric stress-crack strain curves of multilevel creep tests. New cracks grew in the loading stage, resulting in the deviation of the deviatoric stress-crack energy dissipation density curve from the horizontal direction. The crack energy dissipation in the first level was greater than that in the subsequent levels due to the initial crack closure. The energy leading to rock failure involved creep cracking and loading-induced new crack growth energy dissipation, which gradually increased with loading level and time.
(2) An instability index (Ii) based on the crack dissipation energy density was defined. Based on the superposition principle, the evolution of the energy dissipation density characterizing the single-stage creep of rocks was obtained. The time when the rock specimen lost strength (where tertiary creep occurs) in a specific bearing state (Rd) could be predicted.
(3) An instability index evolution equation was proposed describing the creep behaviour of rocks. The instability index surface was established as an energy instability evolution criterion that can be used to evaluate and predict the lifespan of rocks under specific stress states.
(4) The time-dependent instability index surface was divided spatially into four parts, the long-term stability zone (Z1), time-dependent instability initial zone (Z2), time-dependent instability stable evolution zone (Z3) and time-dependent instability sensitive zone (Z4). Z1 and Z2 were divided at the point of initial crack stress σci (corresponding to Rcid), and Z2 and Z3 were divided by the crack damage stress σcd (corresponding to Rcdd).
(5) The stress threshold σcs was defined as the creep-sensitive stress. Z3 and Z4 were divided by σcs (corresponding to Rcsd), above which the rock creep rate becomes significantly sensitive to loading.
Notably, the method proposed in this paper is applicable to only intact rocks with conventional compression creep. Further study is needed to consider parameters that describe both rock masses and joints or take into account the effects of seepage and temperature.
The original contributions presented in the study are included in the article/supplementary material, further inquiries can be directed to the corresponding author.
Conceptualization: JZ and EL. Data curation: ZM, LQ, TY, and YG. Formal analysis: ZM and LQ. Investigation: TY and YG. Methodology: RZ, EL, and ZM. Writing—original draft: ZM. Writing—review and editing: JZ.
The authors acknowledge the financial support from the National Natural Science Foundation of China (grant number U1965203).
The authors declare that the research was conducted in the absence of any commercial or financial relationships that could be construed as a potential conflict of interest.
All claims expressed in this article are solely those of the authors and do not necessarily represent those of their affiliated organizations, or those of the publisher, the editors and the reviewers. Any product that may be evaluated in this article, or claim that may be made by its manufacturer, is not guaranteed or endorsed by the publisher.
Bieniawski, Z. T. (1967). Mechanism of brittle fracture of rock. Int. J. Rock Mech. Min. Sci. Geomechanical Abstr. 4 (4), 407–423. doi:10.1016/0148-9062(67)90031-9
Eberhardt, E., Stead, D., Stimpson, B., and Read, R. S. (1998). Identifying crack initiation and propagation thresholds in brittle rock. Can. Geotech. J. 35 (2), 222–233. doi:10.1139/t97-091
Heping, X., Yang, J., and Liyun, L. (2005). Criteria for the strength and structural failure of rocks based on energy dissipation and energy release principles. Chin. J. Rock Mech. Eng. 24 (17), 3003–3010. doi:10.3321/j.issn:1000-6915.2005.17.001
Huang, X., Shi, C., Ruan, H., Zhang, Y., and Zhao, W. (2022). Stable crack propagation model of rock based on crack strain. Energies 15 (5), 1885. doi:10.3390/en15051885
Hussain, M., Pu, S., and Underwood, J. (1974). Strain energy release rate for a crack under combined Mode I and Mode II. Franture Anal. ASTM STP 560, 2–28.
Irwin, G. R. (1956). Analysis of stresses and strains near the end of a crack traversing a plate. J. Appl. Mech. 24 (24), 361–364. doi:10.1115/1.4011547
Li, X. Z., and Shao, Z. S. (2016). Micro–macro modeling of brittle creep and progressive failure subjected to compressive loading in rock. Environ. Earth Sci. 75 (7), 583. doi:10.1007/s12665-016-5365-3
Lixin, W., and Jinzhuang, W. (1998). Features of infrared thermal image and radiation. Sci. China. Ser. D, Earth Sci. 41 (2), 158–164. doi:10.1007/bf02932435
Luong, M. P. (1993). Infrared thermographic observations of rock failure. Oxford: Pergamon Press, 715–730.
Lyu, C., Liu, J., Ren, Y., Liang, C., and Liao, Y. (2021). Study on very long-term creep tests and nonlinear creep-damage constitutive model of salt rock. Int. J. Rock Mech. Min. 146, 104873. doi:10.1016/j.ijrmms.2021.104873
Martin, C. D. (1993). The strength of massive Lac du Bonnet granite around underground openings. Ph.D. thesis. Winnipeg, Man: Department of Civil and Geological Engineering, University of Manitoba.
Meng, Q., Zhang, M., Han, L., Pu, H., and Nie, T. (2016). Effects of acoustic emission and energy evolution of rock specimens under the uniaxial cyclic loading and unloading compression. Rock Mech. Rock Eng. 49 (10), 3873–3886. doi:10.1007/s00603-016-1077-y
Mo, Z., Qian, L., Yao, T., Gao, Y., Xue, F., Zhang, J., et al. (2022). Unified transient creep constitutive model based on the crack evolution of micritic bioclastic limestone. Plos One 17 (10), e0276100. doi:10.1371/journal.pone.0276100
Na, Z., Lixin, M., Laigui, W., and Yibin, Z. (2022). Numerical simulation of creep fracture evolution in fractured rock masses. Front. Earth Sci. 10, 901742. doi:10.3389/feart.2022.901742
Niu, Y., and Zhou, X. (2021). Forecast of time-of-instability in rocks under complex stress conditions using spatial precursory AE response rate. Int. J. Rock Mech. Min. 147, 104908. doi:10.1016/j.ijrmms.2021.104908
Sih, G. C. (2014). From monoscale to multiscale modeling of fatigue crack growth: Stress and energy density factor. Sci. China Phys. Mech. Astronomy 57 (1), 39–50. doi:10.1007/s11433-013-5366-0
Tan, T., and Kang, W. (1980). Locked in stresses, creep and dilatancy of rocks, and constitutive equations. Rock Mech. Felsmech. M. canique Des. Roches 13 (1), 5–22. doi:10.1007/BF01257895
Wu, L., Cui, C., Geng, N., and Wang, J. (2000). Remote sensing rock mechanics (RSRM) and associated experimental studies. Int. J. Rock Mech. Min. 37 (6), 879–88.doi:10.1016/S1365-1609(99)00066-0
Wu, L., Liu, S., Wu, Y., and Wang, C. (2006). Precursors for rock fracturing and failure—Part I: IRR image abnormalities. Int. J. Rock Mech. Min. 43 (3), 473–482. doi:10.1016/j.ijrmms.2005.09.002
Xie, H., Li, L., Ju, Y., Peng, R., and Yang, Y. (2011). Energy analysis for damage and catastrophic failure of rocks. Sci. China Technol. Sci. 54 (S1), 199–209. doi:10.1007/s11431-011-4639-y
Yang, S., Tang, J., Wang, S., Yang, D., and Zheng, W. (2022). An experimental and modeling investigation on creep mechanical behavior of granite under triaxial cyclic loading and unloading. Rock Mech. Rock Eng. 55 (9), 5577–5597. doi:10.1007/s00603-022-02920-w
Yu, Y., Wang, P., Zhang, S., and Liu, J. (2021). Experimental study of the creep disturbance effect and acoustic emission characteristics of mudstone with different moisture contents. Shock Vib. 2021, 1–8. doi:10.1155/2021/7941242
Zhang, J. Z., and Zhou, X. P. (2020). Forecasting catastrophic rupture in brittle rocks using precursory AE time series. J. Geophys. Res. Solid Earth 125 (8), e2019JB019276. doi:10.1029/2019JB019276
Zhao, J., Feng, X., Zhang, X., and Yang, C. (2019). Brittle and ductile creep behavior of Jinping marble under true triaxial stress. Eng. Geol. 258, 105157. doi:10.1016/j.enggeo.2019.105157
Zhao, Y., Wang, Y., Wang, W., Tang, L., Liu, Q., and Cheng, G. (2019). Modeling of rheological fracture behavior of rock cracks subjected to hydraulic pressure and far field stresses. Theor. Appl. Fract. Mec. 101, 59–66. doi:10.1016/j.tafmec.2019.01.026
Zhao, Y., Wang, Y., Wang, W., Wan, W., and Tang, J. (2017). Modeling of non-linear rheological behavior of hard rock using triaxial rheological experiment. Int. J. Rock Mech. Min. 93, 66–75. doi:10.1016/j.ijrmms.2017.01.004
Zhao, Y., Zhang, L., Wang, W., Wan, W., Li, S., Ma, W., et al. (2017). Creep behavior of intact and cracked limestone under multi-level loading and unloading cycles. Rock Mech. Rock Eng. 50 (6), 1409–1424. doi:10.1007/s00603-017-1187-1
Zhou, K., Liu, S., and Cheng, Y. (2022). Effect of rheological mesoparameters on shear mechanical behavior of joints. Geofluids 2022, 1–10. doi:10.1155/2022/3512507
Zhou, X. P. (2005). Localization of deformation and stress–strain relation for mesoscopic heterogeneous brittle rock materials under unloading. Theor. Appl. Fract. Mec. 44 (1), 27–43. doi:10.1016/j.tafmec.2005.05.003
Zhou, X. P. (2006). Triaxial compressive behavior of rock with mesoscopic heterogenous behavior: Strain energy density factor approach. Theor. Appl. Fract. Mec. 45 (1), 46–63. doi:10.1016/j.tafmec.2005.11.002
Zhou, X. P., and Yang, H. Q. (2018). Dynamic damage localization in crack-weakened rock mass: Strain energy density factor approach. Theor. Appl. Fract. Mec. 97, 289–302. doi:10.1016/j.tafmec.2017.05.006
Zhou, X. P., Zhang, Y. X., Ha, Q. L., and Zhu, K. S. (2008). Micromechanical modelling of the complete stress–strain relationship for crack weakened rock subjected to compressive loading. Rock Mech. Rock Eng. 41 (5), 747–769. doi:10.1007/s00603-007-0130-2
Keywords: micritic bioclastic limestone, crack strain, energy dissipation, rock instability prediction, creep-sensitive stress
Citation: Mo Z, Qian L, Yao T, Gao Y, Zhang R, Liu E and Zhang J (2023) Creep crack energy dissipation and instability prediction in micritic bioclastic limestone. Front. Earth Sci. 11:1138302. doi: 10.3389/feart.2023.1138302
Received: 05 January 2023; Accepted: 09 February 2023;
Published: 22 February 2023.
Edited by:
Dawei Fan, Institute of Geochemistry (CAS), ChinaReviewed by:
Yanlin Zhao, Hunan University of Science and Technology, ChinaCopyright © 2023 Mo, Qian, Yao, Gao, Zhang, Liu and Zhang. This is an open-access article distributed under the terms of the Creative Commons Attribution License (CC BY). The use, distribution or reproduction in other forums is permitted, provided the original author(s) and the copyright owner(s) are credited and that the original publication in this journal is cited, in accordance with accepted academic practice. No use, distribution or reproduction is permitted which does not comply with these terms.
*Correspondence: Jianhai Zhang, emhhbmdqaWFuaGFpQHNjdS5lZHUuY29t
Disclaimer: All claims expressed in this article are solely those of the authors and do not necessarily represent those of their affiliated organizations, or those of the publisher, the editors and the reviewers. Any product that may be evaluated in this article or claim that may be made by its manufacturer is not guaranteed or endorsed by the publisher.
Research integrity at Frontiers
Learn more about the work of our research integrity team to safeguard the quality of each article we publish.