 Junzhi Chen
 Mingqing Chen
- Faculty of Land and Resources, Kunming University of Science and Technology, Kunming, China
Slope reinforcement is a common method to solve the problem of slope instability, and reasonable optimization of the corresponding support parameters is crucial for practical engineering. In this paper, the slope support method of Manyanpo tunnel entrance section is taken as an example, and the theoretical calculation method is used to optimize the project cost. Combined with the orthogonal test, the sensitivity analysis of the influencing factors of the stability of the support system and the selection of the optimal parameter combination scheme are carried out. Then, based on flac3d software, the optimization scheme is compared with the original design scheme. The results show that the safety factor of the optimized scheme is increased from 1.32 to 1.43 compared with the actual project. The optimized support parameters have better control effect on the displacement of the slope, especially in the Z direction. The optimized parameters have better support effect. This study can provide reference for the optimization design of slope engineering support.
1 Introduction
The stability of rock slope is essential in the construction of housing, transportation links, water conservancy, and hydropower projects in mountainous areas (Zhao et al., 2022). Slope reinforcement is an important method to solve the problem of slope instability, and it is important to reasonably optimize the support parameters. In recent years, many researchers have done a lot of research on the optimization of slope support parameters and slope numerical modeling, and achieved fruitful results. Based on the limit equilibrium method and finite element method, Liao et al. (2021) optimized the reinforcement scheme of a reinforced high fill slope at an airport. Li et al. (2014) obtained the optimal design slope angle of fill slopes at different heights and the minimum expected cost of unit projects through analysis of the optimal design model. He and Lin (2010) discussed the influence of different bolt parameters on the stability of jointed slope based on FLAC3D software to realize optimization of slope anchorage. Lou and Zhou (2004) adjusted the support parameters, excavation depth, and support time of the slope in time; thus, effectively controlled the deformation of a slope in the construction process; and ensured the overall stability of a high soft rock slope based on monitoring of the horizontal displacement slope in the construction process. Li et al. (2018) considering the high cutting slope of the fast section of Yingbin West Road in Jiangmen City, Guangdong Province, proposed an optimization design of the key supporting parameters in the anchor cable support scheme and obtained numerical values for the optimal anchor cable length, anchorage length, and anchor cable inclination angle. In addition, the stability and deformation characteristics of the slope after the installation of anchor cables were numerically simulated and analyzed. Qin (2015) employed numerical simulation to conduct a stability analysis and realize optimization design of related parameters of a slope reinforced by prestressed anchor anti-slide pile using finite element analysis software ABAQUS. Yi et al. (2013) determined the optimal combination of anchorage length and anchorage spacing of a specific slope via numerical simulation. Nengpan et al. (2009), based on TangTun highway in southern Anhui mountainous area, introduced a set of operable highway high-slope optimization design research methods. Wang et al. (2011) proposed the response surface test design method and applied it to the parameter selection of anchorage protection structure. The influence of anchor cable support parameters on the stability coefficient was studied, and the quantitative relationship model between the stability coefficient and the influencing factors was established. The residual distribution of the stability coefficient, the stability coefficient contour map, and the response surface three-dimensional map between different operating variables were provided. The test conditions were optimized, and the optimal value scheme of each anchor cable support parameter was obtained. Wang et al. (2014) proposed the method of pre-support and layer-by-layer excavation in a reserved excavation area. Accordingly, the optimal horizontal angle of anchor cable pre-support under different angles between rock strike and slope strike was evaluated, the support calculation model considering the angle of strike was established, and the corresponding relationship was derived. An et al. 2020 conducted a three-dimensional optimization design of the anchor cable reinforcement direction angle of the wedge-shaped rock slope. Finally, they verified the effectiveness and advancement of the method through examples and engineering examples. Zhang (2021) analyzed the protective effect of four kinds of bolt arrangement in a red layer slope by Flac3d software, and finally obtained the best bolt arrangement scheme. Liu et al. (2022) carried out a numerical simulation of the excavation process of the right bank slope group of Lawa, and on this basis, combined with the actual situation of the site, an optimization scheme of anchor cable support was proposed. Li et al. (2021) studied the influence of bolt length, anchorage angle, bolt spacing and layout on slope stability for a bedding rock slope, and then proposed an anchorage optimization scheme through orthogonal test. Lin et al., (2013) used NURBS technology to carry out three-dimensional geological modeling of the study area, and carried out secondary development of VisualGeo modeling software, and finally realized the automatic subdivision and data extraction of three-dimensional slope. Based on GIS and numerical simulation software, Han et al. (2019) proposed a set of three-dimensional slope modeling and simulation calculation schemes with strong applicability and smooth operation.
In summary, most scholars mainly measure the advantages and disadvantages of the support scheme from the perspective of cost and slope stability. Few scholars measure the advantages and disadvantages of the support scheme from the change of the bending moment of the support material. The main innovation of this paper is to introduce the bending moment index as the evaluation index to measure the effect of slope support before and after optimization. At the same time, the original support scheme of the slope at the entrance of Manyanpo tunnel is optimized by orthogonal experiment, and then the numerical simulation of the support scheme before and after optimization is carried out based on FLAC3D software. Finally, the safety factor, displacement data and bending moment data before and after optimization are compared, thus comprehensively verifying the rationality of the optimization scheme. This study can provide a new idea and method for the selection of optimization schemes and the comparative study of support schemes before and after optimization, and provide a reference for the optimization of slope support engineering.
2 Project profile
The slope cover of a tunnel entrance in Yunnan is quaternary residual silty soil, which mainly comprises gneiss. The surface water system in the area is relatively developed and the rock is broken. A diagram of the slope protection is provided in Figure 1. The slope height is 24–56 m, and excavation is the main method. A bench is set every 8 m, and the width of each bench is 1 m, with a maximum of 7 grade slope. According to the local geological conditions and weathering degree of rock mass, the slope reinforcement method includes prestressed anchor cable frame beam support (the composite structure of the prestressed anchor cable and concrete frame beam can give full play to the anchoring effect of anchor cable and frame beam, which is widely used in slope reinforcement (Yao et al., 2006)), and the area is approximately 4,500 m2. Slope excavation slope is 1:0.75–1, prestressed anchor cable frame beam arrangement slope rate is consistent with the slope rate, frame beam classification arrangement. Table 1 presents specific settings.

FIGURE 1. Schematic diagram of slope protection.
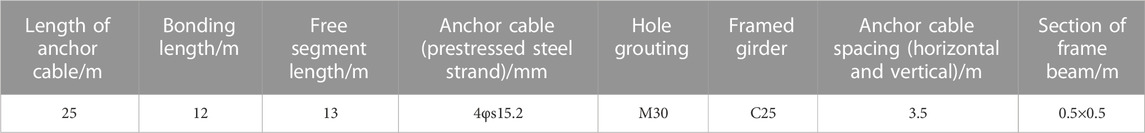
TABLE 1. Setting Information of prestressed anchor cable frame beam.
3 Calculation method of slope stability
In 1975, Zienkiewicz et al. (1975) first introduced the strength reduction method into the calculation of slope stability. In the development of slope engineering in recent years, with the development of the computer industry, the strength reduction method (Cai et al., 2015; Li et al., 2015; Li et al., 2017; Liu et al., 2017; Shi et al., 2019; Fang et al., 2020) is widely used in various projects, and has made great progress and breakthroughs. Compared with other analysis methods, this method has the following advantages: (Chen and Xu, 2013):
(1) The core idea of SRM is consistent with engineering practice.
(2) All the data of the internal force of soil and structure can be obtained.
(3) It is not necessary to presuppose the sliding surface, and automatically output the potential sliding surface.
(4) Simulating the progressive development of slope stability in the whole process of slope construction.
(5) It can simulate more complex formation conditions, and is not limited by slope shape, material properties, etc., and has wider applicability.
Therefore, this method was used to calculate the slope stability. The principle is to make the slope just reach the critical failure state. The safety factor is defined as the ratio of the actual shear strength of rock and soil mass to the reduced shear strength at critical failure (Chen and Xu, 2013). The calculation formula is as follows:
4 Numerical calculation model and parameter selection
4.1 Selection of parameters
4.1.1 Selection of mechanical parameters
The mechanical parameters of each rock and soil mass are listed in Table 2.
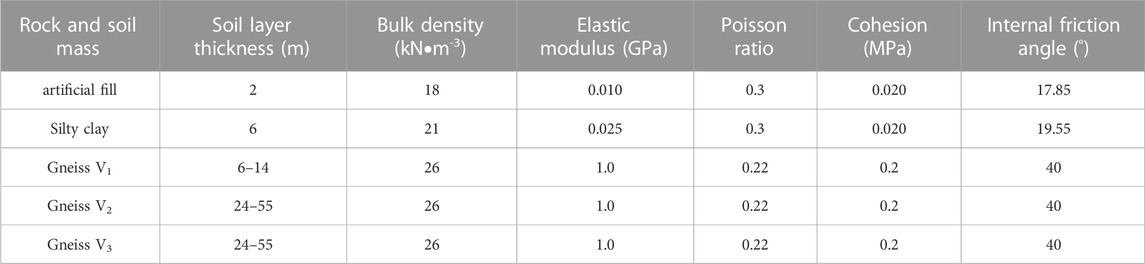
TABLE 2. Slope rock mass parameters.
4.1.2 Selection of anchor cable and frame beam parameters
Specific values of the calculation parameters for the anchor cable frame beam are provided in Tables 3, 4.
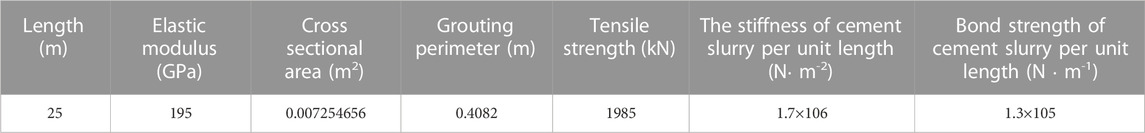
TABLE 3. Anchor parameters.

TABLE 4. Parameters of frame beams.
4.2 Numerical calculation model of slope
The model size is based on the actual slope size. According to the rock mass parameters of the slope in Table 2, the material properties of the slope were defined. Other parameters and anchor cable arrangement are displayed in Figures 2A–C. The Drucker Prager criterion (D-P criterion) was selected as the constitutive model. The upper boundary is set as free boundary, and the other boundaries are fixed.
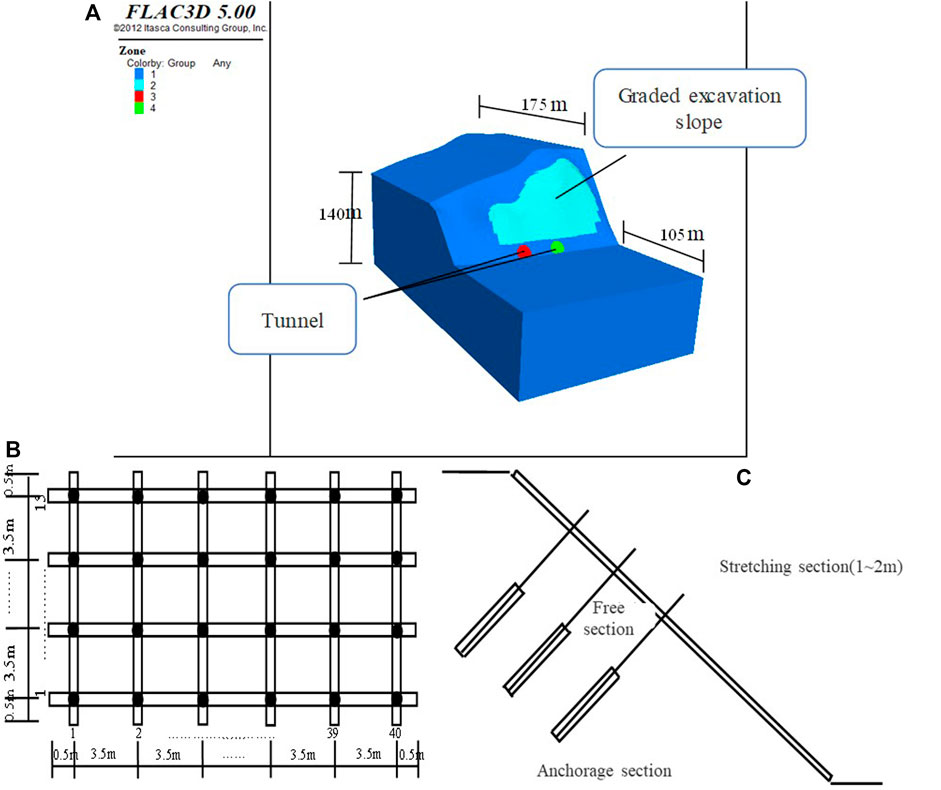
FIGURE 2. (A) Calculation of slope map; (B) Anchor cable and frame beam layout diagram; (C) Anchor cable layout.
4.3 Calculation scheme of slope grading excavation
The slope was constructed in the order of excavating the first level of protection, and the construction sequence of the next level of slope was repeated after the stability of the upper level of slope. The monitoring points were set up using FISH language in FLAC to analyze the state of anchor cable of frame beam during excavation. After the excavation of the slope, the intersection point of the anchor cable frame beam in the left, middle and right positions of each grade slope were considered as the monitoring points, resulting in the total of 21 monitoring points. A schematic of the layout of the sixth and seventh step monitoring points is presented in Figure 3. The arrangement of the monitoring points below is consistent with the arrangement of the sixth and seventh steps.
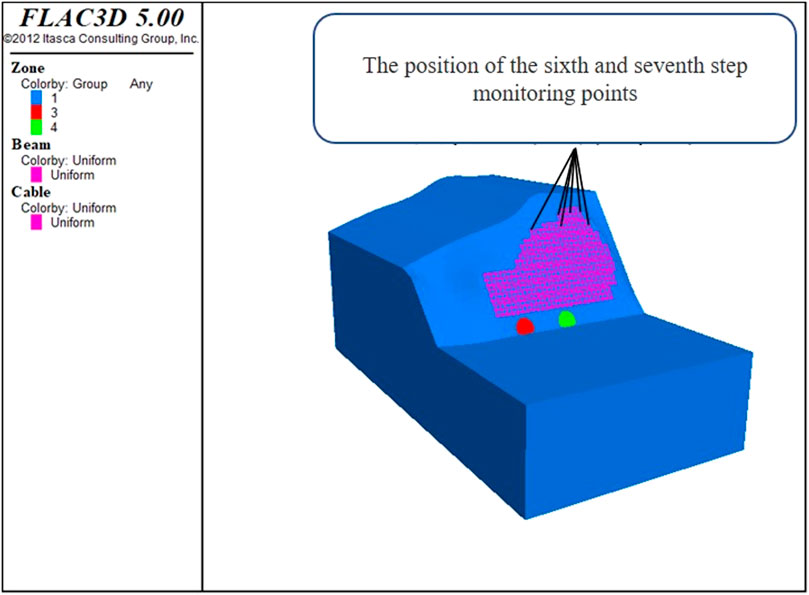
FIGURE 3. Layout schematics of monitoring points for sixth and seventh steps.
5 Parameter setting and optimization of prestressed anchor cable (Xue, 2016)
5.1 Optimization of anchorage force and anchorage angle
Various setting parameters of prestressed anchor cable frame beams exist, therefore, it is difficult to conduct a comprehensive analysis. Several research results (Zhang, 2011; Chen, 2015; Pan, 2017) demonstrate that anchoring force, anchorage angle, and anchorage spacing are the main setting parameters; and based on these, other parameter values are calculated. Therefore, this study considers these three factors as the research objects for calculation and optimization.
The anchoring force is determined by the sliding force of the slope, as shown in Figure 4. Assuming that the sliding force is f, then:
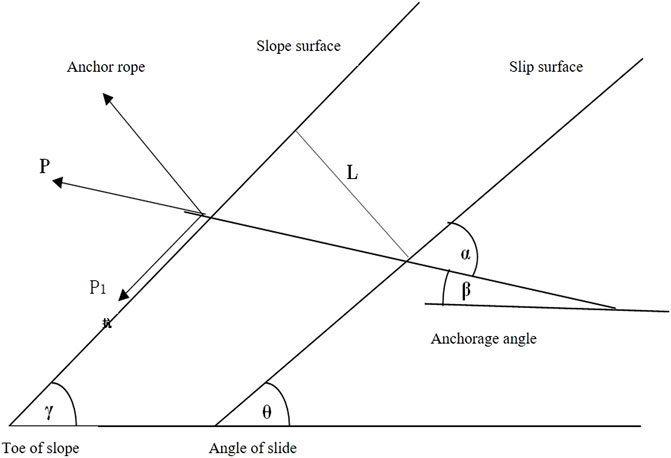
FIGURE 4. The stress diagram of slope.
P1—Anti-sliding force, in equilibrium, the value is equal to the sliding force F (kN); P—Anchoring force (kN); θ—Angle of slide (°); β—Anchorage angle (°); φ—Angle of internal friction (°); N1—Interval of anchors (m); N2—Number of anchor cables; When the slope angle is 53°, the anti-sliding force of the slope calculated via Lizheng software is 6,762 kN, and the prestress design value of a single anchor cable is 718 kN, from Formula 4.
As shown in Figure 4:
The purpose of the design value of the anchorage angle is to provide the maximum anti-sliding force, and the extreme value of Formula 5 above can be obtained. Let ∂P/∂β = 0, then:
According to the limit equilibrium theory of earth pressure, the following can be determined: θ∈(45°-φ/2,45°+φ/2) The anchorage angle can be determined as: β=15–35°. To save construction costs, the anchor cable can be re-optimized. The anchoring force determines the length of the anchorage section. The value of the tension section is generally 0.5–1 m, so the length of the free section can be adjusted, If the anchor cable can bear a large anti sliding force in a short length, the anchor cable has the best effect. Assuming that the vertical distance from the sliding surface to the slope is l, the length of the free section of the anchor cable is:
L1—Length of free end of anchor cable (m); L—Vertical distance from sliding surface to slope (m); γ—Slope angle (°);
5.2 Optimization of anchorage spacing
According to the elastic foundation model, the spacing of the frame beam should satisfy L < π/2λ (λ = 0.3–0.5), where λ is the elastic characteristic of beam, then the value of beam is 3–5 m. If the economic cost is considered, the cost of material lengths of 3, 4, and 5 m can be compared. Assuming that there is a square slope of 22 m × 22 m, the number of anchor cables required for the frame beam from large to small is 7, 5, 4. According to Formula 10 ∼ 12, the required steel strands are 3, 4, and 6, and the required anchorage lengths are 7, 13, 19.5 m. The material cost of a 15.24-mm steel strand is 6,737 yuan per ton, cement mortar is 573 yuan per ton, and frame beam concrete is 527 yuan per cubic meter. If the price of frame beam concrete is K, the mortar is 2.5K, and the steel strand is 31.2 K. The corresponding calculation results are shown in Table 5.
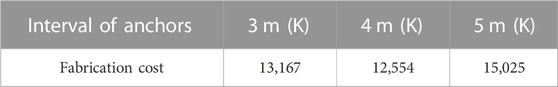
TABLE 5. Cost table of different anchor cable spacing.
AS—Rod area (m2); N—Axial tension value of single anchor cable (kN); f—Standard tensile strength of steel strand (MPa);
d—Diameter of steel strand (mm); D—Anchorage body diameter (mm); n—Number of strands;
τa—Bond strength between mortar and steel strand (KPa); K—Factor of safety, Take 1.8; It can be observed from the table that the cost is the smallest when the anchor cable spacing is 4 m, and the frame beam meets the design requirements. It is not excluded that there is a small value between the anchor cables of 3–4 m. Therefore, it is better to optimize the anchor cable spacing in 3–4 m.
6 Selection of parameter optimization scheme based on orthogonal experiment
Based on the above calculations and optimizations, the anchor force is 460 kN, the anchor angle is 20–27°, and the anchor cable spacing is 3–4 m. The prestress value applied to each anchor cable in the No. One tunnel of the slope is 460 kN, and the calculated anchorage force is 718 kN. Therefore, 400–800 kN is considered in the prestress level value, and the specific scheme is introduced in detail in the following contents.
6.1 Design of orthogonal test
An orthogonal experiment (Zhuang and He, 2006; Zhong et al., 2015; Chai, 2017; Yang et al., 2017; Liu et al., 2021; Peng et al., 2021) is a combination of various factors and horizontal numerical permutations to form multiple schemes. The permutation and combination can be a comprehensive test or a few special representative combinations. The calculation is basically unbiased. The optimal scheme of various schemes is obtained via probability calculation. Its advantage is that it can reduce the number of tests while ensuring the reliability of test results through orthogonal design for the tests with long test cycle, high test cost and difficult test.
This experiment involves three factors and three levels; the levels of experimental parameters are shown in Table 6.
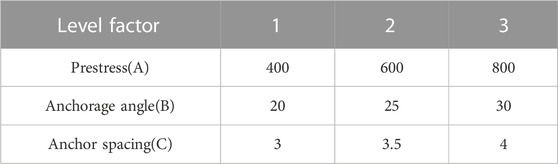
TABLE 6. Factor level table.
Considering the overall safety factor of the slope after tunnel excavation as the standard to measure the slope stability, the solution process was as detailed in Table 7.
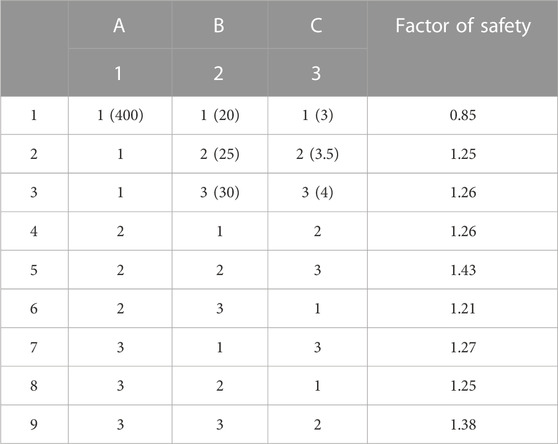
TABLE 7. Test scheme Table.
6.2 Analysis of test results
The data in Tables 8, 9 were obtained according to the standard calculation method of an orthogonal table in the orthogonal experiment. It can be observed from the values of S2j and F that among the factors in the test, the influence degree of the factor is C > A = B. By comparing the above Kji values, K13 > K12 > K11 in factor A, K22 > K21 > K23 in factor B, and K33 > K32 > K31 in factor C, it is concluded that under such mountain conditions, the optimal scheme is prestressed at 600 kN, anchor cable spaced at 4 m, and maintained at an anchorage angle of 20°.
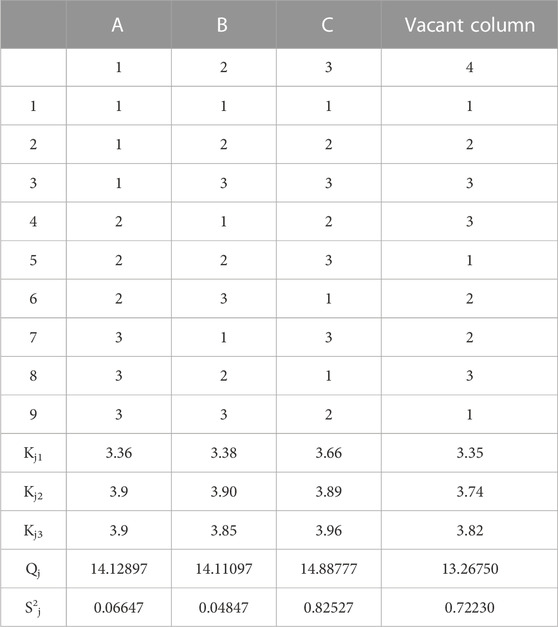
TABLE 8. Calculation Table.
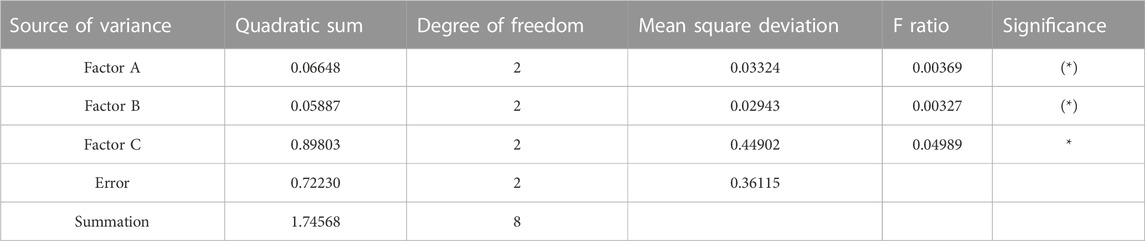
TABLE 9. Analysis of variance table.
7 Results and discussion
The numerical simulation of the slope before and after the optimization of the support parameters is carried out, and the numerical simulation results are compared. The comparison includes three aspects, safety factor, displacement and frame beam bending moment.
7.1 Comparison of safety factors
The safety factor of slope is an important parameter to evaluate the safety of slope (Azadi et al., 2022; Nanehkaran et al., 2022; Nanehkaran et al., 2023). The safety factor of the slope before the optimization of the support parameters is 1.32, and the safety factor of the slope after the optimization of the support parameters is 1.43, which is 8.3% higher than that before the optimization of the support parameters. It greatly improves the stability of the slope.
7.2 Comparison of monitoring points increment on slope
Figures 5A–C present comparison charts of X, Y, Z-direction displacement curves before and after optimization. According to the data curves of the left, middle, and right monitoring points in Figures 5A–C, it can be observed that the general trend of the displacement-excavation times curves in the X, Y, and Z directions before and after the optimization is basically the same, however, the fluctuation of the optimized displacement-excavation times curve is smaller, indicating that the optimized supporting parameters indicate better control effect on the deformation of the slope in the X, Y, and Z directions. At the same time, the maximum displacement of the slope in the three directions of X, Y and Z after optimizing the parameters is 0.00027, 0.00047, and 0.00058 m respectively, which is about 30% of the maximum displacement increment of the monitoring points in each direction. This shows that the parameter optimization effect is better.
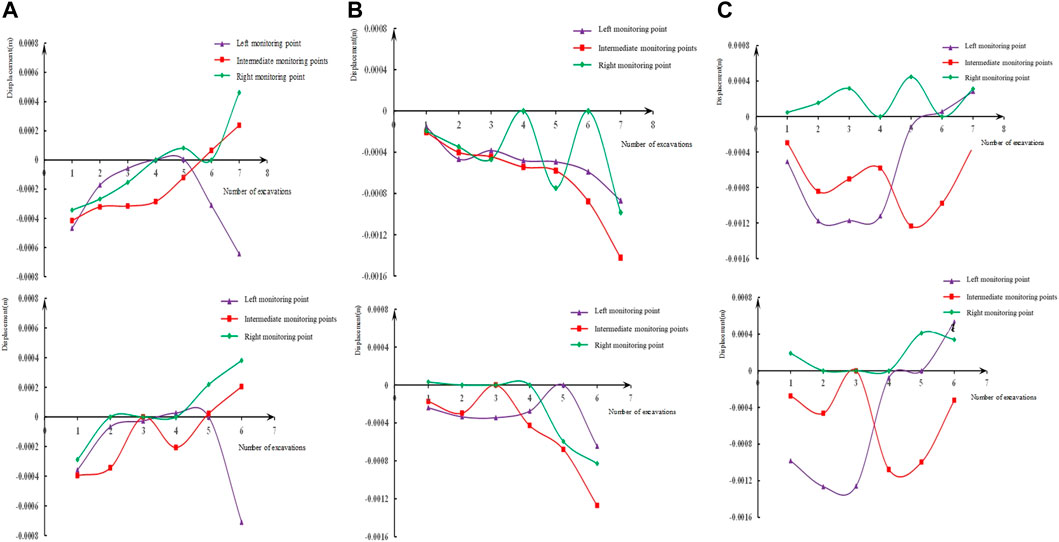
FIGURE 5. (A) X-direction displacement map before and after optimization; (B) Y-direction displacement map before and after optimization; (C) Z-direction displacement map before and after optimization (The first line of pictures is before optimization, and the second line of pictures is after optimization.)
According to the comparative analysis of displacement in three directions, the optimized supporting parameters have better control effect on slope displacement, particularly on the displacement in the Z direction, which can effectively prevent the occurrence of landslide disasters.
7.3 Comparison of bending moments of frame beams
The bending moment data of the middle frame beams of some slopes were considered, as shown in Figures 6A–C. By comparing and analyzing the bending moment diagrams before and after optimization, the following results were obtained.
(1) Compared with the bending moment data of the cross beam of the middle frame beam of the slope before optimization, the bending moment fluctuation after optimization is relatively stable, and the bending moment values of most beams are maintained at a low level, and fluctuate greatly, indicating that the optimized supporting parameters demonstrate a good control effect on the slope deformation.
(2) After optimization, the maximum bending moment of the cross beam of the middle frame beam at all levels of the slope is approximately 7.5 × 10⁵ kN M, while the maximum value before optimization is approximately 4.2 × 10⁴ kN M, which is tens of times higher than that before optimization, indicating that the optimized bending moment beam exhibits better material properties and improved supporting effect.
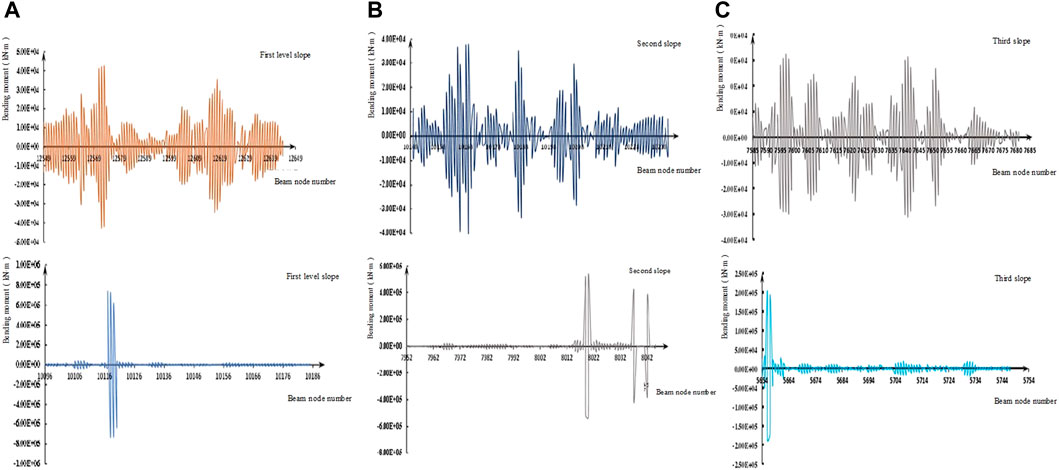
FIGURE 6. (A) Bending Moment Diagram of Frame Beam of the First Slope before and after Structural Parameter Optimization; (B) Bending Moment Diagram of Frame Beam of the Second Slope before and after Structural Parameter Optimization; (C) Bending Moment Diagram of Frame Beam of the Third Slope before and after Structural Parameter Optimization (The first line of pictures is before optimization, and the second line of pictures is after optimization.)
7.4 Discussion
When evaluating the optimized support effect, most scholars use the safety factor and displacement cloud map as the standard to evaluate the optimization effect. However, this evaluation standard is not comprehensive, and it cannot reveal whether the support material fully exerts its material characteristics, which may cause excessive waste of materials. In this study, a series of monitoring points were set up through the preparation of fish language, and finally the change curve of the bending moment value of the frame beam at each monitoring point during the operation of the support system was obtained. The curve can clearly show the stress of the frame beam, and it is easier to judge whether the frame beam fully exerts its material characteristics, thereby reducing the excessive surplus of materials, which has a great help to control the cost of slope support. However, in the face of large-scale slope support projects, this method needs to design more monitoring points to monitor the stress of frame beams, which will increase the workload. Therefore, it is necessary to further study which parts of the monitoring point data are more important, thereby reducing the layout of monitoring points to reduce the workload.
8 Conclusion
In this paper, the original support parameters of the slope at the entrance of the Manyanpo tunnel are optimized, and the slope before and after the optimization of the support parameters is numerically simulated. Then the results of the numerical simulation are analyzed and compared. Finally, the following conclusions are drawn.
(1) The optimized support parameter combination is: prestress is 600 kN, anchorage angle is 20°, and anchor cable spacing is 4 m. The order of the influence degree of these parameters on the stability of the support system from large to small is prestress, anchoring angle and anchor cable spacing.
(2) The slope safety factor after optimizing the support parameters is 8.3% higher than that before optimization, which improves the stability of the slope. The optimized support parameters have better control effect on the displacement of slope in X, Y, and Z directions, especially in Z direction.
(3) The maximum bending moment value of the frame beam after parameter optimization is tens of times of the maximum bending moment value of the frame beam before optimization, which indicates that the optimized bending moment beam can exert better material properties while ensuring slope stability.
Data availability statement
The original contributions presented in the study are included in the article/Supplementary Material, further inquiries can be directed to the corresponding author.
Author contributions
Conceptualization: JC, MC, CR, and JS methodology: JC, MC, CR, and JS writing—original draft preparation: MC and JS writing—review and editing: JC and CR.
Conflict of interest
The authors declare that the research was conducted in the absence of any commercial or financial relationships that could be construed as a potential conflict of interest.
Publisher’s note
All claims expressed in this article are solely those of the authors and do not necessarily represent those of their affiliated organizations, or those of the publisher, the editors and the reviewers. Any product that may be evaluated in this article, or claim that may be made by its manufacturer, is not guaranteed or endorsed by the publisher.
References
An, C., Ye, L., Wang, L., Deng, S., Sun, P., Fan, B., et al. (2020). Three-dimensional optimization design of anchor cable reinforcement direction angle of rock slope wedge [J]. Geotech. Mech. 41 (08), 2765–2772.
Azadi, A., Esmatkhah Irani, A., Azarafza, M., Hajialilue Bonab, M., Sarand, F. B., and Derakhshani, R. (2022). Coupled numerical and analytical stability analysis charts for an earth-fill dam under rapid drawdown conditions. Appl. Sci. 12 (9), 4550. doi:10.3390/app12094550
Cai, D., Wu, C., Chen, F., Yao, J., and Ye, Y. (2015). Stability analysis of subgrade slope of heavy haul trains on existing lines [J]. J. Civ. Eng. 48 (S2), 252–256.
Chen, K. (2015). Optimum design of slope support based on strength reduction and orthogonal test[J]. Fujian Build. (04), 66–69. + 109.
Chen, Y., and Xu, D. (2013). FLAC/FLAC3D foundation and engineering examples. 2nd edition. Beijing: China Water Conservancy and Hydropower Press, 265–275.
Fang, W., Wang, R., and Du, Z. (2020). Multi-field coupling strength reduction method for RCC gravity dam on deep overburden [J]. J. Appl. Basic Eng. Sci. 28 (01), 40–49.
Han, T., Lin, B., and Lu, H. (2019). Three-dimensional slope modeling method and its stability based on GIS and numerical simulation software coupling [J]. Geotech. Mech. 40 (07), 2855–2865.
He, Z., and Lin, H. (2010). Impact analysis of bolt support on slope stability of jointed rock mass [ J ]. Highw. traffic Technol. 27177 (11), 8–12. + 19.
Li, H., Tan, H., Yuan, W., Huang, Q., Han, Z., Wang, H., et al. (2021). Optimization of bolt anchorage parameters considering lateral restraint [J]. Sci. Technol. Eng. 21 (18), 7731–7738.
Li, J., Geng, W., and Pan, J. (2018). Stability analysis and support parameter optimization design of high cutting slope[J]. Chin. foreign Highw. 38 (05), 31–34.
Li, J., Junling, S., Zhong, H., and Zhao, R. (2017). Study on stability of surrounding rock of double-hole long-span tunnel based on strength reduction method [J]. J. Civ. Eng. 50 (S2), 198–202.
Li, X., Yang, S., Zhang, Y., and Miao, C. (2015). Study on the safety and stability of subsea tunnels under hydrostatic pressure [ J ]. J. Water Conservancy 46 (S1), 101–106.
Li, Y., Tang, Z., and Liu, Z. (2014). Optimal design model of filling slope in construction site based on expected cost [J]. Hydrogeol. Eng. Geol. 41256 (02), 79–84. + 110.
Liao, H., Xu, C., and Yang, Y. (2021). Optimization design of geogrid reinforced high slope in an airport flight area [J]. Hydrogeol. Eng. Geol. 48302 (06), 113–121. doi:10.16030/j.cnki.issn.1000-3665.202012015
Lin, D., Li, M., and Tong, D. (2013). Three-dimensional geological modeling and stability analysis and application of spillway excavation slope [J]. Rock Mech. Eng. J. 32 (S2), 3878–3887.
Liu, D., Wang, Q., Wei, W., and Jiang, Q. (2022). Three-dimensional numerical analysis and support scheme optimization of excavation of right bank slope group of Lawa hydropower station [J]. Hydropower Energy Sci. 40 (03), 153–157.
Liu, H., Zuo, J., Liu, D., Li, C., Xu, F., and Lei, B. (2021). Optimization of roadway bolt support based on orthogonal matrix analysis [ J ]. J. Min. Saf. Eng. 38 (01), 84–93.
Liu, L., Liang, S., Jiao, Y., Wang, H., Zhang, X., and Xie, B. (2017). Study on the stability of 1 ∼ # landslide accumulation body near the river on loess slope under reservoir water level fluctuation [J]. Geotech. Mech. 38 (S1), 359–366.
Lou, G., and Zhou, D. (2004). Monitoring and design optimization of soil-nailing support for high weak rock slope[j]. Chin. J. Rock Mech. Eng. 23 (16), 2734–2738.
Nanehkaran, Y. A., Licai, Z., Chengyong, J., Chen, J., Anwar, S., Azarafza, M., et al. (2023). Comparative analysis for slope stability by using machine learning methods. Appl. Sci. 13 (3), 1555. doi:10.3390/app13031555
Nanehkaran, Y. A., Pusatli, T., Chengyong, J., Chen, J., Cemiloglu, A., Azarafza, M., et al. (2022). Application of machine learning techniques for the estimation of the safety factor in slope stability analysis. Water 14 (22), 3743. doi:10.3390/w14223743
Nengpan, J., Zhao, J., and Deng, H. (2009). Stability evaluation and support optimization design of highway high slope[J]. J. Rock Mech. Eng. 28 (06), 1152–1161.
Pan, T. (2017). Prestressed anchor frame slope support design parameter optimization analysis[J]. Low. carbon world (10), 95–97.
Peng, P,, Zhang, D., and Sun, Z. (2021). Design method of surrounding rock deformation characteristics and reinforcement parameters of tunnel with weak interlayer [J]. Rock Mech. Eng. 40 (11), 2260–2272.
Qin, X. (2015). Prestressed anchor anti-slide pile reinforcement slope optimization design research[D]. Beijing): China University of Geosciences.
Shi, L., Ni, D., Yan, Z., Chen, J., and Hu, M. (2019). Study on the strength reduction method for the safety factor of anti-uplift stability of bias foundation pit in soft soil area [J]. J. Geotechnical Eng. 41 (S1), 13–16.
Wang, Y., Wei, X. Z., and Shao, L. F. (2011). Response surface optimization design for cutting slope anchoring parameter[J]. Journal of Yangtze River Scientific Research Institute.
Wang, Z., Xia, Y., and Xiong, Z. (2014). Study on pre-supporting excavation of bedding rock slope and anchor optimization design[J]. Chin. J. Undergr. Space Eng.
Xue, G. (2016). Design scheme and optimization analysis of landslide control in a project [J]. Shanxi Traffic Sci. Technol. (02), 10–12. + 26.
Yang, N., Li, W., and Xuan, C. (2017). FLAC3D can break the improvement of bolt unit and the application of deep coal roadway [J]. J. Min. Saf. Eng. 34 (02), 251–258. doi:10.13545/j.cnki.jmse.2017.02.008
Yao, L., Zhou, D., and Zhao, G. (2006). Prestressed anchor frame beam supporting structure design[J]. Rock Mech. Eng. (02), 318–322.
Yi, G., Tong, L., and Zhang, X. (2013). Optimum design of slope excavation support for Zhuziba yard[J. ]. Civ. Environ. Eng. 35 (S2), 12–17.
Zhang, L. (2011). Application of bolt parameter optimization in excavation slope reinforcement[J]. Resource environment and engineering, 248–251.
Zhang, Y. (2021). Optimization design of anchorage parameters for dip red bed slope [J]. Railw. Build. 61 (02), 67–70.
Zhao, M., Liu, J., and Zhao, H. (2022). Stability analysis of rock slope based on MSDP criterion[J/OL]. J. Rock Mech. Eng. 1 (9).
Zhong, Z., Li, X., Yao, Q., Ju, M., and Li, D. (2015). Based on orthogonal test of coal rock interbedded roof roadway instability factors [ J ]. J. China Univ. Min. Technol. 44 (02), 220–226.
Zhuang, C., and He, C. (2006). Application of mathematical statistics[M]. Guangzhou: South China University of Technology Press.
Keywords: slope support optimization, orthogonal test, bending moment of frame beam, FLAC3D, support parameter calculation
Citation: Chen J, Chen M, Ren C and Song J (2023) Calculation and optimization of slope reinforcement at tunnel entrances—taking manyanpo tunnel as an example. Front. Earth Sci. 11:1138018. doi: 10.3389/feart.2023.1138018
Received: 05 January 2023; Accepted: 15 February 2023;
Published: 01 March 2023.
Edited by:
Wenzhuo Cao, Imperial College London, United KingdomReviewed by:
Jingbo Zhao, China Jingye Engineering Technology Co., Ltd., ChinaWang Liang, Zi Jin (changsha) Engineering Technology Co., Ltd., China
Reza Derakhshani, Utrecht University, Netherlands
Copyright © 2023 Chen, Chen, Ren and Song. This is an open-access article distributed under the terms of the Creative Commons Attribution License (CC BY). The use, distribution or reproduction in other forums is permitted, provided the original author(s) and the copyright owner(s) are credited and that the original publication in this journal is cited, in accordance with accepted academic practice. No use, distribution or reproduction is permitted which does not comply with these terms.
*Correspondence: Chunfang Ren, NDc4ODMyODU3QHFxLmNvbQ==