 Ji-Myong Kim
 Junseo Bae
 Manik Das Adhikari
 Sang-Guk Yum
- 1Department of Architectural Engineering, Mokpo National University, Mokpo, Republic of Korea
- 2Division of Smart Cities, Korea University, Sejong, Republic of Korea
- 3Department of Civil Engineering, Gangneung-Wonju National University, Gangneung, Republic of Korea
The goal of this study is to suggest an approach to predict building loss due to typhoons using a deep learning algorithm. Due to the influence of climate change, the frequency and severity of typhoons gradually increase and cause exponential destruction of building. Therefore, related industries and the government are focusing their efforts on research and model development to quantify precisely the damage caused by typhoons. However, advancement in the accuracy of prediction is still needed, and the introduction of new technology, obtained due to the fourth revolution, is necessary. Therefore, this study proposed a framework for developing a model based on a deep neural network (DNN) algorithm for predicting losses to buildings caused by typhoons. The developed DNN model was tested and verified by calculating mean absolute error (MAE), root mean square error (RMSE) and coefficient of determination (R2). In addition, to further verify the robustness of the model, the applicability of the framework proposed in this study was verified through comparative verification with the conventional multi-regression model. The results and framework of this study will contribute to the present understanding by suggesting a deep learning method to predict the loss of buildings due to typhoons. It will also provide management strategies to related workers such as insurance companies and facility managers.
1 Introduction
Extreme weather events called tropical cyclones, floods, heat waves, droughts, heavy rains, and cold waves have been a part of human history since the very beginning. However, the occurrence pattern of recent extreme weather events changes, the severity and frequency of it have augmented rapidly compared to the past, increasing the possibility of human casualties as well as the loss of buildings and facilities (Kim et al., 2019; Kim et al., 2020a). The fifth Assessment Report (2014) of the Intergovernmental Panel on Climate Change warns of the negative effects of rising global mean air temperature, extreme rainfall, acidification and average sea level rise. Moreover, these phenomena are expected to accelerate in the future (IPCC, 2014).
The result of an analysis of the frequency and intensity of typhoons that invaded Korea from 1973 to 2019 showed that the severity of typhoons amplified and the risk of losses due to them enlarged (Kim et al., 2020a). Furthermore, instrumental data collected since 1904 indicates a rise in typhoon intensity on the Korean peninsula over the past century. From 1959 to 2019, the coastal region experienced an average of three typhoons per year, totaling 188 typhoons during that period. Among these, noteworthy typhoons like Rusa (2002), Maemi (2003), Nari (2007), and Soulik (2018) inflicted significant damage to lives and properties (Yum et al., 2023). In addition, substantial losses due to windstorms are occurring worldwide. A representative example is Hurricane Katrina, which struck the southeastern United States as a Category 5 tropical cyclone in 2005. Hurricane Katrina attacked cities along the Gulf Coast of the United States with strong winds and heavy rain, causing direct and indirect damage of $180 billion, becoming the largest amount of damage caused by a natural disaster in the US history (Blake et al., 2011). Also, in 2017, three hurricanes (Hurricane Harvey, Hurricane Maria, and Hurricane Irma) occurred in a row, causing a total of approximately $293 billion in critical damage. Hurricane Harvey was the largest, with $125 billion, followed by Hurricane Maria, with $90 billion and Hurricane Irma, with $77.6 billion (USNHC, 2018). Typhoon Haiyan occurred in 2013 in Asia. It was classified as a grade 5 typhoon and was also called a super typhoon. The typhoon attacked the Micronea region, the Philippines, Vietnam, and China one after another, causing damages estimated at $300 billion. The extreme weather event was recorded as showing the highest wind speed upon land landing among tropical cyclones that occurred worldwide and caused severe human casualties and property damage with strong winds and heavy rain (Kim et al., 2017). In Europe, three extratropical cyclones (Cyclone Anatol, Cyclone Lothar, and Cyclone Martin) hit Western European countries in succession in 1999. Damages in Germany, Switzerland and France amounted to 13 billion euros (Ulbrich et al., 2001). Therefore, with a high population density and critical infrastructure along the coastal region, accurately assessing the potential losses caused by typhoons is crucial for disaster preparedness, risk management, and infrastructure resilience.
As proved above, natural disasters worldwide cause tremendous property loss, which will increase with time. Two contributing factors are expected escalation of the severity and frequency of extreme weather events and surge in the value of citizens’ property and in the development of cities (Kim et al., 2020a). In order to decrease the risk of financial loss due to natural disasters, the government and the private sector invest enormous budgets and time to establish prevention and recovery strategies. Therefore, with the aim of efficiently use limited time and budget to minimalize financial losses, it is essential to accurately predict the damage caused by natural disasters.
1.1 Quantification model for natural disasters
Catastrophic models for natural disaster risk assessment have been developed in the public sector at a national level as the demand for quantification of the financial losses due to natural disasters has increased. Among the others, the new Multi-Risk and Multi-Risk Assessment Method (MATRIX) in Europe, the Central American Probability Risk Assessment (CAPRA) in South America, the Florida Public Hurricane Loss Model (FPHLM) in Florida, United States, The RiskScape in New Zealand and the US Federal Emergency Management Agency (FEMA) Hazus Multi-Hazard (MH) are demonstrative examples. Mentioned catastrophic models simulate, evaluate, and quantify direct and indirect losses caused by natural disasters such as earthquakes, floods, and windstorms that occur at the national or regional level. The models are seen as essential means to improve formulating responses and mitigation strategies. Thus, efforts are being made for constant development and advancement (Kim et al., 2016). However, the aforementioned models are ineffective when applied to other countries and regions since they are based on specific data such as the vulnerability of buildings, topography, and disaster patterns for the relevant country or region. In the private sector, vendors such as RMS (Risk Management Solution), Risk Frontiers, EQECAT, and AIR (Applied Insurance Research) develop and provide their own models for each natural disaster (Sanders et al., 2002; Kunreuther et al., 2004). The vendors’ models are widely used by insurers and reinsurers around the world as vital tools for cumulative risk management, insurance underwriting, as well as holding and establishing business strategies through the risk assessment of loss due to natural disasters. Nonetheless, the models’ usefulness is limited to the respective countries, and the evaluation for other regions is not possible.
Furthermore, the presence of financial constraints lessens the chances for small and medium-sized companies to introduce and use catastrophic models, as they must pay high annual fees. Additionally, since the black box module of the models determines the natural disaster loss evaluation, verifying whether the loss calculation result is appropriate appears problematic. Moreover, although the above models may be referential for the market, the plan of their comparison is required because each company’s portfolios, risk appetite, and capital are different. Therefore, an in-house model, which considers the vulnerability and exposure of the country or the region, other than the commercialized models, is required to evaluate the risk of natural disasters of a country or a company.
1.2 Literature reviews
As mentioned above, there is a strong possibility that the amount of loss from natural disasters and the frequency and severity of natural disasters will increase. Naturally, a more sophisticated and refined in-house loss prediction model that reflects the complexity and uncertainty of natural disaster damage as well as the circumstances and characteristics of each user is required. Recently, the fourth revolution technology, consisting of Internet of Things, artificial intelligence, robots, unmanned transportation, and big data, has been introduced to a wide range of industries, and its effectiveness has been recognized (Gledson and Greenwood, 2017). Thus, a natural disaster loss assessment model using a deep learning algorithm, which can be widely used for analysis and prediction, appears to be a suitable solution (Kim et al., 2020a). The demand for deep learning algorithms burgeons progressively as they can adapt and respond quickly and precisely to changes in the environment owing to constructing and integrating big data easier (Kim et al., 2021a; Guha et al., 2022). In the past, various studies have been conducted aiming to develop and advance natural disaster risk assessment models using various deep learning algorithms (Kim et al., 2020b; Khosravi et al., 2020; Shane Crawford et al., 2020; Yi and Zhang, 2020; Kim et al., 2021a; Al Najar et al., 2021; Moishin et al., 2021; Berezina and Liu, 2022; Kaur et al., 2022; Klepac et al., 2022; Irwansyah et al., 2023). For example, deep learning technology was applied for the detection of damages after natural disasters such as tornadoes and landslides (Shane Crawford et al., 2020; Yi and Zhang, 2020; Al Najar et al., 2021; Haggag et al., 2021). Similar techniques were applied to analyze changes in coastal areas after natural disasters such as windstorms. In the described study, the depth of the sea was precisely estimated by simulating remote sensing images through deep learning (AI Najar et al., 2021). Yi et al. (2020) predicted the risk of landslides due to earthquakes by analyzing satellite images using the Convolutional Neural Network (CNN) technique (Yi and Zhang, 2020). Kim et al. (2020b) use a deep learning algorithm to assess the loss before and after an earthquake at a regional scale. Ren et al. (2022) used a deep-learning technique to predict typhoon tracks accurately. In addition, when tornados occur, the wind speed is estimated through the analysis of the satellite image data on trees using the CNN method, and damage to buildings is classified (Shane Crawford et al., 2020). Kaur et al. (2022) analyzed satellite images based on the convolutional neural network to detect the damages induced by severe hurricanes. Another previous study adopted deep learning technology to predict and manage the risk of flooding, one of the major natural disasters (Khosravi et al., 2020; Moishin et al., 2021). Moishin et al. (2021) projected flood occurrence utilizing past daily rainfall data based on a hybrid deep learning algorithm. The described algorithm was a combination of long short-term memory networks, CNN, and advanced flood risk management (Moishin et al., 2021). Moreover, a flood sensitivity map was created using CNN based on a vast amount of data concerning the past flooding area, such as elevation, geology, vegetation, distance from rivers and roads, land use, rainfall, slope, curvature and soil moisture (Khosravi et al., 2020). Kim et al. (2021a) proposed a model for expected maintenance and repair costs using a deep neural network (DNN) algorithm as a method for the economic management of facilities. The mentioned study used a DNN algorithm based on factors affecting loss from natural disasters and loss of data from natural disasters for learning, testing, and verifying the new model. As a result of comparison with other models, the developed model was considered to be effective in predicting maintenance and repair costs (Kim et al., 2021b). Furthermore, when loss of data on construction projects caused by natural disasters has been predicted through deep learning, the prediction error was lower than the statistical model generally used for prediction (Kim et al., 2021a).
As stated above, various deep learning technologies were applied in order to develop and advance natural disaster risk assessment models due to higher prediction accuracy compared to the traditional approaches (Kim et al., 2020b; Berezina and Liu, 2022; Kaur et al., 2022; Klepac et al., 2022). Described studies exposed the shortcomings of existing models or showed advances in innovative technologies. Additionally, models designed via deep learning technologies are far more sophisticated and reliable than the existing ones and can serve as a cornerstone of better natural disaster risk mitigation strategies. Therefore, this study suggests a framework for developing a model for building loss due to typhoons through a deep learning algorithm.
2 Data and methodology
The goal of this study is to suggest an approach to predict building loss due to typhoons using a deep learning algorithm. Subsequently, this study has three detailed sub-goals. First, collecting data on the loss of buildings caused by typhoons. Second, a deep learning algorithm is applied to develop a prediction model based on the collected data. Third, to verify the developed model, comparing with the prediction results of other model’s. For the validation of the developed model, the prediction results gained from it and the results of the multi-regression analysis model, which is generally used for prediction, were compared. The detailed workflow and analysis process of the DNN model is shown in Figure 1.
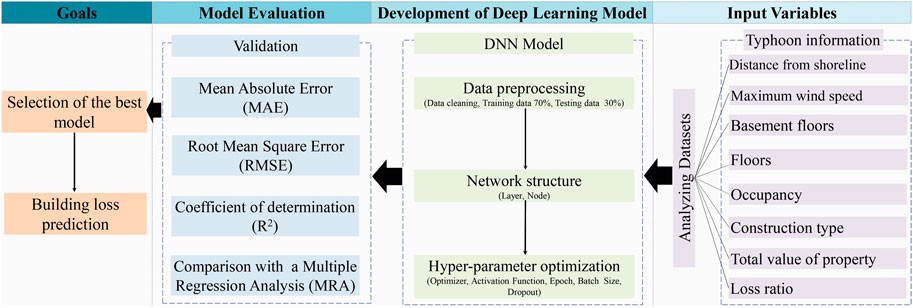
FIGURE 1. Workflow and overview of the DNN model.
The RMSE (Square Mean Square Error), MAE (Mean Absolute Error) and coefficient of determination (R2) of the deep learning model and the multiple regression analysis models were calculated and analyzed in comparison. Multiple regression analysis models were built using IBM Statistical Package for the Social Sciences (SPSS) V23. Moreover, Python 3.7 was adopted to generate the deep learning model.
2.1 Data collection
2.1.1 Typhoon loss
For the purpose of this study, data on losses caused by Typhoon Maemi from a major insurance company in South Korea were collected. Thus, the scope of the study is limited to South Korea, and data consist of a ground-up loss. Any other insurance conditions were excluded, as only the loss caused by typhoon Maemi was valid for the analysis. Typhoon Maemi, which occurred in 2003 and hit Korea, was the largest and the most destructive one (Hwang et al., 2020), causing a serious human and economic loss in South Korea, thus was chosen for this study. In 2006 the World Meteorological Organization renamed the catastrophe as Mujigae (NTC, 2011). Typhoon Maemi occurred in the sea near Guam on September 4, and was classified as a typhoon on September 6. In the following days, it advanced northwest, passed Okinawa, Japan, and landed on the southern coast of the Korean Peninsula. The typhoon landed on the southern coast of South Korea on 12 September 2003, passed inland, and moved to the east coast the next day, causing many casualties and leaving a lot of cities along the southern coast severely damaged, as depicted in Figure 2. After rapid destruction of the southeastern part of the Korean Peninsula, the typhoon moved into the East/Japan Sea and transformed into an extratropical cyclone on September 13 (Shim et al., 2013). Finally, it dissipated in the East Sea on September 14.
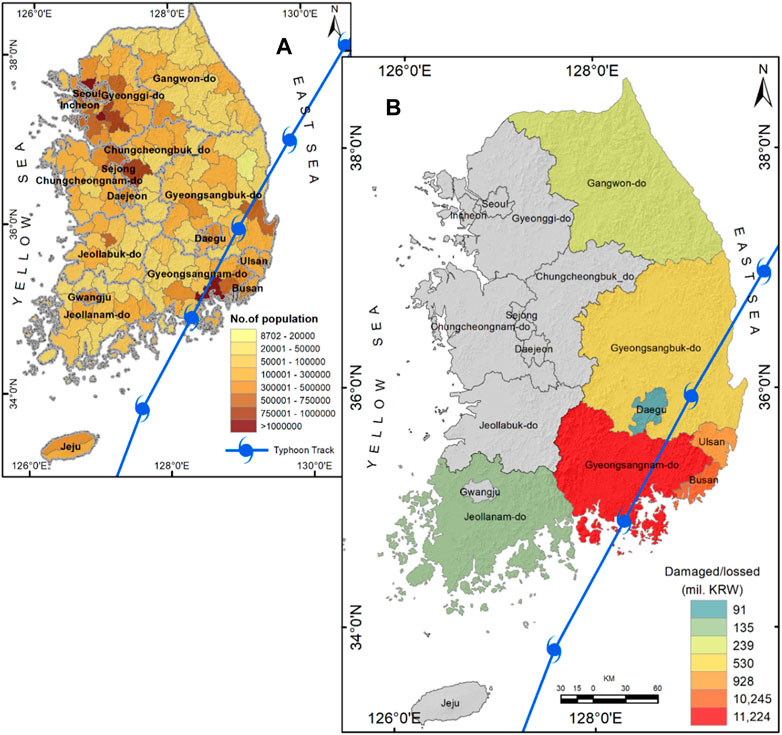
FIGURE 2. (A) Typhoon Maemi passed through the southeast coast of South Korea (https://www.ncdc.noaa.gov/ibtracs/), while the background shades represent the population distribution of the region (http://nationalatlas.ngii.go.kr/pages/page_741.php) and (B) province wise recorded loss distribution reported by Kim et al. (2020a).
Typhoon Maemi has reached record-breaking maximal radius of 460 km and a central pressure of 910 hPa. Figure 3 represents the eye of Typhoon Maemi from 10 to 13 September 2003 based on the MODIS-TERRA natural-color satellite images which were retrieved from the Land Processes Distributed Active Archive Center (LP DAAC) operated by the United States Geological Survey (USGS) at https://lpdaac.usgs.gov and visualized using the Google Earth Engine platform. During this period, the typhoon caused record-breaking heavy rainfall and strong winds across East Asia (Yun et al., 2012; Shim et al., 2013). It has been classified as a typical dry typhoon since it has a maximum wind speed of 54 m/s and causes a lot of damage by strong winds, heavy rain and storm surges (Ku et al., 2019). Typhoon Maemi struck during spring tide, causing a maximum surge level of 4.2 m above the WGS84 datum at Masan gauge station. This level was 2 m higher than the mean high water spring tidal level. Storm waves with a period of 16.7 s and a peak height of 7 m originated from the East China Sea and propagated through the Korea Strait, as recorded at the Geojedo buoy station (Li et al., 2016). The average elevation of the impacted coasts in South Korea, i.e., South and East, is 50.9 and 41.8 m, respectively (Park and Lee, 2020). Typically, the region experienced its highest rainfall during mid-July and mid-August, with daily average rainfall ranging between 220 and 322 mm (Park and Lee, 2020). However, during the passage of the typhoon, the southeastern part of the Korean peninsula experienced a total rainfall depth ranging from 100 to 450 mm within a short period of time (Choi et al., 2019). As a result, the damage caused by Typhoon Maemi affected 61,000 victims and 135 lives, and the total property damage amounted to about $4.2 billion (NTC, 2011).
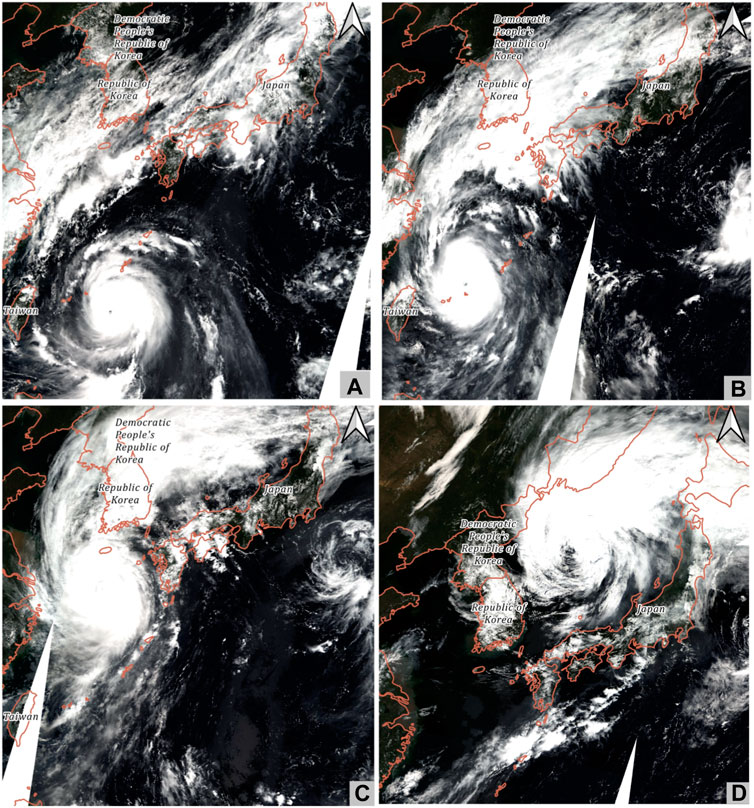
FIGURE 3. MODIS-TERRA true color satellite images of Typhoon Maemi paths collected on four different dates (A) 10 September, (B) 11 September, (C) 12 September, and (D) 13 September 2003. MODIS-TERRA images were retrieved from the Land Processes Distributed Active Archive Center (LP DAAC) operated by the United States Geological Survey (USGS) at https://lpdaac.usgs.gov and plotted through the Google Earth Engine platform (Gorelick et al., 2017).
2.1.2 Input and output variables
The output variable of this study is the record of loss of buildings caused by typhoon Maemi, done by the dominant Korean insurance company. The collected loss data include the amount of the buildings where the loss occurred, the type of buildings, the number of floors, the number of basement floors, the date of the accident, the accident details, the location of the accident, and the total amount of loss, and no personal information is included. Additionally, meteorological data such as 10-min average maximum wind speed and the impact of coastal inundation in the form of distance from the coastline have been considered, which were obtained from the Korea Meteorological Administration (KMA) and high-resolution Google Earth imagery. It should be noted that this study examined 923 cases of loss caused by Typhoon Maemi. The description of the input variables is presented in Table 1.
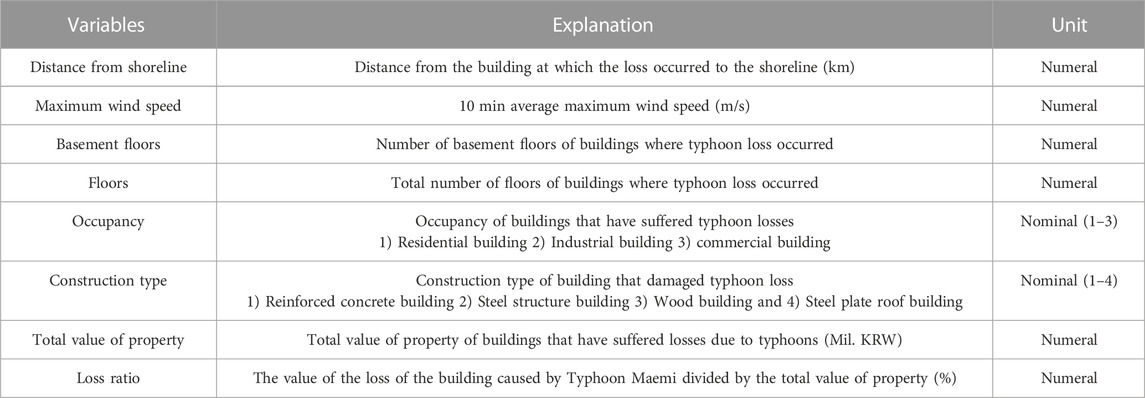
TABLE 1. Description of variable.
Input variables were collected from the key indicators adopted in the previous vulnerability and risk assessment studies of natural disasters. For instance, the distance between the coastline and buildings damaged by windstorms is a substantial indicator of the force of typhoons (Kim et al., 2016; Yum et al., 2020). As the distance between the shoreline and the building decreases, the amount of damage increases. Conversely, as the distance between the shoreline and the building increases, the amount of damage decreases. Therefore, the greater the distance between the shoreline and the building, the less vulnerable it is to windstorm damage. The distance between the shoreline and the windstorm-damaged structure was calculated using ArcGIS based on the location of the specific building. Another vital indicator of typhoon properties is wind speed (Huang et al., 2001; Kim et al., 2018), as it causes direct damage akin to a missile impact and indirect damage through storm surges and landslides (Kim et al., 2018). Here, the 10-min average maximum wind speed (m/s) measured by the Korea Meteorological Administration (KMA) was used for wind speed. The wind speed at the precise time of damaging specific structures was collected for each building grounded on the accident date/time in the loss record. Inventory information of buildings (i.e., number of basement floors, number of floors, occupancy, building type, the total value of the property, etc.) is an indicator often applied in the study of damage vulnerability due to windstorms. Since the height of a building and the number of floors strongly correlates with the damage of windstorm, it is widely used to quantify the vulnerability of buildings to windstorms. Moreover, the presence or absence of the basement and the number of layers in the basement are vital indicators of flood damage due to heavy rainfall, which is one of the main damages of windstorms (De Silva et al., 2008; Kim et al., 2019). Occupancy is also an indicator frequently used for risk quantification studies of natural disasters and therefore treated as a nominal variable in this study (Kim et al., 2017; Yum et al., 2021). According to occupancy, it was divided into 1) residential buildings, 2) industrial buildings, and 3) commercial buildings due to vulnerability to windstorms depending on the type of construction (Kim et al., 2022a; Yum et al., 2021; D’Ayala et al., 2006). In this study, an input as a nominal variable was classified into 1) reinforced concrete building, 2) steel structure building, 3) wood building and 4) steel plate roof building. Additionally, total property value has a statistically significant correlation with windstorm damage, thus adopted in vulnerability assessment and quantification studies (Kim et al., 2016; Kim et al., 2017). For example, as the total value of property increases, the damage caused by windstorms has a decreasing negative correlation. The dependent variable is the loss ratio (LR). LR has been determined based on the value of the building loss caused by the typhoon divided by the total property value. The total value of property and loss ratios were log-transformed for normal distribution. The output variable, loss ratio, has a sample size of 923 with a minimum value of −8.68, a maximum value of −0.75, a mean of −5.62, and a standard deviation of 1.65. The input variables, including the total value of property, occupancy, maximum wind speed, distance from coastline, basement floor, floor, occupancy types, and construction types, also have corresponding statistics illustrated in Table 2. Descriptive statistics provide a detailed summary of the range, central tendency, and variability of the variables, offering insights into the distribution and characteristics of the data. On the other hand, Figure 4 represents the frequency distributions of dependent and independent variables considered for constructing the DNN model for the prediction of building loss due to Typhoon Maemi.
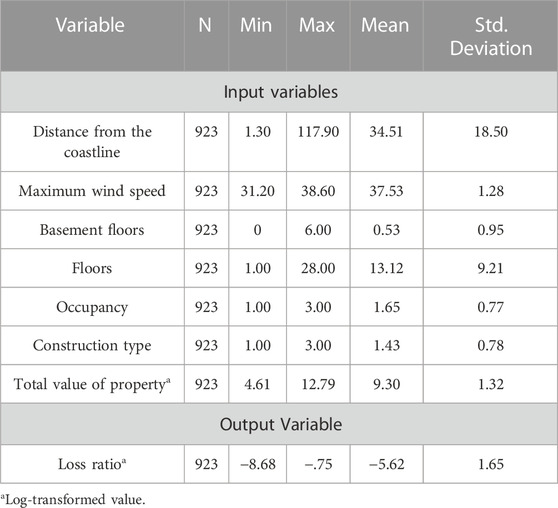
TABLE 2. Descriptive statistics.
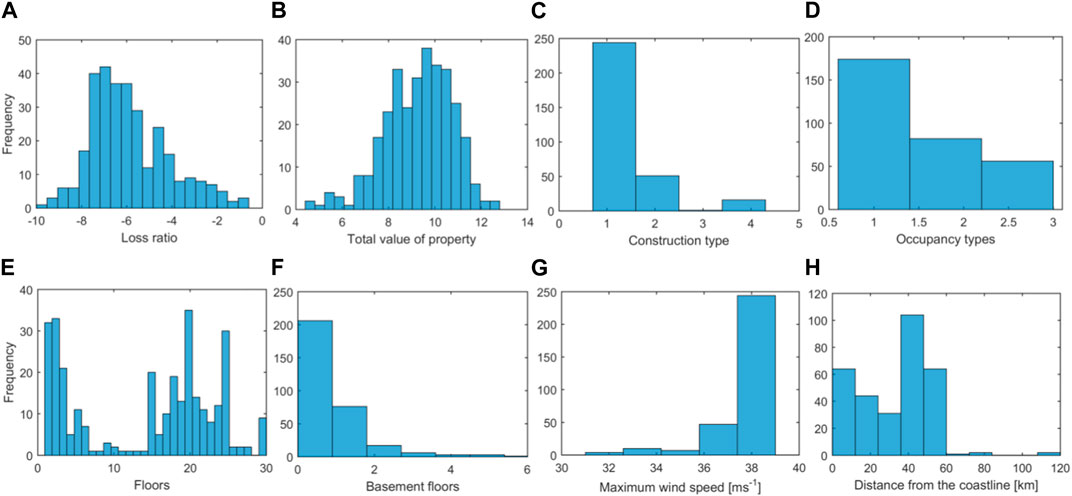
FIGURE 4. The distributions of numerical attributes: (A) loss ratio, (B) the total value of the property, (C) construction types, (D) occupancy types, (E) floors, (F) basement floors, (G) maximum wind speed, and (H) distance from the coastline.
2.2 Methodology: application of deep learning algorithm
Internet of Things, artificial intelligence, robots, unmanned transportation, big data, nanotechnology, etc., are applied to various industrial fields to prove their value and lead innovation in related fields (Cabello et al., 2021; Kim et al., 2022b). The amount of damage is expected to increase due to changes in the frequency and severity of natural disasters. Furthermore, to embrace the complexity and uncertainty of natural disaster damage as well as the various situations and characteristics of each user, a more sophisticated and efficient prediction model is essential. Moreover, an increasing usage of Internet of Things, Information and Communications and sensor technology for the management of buildings and facilities is expected to enrich complex and diverse big data. Also, for such an extensive analysis, the introduction of deep learning technology is rudimental. Deep learning algorithm is a part of machine learning and is applied to various industries and research, such as type classification of input data, regression, recognition, and prediction fields. A deep learning algorithm has components such as output layers, input layers, hidden layers, an activation function, neurons, and weights. Countless combinations of these components are possible, enabling applying to numerous data depending on the combination (Allison et al., 2019; Cabello et al., 2021). Deep learning algorithms are divided according to their arrangement and treating methods, such as Deep Neural Network (DNN), Convolutional Neural Network (CNN), Generative Adversarial Network (GAN), Recurrent Neural Network (RNN), and Auto Encoder (AE). For example, DNN allows construction of artificial neural networks with innumerable structures according to the number of hidden layers and combinations of components, enabling the modeling of complex nonlinear interactions. Due to these characteristics, DNN performs excellently in analyzing and predicting nonlinear data with high uncertainty and complexity like natural disasters (Kim et al., 2022a; 2021b).
Therefore, this study proposes a framework for developing a predictive model based on a DNN algorithm for analyzing big data generated by typhoons (Figure 1). Besides, this study aims to improve future natural disaster prediction through the prediction model based on the DNN algorithm, to reduce the monetary loss from natural disasters by more advanced loss prediction, and ultimately to contribute to the reduction and prevention of natural disaster risk.
2.2.1 DNN model setup
For the input data, a z-score normalization method was applied to normalize the data for the preprocessing. The multi-collinearity analysis was carried out on the selected independent variables using SPSS software. In the present study, tolerance (TOL) and variance inflation factor (VIF) was used to detect the multi-collinearity among the variables (Yum et al., 2020). It was observed that the VIF value of all input variables is <10 and the TOL value is >0.1, which indicates that all the independent variables have no multi-collinearity problem (Yum et al., 2020; Zhang et al., 2020). Moreover, 30% of the input data were designated as test data, and the remaining 70% data were used as learning data. 30% of the learning data were used as validation data.
The developed DNN model calculated RMSE (Root Mean Square Error), MAE (Mean Absolute Error) and R2 values for validation. The trial and error method must be applied to find the best combination of hyperparameters and network structure to construct an optimal DNN algorithm model (Ahmed, 2019). The purpose is that the DNN algorithm using the backpropagation algorithm modifies the weights of nodes affording to the input and output variables, so the trial and error method is integral to discover the ideal arrangement. For instance, the scenario of a network structure arrays the number of nodes and the number of layers. Hyperparameter tuning governs the combination of them, such as dropout, epoch, activation function, batch size, and optimizer. Dropout is a regularization penalty to avoid performance degradation owing to overfitting, which is a hindrance of deep learning models. Epoch specifies the number of data training times for the DNN model. The optimizer is set to manage the speed and safety related to data learning of the DNN model. The activation function specifies how to find the cost function with the minimum value. Moreover, the batch size that identifies the unit of data learning for effective training of the DNN model is firm (Ahmed, 2019; Lee et al., 2020). In this study, the combination of Hyperparameter and Network structure, which has been used in many past natural disaster risk assessment and quantification studies, was stated (Yum et al., 2020; Kim et al., 2021a). A network structure with three layers was fixed for the DNN algorithm model, and dropout was configured as 0 or 0.2 in reflection of the restricted amount of data. For the epoch, the number of learning variables was set to 1,000, and the learning unit was set to 5 for the batch. As the optimizer, Adaptive Moment Estimation (Adam), which has been applied in many research and industrial fields, was designated due to its wide application range and convenient calculation. A moment theory based on a stochastic objective function was also applied (Ajayi et al., 2020). Rectified Linear Unit (ReLu) was chosen as the activation function. ReLu is a function developed to compensate the shortcomings of the sigmoid function and possesses the characteristic of changing the output depending on whether it has a value of 0 or more (Gu et al., 2018). The architecture of DNN consists of independent variables (input), a hidden layer, and the result (output), as depicted in Figure 5.

FIGURE 5. The architecture of the DNN model and backpropagation algorithm.
In addition, a Multiple Regression Analysis (MRA) model was also constructed for supplementary model support with the same input and output variables as the DNN model using the SPSS V23 software. MRA is a technique widely used in the area of prediction, whereas a regression analysis method quantifies the correlation between variables through statistics (Nguyen et al., 2019).
2.2.2 Model validation
Model validation is the process of evaluating a model’s performance on unseen data. This is done to ensure that the model is able to generalize well to new data and is not overfitting to the training data (Kim et al., 2021a). There are a variety of metrics that can be used to evaluate the performance of a deep learning model, including mean absolute error (MAE), root mean squared error (RMSE) and coefficient of determination (R2) (Devaraj et al., 2021; Sakai et al., 2021). Since RMSE, MAE and R2 express the precision of the model through the deviation of the predicted value and the actual value, they were applied as descriptive pointers to assess artificial neural network models (Rahman et al., 2021; Kim et al., 2022b). The MAE measures the average absolute difference between predicted and true values. It is calculated as the sum of the absolute differences between the predicted and true values divided by the number of data points. MAE is a robust metric that is not affected by outliers, but it does not penalize large errors as much as other metrics like RMSE. The lesser the MAE value, the minor the prediction error is. On the other hand, the RMSE displayed the residuals between the predicted values of the model and the actual values as a single scale; thus, the slighter the RMSE value, the smaller the prediction error. RMSE is more sensitive to outliers than MAE but penalizes large errors more heavily. The R2 value acts as a measure of prediction accuracy, where a value of 1 signifies a perfect prediction. Conversely, a lower R2 value indicates diminished prediction accuracy, enabling easier intuitive evaluation of a model’s performance (Sakai et al., 2021). In the present study, the final model verification has been performed based on the MAE, RMSE, and R2 values of training, test and validation data. The MRA model also individually estimated MAE, RMSE, and R2 values and associated them with the MAE, RMSE, and R2 values of the DNN model.
3 Results and discussion
3.1 Results
This study proposed a framework for building a predictive model using the DNN algorithm, one of the deep learning algorithms, to predict the loss of buildings caused by typhoons. For data collection, data on loss of buildings that occurred by typhoon Maemi was collected from the insurance company, and variables were collected. For the development of an optimal DNN algorithm model, different network scenarios and hyperparameters learned the input and output variables, and a combination with a minimum cost function was identified. Table 3 shows the learning results according to the network structure scenario and dropout. Among the learning results, the scenario in which the MAE and RMSE values are the minima was decided as the final one. It was found that, in general, a smaller loss function was exhibited when the dropout was 0 than when the dropout was 0.2. Furthermore, as the number of hidden layer nodes increased, MAE and RMSE became smaller, and both MAE and RMSE had the smallest values in the scenario where the number of hidden layer nodes equaled 600-600-600. Therefore, the dropout was 0, the network structure scenario and the number of hidden layer nodes were determined to be 600-600-600, as depicted in Figure 6. The final network structure and hyper-parameters are summarized in Table 4.
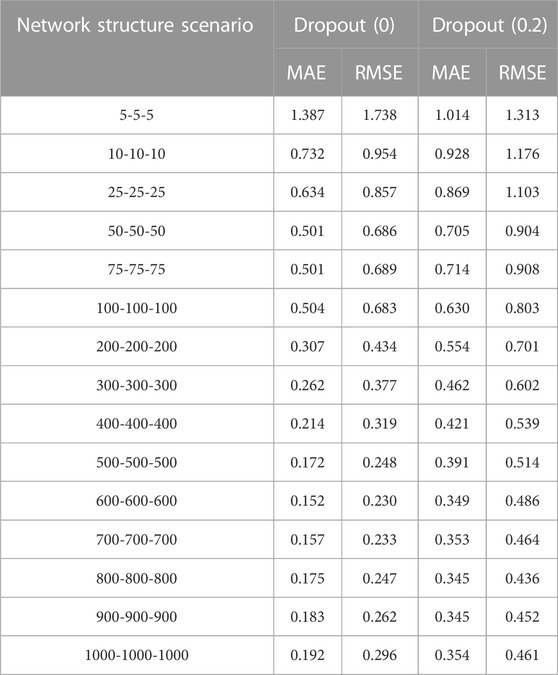
TABLE 3. Results of learning.
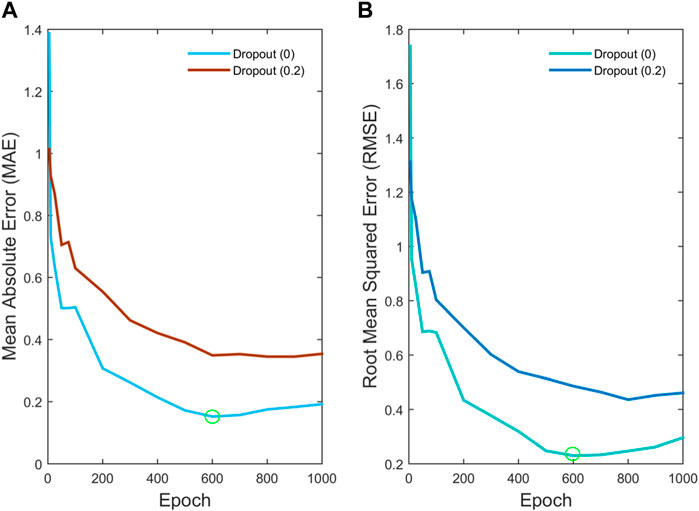
FIGURE 6. Performances of the network architecture using criteria of (A) MAE and (B) RMSE for different dropout rates.
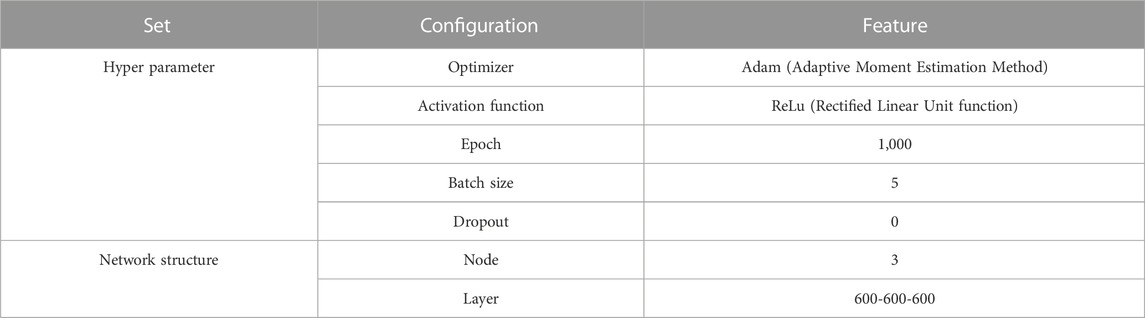
TABLE 4. Final network structure and hyper-parameter.
To verify the problem of overfitting the final DNN algorithm model, this study simulated the validation and test data and associated the predicted results. For these purposes, the regression analysis (R2) results of the optimized DNN structure for the training, validation, test and total datasets are plotted in Figure 7. The regression results indicate that the optimized DNN model can accurately capture the relationship between the independent and dependent variables. The consistent correlation coefficients (R2 > 0.8) across the different datasets (training, validation, testing, and combined) suggest the model’s generalizability and reliability in predicting the dependent variable. Moreover, comparative verification with the MRA model was performed for additional verification. As shown in Table 5, MAE, RMSE and R2 values of the validation and test data were calculated and compared to verify the final DNN model. As a result of the simulation of validation data and test data, the MAE, RMSE, and R2 values of the validation data were 0.133, 0.222, and 0.825, and the test data values were 0.131, 0.215, and 0.832, respectively. Thus, the overfitting of the DNN model was insignificant since the alteration between the result values of the verification data and the test data was unimportant. Table 5 shows the comparison of the results of the DNN model and the MRA model. As a result of comparing the two models (i.e., DNN/MRA (%) for test data sets), the DNN model showed 82.5% lower MAE and 64.8% lower RMSE than the MRA model, which leads to the conclusion that the DNN model displays a lower prediction error rate than the MRA model. Furthermore, it was observed that the R2 values for validation and test cases were notably higher in the DNN model compared to the MRA model. Thus, the higher R2 values in the DNN model suggest that it captured the underlying patterns and relationships in the data more accurately than the MRA model. Wei and Yang (2021) also noticed the better performance of the backpropagation algorithm compared to the MRA model. Therefore, it was observed that the DNN algorithm model has higher reliability and robustness in predicting the loss of buildings due to typhoons. To sum up, the non-parametric DNN algorithm is more suitable than the parametric MRA model for non-linearity and data with high complexity and uncertainty, such as natural disaster losses (Schmidhuber, 2015; Nguyen et al., 2019).
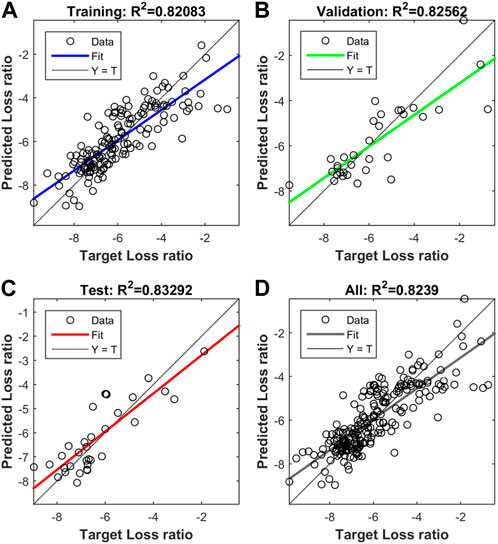
FIGURE 7. Regression results of an optimized DNN model for (A) training; (B) validation; (C) testing; and (D) combined input data sets.
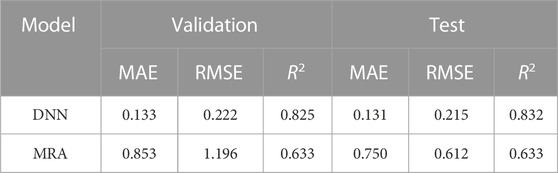
TABLE 5. Model comparison result.
3.2 Discussion
Risk managers and facility managers in public or private sector will be capable of predicting losses due to typhoons or developing an in-house model through the DNN model proposed in this study. As well, since the DNN algorithm model exhibits a lower prediction error rate than the existing model, the loss prediction will be more accurate and reliable. Therefore, risk managers or facility managers will be able to reduce expected losses and establish investment strategies to prevent damage. Into the bargain, the model can be useful as a guideline for preparing an emergency reserve in reflection of the expected typhoon loss for sound and continuous financial planning. Furthermore, establishing a new strategy for transferring the risk of loss by using this model is possible. For example, the prediction done by the DNN model can be applied as a criterion for judging the appropriate level of insurance premiums currently insured according to the estimated risk of loss and can be utilized to enhance the adjusting of insurance coverage. Besides, insurance companies can use it to manage the accumulated risk of typhoons. Hence, it is conceivable to predict the economic loss due to typhoons through the DNN model and framework and eventually reduce the loss from typhoons by upgrading the damage prevention and risk transfer strategy.
Additionally, the developed models and framework can be adopted as reference materials for loss analysis and forecasting in public and private sectors in other industries and academia, as well as for the prediction of other natural disasters. Abnormal climate and natural disasters caused by global warming, such as windstorms, tornados, heavy snow, heavy rain, hail and droughts, are occurring all over the world and have adverse effects on many fields, so many studies are conducted to overcome their repercussions (Carreira-Perpinan and Hinton, 2005; Kwon, 2019). The proposed model was built on numerous introduced indicators such as the distance from the coastline, maximum wind speed, number of basement floors, floors, occupancy, construction type, and total property value. Initial result that the risk indicators are closely related to the loss from natural disasters was re-examined. Furthermore, expected rise of the frequency and severity of natural disasters such as typhoons due to the global warming is anticipated to have a significant antagonistic effect on the management of buildings and facilities in the future (Kim et al., 2020a). Besides, Information and Communications (ICT), Internet of Things (IoT), and sensor technology have recently become widely used for building and facility management. Thus, similar research can be conducted to analyze and utilize big data accumulated in these devices and technologies. Therefore, as the need for advanced prediction of loss owing to typhoons will grow greater and sources of information become gradually more accessible, the results and framework of this study can be recognized as rudiments of meeting these needs.
Nevertheless, in this study, only data on loss of buildings caused by typhoon Maemi of a major insurance company in South Korea were accepted. As a result, additional research is desired to secure supplementary data on loss due to other typhoons from other insurance companies and other countries and comparative verification to upgrade the proposed model. Furthermore, discovering additional variables such as topographical indicators according to the characteristics of natural disaster losses is essential not only for improving the prediction error of the model but also in order to expand the model’s capacity of predicting human casualties apart from damage to buildings due to typhoons. Although the DNN algorithm created in this study presents reduced prediction error compared to the existing model, it has the disadvantage of the weights and correlations between nodes being black boxes. The problem stays unresolved as the deep learning algorithms unilaterally provide through a black box without screening the basis and process of deriving prediction results, which may raise questions about the objectivity and dependability of the results and models. Therefore, further research is required by introducing XAI (eXplainable AI). XAI is also an artificial intelligence technology that explains AI algorithm classification, prediction, causality, and decision-making to users (Chollet, 2017). Consequently, in the future study of deep learning algorithm models, it is crucial to gain users’ trust and improve understanding of models and data through a glass box rather than a black box by using XAI.
4 Conclusion
Globally, the frequency and severity of natural disasters are escalating due to climate change. The accumulation and scale of assets increase, and the amount of damage caused by natural disasters is highly likely to extend. Moreover, a sophisticated loss prediction model that reflects the complexity and uncertainty of natural disaster damage as well as the circumstances and characteristics of each user is required. Only then it will be possible to achieve sustainable management of buildings and facilities and establishing risk management strategies such as loss prevention, reduction and transfer based on the prediction of financial loss. Therefore, this study proposed a framework for developing a deep learning algorithm prediction model based on the loss data of buildings caused by typhoons. As a result of comparative verification, the DNN algorithm model developed in this study exhibited lower prediction error than the MRA model.
Consequently, the results and framework of this study can be successfully used to predict the loss of a building owing to typhoons and furthermore, to reduce the risk of loss of a building as well as to advance financial management. The other benefit is that the results and framework of this study can be applied to other research fields, industries, and other natural disaster research. Additionally, the proposed model allows the government to implement the risk assessment based on the risk indicators for system and the manual development. This information can then be used to develop and implement preventive measures, such as improved disaster response strategies, enhanced risk assessment and coverage by insurance companies. This will ultimately help to reduce the damage caused by typhoons and improve overall resilience to climate crises. In the private sector, insurance companies are enabled to adopt the results and framework of this study to better manage accumulated risk by taking into account the company’s asset size, risk propensity and portfolio. As well, the results of loss prediction based on model created by the proposed DNN algorithm can serve as a standard for various insurance conditions required by insurers, such as appropriate premium, retention, probable maximum loss (PML), liability limit (LOL), and excess of loss reinsurance (XOL). However, based on the available data, the present study considered only one typhoon scenario (i.e., Typhoon Maemi), which may not reflect the overall building loss scenario due to Typhoon in South Korea. Therefore, additional research is required to improve the reliability of the model through additional studies such as adding variables (such as elevation, geology, vegetation, distance from rivers and roads, land use, rainfall, slope, etc.), additional data collection for multiple scenarios, and continuous model validation.
Data availability statement
The raw data supporting the conclusion of this article will be made available by the authors, without undue reservation.
Author contributions
Conceptualization, J-MK and S-GY. Methodology, J-MK, JB, and S-GY. Investigation, J-MK, JB, S-GY, and MDA. Resources, J-MK. Writing–original draft preparation, J-MK. Writing–review and editing, J-MK, S-GY, and MDA. Visualization, J-MK and MDA. Supervision, J-MK. Project administration, J-MK and S-GY. Funding acquisition, J-MK. All authors contributed to the article and approved the submitted version.
Funding
This research was supported by the Research Funds of Mokpo National University in 2022.
Acknowledgments
The authors would like to thank the esteemed reviewers for their valuable comments and suggestions that helped improve the manuscript.
Conflict of interest
The authors declare that the research was conducted in the absence of any commercial or financial relationships that could be construed as a potential conflict of interest.
Publisher’s note
All claims expressed in this article are solely those of the authors and do not necessarily represent those of their affiliated organizations, or those of the publisher, the editors and the reviewers. Any product that may be evaluated in this article, or claim that may be made by its manufacturer, is not guaranteed or endorsed by the publisher.
References
Ahmed, S. (2019). Causes and effects of accident at construction site: A study for the construction industry in Bangladesh. Int. J. Sustain. Constr. Eng. Technol. 10 (2), 18–40. doi:10.30880/ijscet.2019.10.02.003
Ajayi, A., Oyedele, L., Owolabi, H., Akinade, O., Bilal, M., Davila Delgado, J. M., et al. (2020). Deep learning models for health and safety risk prediction in power infrastructure projects. Risk Anal. 40 (10), 2019–2039. doi:10.1111/risa.13425
Al Najar, M., Thoumyre, G., Bergsma, E. W., Almar, R., Benshila, R., and Wilson, D. G. (2021). Satellite derived bathymetry using deep learning. Mach. Learn. 112, 1107–1130. doi:10.1007/s10994-021-05977-w
Allison, R. W., Hon, C. K., and Xia, B. (2019). Construction accidents in Australia: Evaluating the true costs. Saf. Sci. 120, 886–896. doi:10.1016/j.ssci.2019.07.037
Berezina, P., and Liu, D. (2022). Hurricane damage assessment using coupled convolutional neural networks: A case study of hurricane michael. Geomatics, Nat. Hazards Risk 13 (1), 414–431. doi:10.1080/19475705.2022.2030414
Blake, E. S., Landsea, C., and Gibney, E. J. (2011). The deadliest, costliest, and most intense United States tropical cyclones from 1851 to 2010 (and other frequently requested hurricane facts). NOAA Tech. Memo. NWS NHC 6. Available at: https://repository.library.noaa.gov/view/noaa/6929 (Accessed July 10, 2023).
Cabello, A. T., Martínez-Rojas, M., Carrillo-Castrillo, J. A., and Rubio-Romero, J. C. (2021). Occupational accident analysis according to professionals of different construction phases using association rules. Saf. Sci. 144, 105457. doi:10.1016/j.ssci.2021.105457
Carreira-Perpinan, M. A., and Hinton, G. (2005). “On contrastive divergence learning,” in International workshop on artificial intelligence and statistics (New York City, NY, USA: PMLR), 33–40.
Choi, J., Lee, J., and Kim, S. (2019). Impact of sea surface temperature and surface air temperature on maximizing typhoon rainfall: Focusing on typhoon maemi in Korea. Adv. Meteorology 2019, 1–12. doi:10.1155/2019/1930453
Chollet, F. (2017). Deep learning with R. Version 1. Shelter Island, NY, United States: Manning Publications.
D’Ayala, D., Copping, A., and Wang, H. “A conceptual model for multi-hazard assessment of the vulnerability of historic buildings,” in Proceedings of the Structural Analysis of Historical Constructions: Possibilities of Numerical and Experimental Techniques, Fifth International Conference, New Delhi, India, 2006, November, 121–140.
De Silva, D. G., Kruse, J. B., and Wang, Y. (2008). Spatial dependencies in wind-related housing damage. Nat. hazards 47 (3), 317–330. doi:10.1007/s11069-008-9221-y
Devaraj, J., Ganesan, S., Elavarasan, R. M., and Subramaniam, U. (2021). A novel deep learning based model for tropical intensity estimation and post-disaster management of hurricanes. Appl. Sci. 11 (9), 4129. doi:10.3390/app11094129
Gledson, B. J., and Greenwood, D. (2017). The adoption of 4D BIM in the UK construction industry: An innovation diffusion approach. Eng. Constr. Archit. Manag. 24, 950–967. doi:10.1108/ECAM-03-2016-0066
Gorelick, N., Hancher, M., Dixon, M., Ilyushchenko, S., Thau, D., and Moore, R. (2017). Google Earth engine: Planetary-scale geospatial analysis for everyone. Remote Sens. Environ. 202, 18–27. doi:10.1016/j.rse.2017.06.031
Gu, J., Wang, Z., Kuen, J., Ma, L., Shahroudy, A., Shuai, B., et al. (2018). Recent advances in convolutional neural networks. Pattern Recognit. 77, 354–377. doi:10.1016/j.patcog.2017.10.013
Guha, S., Jana, R. K., and Sanyal, M. K. (2022). Artificial neural network approaches for disaster management: A literature review. Int. J. Disaster Risk Reduct. 81, 103276. doi:10.1016/j.ijdrr.2022.103276
Haggag, M., Siam, A. S., El-Dakhakhni, W., Coulibaly, P., and Hassini, E. (2021). A deep learning model for predicting climate-induced disasters. Nat. Hazards 107 (1), 1009–1034. doi:10.1007/s11069-021-04620-0
Huang, Z., Rosowsky, D. V., and Sparks, P. R. (2001). Hurricane simulation techniques for the evaluation of wind-speeds and expected insurance losses. J. wind Eng. industrial aerodynamics 89 (7-8), 605–617. doi:10.1016/s0167-6105(01)00061-7
Hwang, S., Son, S., Lee, C., and Yoon, H. D. (2020). Quantitative assessment of inundation risks from physical contributors associated with future storm surges: A case study of typhoon maemi (2003). Nat. Hazards 104 (2), 1389–1411. doi:10.1007/s11069-020-04225-z
IPCC (2014). “Summary for policymakers,” in Climate change 2014: Impacts, adaptation, and vulnerability. Part A: Global and sectoral aspects. Contribution of working group II to the fifth assessment Report of the intergovernmental Panel on climate change (Cambridge, UK: IPCC), 1820.
Irwansyah, E., Young, H., and Gunawan, A. A. (2023). Multi disaster building damage assessment with deep learning using satellite imagery data. Int. J. Intelligent Syst. Appl. Eng. 11 (1), 122–131. Available at: https://www.ijisae.org/index.php/IJISAE/article/view/2450 (Accessed July 29, 2023).
Kaur, S., Gupta, S., Singh, S., Koundal, D., and Zaguia, A. (2022). Convolutional neural network based hurricane damage detection using satellite images. Soft Comput. 26 (16), 7831–7845. doi:10.1007/s00500-022-06805-6
Khosravi, K., Panahi, M., Golkarian, A., Keesstra, S. D., Saco, P. M., Bui, D. T., et al. (2020). Convolutional neural network approach for spatial prediction of flood hazard at national scale of Iran. J. Hydrology 591, 125552. doi:10.1016/j.jhydrol.2020.125552
Kim, J. M., Bae, J., Park, H., and Yum, S. G. (2022b). Predicting financial losses due to apartment construction accidents utilizing deep learning techniques. Sci. Rep. 12 (1), 5365. doi:10.1038/s41598-022-09453-w
Kim, J. M., Bae, J., Son, S., Son, K., and Yum, S. G. (2021b). Development of model to predict natural disaster-induced financial losses for construction projects using deep learning techniques. Sustainability 13 (9), 5304. doi:10.3390/su13095304
Kim, J. M., Kim, T., and Son, K. (2017). Revealing building vulnerability to windstorms through an insurance claim payout prediction model: A case study in South Korea. Geomatics, Nat. Hazards Risk 8 (2), 1333–1341. doi:10.1080/19475705.2017.1337651
Kim, J. M., Son, K., and Kim, Y. J. (2019). Assessing regional typhoon risk of disaster management by clustering typhoon paths. Environ. Dev. Sustain. 21 (5), 2083–2096. doi:10.1007/s10668-018-0086-2
Kim, J. M., Son, K., Yoo, Y., Lee, D., and Kim, D. Y. (2018). Identifying risk indicators of building damage due to typhoons: Focusing on cases of South Korea. Sustainability 10 (11), 3947. doi:10.3390/su10113947
Kim, J. M., Son, K., Yum, S. G., Ahn, S., and Ferreira, T. (2020a). Typhoon vulnerability analysis in South Korea utilizing damage record of typhoon maemi. Adv. Civ. Eng. 2020, 1–10. doi:10.1155/2020/8885916
Kim, J. M., Woods, P. K., Park, Y. J., Kim, T., and Son, K. (2016). Predicting hurricane wind damage by claim payout based on Hurricane Ike in Texas. Geomatics, Nat. Hazards Risk 7 (5), 1513–1525. doi:10.1080/19475705.2015.1084540
Kim, J. M., Yum, S. G., Park, H., and Bae, J. (2021a). A deep learning algorithm-driven approach to predicting repair costs associated with natural disaster indicators: The case of accommodation facilities. J. Build. Eng. 42, 103098. doi:10.1016/j.jobe.2021.103098
Kim, J. M., Yum, S. G., Park, H., and Bae, J. (2022a). Strategic framework for natural disaster risk mitigation using deep learning and cost-benefit analysis. Nat. Hazards Earth Syst. Sci. 22 (6), 2131–2144. doi:10.5194/nhess-22-2131-2022
Kim, T., Song, J., and Kwon, O. S. (2020b). Pre-and post-earthquake regional loss assessment using deep learning. Earthq. Eng. Struct. Dyn. 49 (7), 657–678. doi:10.1002/eqe.3258
Klepac, S., Subgranon, A., and Olabarrieta, M. (2022). A case study and parametric analysis of predicting hurricane-induced building damage using data-driven machine learning approach. Front. Built Environ. 8, 1015804. doi:10.3389/fbuil.2022.1015804
Ku, H., Maeng, J. H., and Cho, K. (2019). Climate change impact on typhoon-induced surges and wind field in coastal region of South Korea. J. Wind Eng. Industrial Aerodynamics 190, 112–118. doi:10.1016/j.jweia.2019.04.018
Kunreuther, H., Meyer, R., Van den Bulte, C., and Chapman, R. E. (2004). Risk analysis for extreme events: Economic incentives for reducing future losses. Gaithersburg, MD, USA: US Department of Commerce, Technology Administration, National Institute of Standards and Technology.
Kwon, S. C. (2019). Use of frequency analysis of exposure of hazards by occupations: Findings from the third and fourth Korean working conditions survey. Soonchunhyang Med. Sci. 25 (1), 37–45. doi:10.15746/sms.19.006
Lee, G., Lee, C., Koo, C., and Kim, T. W. (2020). Identification of combinatorial factors affecting fatal accidents in small construction sites: Association rule analysis. Korean J. Constr. Eng. Manag. 21 (4), 90–99. doi:10.6106/KJCEM.2020.21.4.090
Li, H., Lin, L., and Cho, K. “Coastal inundation from sea level rise and typhoon maemi,” in Proceedings of the 12th International Conference on Hydroscience & Engineering ICHE 2016, Tainan, Taiwan, November, 2016. Editors Pao-Shan Yu, and Wie-Cheng (Hg Lo.
Moishin, M., Deo, R. C., Prasad, R., Raj, N., and Abdulla, S. (2021). Designing deep-based learning flood forecast model with ConvLSTM hybrid algorithm. IEEE Access 9, 50982–50993. doi:10.1109/access.2021.3065939
Nguyen, T., Kashani, A., Ngo, T., and Bordas, S. (2019). Deep neural network with high-order neuron for the prediction of foamed concrete strength. Computer-Aided Civ. Infrastructure Eng. 34 (4), 316–332. doi:10.1111/mice.12422
NTC (2011). National typhoon center, typhoon white book. Pearl Harbor, Hawaii: National Typhoon Center.
Park, S. J., and Lee, D. K. (2020). Prediction of coastal flooding risk under climate change impacts in South Korea using machine learning algorithms. Environ. Res. Lett. 15 (9), 094052. doi:10.1088/1748-9326/aba5b3
Rahman, M., Chen, N., Elbeltagi, A., Islam, M. M., Alam, M., Pourghasemi, H. R., et al. (2021). Application of stacking hybrid machine learning algorithms in delineating multi-type flooding in Bangladesh. J. Environ. Manag. 295, 113086. doi:10.1016/j.jenvman.2021.113086
Ren, J., Xu, N., and Cui, Y. (2022). Typhoon track prediction based on deep learning. Appl. Sci. 12 (16), 8028. doi:10.3390/app12168028
Sakai, M., Nagayasu, K., Shibui, N., Andoh, C., Takayama, K., Shirakawa, H., et al. (2021). Prediction of pharmacological activities from chemical structures with graph convolutional neural networks. Sci. Rep. 11 (1), 525. doi:10.1038/s41598-020-80113-7
Sanders, D., Brix, A., Duffy, P., Forster, W., Hartington, T., Jones, G., and Wilkinson, M. (2002). “January the management of losses arising from extreme events,” in Convention general insurance study group GIRO (London, UK: GIRO).
Schmidhuber, J. (2015). Deep learning in neural networks: An overview. Neural Netw. 61, 85–117. doi:10.1016/j.neunet.2014.09.003
Shane Crawford, P., Hainen, A. M., Graettinger, A. J., van de Lindt, J. W., and Powell, L. (2020). Discrete-outcome analysis of tornado damage following the 2011 Tuscaloosa, Alabama, tornado. Nat. Hazards Rev. 21 (4), 04020040. doi:10.1061/(asce)nh.1527-6996.0000396
Shim, J. S., Kim, J., Kim, D. C., Heo, K., Do, K., and Park, S. J. (2013). Storm surge inundation simulations comparing three-dimensional with two-dimensional models based on Typhoon Maemi over Masan Bay of South Korea. J. Coast. Res. 65 (65), 392–397. doi:10.2112/si65-067.1
Ulbrich, U., Fink, A. H., Klawa, M., and Pinto, J. G. (2001). Three extreme storms over Europe in december 1999. Weather 56 (3), 70–80. doi:10.1002/j.1477-8696.2001.tb06540.x
USNHC (2018). United States National Hurricane Center (USNHC): Costliest, U.S. tropical cyclones tables update. (last access: https://www.nhc.noaa.gov/news/UpdatedCostliest.pdf June 31, 2022).
Wei, W., and Yang, X. (2021). Comparison of diagnosis accuracy between a backpropagation artificial neural network model and linear regression in digestive disease patients: An empirical research. Comput. Math. Methods Med. 2021, 1–10. doi:10.1155/2021/6662779
Yi, Y., and Zhang, W. (2020). A new deep-learning-based approach for earthquake-triggered landslide detection from single-temporal RapidEye satellite imagery. IEEE J. Sel. Top. Appl. Earth Observations Remote Sens. 13, 6166–6176. doi:10.1109/jstars.2020.3028855
Yi, Y., Zhang, Z., Zhang, W., Jia, H., and Zhang, J. (2020). Landslide susceptibility mapping using multiscale sampling strategy and convolutional neural network: A case study in jiuzhaigou region. Catena 195, 104851. doi:10.1016/j.catena.2020.104851
Yum, S. G., Kim, J. M., and Son, K. (2020). Natural hazard influence model of maintenance and repair cost for sustainable accommodation facilities. Sustainability 12 (12), 4994. doi:10.3390/su12124994
Yum, S. G., Kim, J. M., and Wei, H. H. (2021). Development of vulnerability curves of buildings to windstorms using insurance data: An empirical study in South Korea. J. Build. Eng. 34, 101932. doi:10.1016/j.jobe.2020.101932
Yum, S. G., Song, M. S., and Adhikari, M. D. (2023). Assessing Typhoon Soulik-induced morphodynamics over the Mokpo coastal region in South Korea based on a geospatial approach. Nat. Hazards Earth Syst. Sci. 23 (7), 2449–2474. doi:10.5194/nhess-23-2449-2023
Yun, K. S., Chan, J. C., and Ha, K. J. (2012). Effects of SST magnitude and gradient on typhoon tracks around East Asia: Acase study for Typhoon Maemi. Atmos. Res. 109, 36–51. doi:10.1016/j.atmosres.2012.02.012
Keywords: deep learning algorithm, catastrophe model, building loss, typhoon, the Korean Peninsula
Citation: Kim J-M, Bae J, Adhikari MD and Yum S-G (2023) A study of deep learning algorithm usage in predicting building loss ratio due to typhoons: the case of southern part of the Korean Peninsula. Front. Earth Sci. 11:1136346. doi: 10.3389/feart.2023.1136346
Received: 03 January 2023; Accepted: 27 July 2023;
Published: 04 August 2023.
Edited by:
Celso Santos, Federal University of Paraíba, BrazilReviewed by:
Wei-Bo Chen, National Science and Technology Center for Disaster Reduction (NCDR), TaiwanZerouali Bilel, University of Chlef, Algeria
Copyright © 2023 Kim, Bae, Adhikari and Yum. This is an open-access article distributed under the terms of the Creative Commons Attribution License (CC BY). The use, distribution or reproduction in other forums is permitted, provided the original author(s) and the copyright owner(s) are credited and that the original publication in this journal is cited, in accordance with accepted academic practice. No use, distribution or reproduction is permitted which does not comply with these terms.
*Correspondence: Sang-Guk Yum, c2t5ZW9tMDQwMUBnd251LmFjLmty