 Xiuping Li
 Lei Wang
 Baoyi Hu1
 Deliang Chen
- 1State Key Laboratory of Tibetan Plateau Earth System, Environment and Resources (TPESER), Institute of Tibetan Plateau Research, Chinese Academy of Sciences, Beijing, China
- 2The University of Chinese Academy of Sciences, Beijing, China
- 3Department of Earth Sciences, University of Gothenburg, Gothenburg, Sweden
Mountain is called the water towers of the world. Due to high sensitivity and vulnerability to climate change, more attention is paid to the change of water resources in mountain regions, where provide water for environmental and human demands downstream. Mountains glacier, as one of the most important components of terrestrial water storage (TWS), effectively regulates and stabilizes surface water resources. TWS appears to be trending below previous ranges in recent years, and glacier retreating is becoming the primary cause of TWS depletion in mountain regions. However, how much mountain glacier changes contribute to TWS changes around mountain regions is unknown. Here, we combine multi-source datasets to quantify the contribution rate over high-elevation mountain regions. On a global scale, the glacial melting is equivalent to about 49% of the total TWS decline during 2006–2015. TWS and glacier show decreasing trends in most of mountain regions and watersheds of the Third Pole and surroundings (TPs), but the contribution ranges from −23% to 728% in mountain regions and −21% to 99% in watersheds of TPs. There are larger contributions in regions with more glaciers, while smaller in less glacier-covered regions. Glacier together with other storage components play diverse roles across different mountain regions and watersheds, but factors with great influence are glacier, groundwater, soil water, reservoirs and lakes.
1 Introduction
As the water towers of the world, mountains provide water for environmental and human demands downstream. Mountains have high sensitivity and vulnerability to climate change (Viviroli et al., 2011) and are experiencing faster warming than low-elevation areas. Glacier, one of the most important components of mountains terrestrial water storage (TWS), effectively regulates and stabilizes surface water resources. TWS appears to be trending below previous ranges around the global regions and is dominated by different factors (Rodell et al., 2018; Huang et al., 2021). Mountain glaciers retreating in response to climate change is becoming the primary cause of TWS depletion in mountain regions (e.g., Jacob et al., 2012). However, how much mountain glacier changes contribute to TWS changes around mountain regions is unknown. Therefore, quantifying the contribution of melting glaciers to TWS changes from regions to watersheds is important because TWS changes have important implications for water resources assessment, climate change, and ecosystem dynamics.
With the release of GRACE satellites, many studies have focused on TWS changes at varied spatial scales (e.g., Hu et al., 2020). TWS changes can exert influence on sea-level rise due to glacier melting, natural resources and disasters (e.g., groundwater depletion), ecological environment (e.g., vegetation dependent on groundwater) and construction projects (e.g., land subsidence). About 20%–35% of the recent decadal sea-level rise was attributed to the net TWS change that integrates changing mountain glacier, groundwater and mass in other stores (Reager et al., 2016). A study shows that the contribution of net TWS decline in endorheic basins to a potential sea level rise matched the contribution of nearly half of the land glacier retreat (excluding Greenland and Antarctica) (Wang et al., 2018). Generally speaking, mountain glacier melting and groundwater exploitation had positive contributions to sea-level rise, while changes in reservoir storage had negative effects (Wada et al., 2016; Zemp et al., 2019).
The contribution of storage components to TWS changes presents a remarkable regional difference. For inland river basins, TWS changes are mainly from surface waters, soil moisture and groundwater (Wang et al., 2018). The decline of water storage in arid and semi-arid areas is mainly due to groundwater overexploitation (Rodell et al., 2018). Snow also has an important impact on TWS changes, such as for the river basins of Canada (Bahrami et al., 2020). Groundwater overexploitation is one of the main factors affecting TWS changes around the plain areas. For the Tibetan Plateau, water storage is extremely sensitive to climate change (Wang et al., 2020), followed with a significantly spatial difference. TWS decline in exorheic basins is mainly caused by the glacier retreat and the decline of soil and groundwater reserves, while the increase in endorheic basins is mainly caused by the expansion of lakes and the increase of glaciers in the Karakoram-West Kunlun Mountains (Li et al., 2022).
Mountain glaciers are key indicators of climate change for high-elevation mountain areas (Immerzeel et al., 2020), and their mass changes can alter the Earth’s hydrological cycles at multiple scales, by regulating and stabilizing runoff. Recent studies have discovered mountain glaciers are diminishing in response to climate change, affecting the TWS changes and water availability. Because of the accelerated melting rate of most mountain glaciers around the world, the mountain glacier mass budget estimates have raised more concerns about the sustainability of water supply in many parts of the world. Therefore, clarifying the contribution of mountain glaciers to TWS is conducive to the quantity of the impact of glacier changes on freshwater availability.
Owing to existing data’s coarse spatial resolution and availability, attribution of the TWS changes, especially from mountain glaciers, has been challenging. Here, we investigate the contributions of mountain glaciers changes to the total TWS changes from a global perspective to a watershed scale, aiming to enhance the understanding of the spatial differences of TWS’s contributing factors. We combine multiple GRACE products, glacier mass balance data and global hydrological model outputs to investigate the mass-budget changes of storage components, and focus on the impacts of glacier changes on water storage over high-elevation mountain regions on the Earth.
2 Materials and methods
2.1 Study area
The study regions include Western Canada and United States (WCA), Central Europe (CE), Caucasus and the Middle East (CME), the Third Pole and surroundings (TPs), Low Latitudes (LL) and Southern Andes (SA) except for Antarctica and Greenland periphery (Figure 1). This region has an area of about 483,155 km2 and total glacier volume is equal to about 221 ± 23 mm sea level (Hock et al., 2019). The glaciers range from the sea level (e.g., southeast Alaska) to the Himalayas and Karakoram mountains with an altitude of more than 8,000 m across the different climatic regions. Therefore, their mass budget largely depends on the balance between snow accumulation and melt at the glacier surface, driven primarily by atmospheric conditions. In the past 10 years, annual total precipitation has changed (Table 1), which will affect the TWS changes.

FIGURE 1. Locations of regions covered by mountain glacier and comparisons of estimated annual mean mass changes (Gt yr-−1) between the terrestrial water storage (△TWS) and the glacier (△glacier) (A) and the values of △TWS and all storage components (Gt yr-1) (B) in six typical mountain regions. All storage components data except for glacier are bias-corrected from WaterGAP Global Hydrology Model (WGHM) outputs. Regional △TWS is average calculated from annual-averaged GRACE values after removing maximum and minimum during 2006–2015. Global △TWS is similar to regional ones, but for regions except for Greenland and Antarctic periphery. Global and regional glacier mass changes are from IPCC SROCC. The shaded black areas represent the glacier distribution. WCU, CE, CME, TPs, LL, SA represent Western Canada and United States, Central Europe, Caucasus and Middle East, the Third Pole and surroundings, Low Latitudes and Southern Andes, respectively. The figure in the lower right corner is from the global result.
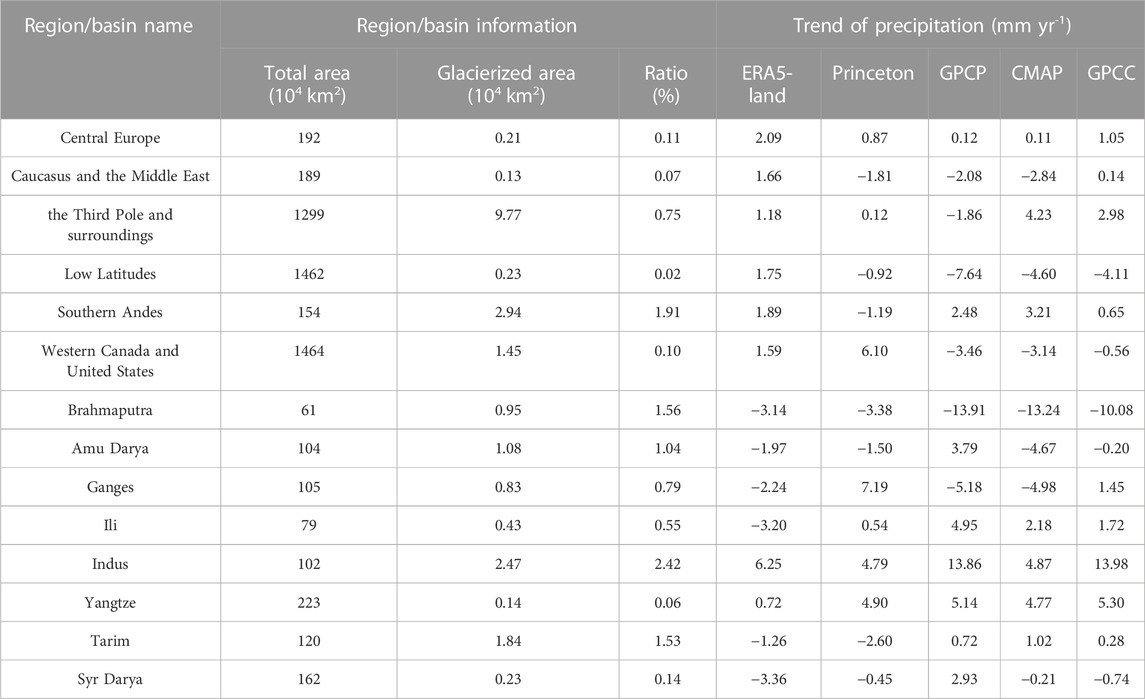
TABLE 1. Information of regions and river basins including the regional area, glacierized information with glacier area and ratio of glacier area to total area, and linear trends (mm decade−1) of annual total precipitation during the study period. The study period is 2006–2015 for six regions, 2003–2015 for eight river basins. Glacierized areas are from IPCC SROCC (Hock et al., 2019) and Brun et al. (2017). Data of precipitation come from ERA5-Land, the Princeton Global Meteorological Forcing Dataset, GPCP, CMAP, and GPCC.
As the Asian water tower, TPs contain the largest number of glaciers outside the Polar Regions (Vaughan et al., 2013). These glaciers are at the headwaters of many prominent Asian rivers and are an important contributor to river flow. TPs has 95,536 glaciers with an area of about 97,605 ± 7,935 km2 (Pfeffer et al., 2014; RGI Consortium, 2017). Eight typical river basins are chosen to study the contribution of mountain glacier changes to TWS changes. And they are the Syr Darya, Ili, Tarim, Amu Darya, Ganges, Brahmaputra, Indus, and Yangtze basins, respectively (Figure 2). The first four belong to endorheic basins, and the others are the exorheic basins.
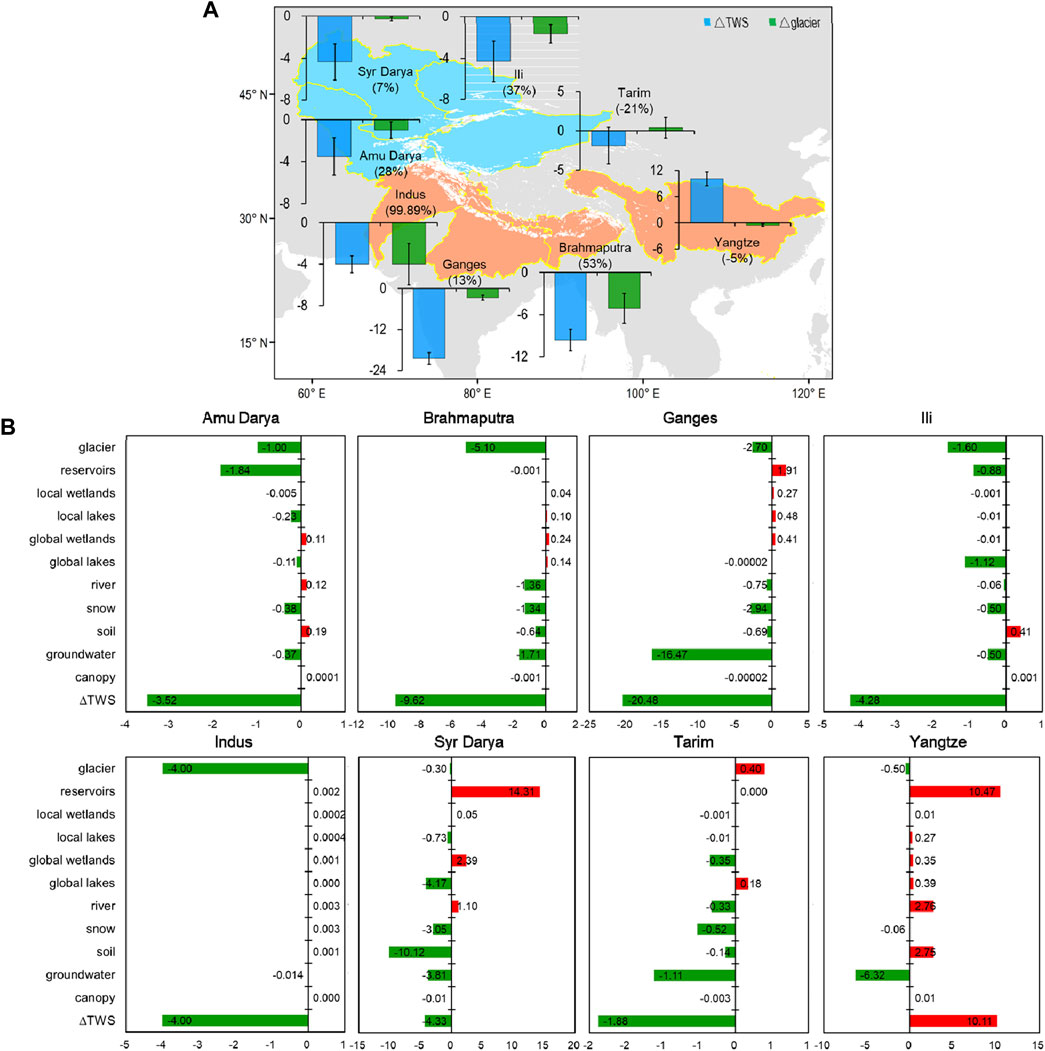
FIGURE 2. Locations of river basins around the Third Pole and surroundings covered by mountain glacier and comparisons of estimated annual mean mass changes (Gt yr−1) between the terrestrial water storage (△TWS) and the glacier (△glacier) (A) and the values of △TWS and all storage components (Gt yr−1) (B) in eight river basins of the Third Pole. All storage components data except for glacier are from WaterGAP Global Hydrology Model (WGHM) outputs. Eight river basins are Yangtze, Brahmaputra, Ili, Tarim, Ganges, Amu Darya, Syr Darya and Indus. The endorheic basins are in blue and the exorheic basins are in red. The shaded black areas represent the glacier distribution. △TWS is average calculated from annual-averaged GRACE values after removing maximum and minimum during 2003–2015. The shaded white areas represent the glacier distribution. Glacier mass balance are from Brun et al. (2017) in the Supplementary Material.
2.2 Data
Data used in the study include the TWS from GRACE, storage components from WaterGAP Global Hydrology Model (WGHM) outputs and glacier mass-budget data (Table 2). In addition, global monthly precipitation products from GPCP (Adler et al., 2018), CMAP (Huffman et al., 1997), ERA5-Land (Muñoz Sabater, 2019), GPCC (Markus et al., 2011) and Princeton (Sheffield et al., 2006) are used to investigate the possible reasons of TWS changes.
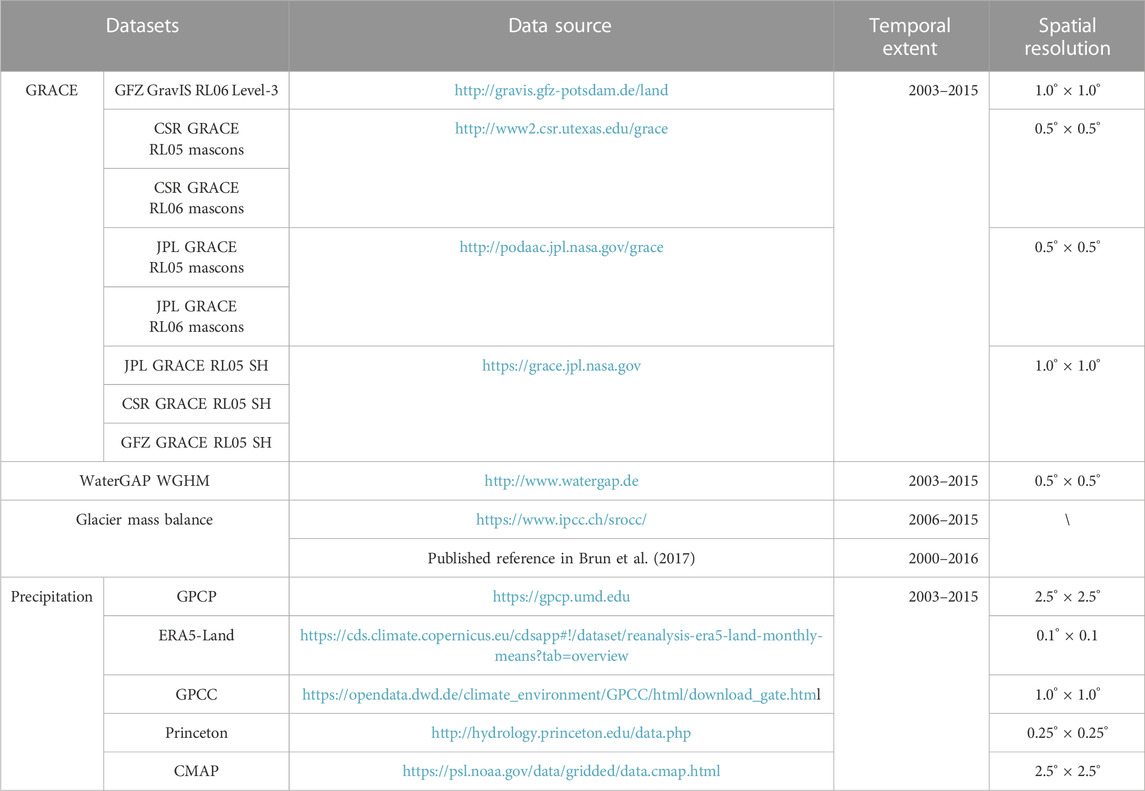
TABLE 2. Data sources of the terrestrial water storage, storage components, glaciers, precipitation used in this study.
Eight GRACE products are used to calculate TWS changes, including GRAVIS, MASCON_CSR05, MASCON_CSR06, MASCON_JPL05, MASCON_JPL06, SH_JPL, SH_CSR, and SH_GFZ (Table 2). Considering the continuity and quality of data, we selected TWS anomaly (TWSA, which represents the TWS deviation relative to the 2004–2009 time-mean baseline) from January 2003 to December 2015 from eight products. All GRACE products were resampled from 1° or 0.5° to 0.1° by nearest neighbor interpolation to calculate domain-averaged TWS changes.
Data from the WaterGAP Global Hydrology Model (WGHM) (v2.2d; Müller et al., 2021) was used to analyze the variations of TWS components and explore the contribution of storage components to TWS changes except for glaciers. The WaterGAP WGHM not only can simulate human use of groundwater and surface water, but also can separately simulate each storage component, including canopy interception (canopy), groundwater storage (groundwater), soil moisture (soil), snow water equivalent (snow), river runoff storage (river), global lake storage (global lakes), global wetland storage (global wetlands), local lake storage (local lakes), local wetland storage (local wetlands) and reservoir storage (reservoirs). Previous studies have proved that WGHM is a qualitatively good-performing global hydrological model, especially for quantifying global scale water resources and assessing water stress (Masaki et al., 2017; Zhao et al., 2017). More details about the WGHM products can be referenced in Döll et al. (2014) and Müller et al. (2021).
The glacier mass-budget estimates from the United Nation’s Intergovernmental Panel on Climate Change (IPCC) report on the Ocean and Cryosphere in a Changing Climate (SROCC) (Hock et al., 2019) are used to study the contribution of the changes of mountain glaciers to the changes of TWS on the global and regional scales, and from Brun et al. (2017) using time series of DEM derived from satellite stereo-imagery for the typical river basins of TP.
2.3 Methods
The primary TWS anomaly from GRACE and TWS components from WaterGAP WGHM reflect the monthly variations in TWS and its each storage component in the Earth’s climate system. For TWS from GRACE, the difference in mass balance between the last month of the last year (here it is December) and the first month of the first year (here it is January) is regarded as the mass changes of TWS during the study period, which is then used to compare with the glacier mass-balance changes. Different GRACE products have different performances. To eliminate the extreme influence from GRACE products and reflect the reasonable amplitude, we firstly remove the maximum and minimum from eight calculated TWS changes, and the remaining values are then used to calculate the TWS mean TWS and its standard deviation for global, regions and river basins. Similar method is used to monthly TWS and components from WaterGAP WGHM to calculate the mass changes in the study period.
Bias-correction method is used to correct TWS components from WaterGAP WGHM. Both of GRACE and WaterGAP WGHM simultaneously output TWS anomaly. Müller et al. (2021) found the underestimation phenomenon among WaterGAP WGHM outputs. So in this study, we regard the TWS change averaged from GRACE as the true value to correct the TWS change from WaterGAP WGHM, and then correct each storage component assuming that the simulation of components is reasonable in WaterGAP WGHM. In addition, linear regression is used to calculate the trends of precipitation.
3 Data comparison and bias correction
3.1 Comparison of mass balance from eight GRACE products
In this study, eight GRACE products are chosen to reveal the mass-balance changes of TWS. To validate the performance of eight GRACE products over the same region, we compare their ability in reproducing annual variability. We calculate the mass-balance changes of global averaged TWS except for Greenland and Antarctica during 2006–2015 (Supplementary Figure S1). All GRACE products show consistent decreasing trends but with different amplitudes of variation, ranging from 1411.08 to 224.70 Gt yr−1. Removing the maximum (1411.08 Gt yr−1) and minimum (224.70 Gt yr−1), the calculated global mean mass change is −452.67 ± 310.52 Gt yr−1 during 2006–2015.
The mass budget estimates of TWS from eight GRACE products in six typical regions covered by mountain glaciers are shown in Supplementary Figure S1. Eight products show consistent results except for the Third Pole and surroundings and Southern Andes. Most of the mountain regions have mass losses indicated by all GRACE products except for Western Canada and United States. Removing the maximum and minimum at each region, the calculated mean mass change is shown in Figure 1. Similar comparison based on river basins is investigated (Supplementary Figure S2). We also can find that nearly all products display consistent results except for GRAVIS and SH_GFZ, which mainly happens in the northwest of TP (Tarim, Syr Darya and Amu Darya). Around the southern TP (Ganges, Brahmaputra and Yangtze), results from eight GRACE products are consistent. The mean mass changes are calculated and shown in Figure 2 after removing the maximum and minimum. In short, eight GRACE products give consistent results and the ensemble mean can be used to reveal the TWS changes in the glacier-covered mountain areas.
3.2 Bias correction of TWS from WaterGAP WGHM
During the process of model evaluation and validation, the underestimation phenomenon among WaterGAP WGHM outputs was discovered (Müller et al., 2021). The comparison between TWS changes from GRACE and the sum of TWS changes from WGHM and glacier mass budget is shown in Supplementary Figure S3. Both results are comparable and WGHM underestimates the TWS changes compared with GRACE in most of the regions. And GRACE considers glacier changes while WaterGAP does not simulate glaciers. To ensure accuracy, a bias-correction method is used to correct all storage components among WaterGAP WGHM outputs. Firstly, we assume that the TWS changes from GRACE products (except for glaciers) are reasonable and reliable and regarded as true values to correct the storage changes among WaterGAP WGHM outputs. In addition, we believe that the proportion among all storage components is reasonable in WaterGAP WGHM outputs. Thus, the ratio of TWS changes between the GRACE products after removing glaciers and the WaterGAP WGHM outputs is used for each storage component to eliminate the underestimation or overestimation phenomenon. After the bias correction, all storage components in WaterGAP WGHM outputs are improved and then applied to investigate the contribution of storage components to TWS changes in the regions and river basins.
4 Results
4.1 Global contribution
On a global scale, TWS changes have obvious spatial heterogeneity and locations where TWS appears to be decreasing, where glaciers are diminishing and groundwater is being withdrawn (Rodell et al., 2018). The calculated global mean mass changes of TWS is −452.67 ± 310.52 Gt yr−1 during 2006–2015, while the globally-averaged glacier mass change from IPCC SROCC is −220.00 ± 30.00 Gt yr−1 with a glacier area of 483,155 km2 (excluding Greenland and Antarctic). Thus, the glacial melting is equivalent to about 49% of the total TWS decline on a global scale during 2006–2015 (Figure 1A). In other words, mountain glacier melting accounts for almost half of the TWS decline in the major mountains of the Earth. Other storage factors (groundwater, rivers, global wetlands, local lakes and reservoirs and so on) account for 51% of TWS changes (Figure 1A), but each storage factor plays a different role in various regions (Rodell et al., 2018).
4.2 Regional contribution
Glaciers are mainly distributed in high-altitude mountain areas. To better understand the impact of glaciers on TWS, we choose six mountain regions to quantitatively assess the contribution of glaciers to TWS changes (Figure 1A). All mountain regions have mass losses indicated by most of GRACE products (Supplementary Figure S1). The impact of glacier melting on TWS changes shows significant spatial heterogeneity. There are greater contributions of glacier changes to TWS changes in the Third Pole and surroundings (TPs, 41%) and in Central Europe (CE, 30%) owing to a large proportion of glaciers, while smaller in Caucasus and Middle East (CME, 3%) and Low Latitudes (LL, 1%) due to less glacier coverage. In Western Canada and United States (WCU), both TWS and glacier changes display opposite variability, so the contribution of glacier changes to TWS changes is negative (−23%). In the Southern Andes (SA), the glacier and TWS changes are −25 and −3.43 Gt yr−1, respectively. The TWS changes are far less than the changes in glacier mass due to a large glacier coverage, appeared in Rodell et al. (2018). So the contribution is 728% in this region. The glacier melting can be converted to storage of soil, lakes and reservoirs (Figure 1B). In short, the contribution of glaciers to TWS is not negligible in the glacier-covered mountain regions.
To better clarify the relationship between TWS and each storage component in the mountain regions, mass-budget estimates of storage components are bias corrected based on GRACE TWS results. Bias-corrected storage components in six regions are shown in Figure 1B. Each storage component plays different roles in different regions (Supplementary Figure S4). In CE, the glacier and snow are the main factors to cause a TWS decrease as indicated by a positive effect (Supplementary Figure S4), but the opposite is true for groundwater. The soil moisture increases together with river runoff increase caused by precipitation increase offset the TWS decrease. The glacier mass decrease, far greater than other factors, is the main factor to influence TWS decline in SA, and then supporting the increase of other storage components and offsetting the TWS decline. In CME, a significant decline in the groundwater, resulted from a combination of recent drought and consequent increases in groundwater demand, is the main factor of TWS decrease, and the glacier and other factors have a small influence on the TWS decline. In TPs, except for the glacier melting, the sharp decline in groundwater is an important factor for the TWS decrease, while the increased storage in rivers, reservoirs and soil were most likely caused by the glacier melting. The influence of glacier changes in LL seems to be negligible, while the water storage decline in rivers, groundwater, soils and reservoirs, due to decreased precipitation (Table 1), is the main factor for the TWS decrease. Previous studies find that the groundwater changes, drought and glacier retreating lead to TWS changes in parts of WCU (Rodell et al., 2018), which is demonstrated again in this study. Both glacier and TWS have opposite variations, and nearly all storage factors except for glaciers display increase trends and are helpful to TWS increase. The changes in groundwater, lakes and wetlands are the main factors for TWS changes.
4.3 Watershed contribution
TPs, covered with the largest number of glaciers outside the Polar Regions, has unusually high spatial variability of glaciers induced by climate change (Huang et al., 2022), which affects the water discharge of large rivers (e.g., Liu et al., 2020) and the TWS changes (e.g., Wang et al., 2021). More and more attention has been paid to the influence of glacier melting on the surface water resources. Eight glacier-covered river basins are chosen to compare mass-budget changes of TWS and glaciers during 2003–2015 (Figure 2A). The mass changes of TWS display a decrease except for the Yangtze. And the mass changes of glaciers are negative except for the Tarim. Except for the Tarim and Yangzte basins, the glacier mass changes in other basins show positive effects on TWS changes. There are greater contributions of glacier changes to TWS changes in the Brahmaputra (53%), Indus (99.89%), Amu Darya (28%) and Ili (37%) basins than in the Ganges (13%) and Syr Darya (7%). For the Tarim and Yangtze basins, there are opposite trends in glaciers and TWS, which may be related to the glacier increase in the Kunlun Mountain and decreased precipitation in the Tarim basin, and less glacier melting and more increased precipitation in the Yangtze basin (Table 1), respectively. In addition, we find that the groundwater plays a key role in most of the river basins, especially around the southern TPs.
Bias-corrected mass changes of other storage components are presented in Figure 2B. The glacier mass changes have great contributions to TWS changes in most of the river basins, although the contribution rates vary with basins (Supplementary Figure S5). In the Amu Darya basin, the glacier-snow melting and storage decrease in lakes and reservoirs are an important factor in the TWS decline, likely owing to the decreased precipitation (Table 1). Conversely, the glacier-snow melting can replenish the increased water storage in rivers and soils in this basin. The mass budget changes in Ili are mainly influenced by glacier melting and decreased water storage in reservoirs and lakes. Storage decreases in soils, lakes and groundwater are the main reasons for TWS changes in the Syr Darya basin, while storage increase in reservoirs induced by human activities offsets the TWS decreases. For the Brahmaputra basin, the main influence factor is glacier melting, and others (groundwater, rivers, and snow) play a limited role. In the Ganges basin, the groundwater decline, extracted to irrigate crops (Rodell et al., 2018), is the main factor for TWS decreases, and the second is glacier-snow melting. In the Tarim basin, the glacier increases dictated the TWS decline, and the decrease of water storage in groundwater, snow and rivers had a positive influence on TWS decline. The influence of glacier changes on TWS is negligible in the Yangtze basin, while the reservoirs are the main factor to the TWS increases, and other factors induced by precipitation increases also contributed to the TWS increases. The TWS appears a decrease trend in the Indus basin in 2003–2015, agree well with results from Zhu et al. (2021), and the glacier mass changes are nearly equal to TWS decline and the influence from other factors is negligible (Supplementary Figure S5). In the other words, the glacier melting dominates the changes of TWS in this basin.
5 Conclusion and discussion
This work quantified the effect of glacier changes on TWS changes using multi-source datasets over mountain regions. TWS and glacier mainly present decreasing trends in the mountains, but the contribution rates of glacier changes to TWS changes are spatially heterogeneous. On a global scale, the glacial melting is equivalent to nearly half of the total TWS decline during 2006–2015. For regions and watersheds, the contribution rates range from −23% to 728%, −21% to 99%, respectively. There are larger contributions in more glacier-covered regions, while smaller in less glacier-covered regions. Except for glaciers, other storage components play a significant role in TWS changes.
Accurate accounting of changes surface water resources availability is essential for environmental and human demands, regionally sustainable development of society, especially for mountain regions and its downstream. With the global warming, mountain glacier has gradually become a non-ignorable factor affecting surface water resources. Previous studies projected that glaciers could almost disappear in some mountain ranges in this century with the present mass-loss rates, and thus, its contribution to TWS changes will become more and more important and then influences the changes in surface water resources.
It is worth mentioning that our study is limited by several factors. First, the glacier data and TWS data, although an improvement derived from reliable data and reasonable method, are still uncertain due to the lack of the validation from a large number of field observations. Second, our study period focuses on recent 10 years, which is not long enough to allow for an investigation into interannual or decadal variations. Third, the main factor to influence TWS changes is precipitation for most of regions. In our study, we investigated the influence from domain-averaged annual precipitation. But due to the different performance of precipitation data, five datasets display different trends. In the future research, precipitation data should be validated and then conclude the quantitative and unified precipitation trends. Fourth, the application of results is limited due to the restriction of our research in of space and time. The current results only give a quantitative understanding about the contribution of glacier changes to TWS changes around the mountain regions. Despite these limitations, our study improved accounting of changes in freshwater availability, providing new knowledge for integrated water resources management for mountain regions in the context of global changes.
Data availability statement
The original contributions presented in the study are included in the article/Supplementary Material, further inquiries can be directed to the corresponding author.
Author contributions
XL, methodology, data processing, writing—original draft. LW, conceptualization, methodology, review and editing. BH, methodology, and data processing. DC, review and editing. RL, data processing.
Funding
This study was supported by the National Natural Science Foundation of China (Grant Nos 41988101 and 92047301), and the Second Tibetan Plateau Scientific Expedition and Research Program (2019QZKK0206).
Conflict of interest
The authors declare that the research was conducted in the absence of any commercial or financial relationships that could be construed as a potential conflict of interest.
Publisher’s note
All claims expressed in this article are solely those of the authors and do not necessarily represent those of their affiliated organizations, or those of the publisher, the editors and the reviewers. Any product that may be evaluated in this article, or claim that may be made by its manufacturer, is not guaranteed or endorsed by the publisher.
Supplementary material
The Supplementary Material for this article can be found online at: https://www.frontiersin.org/articles/10.3389/feart.2023.1134910/full#supplementary-material
References
Adler, R. F., Sapiano, M., Huffman, G. J., Wang, J. J., Gu, G., Bolvin, D., et al. (2018). The global precipitation climatology project (GPCP) monthly analysis (new version 2.3) and a Review of 2017 global precipitation. Atmosphere 9 (4), 138. doi:10.3390/atmos9040138
Bahrami, A., Goïta, K., and Magagi, R. (2020). Analysing the contribution of snow water equivalent to the terrestrial water storage over Canada. Hydrol. Process. 34, 2007–2008. doi:10.1002/hyp.13725
Brun, F., Berthier, E., Wagnon, P., Kaab, A., and Treichler, D. (2017). A spatially resolved estimate of high mountain Asia glacier mass balances from 2000 to 2016. Nat. Geosci. 10, 668–673. doi:10.1038/ngeo2999
Döll, P., Müller Schmied, H., Schuh, C., Portmann, F. T., and Eicker, A. (2014). Global-scale assessment of groundwater depletion and related groundwater abstractions: Combining hydrological modeling with information from well observations and GRACE satellites. Water Resour. Res. 50, 5698–5720. doi:10.1002/2014wr015595
Hock, R., Rasul, G., and Adler, C. (2019). “High Mountain areas,” in IPCC special report on the Ocean and Cryosphere in a changing climate. Editors D. C. Roberts, V. Masson-Delmotte, P. Zhai, M. Tignor, E. Poloczanska, K. Mintenbecket al. (Beijing: China Press).
Hu, B. Y., Wang, L., and Li, X. P. (2020). Divergent changes in terrestrial water storage across global arid and humid basins. Geophys. Res. Lett. 47, e2020GL091069.
Huang, L., Hock, R., Li, X., Bolch, T., Yang, K., Wang, N., et al. (2022). Winter accumulation drives the spatial variations in glacier mass balance in High Mountain Asia. Sci. Bull. 67, 1967–1970. doi:10.1016/j.scib.2022.08.019
Huang, W., Duan, W., and Chen, Y. (2021). Rapidly declining surface and terrestrial water resources in Central Asia driven by socio-economic and climatic changes. Sci. Total Environ. 784, 147193.
Huffman, G. J., Adler, R. F., Arkin, P., Chang, A., Ferraro, R., Gruber, A., et al. (1997). The global precipitation climatology project (GPCP) combined precipitation dataset. Bull. Amer. Meteor. Soc. 78, 5–20. doi:10.1175/1520-0477(1997)078<0005:tgpcpg>2.0.co;2
Immerzeel, W. W., Lutz, A. F., Andrade, M., Bahl, A., Biemans, H., Bolch, T., et al. (2020). Importance and vulnerability of the world’s water towers. Nature 577, 364–369. doi:10.1038/s41586-019-1822-y
Jacob, T., Wahr, J., Pfeffer, W. T., and Swenson, S. (2012). Recent contributions of glaciers and ice caps to sea level rise. Nature 482, 514–518. doi:10.1038/nature10847
Li, X. Y., Long, D., Scanlon, B. R., Mann, M. E., and Tian, F. (2022). Climate change threatens terrestrial water storage over the Tibetan Plateau. Nat. Clim. change 12, 801–807. doi:10.1038/s41558-022-01443-0
Liu, Z. F., Yao, Z. J., Wang, R., and Yu, G. A. (2020). Estimation of the Qinghai-Tibetan Plateau runoff and its contribution to large Asian rivers. Sci. Total Environ. 749, 141570. doi:10.1016/j.scitotenv.2020.141570
Markus, Z., Andreas, B., and Peter, F. (2011). GPCC first guess product at 1.0°: Near real-time first guess monthly land-surface precipitation from rain-gauges based on SYNOP data. Theor. Appl. Climatol. 115, 15–40. doi:10.5676/DWD_GPCC/FG_M_100
Masaki, Y., Hanasaki, N., Biemans, H., Schmied, H. M., Tang, Q., Wada, Y., et al. (2017). Intercomparison of global river discharge simulations focusing on dam operation-multiple models analysis in two case-study river basins, Missouri–Mississippi and Green–Colorado. Environ. Res. Lett. 12, 055002. doi:10.1088/1748-9326/aa57a8
Müller, S. H., Cáceres, D., and Eisner, S. (2021). The global water resources and use model WaterGAP v2.2d: Model description and evaluation. Geosci. Model Dev. Discuss. 14, 1037–1079. doi:10.5194/gmd-14-1037-2021
Muñoz Sabater, J. (2019). ERA5-Land monthly averaged data from 1981 to present, copernicus climate change service (C3S) climate data store (CDS). Berlin, Germany: Springer. doi:10.24381/cds.68d2bb3
Pfeffer, W., Arendt, A., Bliss, A., Bolch, T., Cogley, J. G., Gardner, A. S., et al. (2014). The randolph glacier inventory: A globally complete inventory of glaciers. J. Glaciol. 60, 537–552. doi:10.3189/2014jog13j176
Reager, J. T., Gardner, A. S., Famiglietti, J. S., Wiese, D. N., Eicker, A., and Lo, M. H. (2016). A decade of sea level rise slowed by climate-driven hydrology. Science 351, 699–703. doi:10.1126/science.aad8386
RGI Consortium (2017). Randolph Glacier inventory – a dataset of global glacier outlines: Version 6.0: Technical report, global land ice measurements from space. Colorado, USA: Digital Media. doi:10.7265/N5-RGI-60
Rodell, M., Famiglietti, J. S., Wiese, D. N., Reager, J. T., Beaudoing, H. K., Landerer, F. W., et al. (2018). Emerging trends in global freshwater availability. Nature 557, 651–659. doi:10.1038/s41586-018-0123-1
Sheffield, J., Goteti, G., and Wood, E. F. (2006). Development of a 50-year high-resolution global dataset of meteorological forcings for land surface modeling. J. Clim. 19 (13), 3088–3111. doi:10.1175/jcli3790.1
Vaughan, D. G., Comiso, J. C., and Allison, I. (2013). “Observations: Cryosphere,” in Climate change 2013: The physical science basis, contribution of working group I to the fifth assessment report of the intergovernmental Panel on climate change (Cambridge: Cambridge University Press), 317–382.
Viviroli, D., Archer, D. R., Buytaert, W., Fowler, H. J., Greenwood, G. B., Hamlet, A. F., et al. (2011). Climate change and mountain water resources: Overview and recommendations for research, management and policy. Hydrology Earth Syst. Sci. 15, 471–504. doi:10.5194/hess-15-471-2011
Wada, Y., Lo, M., Yeh, P. J. F., Reager, J. T., Famiglietti, J. S., Wu, R. J., et al. (2016). Fate of water pumped from underground and contributions to sea-level rise. Nat. Clim. Change 6, 777–780. doi:10.1038/nclimate3001
Wang, J., Song, C., Reager, J. T., Yao, F., Famiglietti, J. S., Sheng, Y., et al. (2018). Recent global decline in endorheic basin water storages. Nat. Geosci. 11, 926–932. doi:10.1038/s41561-018-0265-7
Wang, J. R., Chen, X., Hu, Q., and Liu, J. (2020). Responses of terrestrial water storage to climate variation in the Tibetan Plateau. J. Hydrology 584, 124652. doi:10.1016/j.jhydrol.2020.124652
Wang, L., Yao, T. D., Chai, C. H., Cuo, L., Su, F., Zhang, F., et al. (2021). TP-River: Monitoring and quantifying total river runoff from the Third Pole. Bull. Am. Meteorological Soc. 102, 948–965. doi:10.1175/bams-d-20-0207.1
Zemp, M., Huss, M., Thibert, E., Eckert, N., McNabb, R., Huber, J., et al. (2019). Global glacier mass changes and their contributions to sea-level rise from 1961 to 2016. Nature 568, 382–386. doi:10.1038/s41586-019-1071-0
Zhao, F., Veldkamp, T., Frieler, K., Schewe, J., Ostberg, S., Willner, S., et al. (2017). The critical role of the routing scheme in simulating peak river discharge in global hydrological models. Environ. Res. Lett. 12, 075003. doi:10.1088/1748-9326/aa7250
Keywords: terrestrial water storage, mountain glacier, global hydrological model, GRACE satellite, contribution
Citation: Li X, Wang L, Hu B, Chen D and Liu R (2023) Contribution of vanishing mountain glaciers to global and regional terrestrial water storage changes. Front. Earth Sci. 11:1134910. doi: 10.3389/feart.2023.1134910
Received: 31 December 2022; Accepted: 15 February 2023;
Published: 27 February 2023.
Edited by:
Weili Duan, Xinjiang Institute of Ecology and Geography (CAS), ChinaReviewed by:
Zhaofei Liu, Institute of Geographic Sciences and Natural Resources Research (CAS), ChinaHongyi Li, Northwest Institute of Eco-Environment and Resources (CAS), China
Copyright © 2023 Li, Wang, Hu, Chen and Liu. This is an open-access article distributed under the terms of the Creative Commons Attribution License (CC BY). The use, distribution or reproduction in other forums is permitted, provided the original author(s) and the copyright owner(s) are credited and that the original publication in this journal is cited, in accordance with accepted academic practice. No use, distribution or reproduction is permitted which does not comply with these terms.
*Correspondence: Lei Wang, d2FuZ2xlaUBpdHBjYXMuYWMuY24=