 Xuehui Liu
 Lei Yang
94% of researchers rate our articles as excellent or good
Learn more about the work of our research integrity team to safeguard the quality of each article we publish.
Find out more
ORIGINAL RESEARCH article
Front. Earth Sci., 25 September 2023
Sec. Interdisciplinary Climate Studies
Volume 11 - 2023 | https://doi.org/10.3389/feart.2023.1134523
This article is part of the Research TopicEnergy, Economy, and Climate Interactions: Challenges and Opportunities, volume IIView all 13 articles
At present, the high energy consumption of data centers based on grid power supply not only brings huge direct cost of electricity, but also indirectly produces a lot of greenhouse gases, which affects the natural environment. Academia and industry are beginning to introduce clean renewable energy sources such as wind and solar power into data centers to reduce operating costs and environmental damage by building new green data centers. To solve this problem, this study considers the use of waste heat for refrigeration while taking natural gas power generation into account, and introduces wind energy as a green energy source. On the premise of considering the response level of data centers, the two resources are combined and deployed to improve resource utilization and reduce energy consumption costs. Aiming at the instability of wind power generation, a particle swarm energy scheduling optimization algorithm based on simulated annealing algorithm was proposed by combining simulated annealing algorithm and particle swarm optimization algorithm. The research shows that, considering the response level of data centers, the use of natural gas and wind energy as the main energy supply can effectively reduce the overall energy consumption of data centers.
Data centers can provide resource services and application services such as data computing, storage and exchange, and have become the cornerstone of global economic development. According to the latest data from Synergy Research Group, the total number of large-scale data centers rose to 597 by the end of 2020, doubled the number in 2015. Data center is a building site that provides operating environment for centralized electronic information equipment. It must ensure uninterrupted operation for 8760 h a year, and has the characteristics of large heat dissipation, stable operation, high reliability, and high requirements on air temperature, humidity and cleanliness. Data center requires a large amount of power resources, data centers around the world consumed 200 terawatt hours per year in 2018 (Jones, 2018), which was estimated to account for 1.4% of global power consumption and is expected to reach 5% of global power consumption by 2024 (Avgerinou et al., 2017). The power consumption of data centers is mainly composed of four parts: IT equipment, air conditioning system, lighting system, power supply and distribution system. The energy consumption of IT equipment accounts for about 45%, and that of air conditioning system accounts for about 40% (Gandhi et al., 2012; Vasques et al., 2019). More than 99% of the electricity used to power IT equipment is converted to heat energy. If the excess heat energy is not removed in time, the temperature will rise and result in IT equipment faults or even fires. Therefore, data centers need to be equipped with air conditioning systems to control the device temperature within a certain range. This ensures the stable operation of IT equipment and the optimal performance of the devices in the data center throughout their life cycle. There are a variety of temperature management methods in data centers, such as air cooling (Parolini et al., 2012; Li et al., 2012), water cooling (Xu, 2007), immersion cooling (Yao et al., 2017), etc. Air cooling uses air circulation and air conditioning technology to eliminate the heat generated by data centers. Due to its simplicity and low cost, it has become the most common temperature management method in the data center industry at present.
In order to reduce the consumption of fossil energy in the operation of data centers, enterprises begin to build green data centers, which use renewable energy such as wind and solar energy to supply part or all of the electric energy of data centers, so as to reduce carbon dioxide emissions. However, large-scale data centers are often built in remote areas with wide areas, sparse population and good climate, which are usually rich in solar and wind energy resources. For example, Amazon has built its largest wind farm in Texas, which can produce more than 1 million megawatt hours of energy per year to power its data centers. Green House Data built a wind power plant in Wyoming to power the data center, which can reduce costs and carbon emissions from a global perspective, and has great economic and environmental significance (Goiri Í et al., 2013).
As data volumes proliferate, researchers realize that the advantages of data centers are becoming apparent, so more work is being devoted to the question of how to enhance the energy use of data center networks. Researchers try to use more and more renewable energy equipment to increase new energy to provide energy, and reduce the use of thermal power generation energy (Bi et al., 2016). Li and Hu et al. proposed that energy storage devices could be used to use wind energy in different time domains (Li et al., 2017), and batteries could be used to store solar energy in the daytime and provide power to data centers at night when users are frequently active (Chao et al., 2013; Li et al., 2014), thus reducing carbon emissions of data centers. For data centers equipped with unstable new energy sources such as wind and solar, as well as non-green energy sources such as diesel generators, how to allocate different energy ratios to meet the needs of reliability, environmental protection and economy is a key issue. Kong and Liu proposed Green Planning (Kong et al., 2016), an energy allocation scheme that minimizes the total energy consumption cost and carbon emission cost during the life cycle of data centers. Ren and Wang et al. also proposed an energy allocation scheme that minimizes the total energy consumption cost and limits the total carbon emission during the life cycle of data centers (Ren et al., 2012). Deng and Stewart et al. took carbon emissions generated by energy combustion as part of the application cost from the perspective of application. By studying how to make reasonable and effective resource allocation for data centers with multiple energy sources, they can minimize the use of purchased thermal power from the grid (Deng et al., 2012). Tripathi and Vignesh et al. designed a mixed integer linear programming model for resource planning and total cost minimization of distributed green data centers, it could minimize the cost of server deployment and power usage while minimizing the consumption of renewable energy. The results show that the adoption of green energy can reduce carbon emission and total cost (Tripathi et al., 2017). Deng and Liu et al. studied various types of power supply systems of data centers and designed online control strategies according to the characteristics of different energy sources, so as to reduce the operating costs of power supply systems of data centers (Deng et al., 2013). Ren and Wang et al. took the renewable energy generation, dynamic electricity price and operation cost of energy storage equipment in data centers into account to propose an optimization strategy aiming at minimizing the cost of data centers. Their research results showed that by including renewable energy in the power capacity planning of data centers could minimize the operating cost while reducing the carbon emission of data centers (Ren et al., 2012).
At present, a lot of research work focuses on the design of data centers with green energy as the main power source, and a green computing platform has been built accordingly to further analyze the availability of new energy power supply and the effectiveness of power resource management strategies. Goiri and Bianchini at Rutgers University had been working on new energy data center management in a batch-load environment and proposed the Green Slot parallel batch scheduler, in which the server system was powered by a solar array with grid power as backup power. Green Slot first predicted the solar energy supply based on historical data and weather forecast, and then allocated enough resources for the load to be processed in the future according to forecast information and user information, so as to meet the latest completion time of batch processing tasks and maximize the utilization of new energy (Goiri et al., 2012). Later, the team designed a solar powered data center called Parasol as a research platform. In addition to power grid and solar power system, Parasol was also equipped with backup battery system, air refrigeration unit and air conditioning (Goiri I. et al., 2013). Carroll and Balasubramaniam et al. gave out a dynamic optimization solution of green data service, which took weather, geographical location of data center and other factors affecting the output power of renewable energy into consideration for prediction by using genetic algorithm (Carroll et al., 2011). Zhang and Wang et al. studied how to dynamically allocate service requests among data centers in different geographical locations according to local weather conditions in order to maximize the use of renewable energy (Zhang et al., 2011). Arlitt and Bash et al. put forward the model of “net zero energy data center”, which offset the energy consumed in the construction and operation of data center with the utilization of clean energy, and built a prototype system as a test platform (Arlitt et al., 2012).
Distributed energy, represented by natural gas combined cooling and thermal power supply system has high efficiency, cleanliness and reliability due to its characteristics of cascade utilization of energy, which can effectively reduce the primary energy consumption of data centers (Xu and Qu, 2013). At present, many studies have proved the feasibility and reliability of using distributed energy system to power data centers. Sevencan and Lindbergh et al. comprehensively analyzes the energy efficiency, economic and environmental characteristics of the combined cooling, thermal and electric power supply system applied in data centers, and the results show that the stable load demand and low electric-cooling ratio of data centers make it a better match with the combined power supply system, and the operation cost can be reduced by 54% (Sevencan et al., 2016). However, due to the limited thermoelectric ratio of the system, it often does not match the dynamic load of the user, resulting in the low utilization rate of the system equipment, poor adaptability and other problems. In order to improve its characteristics, coupled with the deepening of the energy Sustainable Development Goals, the use of renewable energy technologies such as solar and wind power, as well as storage Settings, is also increasing in data centers. However, due to the fluctuation and randomness of renewable energy, instability factors are brought to the planning and operation of cold, hot and electricity combined power supply system (Zheng et al., 2021). Therefore, most studies prefer to adopt complementary ways to power data centers, improve the utilization rate of renewable energy and reduce the consumption of fossil fuels. Sheme et al. demonstrated the possibility of using renewable energy for power supply in data centers at 60° north latitude, and the results showed that natural gas, solar energy and wind power generation could achieve higher economic benefits and better stability through collaboration (Sheme et al., 2018)
The combination of task scheduling algorithm with data center green energy consumption is also a research hotspot in recent years. Tu and Yao et al. adopted load scheduling and alternative energy supply strategies to reduce energy consumption expenses of cloud data centers (Tu et al., 2013; Yao et al., 2014). Kumar and Aujla et al. proposed a green energy sensing task scheduling and classification method based on container technology, which transmit the arrived tasks from multiple devices to the data center and provided enough green available energy. On this basis, a container integration and host specification method based on green energy was proposed (Kumar et al., 2019). Khosravi and Andrew et al. proposed a variety of effective virtual machine layout methods to evaluate the actual performance of virtual machines, and determined the parameters that have the greatest impact on fossil raw materials, green energy consumption, cost and carbon footprint (Khosravi et al., 2017). Li and Qouneh et al. proposed an energy switcher to coordinate the request load and new energy supply by constantly switching between new energy and traditional power grids, so as to maximize the use of new energy (Li et al., 2011). The task scheduler GreenSlot proposed by Goiri and Le et al. which could carry out scientific calculation, and the task scheduler GreenHadoop processing distributed big data both considered the fluctuation of power grid price and solar energy supply (Goiri et al., 2012). And their goal was to achieve green, low-cost task scheduling under the condition of meeting task deadlines. Krioukov and Goebel et al. proposed a supply-following method for task scheduling, so as to balance task load and wind energy supply and realize green data center scheduling (Krioukov et al., 2011). Aksanli and Venkatesh et al. proposed a new energy prediction algorithm, which carried out task scheduling based on the predicted new energy output, so as to improve the utilization rate of new energy (Aksanli et al., 2011). Gmach and Rolia et al. proposed a solution to estimate the power capacity of data centers based on the output of new energy and the requested load. This solution provided the reference basis of the power supply of different sources, so as to achieve the supply and demand balance between new energy and the requested load (Gmach et al., 2010).
Through literature review, it can be found that the combination of green energy and data center energy consumption, and the effective scheduling of green energy as a supplement to traditional energy is the hot spot of current research. Particle swarm optimization (PSO) is a representative energy consumption scheduling method for data centers. However, existing researches mainly analyze from the perspective of consumption, and rarely consider the supply optimization of different forms of energy, as well as the combination of data service load allocation and green energy scheduling. Therefore, this paper proposes to consider the coordination of natural gas power generation and wind power generation, and at the same time use the waste heat of natural gas power generation to drive refrigeration, and the dual-objective scheduling model of data center energy consumption under the situation, the simulated annealing particle swarm optimization algorithm is used to solve the model, and the simulation is conducted. The results show that the combination of natural gas and wind power generation, In this way, the overall power consumption of data centers can be reduced without ensuring the service level of data centers.
The data center obtains electricity through natural gas power generation and wind power generation. Considering the instability caused by wind power volume, it needs to charge the battery after the charger rectification and then use the inverter power supply with protection circuit to convert the chemical energy in the battery into alternating current, so as to ensure the stable use. The gas turbine is used to burn natural gas to generate electricity and drive the receiver refrigeration unit to refrigerate, so as to reduce the temperature of the data center.
(1) Gas turbine
Gas turbine is a kind of internal combustion power machinery which uses continuous flow of gas as working medium to drive impeller to rotate at high speed and convert fuel energy into useful work. The air is compressed by the compressor, mixed with light fuel and introduced into the combustion chamber for full combustion to generate high temperature and high-pressure gas, thus driving the rotation of the generator and generating electric energy. The excess high temperature gas is refrigerated by the absorption refrigeration unit to improve the energy utilization rate (Mansourim et al., 2012), and its output power is expressed as:
GGT and PGT are the input gas power and output electric power of the gas turbine respectively, λ is the energy conversion efficiency.
(2) Absorption refrigeration unit
Absorption refrigeration units refrigerate by absorbing waste heat in gas turbine system, so as to meet the cooling load requirements of data centers. Lithium bromide and water are generally used as catalysts for refrigeration. The lithium bromide absorption chiller can be combined with the gas turbine to use the exhaust steam of the gas turbine as the heating steam of the lithium bromide absorption chiller, which can improve the utilization rate of water steam and meet the requirements of power generation and refrigeration at the same time (Liu and Wang, 2004). Its mathematical model is:
CGC is the cooling capacity of lithium bromide absorption refrigerating machine; η is the recovery rate of waste heat, which is related to room temperature and can reach 0.65 at present. ξ is the refrigeration coefficient of unit; QGT is waste heat generated by gas turbine, and its value can be expressed as:
λ1 is the heat loss coefficient of gas turbine, and the fixed value λ1=0.03 is usually taken (Misra et al., 2005).
(3) Wind power generation
Wind power as a clean energy source can be used to power data centers. In the process of wind power generation, the fan blade rotates under the thrust action of air inflow, and the low-speed shaft connected to the blade drives the high-speed shaft to rotate through the gearbox, which drives the generator to generate electric energy (Muljadi and Butterfield, 2001). According to Baez theory, the mechanical power captured by the wind turbine from the wind is
(4) Electric refrigerator
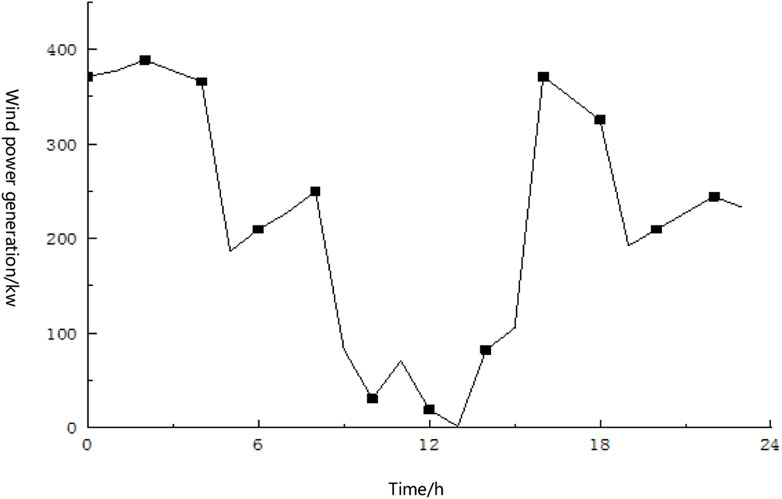
FIGURE 1. Typical daily wind power curve of data center. The wind power at each moment shall not exceed ±10% of the typical value at that moment and add the disturbance value.
Electric refrigerating machine uses the electric energy generated by gas unit and wind power generation to drive the compression refrigeration unit to refrigerate. The compression refrigeration unit is a refrigeration equipment that converts electric energy consumption into cold energy. By absorbing and compressing the gas in the evaporator, the high temperature and high-pressure gas is transported into the condenser, and the heat is released in the condenser to form high pressure and low temperature gas. The gas is depressed to low temperature and low pressure through the throttle, and finally absorbs excess heat in the evaporator to form cold gas. Its mathematical model is as follows:
CEC is the output cold power of electric refrigerator, PEC is input power for electric refrigerator, γ is the energy conversion efficiency.
(5) Data center power consumption model
The power consumption of a data center is linearly correlated with the number of active servers in the center (Liu et al., 2022).
Server is a device that processes data load, and the time delay of data processing is related to the average service rate and number of servers. Its model can be expressed as:
μ is the average service rate of the active server, Li,t is the total data load allocated to data center i at time t; D is the upper limit of time delay for data centers to process data loads.
After sorting out the above formula, the power consumption model of data center can be expressed as follows:
In Eq. 8, although the number of active servers
Combining the first and third items of Eq. 8, we can get:
To sum up, Eqs 9, 10 are power consumption models of data centers.
(1)The upper-layer scheduling model
The upper layer of the optimal scheduling model of energy hub in data center is the energy consumption cost model, whose objective function is the minimum system operation cost, including energy purchase cost and unit operation and maintenance cost. The objective function is:
① Constraints on power balance in system operation
②The unit output limit
(2) The lower-level scheduling model
The objective function of the lower model is to minimize the total power consumption of data distribution load and the total delay time of data processing.
In the formula, ω1、ω2 are the weight coefficients of the two objectives. The constraints of the lower model include the constraint on the number of servers in the data center and the delay constraint. For specific formulas, it can refer to Eqs. 8–10.
(3) Solution Method
According to the characteristics of the model, adaptive simulated annealing particle swarm optimization was used to solve the dual-objective scheduling model. Particle swarm optimization (PSO) algorithm is a swarm intelligence optimization algorithm inspired by the foraging behavior of birds (Kennedy and Eberhart, 1995). This algorithm initializes a set of solutions randomly, and then updates these solutions iteratively to find the optimal solution of the problem within a limited number of iterative steps. The idea of simulated annealing comes from the principle of physical annealing of solid materials. The particles inside will release their internal energy with the gradual decrease of temperature, which gradually makes the particles tend to order. Particle swarm optimization mainly relies on competition and cooperation between groups, so in the initial stage of operation, the algorithm convergence speed is fast, but particle swarm optimization is easy to fall into the local optimal, low precision, which leads to the ability of particle swarm optimization to obtain the global optimal solution is weak. The simulated annealing algorithm has asymptotic convergence. As long as the initial temperature is high enough and the annealing process is slow enough, the algorithm will converge to the global optimal solution with 100% probability in theory. By combining the two methods, the search process selects the probability transform particle flight direction according to the designed simulated annealing, and the central particle leads the particle flight search, so as to avoid the search process falling into the local optimal region, so as to improve the search efficiency and accuracy of the optimal solution, and effectively solve the perturbation problem in reality. The algorithm of the research object in this paper has a small search space, which overcomes the shortcomings of the simulated annealing algorithm which takes a long iteration time to converge to a high-quality approximate optimal solution and has a slow convergence speed. Meanwhile, the asymptotic convergence of the simulated annealing algorithm is consistent with the characteristics of wind power generation, which can better simulate the comprehensive energy consumption change proposed by this model.
In this paper, in the Matlab 2019a language environment, Gurobi solver is used to solve the two-layer model. Combined with the model construction above, the energy scheduling process of data centers is described as follows.
Step 1. : The user requests computing services from the data center.
Step 2. : Data center Calculate the configuration solution based on customer requirements, data center server usage, server distribution, and data center energy consumption cost.
Step 3. : Provide solutions based on user computing requirements, such as response time, transmission speed, and delay time.
Step 4. : Calculate the server resources and energy resources that can be scheduled based on the user’s service requirements and input them into the green energy scheduling model of the data center.
Step 5. : The lower layer model aims to calculate the minimum total power consumption of the load and the minimum total delay time. Considering the data service requirements of users and the load distribution of data center servers, the energy consumption requirements are determined and uploaded to the upper layer model.
Step 6. : After receiving the server scheduling policy developed by the lower-layer model, the upper-layer model ensures that the energy consumption policy required by the lower-layer service has the minimum deviation from the upper-layer energy consumption scheduling plan. After several iterations, the data center energy supply scheduling plan is output when the result meets the requirements.
The pseudo-code of scheduling model is as following:
1: Algorithm input: particle number
2: Algorithm output: global optimal position
3: Generate
4:
5:
6:
7: While
8: for
9: for
10:
11:
12:
13:
14:
15: if
16:
17: else
18:
19: if
20:
21: endfor
22: calculate
23: if
24:
25: else
26:
27: endfor
28: find the best
29:
30: enddo
(1) Model parameter setting
In order to verify the effectiveness of the proposed model, the data center of Gansu Province is selected as the simulation example. The data center of this province is rich in wind energy and solar energy resources and convenient in obtaining natural gas, which conforms to the research design of this paper. The dispatching cycle is 24 h a day.
Operating efficiency, maintenance cost, output interval and other parameters of different equipment are different, and these parameters will have an impact on the value of the objective function. Therefore, we use conventional settings for reference and the assignment of relevant parameters is shown in Table 1.
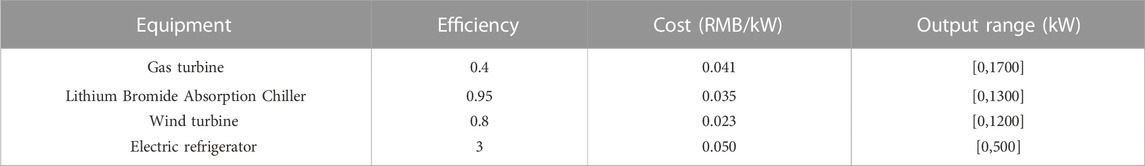
TABLE 1. Equipment operating parameter.
In this study, natural gas power generation and wind power generation are used as energy sources for data centers. The prices of natural gas and wind power generation fluctuate in different periods, as shown in Table 2.
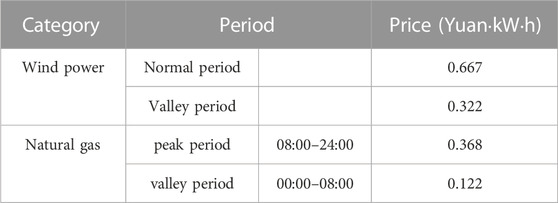
TABLE 2. Energy price.
According to the data load assigned to the data center, the power load consumed by the server varies. The 24-h analog data load generated by the whole random system is shown in Table 3, and the basic power load and cooling load are shown in Table 4.
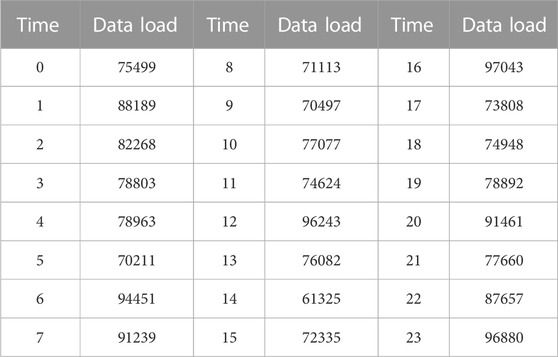
TABLE 3. Data load Simulated.
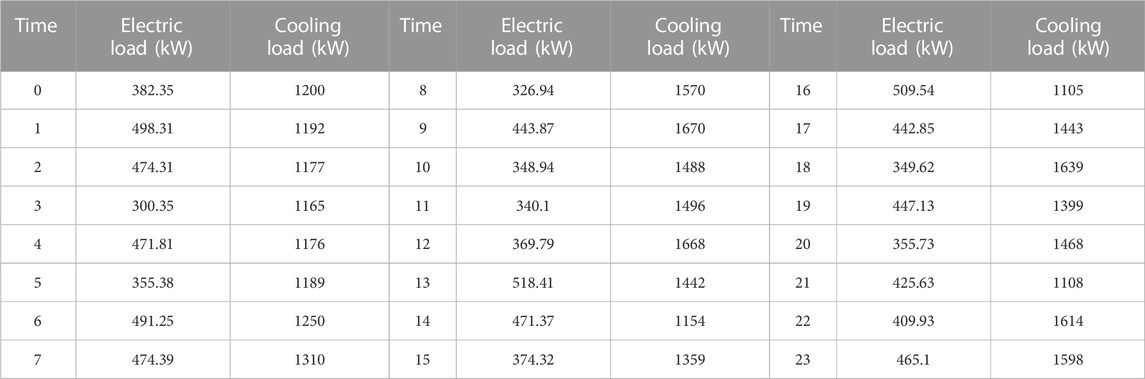
TABLE 4. Electrical load and cooling load in 24 h.
Considering the load distribution of computing demand, this study simulates three data centers to assume computing demand respectively, and data centers provide computing services according to the allocated computing demand. The hardware resources and cooling resources are also different, which leads to different electrical loads consumed by servers, thus affecting the overall energy consumption of data centers. Data center performance parameters and randomly generated 24-h simulated data load values are shown in Table 5.
(2) Simulation result
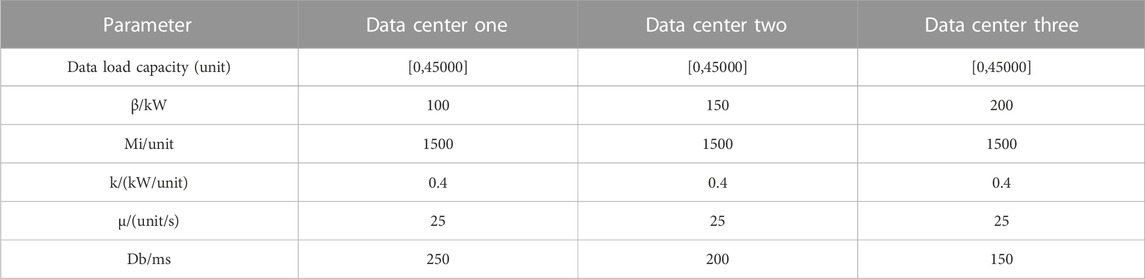
TABLE 5. Performance parameters of different data center.
Assign values to formulas 7 and 8 in accordance with Table 2, Table 3, and assign values to formulas (1)formulas –formulas (4) in accordance with Table 1, then substitute them into formula 11 and calculate from the third line of pseudo-code. The corresponding results can be obtained through simulation calculation. After simulation, the data load distribution and the number of servers used in each data center are shown in Table 6.
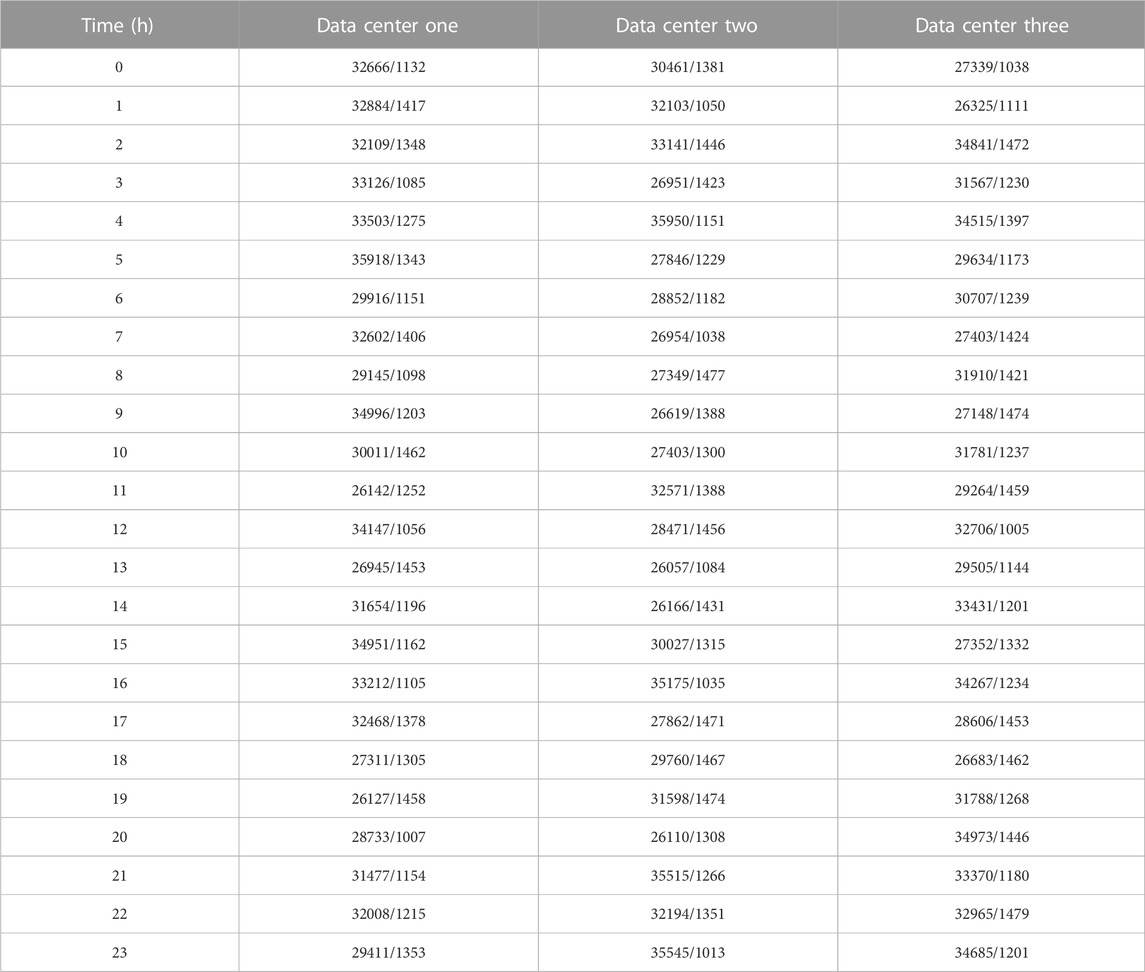
TABLE 6. Data center load and server allocation. The data before and after “/” in the table are the number of data loads allocated by each data center and the number of servers used respectively.
The purchased power of electricity and gas, the output of all energy conversion equipment and the output of energy storage device are shown in Figure 2, Figure 3, Figure 4.
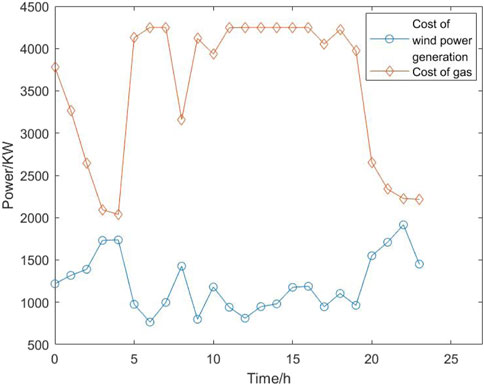
FIGURE 2. Cost of wind power generation and gas.
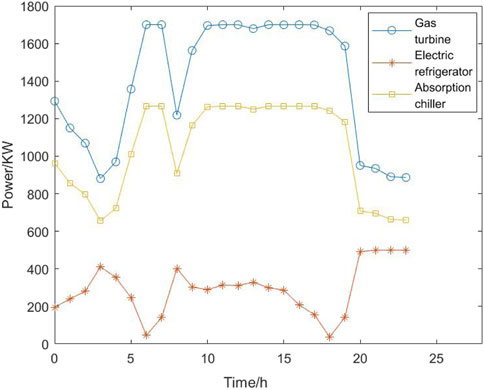
FIGURE 3. Output of energy conversion equipment.
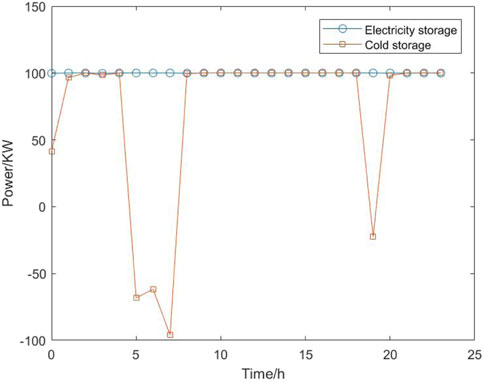
FIGURE 4. Output of electric storage equipment and cold storage equipment.
It can be seen from Figure 2 that due to the stable supply of natural gas, the cost of natural gas fluctuates relatively little within a day, and there is a stable period of time, while the cost of electric power generation fluctuates to a certain extent due to the disturbance brought by wind instability. In this case, natural gas should be used as the main energy supply mode, and energy storage should be adopted to effectively utilize wind energy, so as to ensure the data center computing service demand and cost requirements.
It can be seen from Figure 3 that output efficiency trends of natural gas power generation and refrigeration are basically similar. Therefore, it is necessary to make full use of natural gas as the main source of power supply and refrigeration for data centers to fully improve energy utilization efficiency. The effect of electric refrigeration has a certain correlation with the cost of electricity. In order to ensure the stability of the effect of electric refrigeration, it is necessary to ensure the stability of natural gas power generation at the same time, and use the stored wind power as an effective supplement when the price of natural gas fluctuates.
It can be seen from Figure 4 that the output level of the electric energy storage device is basically stable, which indicates that the energy of wind power generation can be effectively stored by batteries and continuously and stably output, while the output of the cold storage device fluctuates to a certain extent due to the dual influence of natural gas and electricity.
Although wind power generation has certain instability, the simulation after adding disturbance can find that it can still cooperate with natural gas and purchased electric energy as the energy supply of data centers, which is reflected in the reality that the refrigeration effect formed by it changes with the energy efficiency disturbance. However, the relatively stable natural gas function and the purchase of electric power function can effectively and smoothly input. Ensure the smooth running of the data center. And the main purpose of bringing in wind power is to reduce energy consumption. Meanwhile, by comparing with the author’s previous studies, it can be found that under the condition of the same computing power and response speed, this dispatching scheme can reduce the cost by 18.7% compared with the simple use of electricity and 10% compared with the combination of natural gas function and electricity purchase under the condition of guaranteeing the response speed. Therefore, the combination of wind power generation with natural gas and electricity purchase as the energy supply of data centers can not only ensure the service performance requirements of data centers, but also effectively reduce the cost of data centers.
Energy saving, cost reduction and carbon emission reduction are the main problems faced by data centers. Researchers begin to introduce clean renewable energy such as wind energy and solar energy into data centers for power supply, and reduce operating costs and environmental damage through the construction of new green data centers. However, in green data centers, the supply of new energy power and the demand for data calculation will each show significant and unrelated fluctuation characteristics over time. Therefore, data centers urgently need efficient scheduling methods to realize the match between load power demand and new energy power supply. In this paper, the computing demand distribution, green energy supply and energy scheduling problems of data centers are studied in combination. Wind power generation and natural gas power generation are used to provide operation and cooling power for data centers. Meanwhile, the waste heat of natural gas is used to drive the refrigeration of lithium bromide absorption refrigerating machine, so as to build the green energy supply and scheduling model and carry out simulation calculation. The results show that the model can effectively satisfy the computing response speed of data centers, ensure the normal operation of data center cooling and equipment, and reduce the cost of data center power by 18.7% compared with traditional energy sources.
The datasets presented in this article are not readily available. Requests to access the datasets should be directed to: yanglei2512@163.com.
XL: Literature review and theoretical model design. GH: Research concept generation and research fund acquisition. LY: Research thought design and simulation.
National Social Science Foundation excellent Doctoral Thesis Project (20FJYB031).
The authors declare that the research was conducted in the absence of any commercial or financial relationships that could be construed as a potential conflict of interest.
All claims expressed in this article are solely those of the authors and do not necessarily represent those of their affiliated organizations, or those of the publisher, the editors and the reviewers. Any product that may be evaluated in this article, or claim that may be made by its manufacturer, is not guaranteed or endorsed by the publisher.
Aksanli, B., Venkatesh, J., Zhang, L., and Rosing, T. (2011). “Utilizing green energy prediction to schedule mixed batch and service jobs in data centers,” in 4th workshop on power-aware computing and systems, 1–5. doi:10.1145/2094091.2094105
Arlitt, M., Bash, C., Blagodurov, S., Yuan, C., and Zhou, R. L. (2012). “Towards the design and operation of net-zero energy data centers,” in 13th intersociety conference on thermal and thermomechanical phenomena in electronic systems, 552–561.
Avgerinou, M., Bertoldi, P., and Castellazzi, L. (2017). Trends in data centre energy consumption under the European code of conduct for data centre energy efficiency. Energies 10 (10), 1470. doi:10.3390/en10101470
Bi, J., Yuan, H., Tan, W., and Li, B. H. (2016). Trs: Temporal Request Scheduling with bounded delay assurance in a green cloud data center. Inf. Sci. 360 (1), 57–72. doi:10.1016/j.ins.2016.04.024
Carroll, R., Balasubramaniam, S., Botvich, D., and Donnelly, W. (2011). “Dynamic optimization solution for green service migration in data centres,” in IEEE international conference on communications, 1–6. doi:10.1109/icc.2011.5963030
Chao, L., Yang, H., Ruijin, Z., Ming, L., Longjun, L., Jingling, Y., et al. (2013). “Enabling datacenter servers to scale out economically and sustainably,” in 46th annual IEEE/ACM international symposium on microarchitecture, 322–333. doi:10.1145/2540708.2540736
Deng, N., Stewart, C., Gmach, D., and Arlitt, M. (2012). “Policy and mechanism for carbon-aware cloud application,” in 2012 IEEE network operations and management symposium, 590–594. doi:10.1109/NOMS.2012.6211963
Deng, W., Liu, F., Jin, H., and Liao, X. (2013). “Online control of datacenter power supply under uncertain demand and renewable energy,” in Technical report for the submission to IEEE ICC. doi:10.1109/ICC.2013.6655227
Gandhi, A., Yuan, C., Gmach, D., Arlitt, M., and Marwah, M. (2012). Hybrid resource provisioning for minimizing data center SLA violations and power consumption. Sustain. Comput. Inf. Syst. 2 (2), 91–104. doi:10.1016/j.suscom.2012.01.005
Gmach, D., Rolia, J., Bash, C., Yuan, C., Christian, S. S., and Wang, Z. (2010). “Capacity planning and power management to exploit sustainable energy,” in International conference on network and service management, 96–103. doi:10.1109/CNSM.2010.5691329
Goiri, Í., Katsak, W., Le, K., Nguyen, D., and Bianchini, R. (2013a). Parasol and green switch: Managing datacenters powered by renewable energy. SIGARCH Comput. Archit. Acm Sigplan Not. 48 (4), 51–64. doi:10.1145/2499368.2451123
Goiri, I., Katsak, W. A., Le, K., Nguyen, T. D., and Bianchini, R. (2013b). “Parasol and green switch: Managing data centers powered by renewable energy,” in International conference on architectural support for programming languages and operating system, 51–64. doi:10.1145/2499368.2451123
Goiri, I., Le, K., Nguyen, T. D., Guitart, J., and Bianchini, R. (2012). “Green hadoop: Leveraging green energy in data-processing frameworks,” in European conference on computer systems, 57–70. doi:10.1145/2168836.2168843
Jones, N. (2018). How to stop data centres from gobbling up the world's electricity. Nature 561 (7722), 163–166. doi:10.1038/d41586-018-06610-y
Kennedy, J., and Eberhart, R. (1995). Particle swarm optimization. ICNN’95-international Conf. Neural Netw. 4, 1942–1948.
Khosravi, A., Andrew, L. L. H., and Buyya, R. (2017). Dynamic VM placement method for minimizing energy and carbon cost in geographically distributed cloud data centers. IEEE Trans. Sustain. Comput. 2 (2), 183–196. doi:10.1109/TSUSC.2017.2709980
Kong, F., Liu, X., and Rao, L. (2016). Green planning: Optimal energy source selection and capacity planning for green data centers. 7th ACM/IEEE Int. Conf. Cyber-Physical Syst. 5, 575–576. doi:10.1145/2637364.2592025
Krioukov, A., Goebel, C., Alspaugh, S., Chen, Y., and Katz, R. H. (2011). Integrating renewable energy using data analytics systems: Challenges and opportunities. IEEE Data Eng. Bull. 34 (1), 3–11.
Kumar, N., Aujla, G. S., Garg, S., Kaur, K., Rajan, R., and Garg, S. (2019). Renewable energy-based multi-indexed job classification and container management scheme for sustainability of cloud data centers. IEEE Trans. Industrial Inf. 15 (5), 2947–2957. doi:10.1109/TII.2018.2800693
Li, C., Hu, Y., Gu, J., and Li, T. (2017). Oasis: Scaling out datacenter sustainably and economically. IEEE Trans. Parallel & Distributed Syst. 28 (7), 1960–1973. doi:10.1109/TPDS.2016.2615625
Li, C., Qouneh, A., Li, T., and Liao, X. (2011). Stabilizing effects of impulses in discrete-time delayed neural networks. ACM SIGMETRICS Perform. Eval. Rev. 22, 323–329. doi:10.1109/TNN.2010.2100084
Li, C., Wang, R., Hu, Y., Zhou, R. J., Liu, M., Liu, L. J., et al. (2014). Towards automated provisioning and emergency handling in renewable energy powered datacenters. J. Comput. Sci. Technol. 29 (4), 618–630. doi:10.1007/s11390-014-1454-5
Li, S., Wang, S., Abdelzaher, T., Kihl, M., and Robertsson, A. (2012). Temperature aware power allocation: An optimization framework and case studies. Sustain. Comput. Inf. Syst. 2 (3), 117–127. doi:10.1016/j.suscom.2012.04.002
Liu, X. H., Hou, G. S., and Yang, L. (2022). Dynamic combined optimal scheduling of electric energy and natural gas energy consumption in data center. Discrete Dyn. Nat. Soc. 2022, 1–8. doi:10.1155/2022/3917170
Liu, Y. L., and Wang, R. Z. (2004). Performance prediction of a solar/gas driving double effect LiBr–H2O absorption system. Renew. Energy 29 (10), 1677–1695. doi:10.1016/j.renene.2004.01.016
Mansourim, T., Ahmadi, P., Kaviri, A. G., and Jaafar, M. N. M. (2012). Exergetic and economic evaluation of the effect of HRSG configurations on the performance of combined cycle power plants. Energy Convers. Manag. 58, 47–58. doi:10.1016/j.enconman.2011.12.020
Misra, R. D., Sahoo, P. K., and Gupta, A. (2005). Thermoeconomic evaluation and optimization of a double-effect H2O/LiBr vapour-absorption refrigeration system. Int. J. Refrig. 28 (3), 331–343. doi:10.1016/j.ijrefrig.2004.09.006
Muljadi, E., and Butterfield, C. P. (2001). Pitch-controlled variable-speed wind turbine generation. IEEE Trans. Industry Appl. 37 (1), 240–246. doi:10.1109/28.903156
Parolini, L., Sinopoli, B., Krogh, B. H., and Wang, Z. (2012). A cyber–physical systems approach to data center modeling and control for energy efficiency. Proc. IEEE 100 (1), 254–268. doi:10.1109/JPROC.2011.2161244
Ren, C., Wang, D., Urgaonkar, B., and Sivasubramaniam, A. (2012). “Carbon-Aware energy capacity planning for data centers,” in 20th IEEE international symposium on modeling, analysis and simulation of computer and telecommunication systems, 391–400. doi:10.1109/MASCOTS.2012.51
Sevencan, S., Lindbergh, G., Lagergren, C., and Alvfors, P. (2016). Economic feasibility study of a fuel cell-based combined cooling,heating and power system for a data centre. J]. Energy Build. 111, 218–223. doi:10.1016/j.enbuild.2015.11.012
Sheme, E., Holmbacka, S., Lafond, S., Lučanin, D., and Frashëri, N. (2018). Feasibility of using renewable energy to supply data centers in 60°north latitude[J]. Sustain. Comput. Inf. Syst. 17, 96–106. doi:10.1016/j.suscom.2017.10.017
Tripathi, R., Vigneshm, S., and Tamarapalli, V. (2017). Optimizing green energy, cost, and availability in distributed data centers. IEEE Commun. Lett. 21 (3), 500–503. doi:10.1109/LCOMM.2016.2631466
Tu, J., Lu, L., Chen, M., and Sitaraman, R. K. (2013). “Dynamic provisioning in next-generation data centers with on-site power production,” in International conference on future energy systems, 137–148. doi:10.1145/2487166.2487182
Vasques, T. L., Moura, P., and Almeida, A. (2019). A review on energy efficiency and demand response with focus on small and medium data centers. Energy Effic. 12 (5), 1399–1428. doi:10.1007/s12053-018-9753-2
Xu, D., and Qu, M. (2013). Energy, environmental, and economic evaluation of a CCHP system for a data center based on operational data. Energy Build. 67, 176–186. doi:10.1016/j.enbuild.2013.08.021
Xu, G. (2007). “Evaluation of a liquid cooling concept for high power processors,” in Semiconductor thermal measurement and management symposium (Twenty Third Annual IEEE), 190–195. doi:10.1109/STHERM.2007.352422
Yao, J., Liu, X., and Zhang, C. (2014). Predictive electricity cost minimization through energy buffering in data centers. IEEE Trans. Smart Grid 5, 230–238. doi:10.1109/TSG.2013.2274525
Yao, Q., Hua, W., Jia, Z., and Hui, X. (2017). “A flexible and scalable implementation of elliptic curve cryptography over GF(p) based on ASIP,” in Performance computing & communications conference (IEEE). doi:10.1109/PCCC.2016.7820654
Zhang, Y., Wang, Y., and Wang, X. (2011). “Greenware: Greening cloud-scale data centers to maximize the use of renewable energy,” in ACM/IFIP/USENIX international conference on distributed systems platforms and open distributed processing, 143–164.
Keywords: data center, simulated annealing algorithm, particle swarm algorithm, green energy consumption, combination optimization
Citation: Liu X, Hou G and Yang L (2023) Combination optimization of green energy supply in data center based on simulated annealing particle swarm optimization algorithm. Front. Earth Sci. 11:1134523. doi: 10.3389/feart.2023.1134523
Received: 30 December 2022; Accepted: 17 April 2023;
Published: 25 September 2023.
Edited by:
Lirong Liu, University of Surrey, United KingdomCopyright © 2023 Liu, Hou and Yang. This is an open-access article distributed under the terms of the Creative Commons Attribution License (CC BY). The use, distribution or reproduction in other forums is permitted, provided the original author(s) and the copyright owner(s) are credited and that the original publication in this journal is cited, in accordance with accepted academic practice. No use, distribution or reproduction is permitted which does not comply with these terms.
*Correspondence: Guisheng Hou, aG91Z3Vpc2hlbmcwMDFAMTYzLmNvbQ==; Lei Yang, eWFuZ2xlaUBzZHVzdC5lZHUuY24=
Disclaimer: All claims expressed in this article are solely those of the authors and do not necessarily represent those of their affiliated organizations, or those of the publisher, the editors and the reviewers. Any product that may be evaluated in this article or claim that may be made by its manufacturer is not guaranteed or endorsed by the publisher.
Research integrity at Frontiers
Learn more about the work of our research integrity team to safeguard the quality of each article we publish.