 Lingli Zheng
 Muyao Chen1
 Wenlian Xiao
- 1State Key Laboratory of Oil and Gas Reservoir Geology and Exploitation, Southwest Petroleum University, Chengdu, China
- 2Exploration and Development Research Institute, PetroChina Southwest Oil and Gasfield Company, Chengdu, China
In tight gas reservoirs, the major flow channels are composed of micro/nanopores in which the rarefaction effect is prominent and the traditional Darcy law is not appropriate for gas flow. By combining the Maxwell first-order slip boundary condition and Navier–Stokes equations, a three-dimensional (3D) analysis of compressible gas slip flow in a microtube was presented, and the flux rate and pressure variation in the flow direction were discussed. Subsequently, by superimposing the Knudsen diffusion, a gas flux formula applicable to a larger Knudsen number was further proposed and satisfactorily verified by two groups of published experimental data in microtubes or microchannels in the membrane. The results indicate that slip flow and Knudsen diffusion make an important contribution to the total gas flow in the microtube, and their weight increases with an increase in the Knudsen number. By substituting the gas flux formula into Darcy’s law for compressible gas, a new apparent permeability model for tight gas reservoirs was proposed, in which the slippage effect and Knudsen diffusion were synthetically considered. The results indicate that the apparent permeability of tight reservoirs strongly depends on the reservoir pressure and pore-throat radius, and an underestimation value may be predicted by the previously published models. This study provides a case study for evaluating these apparent permeability models, which remains a challenging task in the laboratory.
1 Introduction
Tight sandstone gas is an important energy source. A sound understanding of reservoir properties and gas flow mechanisms is required to effectively develop these natural gas resources (Gensterblum et al., 1995; Sander et al., 2017; Rutter et al., 2022). Gas molecules generally move without rules; this movement is commonly described by the molecule mean free path. The Knudsen number (Kn), defined as the ratio of the mean free path and the characteristic length of the microchannels, is applied to determine whether the gas flow meets the continuity assumption (Freeman et al., 2011). As the characteristic length of microchannels approaches the mean free path, the rarefaction effect is significant, resulting in the breakdown of the continuity assumption (Javadpour et al., 2007; Civan, 2010). Based on Kn, gas flow regimes can be divided into continuum flow (Kn <10−3), slip flow (10−3 <Kn <10−1), transition regime (10−1 <Kn <10), and free molecular regime (Kn >10) (Roy et al., 2003; Civan, 2010; Sakhaee-Pour and Bryant, 2011; Swami et al., 2012; Kim et al., 2016).
The Navier–Stokes equations and Darcy’s law are suitable for continuum flow. For slip flow, two approaches have been proposed to describe the gas flow. One approach combines the Navier–Stokes equations with different slip boundary conditions (Shen et al., 2007), and the other uses a molecular-based model (Fukui and Kaneko, 1988). Compared with molecular-based models, slip boundary models are simpler and more efficient because they can be applied with a continuum description (Shen et al., 2007). Maxwell (1878) first proposed the slip model and expected two kinds of reflections existing as gas molecules to collide with the wall, a part of (σv) the diffuse reflection, and the remaining part of (1-σv) the specular reflection. σv depends on the surface material, surface roughness, incident angles of gas molecules, gas types, temperature, and pressure (Arkilic and Schmidt, 1997). Although the derivation process of the slip model was not strictly physical, it correctly reflected the dependence of the slip velocity on the reflection and sectional velocity gradient. Subsequently, the 1.5-order and second-order slip boundaries were proposed based on kinetic theory (Kennard, 1938; Mitsuya, 1993; Wu and Bogy, 2001; Hadjiconstantinou, 2003). These models usually act for Kn < 0.1, and the second-order slip model is likely to overestimate the flow rate at large Kn. Meanwhile, the legitimacy of 1.5-order and second-order slip models has also been debated (Shen et al., 2007). A general slip boundary condition declared to be appropriate for the entire Knudsen range was developed by Beskok and Karniadakis (1999). However, the slip coefficient needs to be determined using either experimental or DSMC data. Simultaneously, a similar slippage effect was obtained by employing the effective viscosity near the wall or applying the extended Navier–Stokes equations with no-slip boundary conditions (Beskok and Karniadakis, 1999; Chakraborty and Durst, 2007; Roy and Chakraborty, 2007; Arlemark et al., 2010; Michalis et al., 2010; Agrawal, 2011). For the transition and free molecular regimes, the collision between the gas molecules and the wall is more prominent. The Navier–Stokes equations have to be substituted by Boltzmann or Burnett equations (Agarwal et al., 2001; Freeman et al., 2011; Rahmanian et al., 2012), but it is difficult to obtain analytical solutions. Subsequently, some authors have attempted to estimate the total gas flux in microchannels by superimposing the slip flow with Knudsen diffusion (Javadpour, 2009; Zhang et al., 2015), which shows a reasonable match with experimental data (Javadpour, 2009). In addition, many experiments focusing on gas flow at different scales and shapes of microchannels have been conducted (Arkilic and Schmidt, 1997; Maurer et al., 2003; Hsieh et al., 2004; Ewart et al., 2006; Velasco et al., 2012), which have been reviewed in detail by Morini et al. (2011).
Unlike the Darcy permeability, the apparent permeability for gas transport in tight reservoirs results from the joint effects of rock properties and gas flow regimes, which makes a big difference in the production characteristics of natural gas. Pores and throats are small in tight gas reservoirs. As the gas reservoir pressure decreases, the apparent permeability becomes as much as 10 times larger than the Darcy permeability (Darabi et al., 2012; Kalarakis et al., 2012). Klinkenberg (1941) first developed a famous formula that considers the slippage effect based on the kinetic theory, but it is not appropriate for flows at high Kn (Sakhaee-Pour and Bryant, 2011).
By adopting the lattice Boltzmann method, Tang et al. (2005) confirmed the Klinkenberg equation and concluded that the second-order term of Kn needed to be added for gas flow at high Kn. Meanwhile, experimental results have shown that the gas slippage factor is a power function of the Darcy permeability versus porosity (Jones and Owens, 1980; Florence et al., 2007), but it might not hold for tight gas reservoirs (Swami et al., 2012). Michel et al. (2011) proposed a dynamic slippage factor considering the Knudsen diffusion coefficients, but the slippage effect was not accounted for (Swami et al., 2012). Moreover, by combining the Beskok–Karniadakis model (1999), Civan et al. (2011), and Sakhaee-Pour and Bryant et al. (2012) introduced apparent permeability as a function of Kn. As the total gas flux in micro- and nanopores consists of viscous flow driven by the pressure gradient and Knudsen diffusion under the action of a gas concentration gradient, an accurate apparent permeability model may need to consider the aforementioned two parts in the meantime (Harley et al., 1995; Rushing et al., 2003; Javadpour, 2009). It is closely related to rock properties, gas types, and environmental conditions (Javadpour, 2009; Chen et al., 2015; Zhang et al., 2015).
This study theoretically analyzed the gas slip flow in a 3D microtube by combining the Navier–Stokes equations and first-order slip boundary condition. A gas flux formula in the microtube was proposed by superimposing the Knudsen diffusion, which was suitable for a higher Kn. Subsequently, a new apparent permeability model for tight gas reservoirs, including the slippage effect and Knudsen diffusion, was proposed, which contributes to a further understanding of the gas flow mechanism and production characteristics in tight reservoirs.
2 Theoretical gas flow formula in a microtube
2.1 The derivation of the theoretical gas flow formula
As gas flows in a 3D microtube (Figure 1), ignoring the mass force and temperature variation and assuming that viscosity is constant and the second viscosity coefficient μ′ equals 0, the Navier–Stokes equations for compressible gas under steady-state conditions are written as follows (Chen, 2017):
where fluid pressure is denoted as p, Pa; gas viscosity μ, Pa s; and velocity
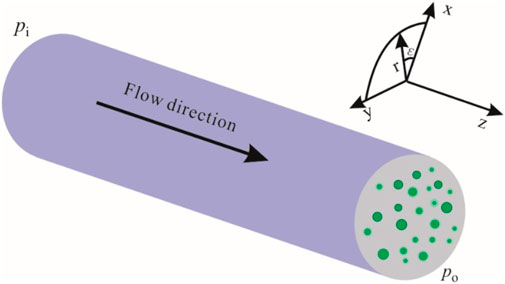
FIGURE 1. Schematic diagram of the 3D microtube.
For ideal gases, p = ρRaT/M, where M represents the molar mass (kg/kmol); Ra refers to the gas constant, 0.008314 (Pam3)/(kmolK); ρ is the density, kg/m3; and T is the temperature (K). The non-dimensionalization of these variables is as follows: streamwise velocity (u) and radial velocity (v) are normalized by the area-averaged velocity at the outlet, the streamwise coordinate (z) by the length of the microtube (L), radial coordinate (r) by the radius of the microtube (R), and p and ρ are the pressure and density at the outlet, respectively. Meanwhile, ε = R/L <<1 and δp = pi-po. With these assumptions, Eqs. 2–4 were expressed in a non-dimensional form as follows:
It is clear that the radial velocity equals 0 at the wall of the microtube, where the streamwise velocity is expressed by the Maxwell first-order slip velocity (Eq. 8). Meanwhile, Kn was replaced by the ratio of Kn at the outlet (denoted by Ko) and the non-dimensional pressure to obtain the non-dimensional boundary condition:
After expanding
Subsequently, based on Eqs 9, 11 and solving Eq. 6 with the boundary conditions (Eq. 8), the non-dimensional 0th-order streamwise velocity is written as (Eq. 12)
By substituting Eq. 12 into Eq. 7 and integrating it once in the non-dimensional microtube radius, the expression of the non-dimensional first-order radial velocity (Eq. 13) can be obtained:
Combining Eq. 8, Eq. 13 was simplified to
The outlet flow rate is
where Jo denotes the mass flux at the outlet, kg/s/m2; and q refers to the flow rate at the outlet, m3/s. In addition, the mass flux brought about by the Knudsen diffusion can be described by the Knudsen diffusion model (Eq. 18) (Javadpour, 2009). The total mass flux at the outlet of the microtube, including viscous flow, slip flow, and the Knudsen diffusion, is presented by a combination of Eq. 17 and Eq. 18, which is theoretically valid for slip and transition flow regimes (P = pi/po) (Javadpour, 2009; Swami et al., 2012; Zhang et al., 2015). Rb is the gas constant [8.314 J/(mol K)]:
2.2 Model verification
Ewart et al. (2006) conducted an experimental investigation of the gas mass rate for an isothermal steady flow in cylindrical microchannels. The diameter of the microchannel is 25.2 ± 0.35 μm, and the length is 5.30 cm. The resolution of the pressure gauge is 0.019 Pa. During the experiments, the calculated Reynolds numbers varied in the range of 1.8 × 10⁻³∼2.5. The experimental data on the gas mass rate versus the Knudsen number are shown in Figure 2 (black dots). The gas mass flux model proposed in this study (Eq. 19) was used to model the experiment (σv = 0.8) (Javadpour, 2009), which showed good agreement with the experimental results, and the relative error was less than 5%. In addition, Roy et al. (2003) used a membrane with a pore size of 200 nm and thickness of 60 μm to study the gas micro-flow. Figure 3 shows the mass flux versus pressure drop during this experiment, with an exit Kn of 7.36. The results calculated by Eq. 19 were simultaneously depicted in Figure 3 with an exit Kn of 14.66. Kn was expressed as the ratio of the mean free path to the microtube diameter in Roy’s study. Based on Figure 3, the model results based on Eq. 19 approach the experimental results well at small pressure drops but deviate from the experimental results as the pressure drop increases. This is mainly because of the irregular shape of the microchannels in the membrane, which may lead to a smaller transport capacity than that of the regular microtube used in the model.
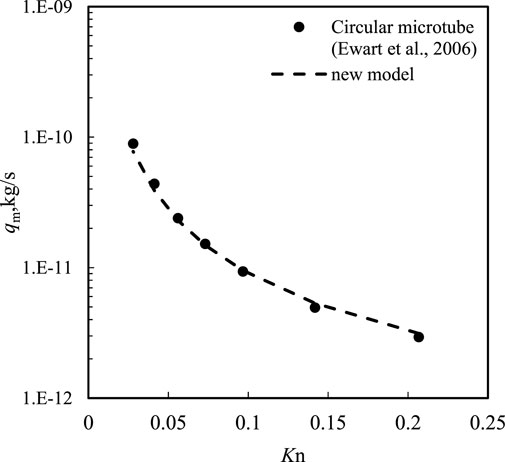
FIGURE 2. Comparison of the gas mass rate and Knudsen number calculated by a new model (Eq. 18) (dashed line) multiplied by the cross-section area to the experimental data of nitrogen flow in microchannel (black dots) by Ewart et al. (2006).
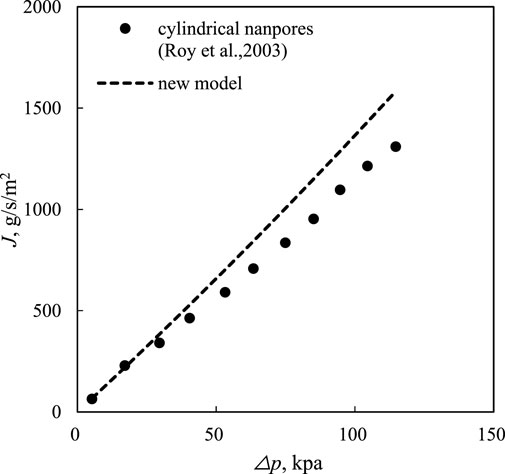
FIGURE 3. Comparison of the mass flux and pressure drop calculated by the new model (Eq. 18) (dashed line) to the experimental data in the cylindrical nanopores of the membrane by Roy et al. (2003).
2.3 Model results
According to the models in Section 2.1, the gas flow characteristics, including the pressure distribution, gas mass flux, and mass flow ratio for different flow regimes in the microtube, will be further discussed. Nitrogen was selected as the gas source, the temperature was set to 300 K, and σv = 0.8 in the models.
Pressure distribution in the microtube for slip flow. Based on Eq. 15, the pressure distribution in the microtube at different inlet pressures is shown in Figure 4. The inlet pressures were 1, 2, 3, and 4 MPa (the outlet pressure was 0.7 MPa), and the average Kn values were 0.083, 0.052, 0.038, and 0.03, respectively. At the same time, the length and diameter (d) of the microtube were 1 cm and 200 nm, respectively. When gas flows into the microtube, the flow rate increases, whereas the pressure decreases, which results in a change in the gas density in the flow direction. As shown in Figure 4, there was a non-linear variation in the pressure along the flow direction. The non-linearity of the pressure distribution in this microtube should be caused by gas compression, whereas the rarefaction effect should be the opposite. With a larger ratio of the inlet and outlet pressures, the curvature of the pressure curve is smaller, which can also be speculated from Eq. 15. In addition, the curvature was slightly smaller for the larger microtube at the same pressure ratio (Figure 5), and the influence of the gas type was almost negligible.
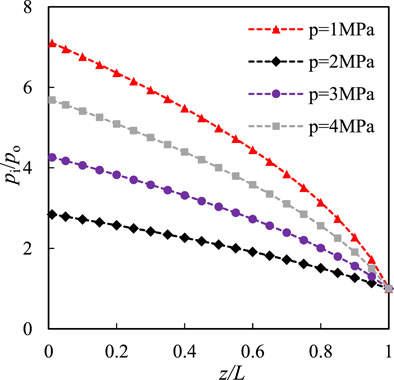
FIGURE 4. Pressure variation versus microtube coordinate at different inlet pressure.
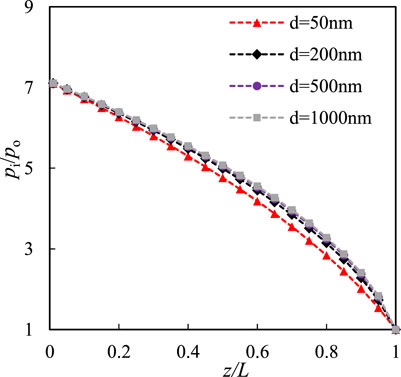
FIGURE 5. Pressure variation versus microtube coordinate at different microtube diameters.
Gas mass flux versus Kn for different microtubes. Figure 6 shows the gas mass flux in microtubes of different scales with variational Kn. The microchannel length was 1 cm, and the diameter of the microtube ranged from 50 to 1,500 nm. Simultaneously, the outlet pressure was set to 0.002 MPa. Figure 6 shows that the gas mass flux in the microtubes gradually decreases with an increase in Kn. The gas mass flux for different microtubes is in accordance with Kn smaller than 1, and the absolute slope of the coincident curves continues to decrease with an increase in Kn. However, for Kn >1, a slower decrease occurred in the smaller microtubes, resulting in the mass flux curves beginning to diverge between the different microtubes. Additionally, the slippage effect and Knudsen diffusion were more significant in smaller microtubes. However, the average pressure was higher for smaller microtubes to achieve the same Kn.
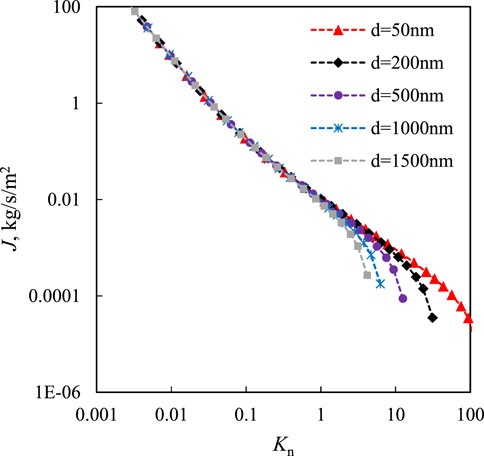
FIGURE 6. Gas mass flux versus Kn at different diameters of microtubes.
Mass flow ratio versus Kn. During gas flow in a microtube, the flow regimes include viscous flow, slip flow, and Knudsen diffusion, which are mixed in different proportions (Zhang et al., 2015). According to Eqs 17–19, the gas mass flux ratios in different regimes with variations in Kn are shown in Figure 7. The length and diameter of the microtubes were 1 cm and 200 nm, respectively. As shown in Figure 7, the viscous flow is dominant, and the Knudsen diffusion is almost neglected when Kn is smaller than 0.1. As Kn increases, the slip flow and Knudsen diffusion play a more important role in the gas flow. At the later stage of the transition flow, the Knudsen diffusion accounts for almost 50% of the total gas mass flux, which approaches the sum of viscous and slip flows. The ratio of Knudsen diffusion is constant in the free molecular flow regime and shows a slight increase with an increase in the microtube diameter. In brief, slip flow and Knudsen diffusion must be considered for the rarefied gas flow in the microchannels.
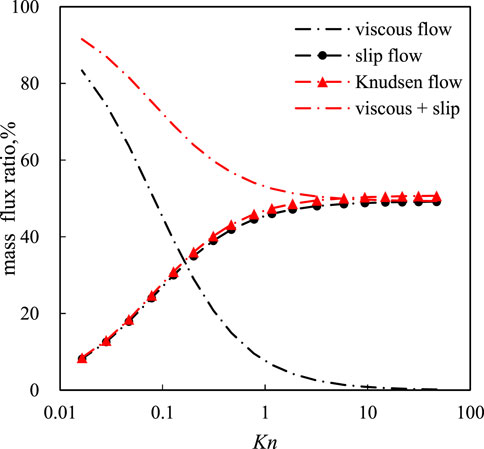
FIGURE 7. Dynamic mass flux ratio by different flow parts with Kn variations.
3 Apparent permeability
At present, gas production in tight gas reservoirs presents a tendency for rapid growth. To a great extent, it is determined by the apparent permeability of gas transport in porous media. The gas flow mechanism in the microtubes can be used to promote the understanding of gas flow in tight reservoirs. Based on Darcy’s law for compressible gas, the apparent permeability for tight porous media (Eq. 20) can be calculated (Javadpour, 2009; Zhang et al., 2015):
where kg denotes the permeability, m2; and qm refers to the gas mass rate (kg/s). By combining the new gas flux formula in the microtube presented in Section 2.1 (Eq. 19), a new apparent permeability model (Eq. 21) was derived, which includes viscous flow, slip flow, and Knudsen diffusion. Meanwhile, the ratio of apparent permeability and Darcy’s permeability in porous media was written as Eq. 22. This indicates that the difference between the apparent permeability and the Darcy permeability depends primarily on the pore radius and pressure. The apparent permeability of tight reservoirs significantly depends on pressure and pore radius (Roy et al., 2003; Freeman et al., 2011):
The correlation of the kapp/kD ratio with pressure and pore diameter is shown in Figure 8. The outlet pressure was 0.002 MPa, and the pore diameter ranged from 1 to 6,000 nm. As shown in Figure 8, the ratio is largest at the smallest inlet pressure of 0.01 MPa. In addition, the ratio decreased with increasing pressure, which indicates that in tight reservoirs, the viscous flow was dominant at high pressure, whereas the production gas was mainly driven by slip and Knudsen diffusion at low pressure.
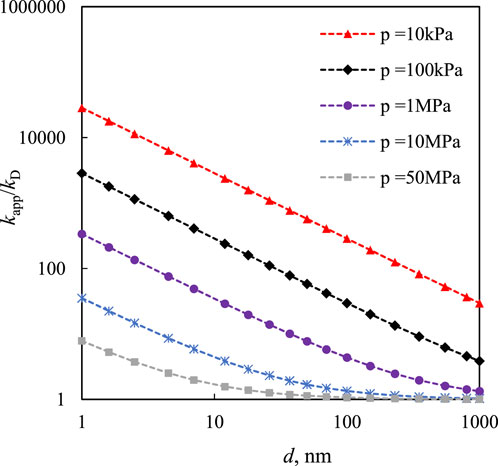
FIGURE 8. Effect of pressure and microchannel diameter on the kapp/kD ratio.
A comparison of the new apparent permeability model and the previously published models is shown in Figure 9. The kapp/kD ratio based on Klinkenberg’s (1941) model is the smallest, especially for Kn >0.1 because only the slippage effect was considered. In the model of Chen et al. (2015), the Knudsen diffusion was considered, but slippage was excluded. The kapp/kD ratio of Chen et al.’s model is in good agreement with that of Civan’s model (2010), which introduced Beskok and Kaniadakis’s (1999) correction factor and is slightly larger than that in Klinkenberg’s model. Zhang et al. (2015) combined the Klinkenberg model (1941) with the Knudsen diffusion. Javadpour (2009) combined slip flow using the theoretical dimensionless coefficient (F) introduced by Brown et al. (1946) with the Knudsen diffusion. The ratio predicted by the models of Zhang et al. and Javadpour is approximate while being larger than that of the models proposed by Klinkenberg, Chen et al., and Civan. The results of the new model most approximate those of Javadpour’s model and are slightly larger than those of Chen et al.’s model because of the different slippage factors considered. It can be concluded that these apparent permeability models are all more or less equivalent in the slip flow regime and differ in the transition and free molecular regimes because the different gas flow mechanisms and theoretical models were accounted for.
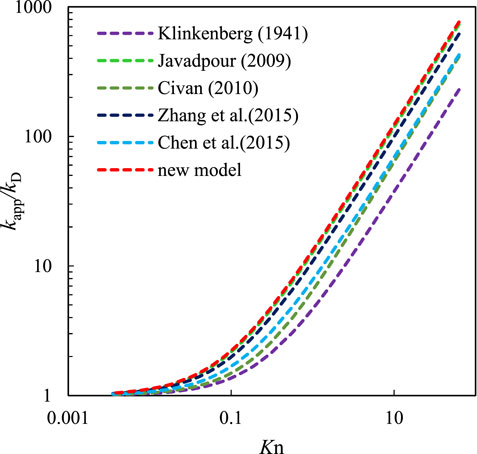
FIGURE 9. Comparison of the new apparent permeability model and the previously published models.
4 Discussion
Pores and throat spaces in tight gas reservoirs are complex pore network systems. According to Zou et al. (2012), the pore diameter of tight gas reservoirs is in the range of 5–700 nm. When the pore diameter is less than 10 nm, surface diffusion occurs on the surface of the pores (Yang et al., 2016). Therefore, surface diffusion was not considered in this study because the vast majority of pores in reservoirs are larger than 10 nm. The range of Kn in tight gas reservoirs as the reservoir pressure decreases from 35 MPa to 1 MPa, as shown in Figure 10. Figure 10 suggests that Kn decreases with an increase in reservoir pressure and pore diameter, whereas the main flow regimes are the slip flow and transition regime (Kn <10). Darcy’s law is not appropriate, and the new apparent permeability model is theoretically valid for tight gas reservoirs. However, it may be impractical to test the validity of these models in a laboratory study of reservoir rocks. As gas flows in true reservoir rocks, the variation in apparent permeability comes from two parts: the changes in gas flow regimes and the stress sensitivity of rocks (i.e., the pore space changes in rocks). For a high Kn, it is very difficult to weigh the contribution of the rock stress sensitivity because of the complicated variation in the gas flow regimes. Some authors excluded the slippage effect in tight sandstones by conducting experiments at high pressure (Li et al., 2009) or directly neglected the effect of effective stress on apparent permeability (Yuan et al., 2016). Therefore, it may be better to directly include the effective stress in the apparent permeability model together with the transport mechanism. Some researchers have attempted to do some work and have obtained apparent permeability models based on the linear effective stress law (Cao et al., 2016; Xiao et al., 2019). However, effective non-linear stress is common in tight rocks (Li et al., 2014; Xiao et al., 2019), and the apparent model needs to be improved in future work.
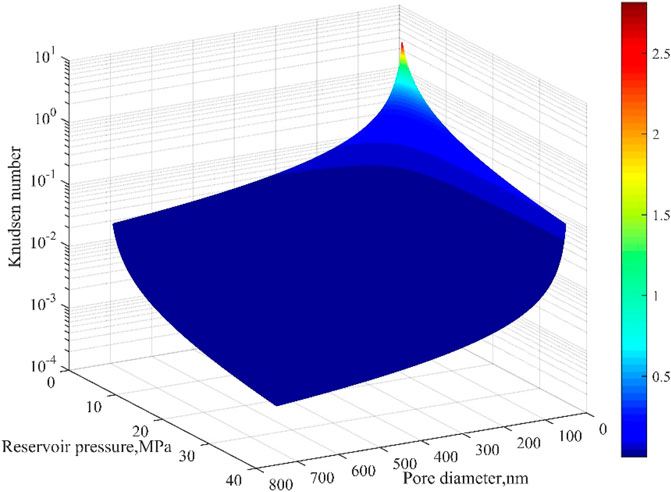
FIGURE 10. Range of Kn in tight gas reservoirs as p = 1–35 MPa.
Moreover, based on network simulations, Bernabé et al. (2010) found that the matrix permeability in 3D simple cubic, FCC, and BCC networks obeyed the “universal” power laws, k∝(z-zc)β, where β is a function of the standard deviation of the pore radius distribution and zc is the percolation threshold in terms of the coordination number (z). Permeability can be further expressed as a combination of scale-invariant parameters (Bernabé et al., 2010):
where rH is the mean pore radius, l is the mean pore separation distance, and w is a function of the standard deviation of the pore radius distribution. Our results showed that rock permeability is related to the pore structure. Thus, it may be beneficial to considering the pore structure parameters in different apparent permeability models.
5 Conclusion
A 3D analysis of the Navier–Stokes equations for compressible gas flow in a microtube was presented by combining the first-order slip boundary condition. The non-linear pressure variation was analyzed for the gas slip flow. Subsequently, a new gas flux formula in the microtube, including viscous flow, slip flow, and Knudsen diffusion, was proposed, which is in good agreement with the published experimental data.
According to the calculated Knudsen number range, it can be concluded that slip and transition flow are the main flow regimes in tight gas reservoirs. The gas mass flux driven by slip and Knudsen diffusion significantly contributes to the total gas mass flux in the micropores and nanopores, and their weight increases with an increase in the Knudsen number.
A new apparent permeability model for tight gas reservoirs, considering the slippage effect and Knudsen diffusion, is presented based on the new gas flux formula and Darcy’s law. By comparing the new model with previous models, the results of the new model were close to those of Javadpour’s model, and other previous models may underestimate the apparent permeability of tight reservoirs. The results show that the apparent permeability strongly depends on the reservoir pressure and pore-throat radius.
Data availability statement
The original contributions presented in the study are included in the article/Supplementary Material. Further inquiries can be directed to the corresponding author.
Author contributions
LL was mainly responsible for the writing and modification of the article, as well as data processing and analysis required for article writing; MY and LT were mainly responsible for guiding the revision of the article and data analysis and processing to provide technical support; JH, YM, and WL provided financial and technical support in the writing and preparation of articles. All authors participated in the revision and agreed to submit the published version.
Funding
This research was financially supported by the National Natural Science Foundation Project of China (nos 51874248 and U19A2043) and the Youth Science and Technology Innovation Team of Southwest Petroleum University (no. 2018CXTD10).
Acknowledgments
We would like to show our deepest appreciation to all of them who supported and helped in this research.
Conflict of interest
TL and JH were employed by PetroChina Southwest Oil and Gasfield Company.
The remaining authors declare that the research was conducted in the absence of any commercial or financial relationships that could be construed as a potential conflict of interest.
Publisher’s note
All claims expressed in this article are solely those of the authors and do not necessarily represent those of their affiliated organizations or those of the publisher, the editors, and the reviewers. Any product that may be evaluated in this article, or claim that may be made by its manufacturer, is not guaranteed or endorsed by the publisher.
Abbreviations
app, apparent; avg, average; D, Darcy; d, diffusion; i, the inlet of the microtube; o, the outlet of the microtube.
References
Agarwal, R. K., Yun, K. Y., and Balakrishnan, R. (2001). Beyond Navier–Stokes: Burnett equations for flows in the continuum–transition regime. Phys. Fluids 13 (10), 3061–3085. doi:10.1063/1.1397256
Agrawal, A. (2011). A comprehensive review on gas flow in microchannels. Int. J. Micro-Nano Scale Transp. 2 (1), 1–40. doi:10.1260/1759-3093.2.1.1
Arkilic, E. B., Schmidt, M. A., and Breuer, K. (1997). Gaseous slip flow in long microchannels. J. Microelectromechanical Syst. 6 (2), 167–178. doi:10.1109/84.585795
Arlemark, E. J., Dadzie, S. K., and Reese, J. M. (2010). An extension to the Navier–Stokes equations to incorporate gas molecular collisions with boundaries. J. Heat Transf. 132 (4), 041006. doi:10.1115/1.4000877
Bernabé, Y., Li, M., and Maineult, A. (2010). Permeability and pore connectivity: A new model based on network simulations. J. Geophys. Res. Solid Earth 115 (B10203), B10203. doi:10.1029/2010JB007444
Beskok, A., and Karniadakis, G. E. (1999). Report: A model for flows in channels, pipes, and ducts at micro and nano scales. Microscale Thermophys. Eng. 3 (1), 43–77. doi:10.1080/108939599199864
Beskok, A., and Karniadakis, G. E. (1994). Simulation of heat and momentum transfer in complex microgeometries. J. Thermophys. Heat Transf. 8 (4), 647–655. doi:10.2514/3.594
Brown, G. P., DiNardo, A., Cheng, G. K., and Sherwood, T. K. (1946). The flow of gases in pipes at low pressures. J. Appl. Phys. 17 (10), 802–813. doi:10.1063/1.1707647
Cao, P., Liu, J., and Leong, Y. K. (2016). General gas permeability model for porous media: Bridging the gaps between conventional and unconventional natural gas reservoirs. Energ & Fuels 30 (7), 5492–5505. doi:10.1021/acs.energyfuels.6b00683
Chakraborty, S., and Durst, F. (2007). Derivations of extended Navier-Stokes equations from upscaled molecular transport considerations for compressible ideal gas flows: Towards extended constitutive forms. Phys. Fluids 19 (8), 088104. doi:10.1063/1.2759531
Chen, L., Zhang, L., Kang, Q., Viswanathan, H. S., Yao, J., Tao, W. Q., et al. (2015). Nanoscale simulation of shale transport properties using the lattice Boltzmann method: Permeability and diffusivity. Sci. Rep. 5, 8089. doi:10.1038/srep08089
Civan, F. (2010). Effective correlation of apparent gas permeability in tight porous media. Transp. Porous Media 82, 375–384. doi:10.1007/s11242-009-9432-z
Civan, F., Rai, C. S., and Sondergeld, C. H. (2011). Shale-gas permeability and diffusivity inferred by improved formulation of relevant retention and transport mechanisms. Transp. Porous Media 86 (3), 925–944. doi:10.1007/s11242-010-9665-x
Darabi, H., Ettehad, A., Javadpour, F., and Sepehrnoori, K. (2012). Gas flow in ultra-tight shale strata. J. Fluid Mech. 710 (1), 641–658. doi:10.1017/jfm.2012.424
Doyen, P. M. (1988). Permeability, conductivity, and pore geometry of sandstone. J. Geophys. Res. Solid Earth 93 (B7), 7729–7740. doi:10.1029/JB093iB07p07729
Ewart, T., Perrier, P., Graur, I., and Gilbert Meolans, J. (2006). Mass flow rate measurements in gas micro flows. Exp. fluids 41 (3), 487–498. doi:10.1007/s00348-006-0176-z
Florence, F. A., Rushing, J., Newsham, K. E., and Blasingame, T. A. (2007). Presented at the Rocky mountain oil & gas technology symposium. Denver, Colorado, USA: Society of Petroleum Engineers, 16–18. doi:10.2118/107954-MSImproved permeability prediction relations for low permeability sands
Fredrich, J. T., Greaves, K. H., and Martin, J. W. (1993). Pore geometry and transport properties of Fontainebleau sandstone. Int. J. Rock Mech. Min. Sci. Geomechanics Abstr. 30 (7), 691–697. doi:10.1016/0148-9062(93)90007-z
Freeman, M. C., Moridis, G. J., and Blasingame, T. A. (2011). A numerical study of microscale flow behavior in tight gas and shale gas reservoir systems. Transp. Porous Media 90 (1), 253–268. doi:10.1007/s11242-011-9761-6
Fukui, S., and Kaneko, R. (1988). Analysis of ultra-thin gas film lubrication based on linearized Boltzmann equation: First report—derivation of a generalized lubrication equation including thermal creep flow. J. Tribology-transactions Asme 110 (2), 253–261. doi:10.1115/1.3261594
Gensterblum, Y., Ghanizadeh, A., Cuss, R. J., Amann-Hildenbrand, A., Krooss, B. M., Clarkson, C. R., et al. (1995). Gas transport and storage capacity in shale gas reservoirs - a review. Part A: Transport processes. J. Unconv. Oil Gas Resour. 12, 87–122. doi:10.1016/j.juogr.2015.08.001
Hadjiconstantinou, N. G. (2003). Comment on Cercignani's second-order slip coefficient. Phys. Fluids 15 (8), 2352–2354. doi:10.1063/1.1587155
Harley, J. C., Huang, Y., Bau, H. H., and Zemel, J. N. (1995). Gas flow in micro-channels. J. Fluid Mech. 284, 257–274. doi:10.1017/S0022112095000358
Hsieh, S. S., Tsai, H. H., Lin, C. Y., Huang, C. F., and Chien, C. M. (2004). Gas flow in a long microchannel. Int. J. Heat Mass Transf. 47 (17-18), 3877–3887. doi:10.1016/j.ijheatmasstransfer.2004.03.027
Javadpour, F., Fisher, D., and Unsworth, M. (2007). Nanoscale gas flow in shale gas sediments. J. Can. Petroleum Technol. 46 (10), 55–61. doi:10.2118/07-10-06
Javadpour, F. (2009). Nanopores and apparent permeability of gas flow in mudrocks (shales and siltstone). J. Can. Petroleum Technol. 48 (08), 16–21. doi:10.2118/09-08-16-DA
Jones, F. O., and Owens, W. W. (1980). A laboratory study of low-permeability gas sands. J. Petroleum Technol. 32 (09), 1631–1640. doi:10.2118/7551-PA
Kalarakis, N., Michalis, V. K., Skouras, E. D., and Burganos, V. N. (2012). Mesoscopic simulation of rarefied flow in narrow channels and porous media. Transp. Porous Media 94, 385–398. doi:10.1007/s11242-012-0010-4
Kim, C., Jang, H., Lee, Y., and Lee, J. (2016). Diffusion characteristics of nanoscale gas flow in shale matrix from Haenam basin, Korea. Environmational Earth Sci. 75 (4), 350–358. doi:10.1007/s12665-016-5267-4
Klinkenberg, L. J. (1941). The permeability of porous media to liquids and gases. Drill. Prod. Pract., 57–73. doi:10.5510/OGP20120200114
Li, M., Xiao, W. L., Bernabé, Y., and Zhao, J. Z. (2014). Nonlinear effective pressure law for permeability. J. Geophys. Res. Solid Earth 119, 119:302–318. doi:10.1002/2013JB010485
Li, M., Bernabé, Y., Xiao, W. I., Chen, Z. Y., and Liu, Z. Q. (2009). Effective pressure law for permeability of E-bei sandstones. J. Geophys. Res. 114 (B7), B07205. doi:10.1029/2009JB006373
Lindquist, W. B., Venkatarangan, A., Dunsmuir, J., and Wong, T. f. (2000). Pore and throat size distributions measured from synchrotron X-ray tomographic images of Fontainebleau sandstones. J. Geophys. Res. 105 (B9), 21509–21527. doi:10.1029/2000JB900208
Maurer, J., Tabeling, P., Joseph, P., and Willaime, H. (2003). Second-order slip laws in microchannels for helium and nitrogen. Phys. Fluids 15 (9), 2613–2621. doi:10.1063/1.1599355
Maxwell, J. C. (1867). On the dynamical theory of gases, A157. London: Philosophical Transactions of the Royal Society of London, 49–88. doi:10.1098/rstl.1867.0004
Michalis, V. K., Kalarakis, A. N., Skouras, E. D., and Burganos, V. N. (2010). Rarefaction effects on gas viscosity in the Knudsen transition regime. Microfluid. Nanofluidics 9 (4-5), 847–853. doi:10.1007/s10404-010-0606-3
Michel, G. G., Sigal, R. F., Civan, F., and Devegowda, D. (2011). Parametric investigation of shale gas production considering nano-scale pore size distribution, formation factor, and non-Darcy flow mechanisms. Denver, Colorado, USA: Presented at the SPE Annual Technical Conference and Exhibition. doi:10.2118/147438-MS
Mitsuya, Y. (1993). Modified Reynolds equation for ultra-thin film gas lubrication using 1.5-order slip-flow model and considering surface accommodation coefficient. J. Tribology-transactions Asme 115 (2), 289–294. doi:10.1115/1.2921004
Morini, G. L., Yang, Y., Chalabi, H., and Lorenzini, M. (2011). A critical review of the measurement techniques for the analysis of gas microflows through microchannels. Exp. Therm. Fluid Sci. 35 (6), 849–865. doi:10.1016/j.expthermflusci.2011.02.005
Rahmanian, M., Aguilera, R., and Kantzas, A. (2012). A new unified diffusion-viscous-flow model based on pore-level studies of tight gas formations. SPE J. 18 (01), 38–49. doi:10.2118/149223-PA
Roy, S., and Chakraborty, S. (2007). Near-wall effects in micro scale Couette flow and heat transfer in the Maxwell-slip regimes. Microfluid. Nanofluidics 3 (4), 437–449. doi:10.1007/s10404-006-0132-5
Roy, S., Raju, R., Chuang, H. F., Cruden, B. A., and Meyyappan, M. (2003). Modeling gas flow through microchannels and nanopores. J. Appl. Phys. 93 (8), 4870–4879. doi:10.1063/1.1559936
Rushing, J. A., Newsham, K. E., and Van Fraassen, K. C. (2003). “Measurement of the two-phase gas slippage phenomenon and its effect on gas relative permeability in tight sands,” in Presented at the 2003 SPE annual technical conference and exhibition held in denver (Colorado, USA, 5–8. doi:10.2118/84297-MS
Rutter, E., Mecklenburgh, J., and Bashir, Y. (2022). Matrix gas flow through “impermeable” rocks – shales and tight sandstone. Solid earth. 13 (3), 725–743. doi:10.5194/se-13-725-2022
Sakhaee-Pour, A., and Bryant, S. (2012). Gas permeability of shale. SPE Reserv. Eval. Eng. 15 (04), 401–409. doi:10.2118/146944-PA
Sakhaee-Pour, A., and Bryant, S. L. (2011). Gas permeability of shale. Denver, Colorado,USA: Presented at the SPE Annual Technical Conference and Exhibition. doi:10.2118/146944-MS
Sander, R., Pan, Z., and Connell, L. D. (2017). Laboratory measurement of low permeability unconventional gas reservoir rocks: A review of experimental methods. J. Nat. Gas Sci. Eng. 37, 248–279. doi:10.1016/j.jngse.2016.11.041
Shen, S., Chen, G., Crone, R. M., and Anaya-Dufresne, M. (2007). A kinetic-theory based first order slip boundary condition for gas flow. Phys. Fluids 19 (8), 086101. doi:10.1063/1.2754373
Swami, V., Clarkson, C. R., and Settari, A. (2012). “Non-Darcy flow in shale nanopores: Do we have a final answer?,” in Presented at the SPE Canadian unconventional resources conference (Alberta, Canada: Calgary). doi:10.2118/162665-MS
Tang, G. H., Tao, W. Q., and He, Y. L. (2005). Gas slippage effect on microscale porous flow using the lattice Boltzmann method. Phys. Rev. E 72 (5), 056301. doi:10.1103/PhysRevE.72.056301
Velasco, A. E., Friedman, S. G., Pevarnik, M., Siwy, Z. S., and Taborek, P. (2012). Pressure-driven flow through a single nanopore. Phys. Rev. E 86 (2), 025302. doi:10.1103/PhysRevE.86.025302
Wu, L., and Bogy, D. B. (2001). A generalized compressible Reynolds lubrication equation with bounded contact pressure. Phys. Fluids 13 (8), 2237–2244. doi:10.1063/1.1384867
Xiao, W. L., Bernabé, Y., Evans, B., Mok, U., Zhao, J., Ren, X., et al. (2019). Klinkenberg effect and effective pressure for gas permeability of tight sandstones. J. Geophys. Res. Solid Earth 124 (2), 1412–1429. doi:10.1029/2018JB016686
Yang, B., Kang, Y., You, L., Li, X., and Chen, Q. (2016). Measurement of the surface diffusion coefficient for adsorbed gas in the fine mesopores and micropores of shale organic matter. Fuel 181, 793–804. doi:10.1016/j.fuel.2016.05.069
Yuan, Y. D., Doonechaly, N. G., and Rahman, S. (2016). An analytical model of apparent gas permeability for tight porous media. Transp. Porous Media 111 (1), 193–214. doi:10.1007/s11242-015-0589-3
Zhang, P., Hu, L., Meegoda, J. N., and Gao, S. (2015). Micro/nano-pore network analysis of gas flow in shale matrix. Sci. Rep. 5, 13501. doi:10.1038/srep13501
Keywords: microtube, apparent permeability model, slippage effect, Knudsen diffusion, tight gas
Citation: Zheng L, Chen M, Li T, He J, Li Y and Xiao W (2023) Apparent permeability in tight gas reservoirs combining rarefied gas flow in a microtube. Front. Earth Sci. 11:1132882. doi: 10.3389/feart.2023.1132882
Received: 28 December 2022; Accepted: 17 February 2023;
Published: 08 March 2023.
Edited by:
Qiaomu Qi, Chengdu University of Technology, ChinaReviewed by:
Chao Tang, Chengdu University of Technology, ChinaXiaobin Li, China National Petroleum Corporation, China
Copyright © 2023 Zheng, Chen, Li, He, Li and Xiao. This is an open-access article distributed under the terms of the Creative Commons Attribution License (CC BY). The use, distribution or reproduction in other forums is permitted, provided the original author(s) and the copyright owner(s) are credited and that the original publication in this journal is cited, in accordance with accepted academic practice. No use, distribution or reproduction is permitted which does not comply with these terms.
*Correspondence: Lingli Zheng, NDc4MTA5MTA3QHFxLmNvbQ==