 D. L. P. de Lacerda
 R. Prioli2*
 G. F. Vasquez
94% of researchers rate our articles as excellent or good
Learn more about the work of our research integrity team to safeguard the quality of each article we publish.
Find out more
ORIGINAL RESEARCH article
Front. Earth Sci., 02 August 2023
Sec. Solid Earth Geophysics
Volume 11 - 2023 | https://doi.org/10.3389/feart.2023.1132118
This article is part of the Research TopicRock Physics of Unconventional Reservoirs, volume IIView all 15 articles
Shales are composed of minerals and organic matter, whose individual properties are essential to determining the rock’s macroscopical deformation and strength. Scanning electron microscopy combined with electron energy dispersive spectroscopy (EDS) has been extensively used to evaluate composition, while peak-force atomic force microscopy (AFM) has been used on the determination of elastic modulus with nanometric resolution. Still, there is a need for tools to conduct an in-depth study of the minerals’ tribomechanical properties. Atomic force microscopy is a tool that can contribute to these studies, as it can simultaneously measure the tribomechanical properties and identify the phases. In this work, we propose using atomic force microscopy and energy dispersive spectroscopy to identify the shale components and to measure the in situ tribomechanical properties from the different phases. Friction images between the atomic force microscopy tip and the surface were acquired as a function of load. Minerals and organic matter were later identified by colocalized energy dispersive spectroscopy mapping. Then, the frictional characteristics of the major shale constituents were obtained by adjusting the Derjaguin-Muller-Toporov model to the selected components. Moreover, the identification of the different phases was performed. The results show that friction at the nanometer scale was observed to be higher for organic matter than for any other shale constituent, while shear strength was observed to be higher for quartz and lower for organic matter. These characteristics were used to differentiate shale constituents. It is shown that a careful comparison of friction can be used to differentiate the sulfite pyrite, tectosilicates (quartz, andesine, and albite), phyllosilicate biotite, and organic matter. The presented methodology gives novel information on friction properties in the nanoscale that are comparable to available centimetric characterization techniques contributing to the understanding of rock strength.
The lack of knowledge about the geochemical and physical properties of shales contributes to uncertainties on the amount of recoverable gas and oil available, preventing the full development of these resources, raising environmental concerns, and increasing economic unknowns (Kerr, 2010; Middleton et al., 2017). Shales are heterogeneous, composed of a wide variety of minerals, clays, organic matter, and pores of complex characterization. They play an essential role in the frictional characteristics, fracture dynamics, and slip of rocks (Tembe et al., 2010; Fang et al., 2018; Zhang et al., 2020).
Fracture formation and movement are influenced by shear slip and moderated by the frictional strength of the fracture surface (Hu et al., 2016; Yan et al., 2016). The contact interface in a fracture surface is governed by a population of small asperities in contact. The slip of the rock occurs in a discontinuous manner governed by friction instabilities at the population of asperities in contact. Such instabilities may lead to a stick and slip movement at the interface (Scholz and Engelder, 1976; Dieterich and Kilgore, 1994; Ben-David et al., 2010; Li et al., 2011). For instance, when a high-pressure fluid is injected into the rock, as the pressure is increased, the shear forces at the asperities build up until critical stress is achieved, and a slip occurs. At the contact, the surface slip does not happen at once but propagates through the interface leading to fracture or further increase of preexisting cracks (Svetlizky and Fineberg, 2014; Shlomai et al., 2020).
Shear slip is influenced by rock composition. The amount of clay and organic matter plays a significant role in the mechanical strength of the rock (Ikari et al., 2011; Kohli and Zoback, 2013). As their content increases, the rock shear strength decreases. This trend is observed until a total amount of clay and organic matter achieves ∼ 40 vol%, which becomes constant (Wang et al., 2019). Although mineralogy does influence the shear properties of faults, the direct correlation between the slip of the faults and the frictional properties of the individual phases present at the surface of the rock has not been investigated. In shales, due to their fine grain and porous structure in the nanoscale, high-resolution characterization techniques are required to measure the frictional properties of the minerals and organic matter. One instrument suitable for characterizing small-scale structures is the atomic force microscope (AFM).
AFM has been used for high-resolution imaging of pores (Javadpour, 2009; Javadpour et al., 2012; Zhu et al., 2017; Kumar et al., 2018; Zhao et al., 2019). Adhesion forces between the AFM microscope tip, organic matter, and minerals have been measured (Tian et al., 2018; Tian et al., 2019). Different AFM operational modes have also been explored to access mechanical properties of shale minerals and organic matter, such as AFM nanoindentation (Zeszotarski et al., 2004), atomic force acoustic microscopy (Prasad et al., 2002), and Peak-Force (Eliyahu et al., 2015; Emmanuel et al., 2016a; Emmanuel et al., 2016b; Khatibi et al., 2018; Li et al., 2018). Resistivity properties were studied using PF-TUNA mode (Wang et al., 2017).
Although there is a growing interest in the use of AFM for the microstructural and micromechanical characterization of rocks, few studies exploring the lateral force mode on the analysis of the geochemical composition and tribomechanical properties of rocks and minerals have been reported in the literature (Higgins and Hu, 2005; Higgins et al., 2007; Cubillas and Higgins, 2009; Hu et al., 2010). Our paper aims to contribute to these studies.
In this manuscript, the AFM has been used to produce friction maps, in situ, on the surface of shale rock, with high spatial resolution. With a mechanical contact model, adhesion and shear strength were obtained for the organic and inorganic components of the shale rock. These measurements bring new information on the behavior of the shale components under shear produced by a small asperity contact at the mineral scale.
A diagram showing all steps, from sample preparation to analysis, performed in our experiment is presented in Figure 1. The shale samples were embedded in epoxy resin, polished, and studied with a combination of high-resolution microscopy. Digital imaging processing allowing image colocalization and data analysis were performed to extract the tribomechanical properties from the observed minerals and organic matter at the grain-scale.
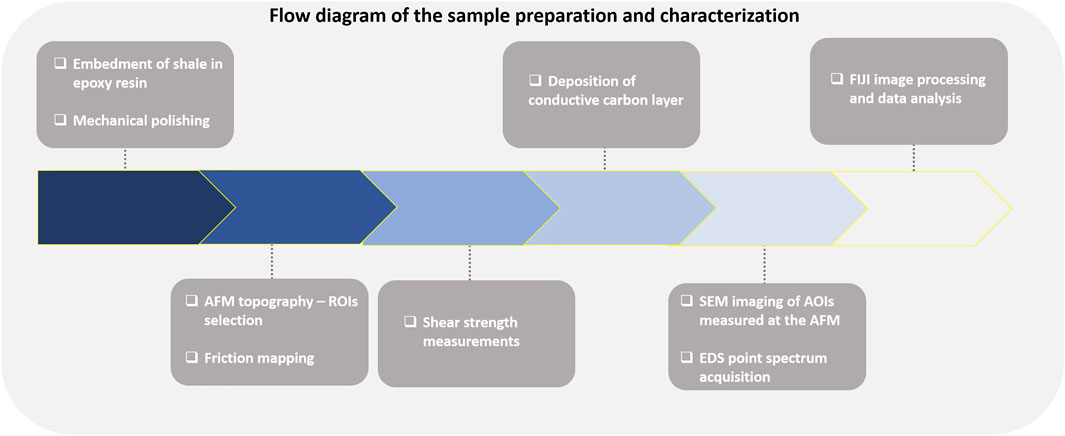
FIGURE 1. Flow chart outlining each step of our experiment, from sample preparation to analysis. The shale samples were embedded in epoxy resin and polished. The AFM analysis was performed followed by SEM and EDS characterization. The tribomechanical characteristics of the observed components of the rock were extracted using digital imaging processing.
Shale fragments from the Assistência Member, Irati Formation in the Paraná Basin, Brazil, were studied in this work. The deposition of the oil shale found in the Assistência Member has occurred in a hypersaline and marine environment leading to the formation of an organic-rich shale with a wide variety of minerals and a Type I organic matter (Zalán et al., 1990; Milani and Zalán, 1999). Characterization by x-ray diffraction has shown the occurrence of quartz, pyrite, feldspar, and phyllosilicates (Anjos et al., 2010; Nicolini et al., 2011). Geochemical characterization shows that the average total organic carbon content in Irati shales is around 3.8% of the mass, with peaks of 14.4% in the Irati Formation (Holanda et al., 2016).
Shale fragments were embedded in an epoxy resin from which cylindrical samples 1 inch in diameter were cut. The surface of the samples was ground using silicon carbide paper with grits up to 3200 and particle grain size of ∼4.5 µm. The surfaces were further polished with diamond paste using finer abrasive particles with grain sizes of 0.25 µm. The samples were then rinsed with ethanol and dried with air spray.
The AFM can be used in a diversity of modes. In the AFM lateral force scanning mode (Meyer et al., 1998), a tip at the end of a cantilever scans the sample in close contact with the surface, while a normal repulsive contact force between the tip and the surface is kept constant by a closed loop feedback system. The scanning is performed perpendicularly to the cantilever´s main axis. The sample topography is registered from the vertical displacement of the piezoelectric ceramic necessary to keep the normal force constant during scanning. The difference between the expected vertical tip position and the real position is acquired in the error channel. Cantilever torsion produced by the friction forces between the tip and the surface is registered in the lateral force channel. The influence of the surface topography in the lateral force images is minimized by subtracting the lateral force backward images from the lateral force forward images (Liu et al., 1996). The resulting image is named friction force image throughout this manuscript. In our measurements, topography, error, and lateral force forward and backward images were simultaneously acquired. Figure 2 illustrates the AFM working principle.
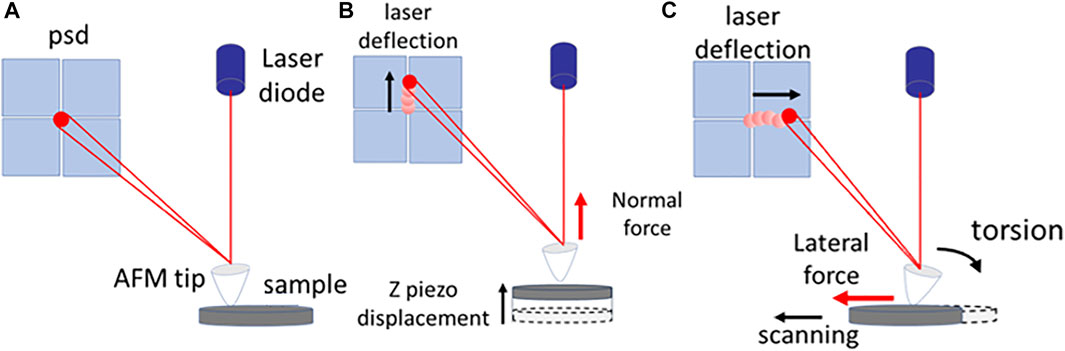
FIGURE 2. AFM working principle. (A) A cantilever tip probe interacts with the sample surface. The probe movement and forces are monitored by the deflection of a laser beam onto a position-sensitive photodetector (psd). (B) The vertical movement of the sample produces normal forces (FN) that bend the probe, moving the laser beam upwards\downwards in the detector. (C) The lateral movement of the sample produces friction forces, and torsion of the probe, moving the beam laterally in the detector. During scanning, the vertical and horizontal movements of the sample are controlled by a piezoelectric scanner.
The samples were brought to an AFM (Nx-10, Park Systems) for sample characterization. The microscope is on top of an active vibration isolation table and enclosed in an environmentally sealed acoustic enclosure box. The topography and lateral force images were obtained in the air at ∼ 30°C and ∼ 20% relative humidity. All images were acquired at a speed of 1 μm/s with a cantilever of 3.6 N/m bending constant (FESPW, Bruker), and load ranging from 0.1 to 1.0 μN. The sharp tip of the AFM is easily damaged when scanning the surface of the rock. That leads to variations in the tip-surface contact area, making the shear strength and adhesion analysis difficult to perform. Therefore, the tip was previously scratched on a silicon substrate to wear the tip apex, making it stable during image acquisition. The radius of curvature of the tip used in our experiments was measured by scanning a tip calibration grid and confirmed by SEM as 256 ± 13 nm.
Before the friction force measurements, the microscope photodetector was calibrated by measuring the lateral forces between the tip and an SiO2 sample while scanning with the same normal forces and speeds used at the shale experiments in scanning directions parallel and perpendicular to the cantilever’s main axis and considering a friction coefficient between silicon and SiO2 (Liu et al., 1996). One set of calibrated images was acquired to measure the friction as a function of normal load, analogous to the high-speed procedure reported by Bosse et al., 2014.
After AFM characterization, the samples were coated with a 10 nm thick conductive carbon layer. The layer was needed to prevent surface charging artifacts during the SEM analysis. After deposition, the samples were transferred to the SEM for characterization.
A scanning electron microscope (JSM-6490-LV, JEOL) was used to characterize the microstructure and mineralogical composition of the sample’s surfaces. The images were acquired in low vacuum using an electron beam of 20 keV, a working distance of 10 mm, with a backscattering electron detector (BSE) and energy dispersive x-ray spectroscopy (EDS). The SEM and EDS images were acquired at the same location of AFM. EDS compositional point analysis was used to determine the chemical composition of selected grains.
The open-source image processing package FIJI was used to register the SEM to the AFM image, to extract data of selected minerals from the friction images, and to segment the organic matter from the mineral phase (Schindelin et al., 2012). Initially, the SEM image was registered into AFM topography correlating two pairs of manually defined landmarks. Next, histograms of friction were recovered from the maximum load friction image in the minerals previously identified with EDS analysis. The organic matter phase was segmented in the same image using a non-local means filter and manual segmentation (Buades et al., 2011).
The next step was analyzing the effect of applied normal force, Fn,, on friction, Ff, of the selected minerals. The FIJI was used to colocalize the set of friction images to reduce the image deformations and translations between acquisitions with different loads (Thevenaz et al., 1998; Schindelin et al., 2012). The average friction, and its standard deviation, was recovered from a square of 10x10 pixel inside the selected minerals and organic matter regions. The above experimental steps were executed following the flow diagram listed in Figure 1. At the end of the data analysis step, a friction map for each individual phase and the friction dependence with load was obtained.
The effect of normal force, Fn,, on friction, Ff, can be described from the contact theory equations (Meyer et al., 1998). On scanning, the contact area, A, between the tip and the surface was estimated with the use of the Derjaguin-Muller-Toporov (DMT) model where:
Where R is the tip radius, Er is the reduced elastic modulus, and Fad is the adhesion between tip and surface, respectively (Derjaguin et al., 1975). The friction was obtained from shear strength τ following Ff = τ A (Carpick et al., 1999; Higgins et al., 2007; Cubillas and Higgins, 2009).
The elemental distribution observed by EDS indicates that silicates are predominant in our samples. The presence of quartz with silicon and oxygen only and feldspar with silicon, oxygen, aluminum, sodium, and calcium are abundant. Biotie, verified by typical crystalline habit and cleavage added to silicon, oxygen, potassium, aluminum, magnesium, and iron in a characteristic ratio, is also observed. The morphology and presence of sulfur and iron indicated the presence of pyrites. The regions with high carbon concentrations were associated with organic matter.
Figure 3A shows EDS color mapping obtained by overlaying the selected elemental maps with the BSE image. In this image, we identify the different elements by their colors. White squares indicate selected regions of quartz (Qtz), pyrite (Py), the feldspars andesine (And) and albite (Alb), the phyllosilicate biotite (Bio), and organic matter (OM) from which the correspondent local EDS point analysis was acquired. The spectra are exhibited in Figure 3B. Multiple peaks can be seen. Each of them is associated with the occurrence of the elements indicated.
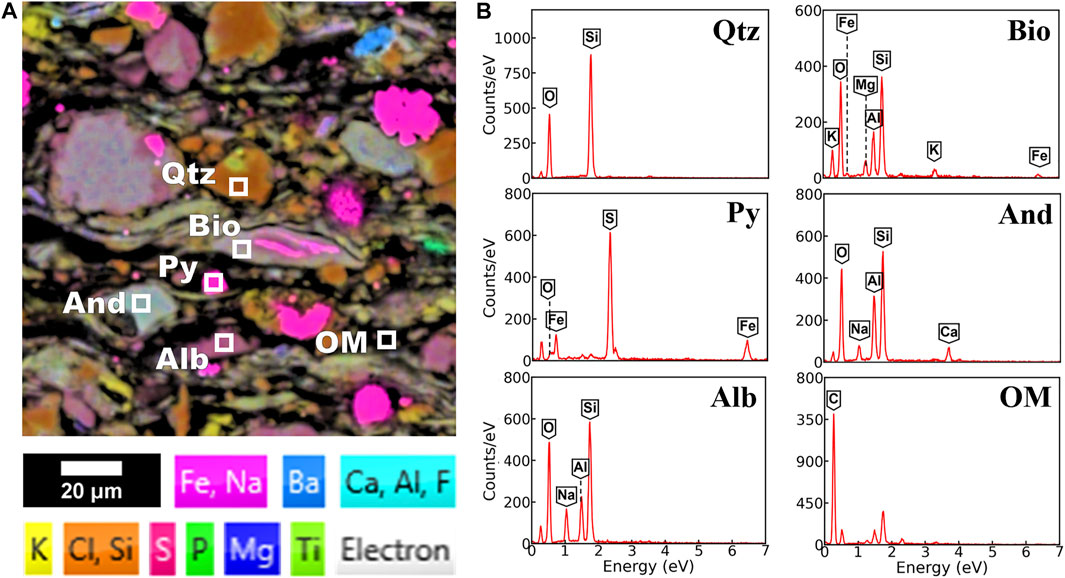
FIGURE 3. Mineralogical identification by SEM and EDS. (A) False color EDS mapping showing Fe, Na, Ba, Ca, Al, F, K, Cl, Si, P, Mg, and Ti elements distribution maps superimposed by a backscattering map and (B) EDS point analysis on quartz (Qtz), biotite (Bio), pyrite (Py), andesine (And), albite (Alb), and organic matter (OM).
Figure 4 shows colocalized BSE, AFM topography, error, and friction force images of an ROI. The BSE image in Figure 4A shows minerals with different textures and gray levels. Dark gray is associated with organic matter, followed by gray, which includes tectosilicates and clay minerals. The light gray level is associated with pyrite. The AFM topography image in Figure 4B shows several grains with sizes ranging from the micron to the nanoscale. The error image in Figure 4C highlights the high spatial-frequency variations associated with intercrystallite pores and edges. The friction image in Figure 4D shows minerals with low friction (in red and green) embedded in a high friction matrix of clay and biotite (cyan) and organic matter (dark blue). The pyrite, biotite, and organic matter are seen only in BSE and Friction images, while quartz, andesine, and albite are seen in all modes. Topography and error identify the variations in surface height, including the ones associated with porosity.
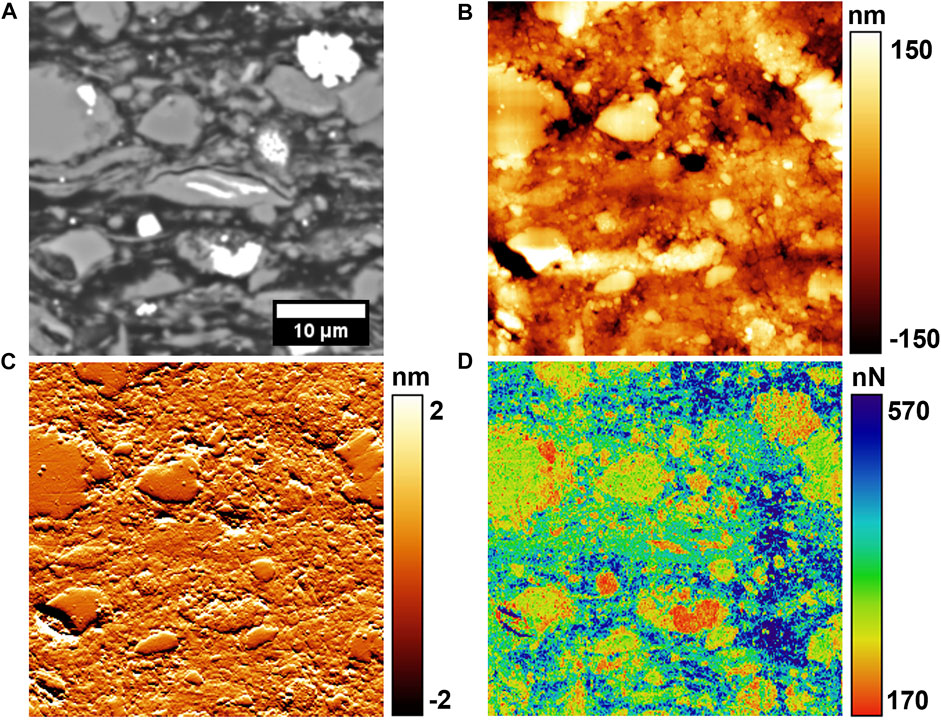
FIGURE 4. Scanning electron and force microscopy images of the same region from the shale surface. (A) Electron backscattering image, (B) surface topography, (C) error, and (D) friction force images measured by AFM. The friction image was acquired under a normal force of 1 μN.
The friction force image and histograms for representative minerals and organic matter are shown in Figure 5. The data from each mineral and organic matter were obtained from the ROI indicated by the contour squares in Figure 5A. Histograms of friction forces from minerals and organic matter are presented in Figure 5B. The lowest friction force (200 ± 20 nN) was measured on the pyrite. Friction forces on andesine (275 ± 19 nN), quartz (293 ± 22 nN), and albite (293 ± 34 nN) were in the intermediate range. The higher friction forces were registered on biotite (365 ± 31 nN) and organic matter (562 ± 49 nN). The values reported are the mean ± standard deviation of the histograms in Figure 5.
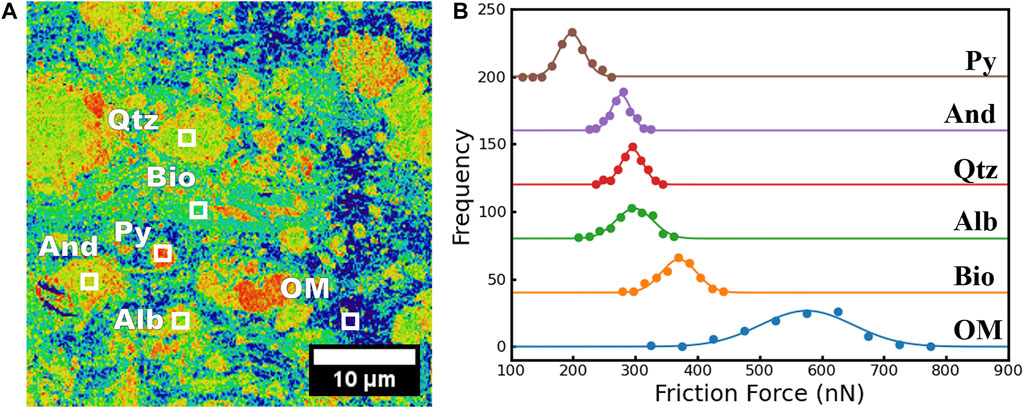
FIGURE 5. Friction measurements on minerals and organic matter. (A) Friction force image and identification of quartz (Qtz), biotite (Bio), pyrite (Py), andesine (And), albite (Alb), and organic matter (OM). (B) Distribution of friction forces observed on minerals and organic matter. The histograms were vertically offset to allow better visualization.
Once the friction forces for the different minerals and organic matter were determined, a friction threshold 470 nN was used to separate organic from inorganic fractions all over the surface. For instance, Figure 6A shows a friction force map of our sample surface where all regions showing the presence of organic matter are identified in blue. As highlighted in Figure 6B, the friction forces measured for the organic matter at a 1 μN normal load varied between 400 nN and 700 nN, with a most frequent value at 456 nN. The segmentation shows that the organic matter is distributed over ∼20% of the imaged area.
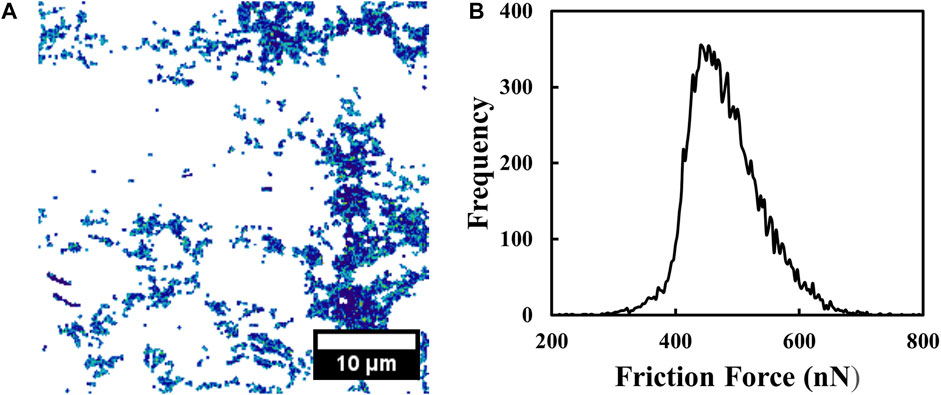
FIGURE 6. Distribution of organic matter. In 5 (A), surface sites where organic matter was identified by the friction forces between the sample and the microscope tip are shown. In 5 (B), the statistical distribution of friction forces observed for the organic matter is presented. A 1.0 μN normal force was used.
Figure 7 shows the load dependence of the friction forces for minerals and organic matter. The data was fitted (red dotted curve) by the
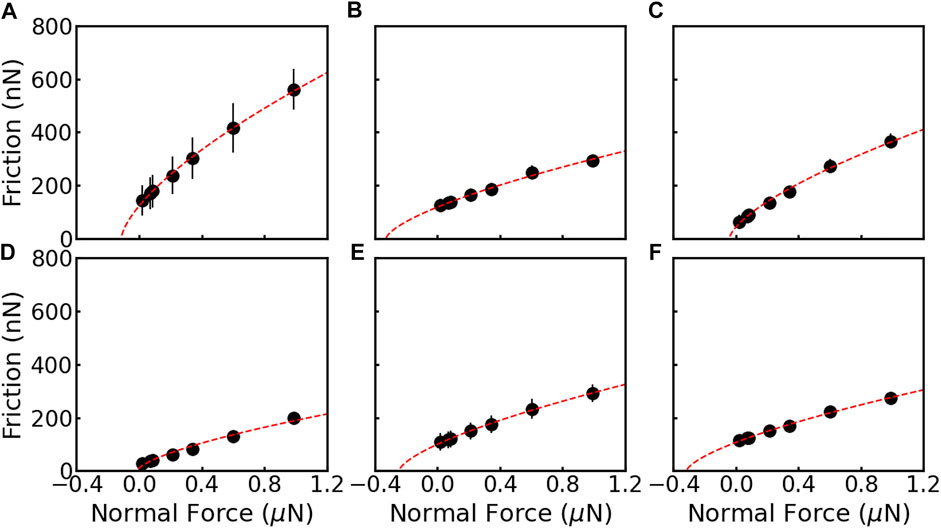
FIGURE 7. Friction force as a function of normal force for (A) organic matter, (B) quartz, (C) biotite, (D) pyrite, (E) albite, and (F) andesine grains. The black dots and error bars are average and standard deviation, respectively. The red dotted lines are the curves fitted using the DMT model.
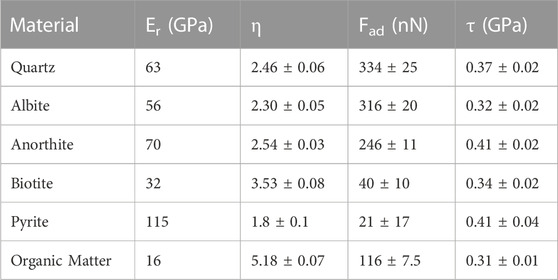
TABLE 1. Frictional experiment parameters and data summary. The reduced modulus Er, adjusted η parameter, the adhesion force Fad, and the shear strength are presented.
Thousands of asperities may contact each other on a contact interface. Deformation of the asperities in contact occurs due to the applied load and depends on the material’s elastic modulus. Shear stresses may lead to further elastic, plastic, and even fracture of the asperities in contact. As shear stress becomes high enough, the deformed or broken asperities may slide past each other, giving origin to the slip between the surfaces in contact.
In shale, a rock with a fine grain and rich composition, the asperities in contact may be formed by a large combination of materials with significantly different mechanical properties. Moreover, the contact interfaces may be mediated by gouges or even exogenous particles. Besides all that, the frictional strength observed for the surface of the rocks is in the range of 0.3–0.7 (Ikari et al., 2011; Kohli and Zoback, 2013; Kubo and Katayama, 2015; Yan et al., 2016; Wang et al., 2019). In good agreement, the measured friction coefficient between the AFM silicon tip and each of the individual shale constituents is within the same range. Our measurements show that the coefficient for the inorganic fraction of the shale ranges between 0.2 and 0.3, while for the organic matter is ∼0.4.
The nonlinear DMT contact model describes the data well, allowing the adhesion and shear strength determination and indicating attractive long-range forces at the interface. Our data agree with the adhesion reported for kerogen, 100–120 nN (Tian et al., 2018; Tian et al., 2019). The results also indicate that the contact shear strength is independent of the applied normal force. The contact shear strength was higher for quartz, pyrite, and anorthite (∼0.4 GPa) and low for albite, biotite, and organic matter (∼0.3 GPa). The calculated shear strengths are in the same order as those estimated from nanoscale friction measurements (Carpick et al., 1997).
Considering that the mineralogical composition determines the frictional behavior of the interfaces, our shear strength results indicate that surfaces rich in quartz are less likely to initiate slip than surfaces rich in biotite and organic matter. However, once shear is initiated, the slip of surfaces rich in quartz is more likely to continue than those rich in biotite and organic matter due to the friction coefficient. Our results agree with the literature in that shear failure is less likely for fractures with higher tectosilicate content (Fang et al., 2018).
We demonstrate the in situ characterization of shale components with friction maps. These maps highlight that the measurement of frictional and shear strength give access to the mineralogical compositional of the surface with high spatial resolution. In our case, surface sites as small as ∼15 nm could be unequivocally identified. This lateral resolution is comparable to the resolution observed using AFM mechanical modulus mapping techniques (Eliyahu et al., 2015; Emmanuel et al., 2016a; Emmanuel et al., 2016b; Yang et al., 2017; Khatibi et al., 2018; Li et al., 2018; Graham et al., 2020). The friction contrast allows the separation of the organic matter from the tectosilicates, phyllosilicates, and sulfide. Nevertheless, difficulties in separating the plagioclase and biotite with friction only are evident due to the partial overlap between the friction histograms (Figure 5). To overcome that, additional info from SEM, EDS, and correlative image techniques is needed. With the use of EDS, we were able to observe albite, anorthite, and biotite—materials with similar frictional strengths—in our sample.
Among the components of shale, organic matter is the one that attracts the most attention. It not only affects the sliding of fractured surfaces, as indicated by our results, but also their amount and type, which will be critical factors for the economic development of the rock. Our experiment demonstrates that the friction contrast measured in the lateral force mode by AFM may also contribute to identifying the organic matter fraction at the surface.
Histogram thresholding-based segmentation was used to separate the organic from inorganic components of the rock. The contrast observed in the friction image allows the accurate identification of the pixel ranges for the organic matter and a map, indicating the surface sites with the presence of the organic material, can be obtained, like the one shown in Figure 6. The sites where friction strengths correspond to the organic matter were observed covers 20% of the surface. Considering typical density values and mineralogical distributions we can expect a variation between 15% and 35% (Anjos et al., 2010; Nicolini et al., 2011; Holanda et al., 2016) for volumetric organic matter fraction, which agrees with our measures. In this map, the distribution of frictional strengths may be attributed to the local variation on the physical properties of the organic matter. These results show that the use of frictional contrast obtained with the use of the lateral force microscope mode, and available on any AFM, can accurately locate the organic components present at the surface of the rock.
In this work, we have explored atomic force microscopy in the lateral force mode to measure friction and shear strength at individual minerals and organic matter of a shale fragment from the Irati formation. The organic matter exhibits a lower shear strength than other materials. Moreover, its shear strength value at the nanoscale is in the same order as macroscale shear strengths observed for organic-rich shale rocks, contributing to understanding organic matter effects in slip propagation in shale rocks.
The use of the AFM, a high-resolution microscopy technique with the ability to simultaneously measure topography and tribological properties of the materials, has additional benefits on shale characterization. We demonstrate that friction force characteristics of minerals and organic matter of immature shale fragments can be used to examine the spatial distribution of shale composition. Friction between the microscope tip and shale compositional phases is higher for organic matter, followed by tectosilicates and pyrite. We have observed that the organic matter, tectosilicates, and pyrite were unambiguously identified by their friction forces. On the other hand, more than the AFM friction data is needed to identify quartz, albite, and anorthite phases. Identifying these phases demands a combination of AFM friction analysis with EDS spectroscopy performed at the SEM.
When compared with AFM elastic modulus measurements, the lateral force method, available in any commercial AFM, allows in one single image the geochemical and morphological characterization of individual minerals and organic matter in shale rocks with a wide range of elastic modulus, varying in two orders of magnitude.
The original contributions presented in the study are included in the article/supplementary material, further inquiries can be directed to the corresponding author.
DLPL conception, design of the work, acquisition of AFM data, analysis, and interpretation of data. RP conception, design of the work, acquisition of AFM data, analysis, and interpretation of data. YMP-S acquisition and interpretation of SEM/EDS data. GFV conception, design of the work, and interpretation of data. All authors contributed to the article and approved the submitted version.
This study was financed in part by the Coordenação de Aperfeiçoamento de Pessoal de Nível Superior—Brasil (CAPES) and the Financiadora de Estudos e Projetos (FINEP).
The authors declare that the research was conducted in the absence of any commercial or financial relationships that could be construed as a potential conflict of interest.
All claims expressed in this article are solely those of the authors and do not necessarily represent those of their affiliated organizations, or those of the publisher, the editors and the reviewers. Any product that may be evaluated in this article, or claim that may be made by its manufacturer, is not guaranteed or endorsed by the publisher.
Anjos, C. W. D. D., Meunier, A., Guimarães, E. M., and el Albani, A. (2010). Saponite-rich black shales and nontronite beds of the permian Irati Formation: Sediment sources and thermal metamorphism (Paraná Basin, Brazil). Clays Clay Minerals 58 (5), 606–626. doi:10.1346/ccmn.2010.0580503
Ben-David, O., Rubinstein, S. M., and Fineberg, J. (2010). Slip-stick and the evolution of frictional strength. Nature 463 (7277), 76–79. doi:10.1038/nature08676
Bosse, J. L., Lee, S., Andersen, A. S., Sutherland, D. S., and Huey, B. D. (2014). High speed friction microscopy and nanoscale friction coefficient mapping. Meas. Sci. Technol. 25 (11), 115401. doi:10.1088/0957-0233/25/11/115401
Buades, A., Coll, B., and Morel, J.-M. (2011). Non-local means denoising. Image processing on line, 208–212. doi:10.5201/ipol.2011.bcm_nlm
Carpick, R. W., Frank, O. D., and Salmeron, M. (1999). A general equation for fitting contact area and friction vs load measurements. J. Colloid Interface Sci., 211(2), 395–400. doi:10.1006/jcis.1998.6027
Carpick, R. W., Ogletree, D. F., and Salmeron, M. (1997). Lateral stiffness: A new nanomechanical measurement for the determination of shear strengths with friction force microscopy. Appl. Phys. Lett. 70 (12), 1548–1550. doi:10.1063/1.118639
Cubillas, P., and Higgins, S. R. (2009). Friction characteristics of Cd-rich carbonate films on calcite surfaces: Implications for compositional differentiation at the nanometer scale. Geochem. Trans. 10 (1), 7. doi:10.1186/1467-4866-10-7
Derjaguin, B. V., Muller, V. M., and Toporov, Yu.P. (1975). Effect of contact deformations on the adhesion of particles. J. Colloid Interface Sci. 53 (2), 314–326. doi:10.1016/0021-9797(75)90018-1
Dieterich, J. H., and Kilgore, B. D. (1994). Direct observation of frictional contacts: New insights for state-dependent properties. Pure Appl. Geophys. PAGEOPH 143 (1-3), 283–302. doi:10.1007/bf00874332
Eliyahu, M., Emmanuel, S., Day-Stirrat, R. J., and Macaulay, C. I. (2015). Mechanical properties of organic matter in shales mapped at the nanometer scale. Mar. Petroleum Geol. 59, 294–304. doi:10.1016/j.marpetgeo.2014.09.007
Emmanuel, S., Eliyahu, M., Day-Stirrat, R. J., Hofmann, R., and Macaulay, C. I. (2016a). Impact of thermal maturation on nano-scale elastic properties of organic matter in shales. Mar. Petroleum Geol. 70, 175–184. doi:10.1016/j.marpetgeo.2015.12.001
Emmanuel, S., Eliyahu, M., Day-Stirrat, R. J., Hofmann, R., and Macaulay, C. I. (2016b). Softening of organic matter in shales at reservoir temperatures. Pet. Geosci. 23 (2), 262–269. doi:10.1144/petgeo2016-035
Fang, Y., Elsworth, D., Wang, C., and Jia, Y. (2018). Mineralogical controls on frictional strength, stability, and shear permeability evolution of fractures. J. Geophys. Res. Solid Earth 123 (5), 3549–3563. doi:10.1029/2017jb015338
Graham, S. P., Rouainia, M., Aplin, A. C., Cubillas, P., Fender, T. D., and Armitage, P. J. (2020). Geomechanical characterisation of organic-rich calcareous shale using AFM and nanoindentation. Rock Mech. Rock Eng. 54 (1), 303–320. doi:10.1007/s00603-020-02261-6
Higgins, S. R., Hu, X., and Fenter, P. (2007). Quantitative lateral force microscopy study of the dolomite (104)−Water interface. Langmuir 23 (17), 8909–8915. doi:10.1021/la700467q
Higgins, S. R., and Hu, X. (2005). Self-limiting growth on dolomite: Experimental observations with in situ atomic force microscopy. Geochimica Cosmochimica Acta 69 (8), 2085–2094. doi:10.1016/j.gca.2004.10.010
Holanda, W., Bergamaschi, S., Santosdos, A. C., Rodrigues, R., and Bertolino, L. C. (2016). Characterization of the Assistência member, Irati Formation, Paraná Basin, Brazil: Organic matter and mineralogy/caracterização do membro do Assistência, formação Irati, bacia do Paraná, Brasil: Matéria orgânica E mineralogia. J. Sediment. Environ. 3 (1), 36–45. doi:10.12957/jse.2018.33304
Hu, J., Yang, S., Fu, D., Rui, R., Yu, Y., and Chen, Z. (2016). Rock mechanics of shear rupture in shale gas reservoirs. J. Nat. Gas Sci. Eng. 36, 943–949. doi:10.1016/j.jngse.2016.11.033
Hu, X., Cubillas, P., and Higgins, S. R. (2010). Properties of Ca-rich and Mg-rich carbonate films on dolomite: Implications for compositional surface mapping with scanning force microscopy. Langmuir 26 (7), 4769–4775. doi:10.1021/la9035425
Ikari, M. J., Marone, C., and Saffer, D. M. (2011). On the relation between fault strength and frictional stability. Geology 39 (1), 83–86. doi:10.1130/g31416.1
Javadpour, F., Moravvej Farshi, M., and Amrein, M. (2012). Atomic-force microscopy: A new tool for gas-shale characterization. J. Can. Petroleum Technol. 51 (04), 236–243. doi:10.2118/161015-pa
Javadpour, F. (2009). Nanopores and apparent permeability of gas flow in mudrocks (shales and siltstone). J. Can. Petroleum Technol. 48 (08), 16–21. doi:10.2118/09-08-16-da
Kerr, R. A. (2010). Natural gas from shale bursts onto the scene. Science 328 (5986), 1624–1626. doi:10.1126/science.328.5986.1624
Khatibi, S., Ostadhassan, M., Tuschel, D., Gentzis, T., Bubach, B., and Carvajal-Ortiz, H. (2018). Raman spectroscopy to study thermal maturity and elastic modulus of kerogen. Int. J. Coal Geol. 185, 103–118. doi:10.1016/j.coal.2017.11.008
Kohli, A. H., and Zoback, M. D. (2013). Frictional properties of shale reservoir rocks. J. Geophys. Res. Solid Earth 118 (9), 5109–5125. doi:10.1002/jgrb.50346
Kubo, T., and Katayama, I. (2015). Effect of temperature on the frictional behavior of smectite and illite. J. Mineralogical Petrological Sci. 110 (6), 293–299. doi:10.2465/jmps.150421
Kumar, S., Das, S., Bastia, R., and Ojha, K. (2018). Mineralogical and morphological characterization of older cambay shale from north cambay basin, India: Implication for shale oil/gas development. Mar. Petroleum Geol. 97, 339–354. doi:10.1016/j.marpetgeo.2018.07.020
Li, C., Ostadhassan, M., Guo, S., Gentzis, T., and Kong, L. (2018). Application of PeakForce tapping mode of atomic force microscope to characterize nanomechanical properties of organic matter of the Bakken Shale. Fuel 233, 894–910. doi:10.1016/j.fuel.2018.06.021
Li, Q., Tullis, T. E., Goldsby, D., and Carpick, R. W. (2011). Frictional ageing from interfacial bonding and the origins of rate and state friction. Nature 480 (7376), 233–236. doi:10.1038/nature10589
Liu, E., Blanpain, B., and Celis, J. P. (1996). Calibration procedures for frictional measurements with a lateral force microscope. Wear 192 (1-2), 141–150. doi:10.1016/0043-1648(95)06784-1
Mavko, G., Mukerji, T., and Dvorkin, J. (2009). The rock physics handbook: Tools for seismic analysis of porous media. Cambridge, UK; New York: Cambridge University Press.
Meyer, E., Gyalog, T., Overney, R. M., and Dransfeld, K. (1998). Nanoscience: Friction and rheology on the nanometer scale. Singapore: World Scientific.
Middleton, R. S., Hyman, J. D., and Viswanathan, H. S. (2017). The shale gas revolution: Barriers, sustainability, and emerging opportunities. Appl. Energy 199, 88–95. doi:10.1016/j.apenergy.2017.04.034
Milani, E. J., and Zalán, P. V. (1999). An outline of the geology and petroleum systems of the Paleozoic interior basins of South America. Episodes 22 (3), 199–205. doi:10.18814/epiiugs/1999/v22i3/007
Nicolini, J., Pereira, B. F., Pillon, C. N., Machado, V. G., Lopes, W. A., de Andrade, J. B., et al. (2011). Characterization of Brazilian oil shale byproducts planned for use as soil conditioners for food and agro-energy production. J. Anal. Appl. Pyrolysis 90 (2), 112–117. doi:10.1016/j.jaap.2010.11.001
Prasad, M., Kopycinska, M., Rabe, U., and Arnold, W. (2002). Measurement of Young’s modulus of clay minerals using atomic force acoustic microscopy. Geophys. Res. Lett., 29(8), 13–14. doi:10.1029/2001gl014054
Schindelin, J., Arganda-Carreras, I., Frise, E., Kaynig, V., Longair, M., Pietzsch, T., et al. (2012). Fiji: An open-source platform for biological-image analysis. Nat. methods 9 (7), 676–682. doi:10.1038/nmeth.2019
Scholz, C. H., and Engelder, J. T. (1976). The role of asperity indentation and ploughing in rock friction — I. Int. J. Rock Mech. Min. Sci. Geomechanics Abstr. 13 (5), 149–154. doi:10.1016/0148-9062(76)90819-6
Shlomai, H., Kammer, D. S., Adda-Bedia, M., and Fineberg, J. (2020). The onset of the frictional motion of dissimilar materials. Proc. Natl. Acad. Sci. 117 (24), 13379–13385. doi:10.1073/pnas.1916869117
Svetlizky, I., and Fineberg, J. (2014). Classical shear cracks drive the onset of dry frictional motion. Nature 509 (7499), 205–208. doi:10.1038/nature13202
Tembe, S., Lockner, D. A., and Wong, T.-F. (2010). Effect of clay content and mineralogy on frictional sliding behavior of simulated gouges: Binary and ternary mixtures of quartz, illite, and montmorillonite. J. Geophys. Res. 115 (B3), B03416. doi:10.1029/2009jb006383
Thevenaz, P., Ruttimann, U. E., and Unser, M. (1998). A pyramid approach to subpixel registration based on intensity. IEEE Trans. Image Process. 7 (1), 27–41. doi:10.1109/83.650848
Tian, S., Dong, X., Wang, T., Zhang, R., Zhang, P., Sheng, M., et al. (2018). Surface properties of organic kerogen in continental and marine shale. Langmuir 34 (46), 13882–13887. doi:10.1021/acs.langmuir.8b03151
Tian, S., Wang, T., Li, G., Sheng, M., and Zhang, P. (2019). Nanoscale surface properties of organic matter and clay minerals in shale. Langmuir 35 (17), 5711–5718. doi:10.1021/acs.langmuir.9b00157
Wang, J., Ge, H., Wang, X., Shen, Y., Liu, T., Zhang, Y., et al. (2019). Effect of clay and organic matter content on the shear slip properties of shale. J. Geophys. Res. Solid Earth 129, 9505–9525. doi:10.1029/2018JB016830
Wang, W., Li, J., Fan, M., and Abedi, S. (2017). Characterization of electrical properties of organic-rich shales at nano/micro scales. Mar. Petroleum Geol. 86, 563–572. doi:10.1016/j.marpetgeo.2017.06.021
Yan, W., Ge, H., Wang, J., Wang, D., Meng, F., Chen, J., et al. (2016). Experimental study of the friction properties and compressive shear failure behaviors of gas shale under the influence of fluids. J. Nat. Gas Sci. Eng. 33, 153–161. doi:10.1016/j.jngse.2016.04.019
Yang, J., Hatcherian, J., Hackley, P. C., and Pomerantz, A. E. (2017). Nanoscale geochemical and geomechanical characterization of organic matter in shale. Nat. Commun. 8 (1), 2179. doi:10.1038/s41467-017-02254-0
Zalán, P. V., Wolff, S., Astolfi, M. A. M., Vieira, I. S., Concelção, J. C. J., Appi, V. T., et al. (1990). The Paraná Basin, Brazil. Inter. Crat. Basins. doi:10.1306/m51530c34
Zeszotarski, J. C., Chromik, R. R., Vinci, R. P., Messmer, M. C., Michels, R., and Larsen, J. W. (2004). Imaging and mechanical property measurements of kerogen via nanoindentation. Geochimica Cosmochimica Acta 68 (20), 4113–4119. doi:10.1016/j.gca.2003.11.031
Zhang, F., An, M., Zhang, L., Fang, Y., and Elsworth, D. (2020). Effect of mineralogy on friction-dilation relationships for simulated faults: Implications for permeability evolution in caprock faults. Geosci. Front. 11 (2), 439–450. doi:10.1016/j.gsf.2019.05.014
Zhao, S., Li, Y., Wang, Y., Ma, Z., and Huang, X. (2019). Quantitative study on coal and shale pore structure and surface roughness based on atomic force microscopy and image processing. Fuel 244, 78–90. doi:10.1016/j.fuel.2019.02.001
Keywords: shear-strength, friction, shale, organic matter, minerals
Citation: de Lacerda DLP, Prioli R, Parizek-Silva YM and Vasquez GF (2023) Nanoscale identification and characterization of the shear strength of minerals and organic matter in shale. Front. Earth Sci. 11:1132118. doi: 10.3389/feart.2023.1132118
Received: 26 December 2022; Accepted: 20 June 2023;
Published: 02 August 2023.
Edited by:
Qiaomu Qi, Chengdu University of Technology, ChinaReviewed by:
Hewu Liu, Anhui University of Science and Technology, ChinaCopyright © 2023 de Lacerda, Prioli, Parizek-Silva and Vasquez. This is an open-access article distributed under the terms of the Creative Commons Attribution License (CC BY). The use, distribution or reproduction in other forums is permitted, provided the original author(s) and the copyright owner(s) are credited and that the original publication in this journal is cited, in accordance with accepted academic practice. No use, distribution or reproduction is permitted which does not comply with these terms.
*Correspondence: R. Prioli, cHJpb2xpQHZkZy5maXMucHVjLXJpby5icg==
Disclaimer: All claims expressed in this article are solely those of the authors and do not necessarily represent those of their affiliated organizations, or those of the publisher, the editors and the reviewers. Any product that may be evaluated in this article or claim that may be made by its manufacturer is not guaranteed or endorsed by the publisher.
Research integrity at Frontiers
Learn more about the work of our research integrity team to safeguard the quality of each article we publish.