
94% of researchers rate our articles as excellent or good
Learn more about the work of our research integrity team to safeguard the quality of each article we publish.
Find out more
ORIGINAL RESEARCH article
Front. Earth Sci., 25 May 2023
Sec. Solid Earth Geophysics
Volume 11 - 2023 | https://doi.org/10.3389/feart.2023.1131730
This article is part of the Research TopicRock Physics of Unconventional Reservoirs, volume IIView all 15 articles
 D. L. P. de Lacerda1*
 M. J. Morschbacher1J. C. R. Justen1
 G. F. Vasquez1A. L. D. Spigolon1
 T. R. Menezes2
 R. Skinner1
The elastic moduli are a function of properties that could vary between samples and change during maturation. Consequently, the effects of organic matter maturation on the elastic wave velocities of organic-rich rocks are challenging to describe. This work analyzes the isolated maturation effects on the organic content, pore volume, microstructure, and propagation velocities of elastic waves. To avoid any initial rock heterogeneity, we prepared a series of homogeneous samples from a unique outcrop block collected on the Eagle Ford formation with mineral composition initially determined using X-ray diffraction. From the initial set, four samples were held in their original condition and four were artificially maturated by hydropyrolysis until transformation rates were up to 95%. Then, the evolution of the sample properties was examined using an association of LECO TOC, Rock-Eval pyrolysis, vitrinite reflectance, mercury intrusion porosimetry (MIP), and ultrasonic pulse propagation. In addition, scanning electron microscopy images registered the microstructure evolution. To evaluate the effects of maturation on pore geometry and the organic matter elastic moduli, we analyze the relationship between the measured quantities using a rock physics inclusion model with the unmeasured properties taken as fitting parameters. The hydropyrolysis maturation increases the vitrinite reflectance from the initial 0.55% to 1.34% on the most matured sample. A total organic carbon reduction from 4.2% to 2.1% and a porosity increase from 9.2% to 21% are associated with observed maturation. The geochemical characterization on cleaned samples reveals an initial increment of soluble organic matter followed by a monotonical reduction related to oil migration out of bulk volume. The measurement of wave propagation velocities as a function of confining pressure displays an increasing pressure sensitivity with a downward trend in both velocity moduli. The petrophysical analysis indicates that the porosity increases through organic matter consumption and pore creation. The rock physics diagnoses indicate a decrease in the pore aspect ratio with an increase in the elastic modulus of the organic matter with maturation.
In traditional petroleum systems, mudrocks and shales can play the roles of both the cap and source rock (Bjorlykke, 2010). The relevance of understanding the physical properties of these lithologies becomes evident when considering that 30% of failures in exploratory wells are related to charging and 45% are related to sealing problems (Rayeva et al., 2014). More recently, the self-sourced reservoirs on unconventional shales increased the demand to understand the physical properties of those lithologies and the need for mapping them in seismic conditions (Vernik, 2016). In fact, the mapping of geochemical properties in seismic conditions could also contribute to source/cap rock delimitation and the analysis of migration pathways (Hansen et al., 2019). As elastic wave propagation velocities link the geochemical rock properties to the seismic response, characterizing the effects of organic matter content and maturation in the elastic properties are essential for understanding the seismic signal (Avseth et al., 2010).
Natural series of mudrocks were previously characterized in other publications. For example, Vernik and Nur (1992) described black shales from the Bakken Formation as a vertically transverse isotropic medium with wave propagation velocities, its anisotropy, and the effects of confining pressure on those parameters dependent on kerogen content, maturation, and the occurence of bedding-parallel microcracks. Vernik (1994) proposed that the closure of bedding-parallel microcracks, induced by the generation process, causes the high sensitivity of the compressional velocity propagating through shale laminations to confining pressure, especially at low range (Vernik and Landis, 1996; Vernik and Liu, 1997).
Studying the effect of maturation on naturally maturated samples is challenging as they are usually limited to narrow maturation ranges (Allan et al., 2014). Working with a series of artificially maturated samples is one alternative that overcomes the limitation imposed by using the rarely available naturally maturated ones (Lewan and Birdwell, 2013). Allan et al. (2014) measured the compressional wave velocity in samples maturated by dry pyrolysis. Allan et al. (2016) discussed the modification of anisotropic compressional and shear velocities due to fractures induced by hydrocarbon generation in samples of Barnett and Green River shales artificially maturated by dry pyrolysis. Suwannasri et al. (2018) reported increasing porosity and sensitivity of propagation velocities to pressure in a series of Eagle Ford samples maturated by dry pyrolysis. Shitrit et al. (2017) applied a rock physics model (RPM) to analyze the effects of maturation and composition in chalk samples from the Ghareb and the Mishash formations with generation induced by dry pyrolysis.
Despite the successful use of anhydrous pyrolysis in artificial maturation, the hydropyrolysis setup better replicates the generated products and the migration of oil (Lewan, 1994). In one of the few studies with samples prepared using hydropyrolysis, Zargari et al. (2013) reported a reduction in the microscale Young’s modulus of samples maturated at 350°C. Environmental relevance was also studied by Moyer and Prasad (2017), who compared both protocols and reported more efficient conversion from kerogen into bitumen with higher variations of elastic properties in samples prepared in hydrous conditions. Still, further investigations are necessary to understand the effects of hydropyrolysis on the elastic properties of organic-rich mudrocks.
The processes triggered by the maturation of organic matter can change the composition, microstructure, porosity, and saturation of the rock. Different approaches describe the individual contribution of those parameters to the macroscopic elastic properties. The presence of kerogen in solid composition was described by a modified Backus average (Vernik and Landis, 1996), inclusions (Wang et al., 2018), and solid substitution (Zhao et al., 2016). The maturation also modifies the kerogen properties, which can be calculated from first principles (Ibrahim et al., 2020), modeled empirically (Sengupta et al., 2022), or defined a priori (Zhao et al., 2016). There are studies that model the porosity as inclusions (Zhao et al., 2016) and fractures (Liu et al., 2020), with fluid effects considered after using Gassmann equations (Zhao et al., 2016). The maturation effects on the elastic properties can be obtained as the summation of all previous parameters, in addition to the structural modification from load bearing to filling kerogen considered by some authors (Zhao et al., 2016; Shitrit et al., 2017). Regarding the complexity of the models, Dvorkin et al. (2021) suggested that elaborated models can lead to a high number of unknown inputs and proposed a “simple as possible” theoretical approach to reduce free parameters and the use of unmeasured properties.
In this study, we present experimental results from a series of Eagle Ford samples artificially maturated by isothermal hydropyrolysis with a single heating cycle for each sample. The obtained samples, in addition to a set of four immature ones, had their petrophysical, geochemical, and elastic properties characterized in the laboratory using mercury intrusion porosimetry (MIP), LECO TOC, Rock–Eval pyrolysis, vitrinite reflectance, and ultrasonic pulse propagation. We constructed a petrophysical model from where the density of kerogen and the oil can be estimated. We also elaborated a simple inclusion RPM to diagnose the effects of maturation in pore geometry and the elastic properties of the organic matter.
This section presents the materials and the hydropyrolysis method used to prepare a series of organic-rich samples from immature to depleted. The induced maturation process modifies multiple properties of the rock and kerogen itself, as detected by the characterization methods (MIP, LECO TOC, Rock–Eval pyrolysis, and vitrinite reflectance). The compressional and shear wave velocities, measured by ultrasonic pulse propagation, are functions not only of all these properties but also of the microstructure, which we visualized using scanning electron microscopy (SEM). This section also presents the characterization methods mentioned previously, the parameters calculated from direct measurements, and the RPM used for data analysis.
A block of Eagle Ford shale, supplied by Kocurek Industries Inc., was initially segmented in 15 prisms of 4 cm × 5 cm × 4 cm, with a number assigned to each of them as identification. LECO TOC and Rock–Eval pyrolysis on sample 15 allowed the block to be identified as an organic-rich (TOC = 4%) immature (IH = 629 mg HC/g TOC) mudrock. After the geochemical first result, samples 3, 7, and 14 were preserved for characterization of the immature state, and samples 1, 2, 9, and 12 were chosen to be artificially maturated.
During hydropyrolysis, the sample was positioned with horizontal bedding in the bottom of a pressure vessel. To avoid cracking along the bedding, the sample was held by a clamp made of AISI316 steel, limiting expansion along the vertical direction (Lewan and Birdwell, 2013). The vessel was filled with a calculated amount of distilled and deionized water to keep the sample immersed during the experiment. The closed system was heated for 72 h under temperatures between 300°C and 360°C, as shown in Table 1. A more detailed description of the experimental conditions can be found in Spigolon et al. (2015).
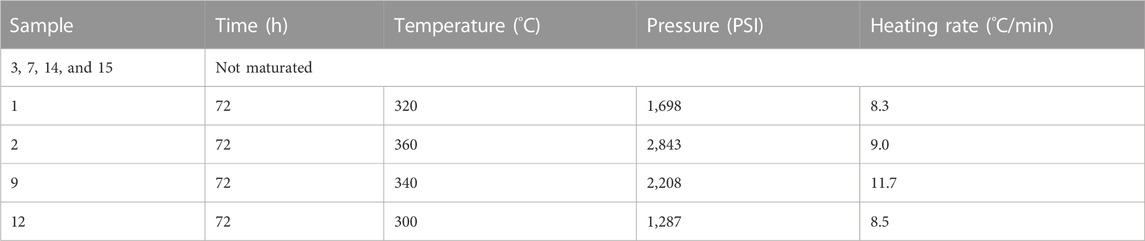
TABLE 1. List of samples and the experimental programs used for artificial maturation.
The immature samples and the matured ones were subsampled for mineralogy, geochemistry, and porosity measurements. Then, the remaining material was machined into a 1-inch plug used for petroelastic characterization by ultrasonic pulse propagation. After this, each plug was resampled, and its microstructure was characterized using an SEM.
The total mineralogy fractions were examined by X-ray diffraction (XRD) on the original samples. For total mineralogy analysis, each sample was micronized and pressed into one tablet with aleatorily distributed particles. The XRD diffractogram was acquired on a D/MAX-2,200/PC (Rigaku, Tokyo) and analyzed using the Rietveld method to determine the weight fraction of the identified minerals (Young, 1995).
A set of geochemical measurements was obtained to describe the evolution of the content, type, and maturation of organic matter. Total organic carbon was measured by the LECO TOC, and its type and oil potential evolution were analyzed using Rock–Eval pyrolysis results. The maturation was described in terms of vitrinite reflectance and transformation rate. In order to make this work self-contained, we describe the techniques and their results in the following paragraphs.
The weight fraction of the organic matter content was determined on a carbon analyzer model SC-144 (LECO, St. Joseph, Michigan) using an infrared detector. Before characterization, the subsample was fragmented, and the mineral carbonates were removed by hydrochloric acid (HCl). Then, the remaining aliquot was combusted at 1,350°C under constant oxygen flux, while the generated CO2 was measured. By hypothesis, all inorganic carbon was removed by acidification, so all the liberated carbon was from organic matter. We refer to Behar et al. (2001) for more information about sample preparation and the LECO analyzer.
During the Rock–Eval test, the sample is heated from 300°C to 650°C in an inert environment while the hydrocarbon emission is measured. The monitored emission occurs in peaks associated with thermovaporization of free oil, called peak S1, and the organic matter cracking, called peak S2. The surface areas of peaks S1 and S2 are respectively measures of free volatile hydrocarbons content and the petroleum generation potential. The temperature of peak S2 is also recorded as the Tmax parameter. In the second stage, the sample was heated under the oxidizing environment, and the CO2 yield is recorded in mg CO2/g rock as peak S3. For a more detailed description, we may refer to Behar et al. (2001).
The LECO TOC and Rock–Eval pyrolysis results were analyzed together to characterize the type and maturation of organic matter. The composition changes since the generation process modifies the proportion of hydrogen, oxygen, and carbon available on the kerogen structure. The hydrogen index (HI = S2/TOC) and oxygen index (OI = S3/TOC), as measurements of hydrogen/carbon and oxygen/carbon proportions, are also altered in a trajectory that is indicative of kerogen type. The Blanc–Valleron plot of S2 as a function of TOC and HI versus OI in a van Krevelen-type diagram were used to evaluate and classify the kerogen type and evolution as the function of maturation (Espitalié et al., 1977; Langford and Blanc-Valleron, 1990).
The maturation itself was determined using the transformation rate and vitrinite reflectance. The transformation rate is calculated as
where S2o and S2 are the oil potential for the sample in its original condition and for the actual sample, respectively. The S2 is a measure of how much hydrocarbon the kerogen can generate. This value is reduced with the advancement of maturation until all the oil potential is depleted. TR is a measure of how much of the oil potential was depleted (Spigolon et al., 2015).
Vitrinite is an organic material found on shales and mudrocks. Its reflectivity changes as a function of the heating, allowing the use of reflectance as a method for estimating the maturation of the organic matter. The vitrinite reflectance, Ro, can be used to determine the actual maturation stage. The analytical procedures of reflectance measurements follow the standardization of the Measurement of Reflectance on Vitrinite occurring as Dispersed Organic Matter of the ICCP Accreditation Program–DOMVR (Borrego et al., 2006; ASTM-D7708-14, 2014; Hackley, 2015). The classification followed Horsfield and Rullkötter (1994), with the intervals 0.5% < Ro < 1.3% and 1.3% < Ro < 2.0% measured for samples in oil and wet-gas windows, respectively. In a similar approach, the oil window can be subdivided as early mature (0.6% < Ro < 0.65%), peak (0.65% < Ro < 0.9%), and late mature (0.9% < Ro < 1.35%) (Peters and Cassa, 1994).
The LECO TOC measures the carbon associated with kerogen and free hydrocarbons. To identify the different contributions, the free hydrocarbons saturating the pores of the rock were removed using accelerated solvent extraction, and LECO TOC was conducted again on the cleaned sample. This procedure completely removes the free oil and part of the polar components, with the remaining TOC being associated with kerogen only.
Mercury intrusion porosimetry (MIP) tests were realized using a Micromeritics’ AutoPore IV 9500. Before testing, the sample was heated at 100°C for 24 h to dry pore moisture. A subsample with known mass is placed on a glass sample cell (penetrometer), which is inserted in the equipment. After vacuum, mercury is injected under the increasing applied pressure up to the limit of 60,000 PSI, while the intruded volume is measured. Initially the mercury occupies all the volume in the vase, measuring the sample bulk volume. After a threshold, the mercury intrudes the sample, giving a measure of pore volume. Porosity and density are directly calculated from these measurements (Webb, 1993).
The pore volume accessible to mercury intrusion under a given pressure is limited by the capillary pressure, PC, which is determined by the pore-throat radius, r. According to Laplace equation,
We can convert the applied pressure to pore-throat radius given the surface tension
A set of scanning electron microscopy images was acquired as part of the microstructure characterization procedure (Walls and Sinclair, 2011). As part of this procedure, the subsamples removed from the plug are ion-milled to prepare the surface for acquisition of SEM images. The milled surfaces were imaged with increasing resolutions. In this work, we show a set of images acquired with a pixel resolution of 250 nm. A non-local means filter was applied using the software FIJI to improve the identification of the key features.
The ultrasonic pulse propagation experiment was performed using the Autolab 500 (New England Research) equipped with one pair of transducers positioned to measure propagation velocities through the bedding. Each pair of transducers is composed of one emitter, which can send one compressional and two orthogonal shear waves, and one receiver that can register the arrival of the waves. The registered signal is used to measure the wave travel time. Measuring the distance traveled by the wave, we calculate the compressional and shear wave velocities along this direction. During the experiment, the samples are held under hydrostatic confining pressure, which allows measuring the velocities as a function of confining pressure.
In general, mudstone rocks present a complex composition, and there are multiple ways to group and classify their components. Zhao et al. (2016), for example, described the matrix as a composition of clay minerals, non-clay minerals, and kerogen, with the pore space filled with water, oil, and gas. Another approach considers the sample as a solid phase of minerals and kerogen with pores partially filled with air and oil/bitumen (Shitrit et al., 2017). We use the measurements to determine the proportions using the second approach.
The characterization methods were applied in different cleaning conditions, consequently changing the fractions measured by each experiment. A summary of the experiments and the measured fractions is shown in Figure 1. In this section, the relationship between the main physical properties is inferred from the experimental results, considering the distribution of fractions.
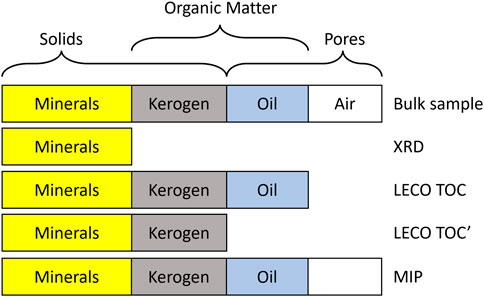
FIGURE 1. The first line shows the representations of material phases that compose the bulk mudrock and its grouping in solids, organic matter, and pores. The following lines show the materials measured by XRD, LECO TOC, and MIP. The LECO TOC’ is the measurement after sample cleaning.
The DRX measurements give the mass fraction for each constituent mineral. Suppose that
with the volumetric fraction,
where the summation is over all the identified minerals and the densities. The prime was used to differentiate measurements without OM removal.
LECO TOC measurements were conducted on two conditions: before-cleaning and after-cleaning. The compositional difference between the two conditions is the absence of an oil phase on the cleaned sample, as represented in Figure 1. This section presents an analysis of TOC measured under the two conditions to determine the weight fraction of oil and kerogen on the overall material balance.
The total mass of the materials,
The TOC is a measure of carbon,
The contributions of the oil are removed for the after-cleaning measurement.
The ratio
We isolate the factor
It can be seen from Eq. 8 that the
The mercury impregnates the porous empty spaces during MIP, giving a measurement of bulk volume,
where the material mass,
The aforementioned equations result in the traditional one
that describes the relationship between porosity,
where Eq. 13 was used in the last step and mass fractions were previously determined from TOC measurements. Applying Eqs 9, 10, we get
The volume fractions of the organic materials can be determined converting the mass fractions as
and the mineral proportion is obtained from the total volume.
The first step of RPM is to define the properties of the rock elements. The mineral properties were recovered from Mavko et al. (2009), as shown in Table 2. Although the properties of organic materials are more difficult to determine, as they could change as a function of maturity itself (Ibrahim et al., 2020). Therefore, we assume from the start the occurrence of immature kerogen described by Zhao et al. (2016). The remaining parameters
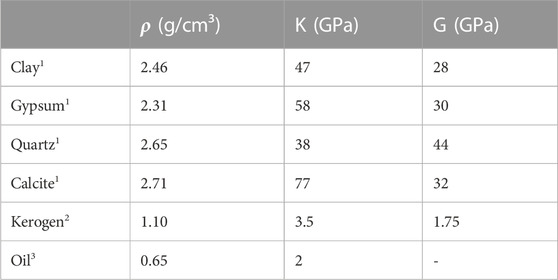
TABLE 2. Properties of organic and non-organic constituents as given by 1 (Mavko et al., 2009), 2 (Zhao et al., 2016), and 3 found by RPM diagnoses.
The next step is the calculation of the effective elastic modulus by successive addition of materials. The mineral elastic modules were calculated using the Voigt–Reuss–Hill (VRH) average with the volume fractions determined from Eq. 5 and XRD results:
where C can be the bulk modulus or the shear modulus.
To allow fine-tuning of the matrix elastic modulus, the mineral–kerogen mixture was calculated using a matrix stiffness index (MSI) as weight in the Voigt–Reuss–Hill (VRH) average (Allo, 2019).
where k is the kerogen volume fraction, C is the elastic module, and MSI is an adjustable parameter between 0 and 1. As the model was constructed by successive averages,
The last step is calculating the propagation velocities of compressional and shear waves. For this task, the mudrocks are usually modeled as vertically transverse isotropic (Vernik and Nur, 1992), although there are works using the isotropic model (Dvorkin et al., 2021). Sone and Zoback (2013) demonstrated that the isotropic Young’s modulus calculated in VTI shales are consistent with the anisotropic formal calculation. Inspired by this work, we will assume the isotropic equations as
where
The XRD results for each sample and the average weight fraction of each mineral are shown in Table 3. Calcite and quartz account for 63% and 27% of the weight, respectively. Together they represent 90%; the other 10% of the mass is composed of clay minerals and gypsum. With less than 50% of clay and more than 30% of carbonates in weight, this sample can be classified as a carbonate mudstone using the Donovan et al. (2017) classification, which is usually associated with oil-prone organic matter.
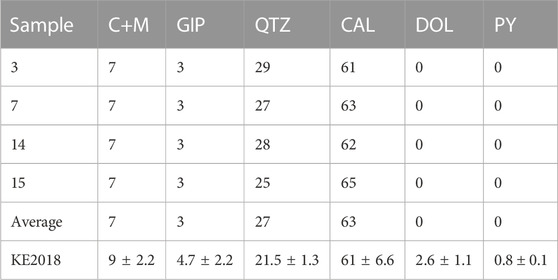
TABLE 3. XRD results showing the fraction of mass of the following minerals: clay and mica (C+M), gypsum (GIP), quartz (QTZ), calcite (CAL), dolomite (DOL), and pyrite (Py). We also show the average values and the XRD results reported in Kreisserman and Emmanuel (2018) in the line average and KE2018, respectively.
The geochemical characterization results are shown in Table 4. The same table shows the sample named Original, whose properties are the average of the immature samples properties. We also exhibit the average properties calculated in the low-resolution dataset available in French et al. (2019) as the sample FR2019. To allow the comparison with our immature samples, we filtered the French dataset in the interval of Tmax < 425. The Ro of 0.55% with Tmax < 435 and IH <500 values indicates that the original sample is composed of immature organic matter (Horsfield and Rullkötter, 1994; Peters and Cassa, 1994; Vernik and Landis, 1996). The samples heated at 300°C are at the peak of generation. The samples heated between 320°C and 360°C have 1.07%<Ro<1.34%. Consequently, they are in the late mature oil windows (Peters and Cassa, 1994).
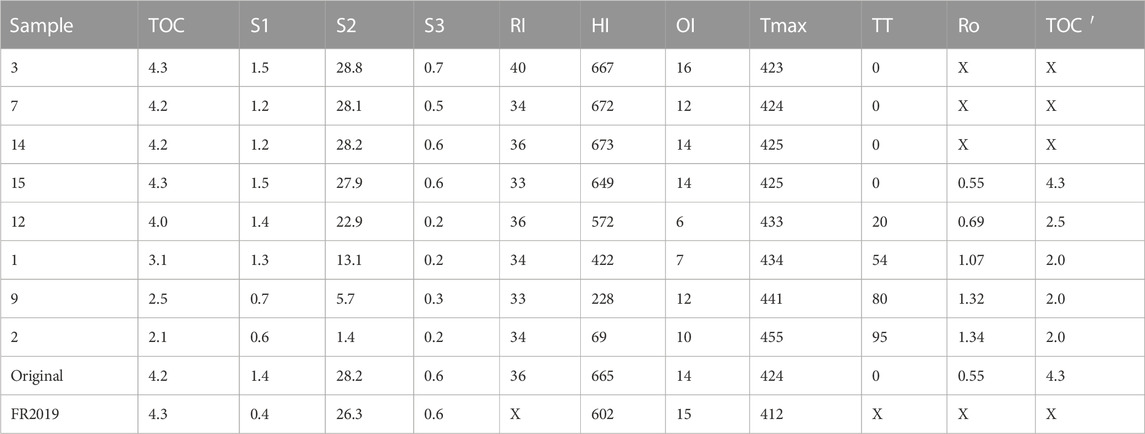
TABLE 4. LECO TOC and Rock–Eval pyrolysis results with TOC in weight %, S1 in mg HC/g rock, S2 in mg HC/g rock, S3 in mg CO2/g rock, RI in weight %, HI in mg HC/TOC, IO in mg CO2/TOC, Tmax in °C, TT in %, and Ro in % and TOC
The effects of maturation on the geochemical properties are illustrated in Figure 2. The thermal cracking of kerogen into oil resulted in the reduction of the TOC with the advancement of the transformation rate, as shown in Figure 2A. The proportion of kerogen on the organic matter mass exhibits a fast decrease followed by an almost linear increase that can be interpreted by the migration of the oil out of the sample (Figure 2B). The oil generation also results in S2 reduction, as noticeable in the Blanc–Valleron diagram (Figure 2C). The depletion also reduces HI and OI, which can be seen as the displacement of the points toward the origin on type van Krevelen diagram (Figure 2D). As shown in Figures 2C, D, the original kerogen can be classified as oil-prone I or II–I.
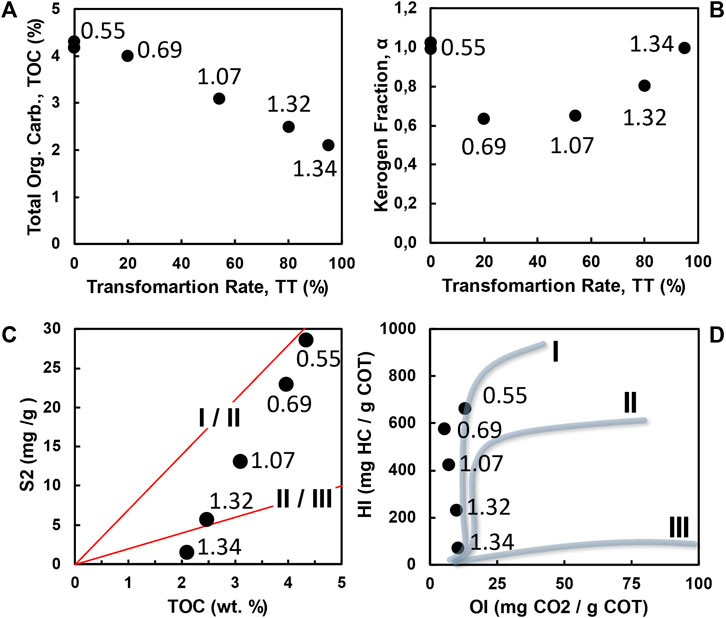
FIGURE 2. (A) TOC and the (B) kerogen fraction as a function of TT measured on the samples (black circles). The (C) Blanc–Valeron and (D) type van Krevelen diagrams are also exhibited. In all plots, the measured points are identified by the Ro value.
The porosity and density obtained by mercury intrusion results are listed in Table 5. The pore-throat radius distributions are displayed in Figure 3A for the sample in the original condition (gray) and the samples heated at 300°C (red), 320°C (blue), 340°C (green), and 360°C (yellow). The distribution of pore throats for the immature samples are similar between them, whereas, for the maturated samples, the distributions shift towards larger radius values as function of the increasing transformation rate and Ro. The porosity and the variation of OM volume are exhibited in Figure 3B as closed black and open red circles, respectively. The porosity is equal to OM volume loss for the samples in the initial condition, by definition. The porosity increases as the TR advances, but the OM volume reduction is smaller than the measured porosity for samples since the beginning of the oil window.
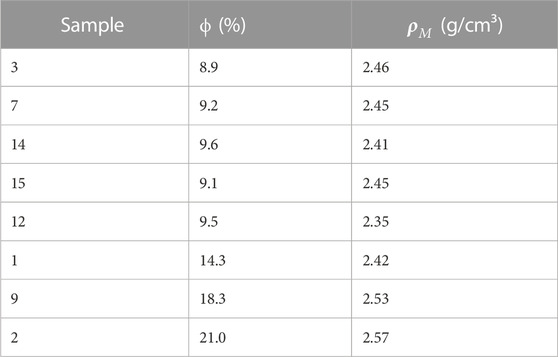
TABLE 5. Mercury Intrusion Porosimetry results showing porosity and density.
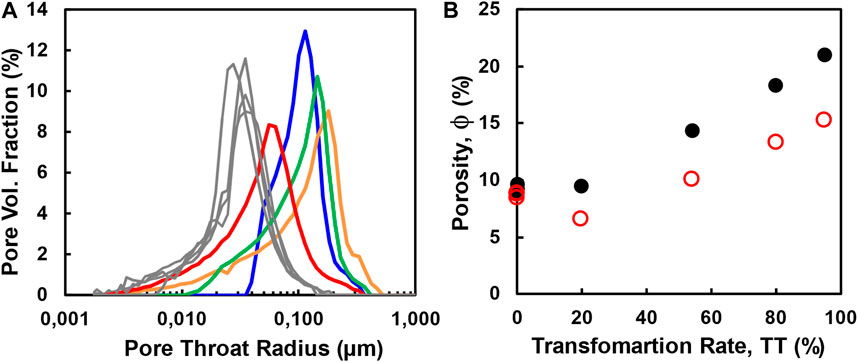
FIGURE 3. (A) Pore-throat distribution as measured for samples in the original state (gray) and after hydropyrolysis at 300°C (red), 320°C (blue), 340°C (green), and 360°C (yellow). (B) Porosity as a function of TR as measured by MIP (black closed circles) compared to porosity due to variation in OM volume.
The SEM images are shown in Figure 4. The images are disposed in increasing maturation order with images from samples in the original condition and heated at 300°C, 320°C, 340°C, and 360°C in positions (a), (b), (c), (d), and (e), respectively. For this set of images, it is possible to identify pores by their characteristic darker gray levels in contrast to a brighter background associated with mineral phases. The OM is associated with the intermediate gray level. For all the samples, the OM occurs preferentially in the horizontal direction. Also, the tendency to increase porosity with maturation is easily identified by a progressive clustering of voids on the presented sequence of images.
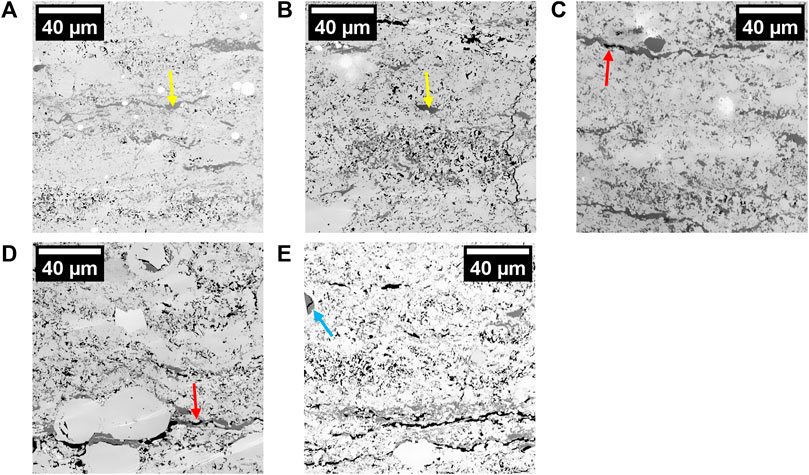
FIGURE 4. SEM images acquired in the samples (A) in the original condition and heated at (B) 300°C, (C) 320°C, (D) 340°C, and (E) 360°C. The arrows indicate OM grains without porosity (yellow), with porosity in the contour (red), and with porosity across the grain (blue).
Specifically, on the images of samples not pyrolyzed (Figure 4A) and pyrolyzed at 300°C (Figure 4B), it is possible to identify grains of organic matter without internal porosity with well-defined contours and a continuous interface with the surrounding mineral phase (yellow arrows). The continuous grains are also visible on samples prepared at 320°C (Figure 4C) and 360°C (Figure 4D), which also exhibit the creation of porosity mainly at the interfaces between the OM and the mineral (red arrows). In the BSE image of the sample heated at 360°C (Figure 4E), it is possible to identify continuous grains, border shrinkage, and internal pores (blue arrow). The creation of porosity in the contour of the OM grains is consistent with the shrinkage during thermal heating reported previously by other authors.
The ultrasonic pulse propagation measurements are available in supplementary material and shown in Figure 5. The propagation velocities of compressional (Figure 5A) and shear waves (Figure 5B) are present as a function of pressure for the immature samples (gray diamond) and the matured ones at 300°C (black squares), 320°C (red circles), 340°C (upper blue triangle), and 360°C (upper magenta triangle). For all samples, the velocities measured during pressure increase are lower than the velocities measured during unload. Comparing the sample tendencies, the immature gray points are grouped with the higher Vp and Vs modulus for all applied confining pressures, followed by the velocities of the sample heated at 300°C. The velocities of the samples heated at 320°C and 340°C are grouped with Vp between 2.8 and 3.2 km/s and Vs between 1.8 and 2.0 km/s. The smaller velocities are associated to the sample heated at 360°C.
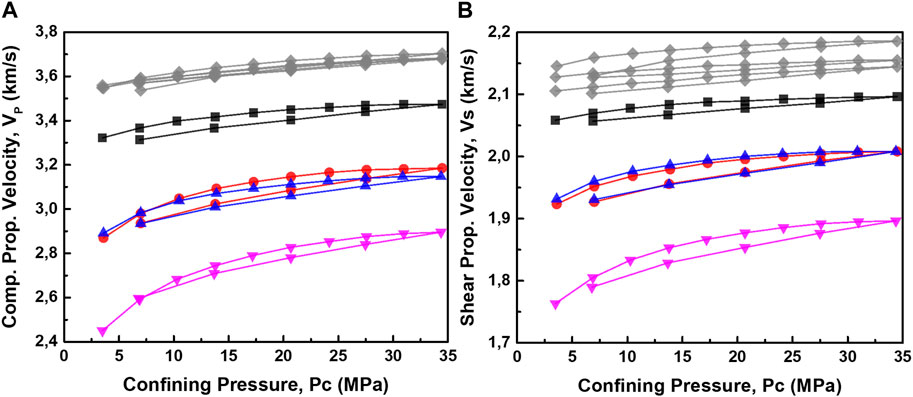
FIGURE 5. Wave propagation velocities of (A) compressional and (B) shear modes measured in immature samples (gray diamond) and in the matured ones at 300°C (black squares), 320°C (red circles), 340°C (upper blue triangle), and 360°C (upper magenta triangle).
Figure 5 shows velocity moduli are increasing functions of confining pressure with higher rates of increase at lower pressures. The percentual variation of Vp measured at 14 Mpa and 3.5 Mpa is between 1.6% and 2.5%, respectively, for the immature samples. On the same range, there is a variation of 2.8%, 7.2%, 5.8%, and 10.7% for the samples that maturated at 300°C, 320°C, 340°C, 360°C, respectively. Equivalent variation is observed for Vs, where the velocity of immature samples decreases 0.9%, on average. Decreases of 1.2%, 2.8%, 2.8%, and 4.8% are observed for matured samples in the same sequence of samples as mentioned previously.
The RPM model and the velocities measured at 34 MPa are presented in Figure 6 as open circles and closed black circles, respectively. The bulk density predicted by Eq. 14 using the properties listed in Table 2 is exhibited in Figure 6A as red open circles together with the data points in black. As the maturation advances, the porosity also increases, and the velocities have their modules decreased. The measured propagation velocities of compressional (Figure 6B) and shear waves (Figure 6C) are compared to those of the model with porosity inclusions with AR of 0.12 (yellow open circles), 0.14 (red open circle), and 0.16 (green open circles). The samples with porosity below 10% and with 14% are well-described by the pores with an AR of 0.12 and 0.14, respectively, for both waves. The model fails to adjust the velocities for the samples with a porosity beyond 18% because of the change in the kerogen elastic properties as a function of maturation. In fact, the model with mature kerogen (K=7.98 GPa, G=4.18 GPa, and rho=1.34 g/cm3), and the aspect ratio of 0.097 was added on the Vp and Vs plot as yellow squares. This model calibrates better with the high porosity/high maturation sample.
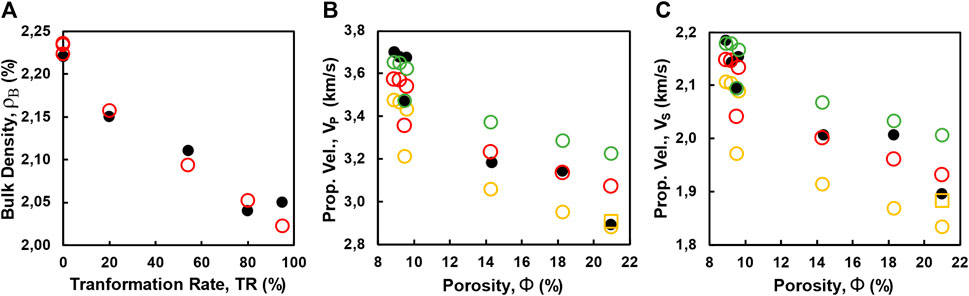
FIGURE 6. Adjusted RPM (open circles) with an aspect ratio equal to 0.12 (yellow), 0.14 (red), and 0.16 (green) compared to (A) bulk density and (B) Vp and (C) Vs measurements (closed circles). The yellow open squares are model data with AR=0.097 and modified elastic modulus.
During the beginning of the maturation process, kerogen content is reduced and the oil content increases. Depending on the mechanical properties of the rock, the introduction of less dense material could induce fracture creation (Vernik, 1994). At some point in the generation (0.75% < Ro < 1.3%), the oil migrates out of the rock (Vernik and Landis, 1996). Altogether, there is a change in porosity, pore geometry, TOC, and kerogen-to-oil proportions as a function of the maturation. In this section, we analyze the effects of maturation on those parameters and the resulting effect on the elastic properties.
The compositional characterization of our samples is consistent with the mineralogy found by Kreisserman and Emmanuel (2018), despite the absence of pyrite and dolomite. Some variation in mineralogy of different Eagle Ford samples is expected. In fact, Jia and Sheng (2017) reported that the content of clay, quartz, carbonates, and pyrites varies in the range of 5%–45%, 15%–26%, 0%–61%, and 3%–5%, respectively. For a comparison of organic fractions, French et al. (2019) characterized a series of immature Eagle Ford samples below the oil window whose average geochemical properties, filtered to Tmax < 425°C, are also exhibited in Table 4 and are consistent with our results. More importantly, the mineralogy and the initial TOC are almost constant in the sampling points and should not introduce any dispersion to the measured velocities.
The geochemical pyrolysis induces hydrocarbon generation at the cost of kerogen consumption, as shown in Figure 2A. The conversion of kerogen into hydrocarbons reduces its volume either by creating internal porosity (Sengupta et al., 2020) or by volume shrinking (Allan et al., 2014; Suwannasri et al., 2018). The qualitative analysis of SEM images (Figure 4) reported in this study indicates that kerogen volume variation occurs mostly through shrinkage of OM volume in the interface kerogen/mineral with associated creation of elongated pores.
The porosity increased as a function of the maturation (Figure 3B). In fact, its increase is expected as a consequence of OM consumption (Suwannasri et al., 2018) and fracturing induced by generation (Vernik, 1994; Allan et al., 2016). The comparison between porosity and OM volume variation indicates that there is porosity creation beyond the change in OM volume. The discrepancy became more accentuated with the maturation, indicating that there is creation of porosity.
The RPM with constant properties of kerogen calibrates well for the compressional waves but becomes discrepant at Vs measured for the samples with higher porosities. In this range, a model with maturated kerogen calibrates better with the results without changing the aspect ration reduction tendency with maturation. This model indicates that the maturation changes the porosity from less compliant to more compliant pores while increasing the kerogen modulus, as reported in Ibrahim et al. (2020).
There is no significant porosity variation between the immature samples and the sample at the peak of the oil window (Ro < 0.7%). The pores are approximately 9.2% of volume, and the RPM indicates an AR of 0.16 for these samples. Therefore, the change in the elastic properties for these samples is mainly related to the difference in the kerogen/oil ratio that diminishes the effective elastic properties of the organic components with the convertion to oil.
The sample with Ro = 1.07% shows a fraction of kerogen almost equal to that of the sample with Ro = 0.69%. Consequently, there is no significant variation in the organic phase proportions. The sample porosity increased from 9.3% measured in the immature group to 14.3%. There is also a reduction in the aspect ratio from 0.16 to 0.14. The main factors that describe the evolution of the elastic properties in this maturation range are porosity and pore geometry.
There is significant oil migration with a visible increase in the kerogen fraction for the two samples at the end of the oil window (Ro > 1.3%). There is also a porosity increase and reduction in the AR. The RPM indicates a significant increase in the elastic properties of the kerogen. For this range of maturation, the elastic properties result from a competition between oil migration, pore elongation and increases both on porosity and kerogen stiffness.
The pressure sensitivity is consistent with the conceptual model discussed previously. The discrepancy between porosity and organic matter volume indicates that porosity at 300°C increased with small fracture creation. Therefore, the pressure sensitivity for this sample is to immature for immature samples and the same RPM model that describes immature samples also describes the sample heated at 300°C. With the advance of maturation, the velocity modulus at a given pressure is reduced, and sensitivity becomes more relevant as more compliant pores are added.
A similar dynamic of fluid accumulation and fracture creation was described by Vernik and Landis (1996) in a series of natural samples. Using the vitrinite reflectance to classify the samples according to their stages, we find that the sample heated at 300°C is in stage III, with the samples prepared at higher temperatures identified in stage IVb. Stages III and IVb are the peaks of bitumen accumulation and fracture creation, as observed. Suwannasri et al. (2018) described a dynamic of porosity creation based on the reduction in the kerogen volume for samples maturated in dry pyrolysis. A possible explanation for the difference between the results is the presence of water during the maturation (Lewan, 1994).
We have used a combination of direct measurements and RPM diagnoses to elaborate a complete picture of the effects of maturation on the Eagle Ford samples artificially maturated by hydropyrolysis. The Eagle Ford outcrop is a carbonate mudstone with 4.2% of its mass composed of kerogen type I or I/II. The hydropyrolysis induces organic matter maturation, TOC reduction, TR increase, and Ro increase. The organic matter conversion into light hydrocarbons increases porosity, but the more compliant pores are introduced by fracturing, as suggested by the RPM. The oil saturation initially increases with the beginning of maturation and diminishes as the Ro increases.
The effective elastic properties respond to the overall modifications imposed by maturation to porosity, pore geometry, kerogen-to-oil proportion, and elastic properties of kerogen. Kerogen-to-oil ratio controls the velocities for the samples with Ro below 0.7%. As the TR increases, more elongated pores are created, contributing to a reduction in propagation velocities. This change in porosity and pore geometry explains the modification of the elastic properties observed for the sample with Ro = 1.07%. In addition to the porosity increase and pore geometry change, the change in the elastic properties of kerogen is important for explaining propagation velocities measured for the last two samples in the limit of the oil window.
The original contributions presented in the study are included in the article/Supplementary Material; further inquiries can be directed to the corresponding author.
DL, MM, JJ, and GV were responsible for the experimental planning, ultrasonic pulse propagation experiments, and rock physical analysis. AS conducted hydropyrolosis experiments besides LECO TOC and Rock–Eval pyrolysis analysis. TM measured and analyzed the vitrinite reflectance. RS performed and analyzed the mercury intrusion porosimetry.
The authors would like to thank the Petrobras for permission to publish the work and the data.
The authors declare that the research was conducted in the absence of any commercial or financial relationships that could be construed as a potential conflict of interest.
All claims expressed in this article are solely those of the authors and do not necessarily represent those of their affiliated organizations, or those of the publisher, the editors, and the reviewers. Any product that may be evaluated in this article, or claim that may be made by its manufacturer, is not guaranteed or endorsed by the publisher.
The Supplementary Material for this article can be found online at: https://www.frontiersin.org/articles/10.3389/feart.2023.1131730/full#supplementary-material
Allan, A. M., Clark, A. C., Vanorio, T., Kanitpanyacharoen, W., and Wenk, H-R. (2016). On the evolution of the elastic properties of organic-rich shale upon pyrolysis-induced thermal maturation. Geophysics 81 (3), D263–D281. doi:10.1190/geo2015-0514.1
Allan, A. M., Vanorio, T., and Dahl, J. E. P. (2014). Pyrolysis-induced P-wave velocity anisotropy in organic-rich shales. Geophysics 79 (2), D41–D53. doi:10.1190/geo2013-0254.1
Allo, F. (2019). Consolidating rock-physics classics: A practical take on granular effective medium models. Lead. Edge 38 (5), 334–340. doi:10.1190/tle38050334.1
ASTM (2018). Test method for determination of pore volume and pore volume distribution of soil and rock by mercury intrusion porosimetry d4404-18. PA: ASTM International. doi:10.1520/d4404-18
ASTM-D7708-14 (2014). Standard test method for microscopical determination of the reflectance of vitrinite dispersed in sedimentary rocks. West Conshohocken: ASTM International.
Avseth, P., Mukerji, T., and Mavko, G. (2010). Quantitative seismic interpretation. Cambridge, UK: Cambridge University Press.
Behar, F., Beaumont, V., and de Penteado, H. L. (2001). Rock-eval 6 Technology: Performances and developments. Oil Gas Sci. Technol. 56 (2), 111–134. doi:10.2516/ogst:2001013
Bjorlykke, K. (2010). Petroleum geoscience. Berlin, Heidelberg: Springe. doi:10.1007/978-3-642-02332-3
Borrego, A. G., Araujo, C. V., Balke, A., Cardott, B., Cook, A. C., David, P., et al. (2006). Influence of particle and surface quality on the vitrinite reflectance of dispersed organic matter: comparative exercise using data from the qualifying system for reflectance analysis working group of ICCP. Int. J. Coal Geol. 68 (3-4), 151–170. doi:10.1016/j.coal.2006.02.002
Crain, E. R., and Holgate, D. (2014). A 12-step program to reduce uncertainty in kerogen-rich reservoirs: Part 1 – getting the right porosity. Calgary, Alberta, Canada: CSPG Reservoir, 19–23.
Donovan, A., Evenick, J., Banfield, L., McInnis, N., and Hill, W. (2017). “An organofacies-based mudstone classification for unconventional tight rock and source rock plays,” in Paper presented at the SPE/AAPG/SEG Unconventional Resources Technology Conference (Austin, TX: SPE/AAPG/SEG), 3683–3697. doi:10.15530/URTEC-2017-2715154
Dvorkin, J., Walls, J., and Davalos, G. (2021). Velocity-porosity-mineralogy model for unconventional shale and its applications to digital rock physics. Front. Earth Sci. 8. doi:10.3389/feart.2020.613716
Espitalié, J., Laporte, J. L., Madec, M., Marquis, F., Leplat, P., Paulet, J., et al. (1977). Méthode rapide de caractérisation des roches mètres, de leur potentiel pétrolier et de leur degré d’évolution. Rev. l’Institut Français Pétrole 3, 23–42. doi:10.2516/ogst:1977002
French, K. L., Birdwell, J. E., and Whidden, K. J. (2019). Geochemistry of a thermally immature Eagle Ford Group drill core in central Texas. Org. Geochem. 131, 19–33. doi:10.1016/j.orggeochem.2019.02.007
Hackley, P. C., Araujo, C. V., Borrego, A. G., Bouzinos, A., Cardott, B. J., Cook, A. C., et al. (2015). Standardization of reflectance measurements in dispersed organic matter: Results of an exercise to improve interlaboratory agreement. Mar. Pet. Geol. 59, 22–34. doi:10.1016/j.marpetgeo.2014.07.015
Hansen, J. A., Mondol, N. H., and Fawad, M. (2019). Organic content and maturation effects on elastic properties of source rock shales in the Central North Sea. Interpretation 7 (2), T477–T497. doi:10.1190/int-2018-0105.1
Horsfield, B., and Rullkötter, J. (1994). “Diagenesis,Catagenesis, and metagenesis of organic matter,” in The petroleum system—from source to trap: AAPG memoir 60 (Tulsa, Oklahoma, United States: AAPG), 189–200. doi:10.1306/m60585c10
Ibrahim, M. A. A., Mukerji, T., and Scheirer, A. H. (2020). “A thermal-maturation dependent elastic rock physics template for organic-rich mudrocks: Construction and application,” in Fifth EAGE workshop on rock physics (Milan, Italy: European Association of Geoscientists & Engineers). doi:10.3997/2214-4609.2020603028
Jia, H., and Sheng, J. (2017). Discussion of the feasibility of air injection for enhanced oil recovery in shale oil reservoirs. Petroleum 6 (2), 249–257. doi:10.1016/j.petlm.2016.12.003
Kreisserman, Y., and Emmanuel, S. (2018). Release of particulate iron sulfide during shale-fluid interaction. Environ. Sci. Technol. 52 (2), 638–643. doi:10.1021/acs.est.7b05350
Langford, F. F., and Blanc-Valleron, M-M. (1990). Interpreting rock-eval pyrolysis data using graphs of pyrolizable hydrocarbons vs. Total organic carbon (1). AAPG Bull. 74 (6). doi:10.1306/0c9b238f-1710-11d7-8645000102c1865d
Lewan, M. D. (1994). “Assessing natural oil expulsion from source rocks by laboratory pyrolysis,” in The petroleum system—from source to trap. Editors L. B. Magoon, and W. G. Dow (Tulsa: The American Association of Petroleum Geologists), 201–210. doi:10.1306/m60585c11
Lewan, M. D., and Birdwell, J. E. (2013). “Application of uniaxial confining-core clamp with hydrous pyrolysis in petrophysical and geochemical studies of source rocks at various thermal maturities,” in Unconventional resources Technology conference (New York, United States: Society Publishers').
Liu, X., Guo, Z., Zhang, Q., Liu, Y., and Chen, H. (2020). Rock physical characterisation of microstructural fabrics and elastic anisotropy for a shale oil reservoir. J. Geophys. Eng. 17 (2), 377–389. doi:10.1093/jge/gxz123
Mavko, G., Mukerji, T., and Dvorkin, J. (2009). The rock physics handbook: Tools for seismic analysis of porous media. Cambridge, Uk ; New York: Cambridge University Press.
Moyer, J., and Prasad, M. (2017). Property changes of oil shale during artificial maturation: The Irati Formation from the Paraná Basin, Brazil. Geophysics 82 (6), MR175–MR190.
Peters, K. E., and Cassa, M. R. (1994). “Applied source rock geochemistry,” in The petroleum system—from source to trap: AAPG memoir 60 (Tulsa, Oklahoma, United States: AAPG), 93–120.
Rayeva, N., Kosnazarova, N., Arykbayeva, Z., and Shaikhina, D. (2014). “Petroleum systems modeling and exploration risk assessment for the eastern margin of the precaspian basin,” in SPE annual caspian technical conference and exhibition (Astana, Kazakhstan: Society of Petroleum Engineers). doi:10.2118/172332-ms
Sengupta, M., Jacobi, D., Eichmann, S., Wallet, B., Altowairqi, Y., and Alsinan, S. (2022). “Seismic assessment of maturity and richness in carbonate source rocks,” in Second international meeting for applied geoscience & energy (SEG/AAPG), 2283–2287. doi:10.1190/image2022-3736741.1
Sengupta, M., Jacobi, D., Eichmann, S. L., Altowairqi, Y., and Alsinan, S. (2020). “Modeling and estimation of kerogen evolution in source rocks,” in SEG technical program expanded abstracts 2020 (Society of Exploration Geophysicists). doi:10.1190/segam2020-3425803.1
Shitrit, O., Hatzor, Y. H., Feinstein, S., and Vinegar, H. J. (2017). Acoustic and petrophysical evolution of organic-rich chalk following maturation induced by unconfined pyrolysis. Rock Mech. Rock Eng. 50 (12), 3273–3291. doi:10.1007/s00603-017-1325-9
Sone, H., and Zoback, M. D. (2013). Mechanical properties of shale-gas reservoir rocks — Part 1: Static and dynamic elastic properties and anisotropy. Geophysics 78 (5), D381–D392. doi:10.1190/geo2013-0050.1
Spigolon, A. L. D., Lewan, M. D., de Barros Penteado, H. L., Coutinho, L. F. C., and Mendonça Filho, J. G. (2015). Evaluation of the petroleum composition and quality with increasing thermal maturity as simulated by hydrous pyrolysis: A case study using a Brazilian source rock with Type I kerogen. Org. Geochem. 83-84, 27–53. doi:10.1016/j.orggeochem.2015.03.001
Suwannasri, K., Vanorio, T., and Clark, A. (2018). Monitoring the changes in the microstructure and the elastic and transport properties of Eagle Ford marl during maturation. Geophysics 83 (5), MR263–MR281. doi:10.1190/geo2017-0797.1
Vernik, L. (1994). Hydrocarbon-generation-induced microcracking of source rocks. Geophysics 59 (4), 555–563. doi:10.1190/1.1443616
Vernik, L., and Landis, C. (1996). Elastic anisotropy of source rocks: Implications for hydrocarbon generation and primary migration. AAPG Bull. 80 (4). doi:10.1306/64ed8836-1724-11d7-8645000102c1865d
Vernik, L., and Liu, X. (1997). Velocity anisotropy in shales: A petrophysical study. Geophysics 62 (2), 521–532. doi:10.1190/1.1444162
Vernik, L., and Nur, A. (1992). Ultrasonic velocity and anisotropy of hydrocarbon source rocks. Geophysics 57 (5), 727–735. doi:10.1190/1.1443286
Vernik, L. (2016). Seismic petrophysics in quantitative interpretation. Tulsa, Ok: Society Of Exploration Geophysicists.
Walls, J. D., and Sinclair, S. W. (2011). Eagle Ford shale reservoir properties from digital rock physics. First Break 29 (6). doi:10.3997/1365-2397.29.6.51280
Wang, B., Chen, Y., Lu, J., and Jin, W. (2018). A rock physics modelling algorithm for simulating the elastic parameters of shale using well logging data. Sci. Rep. 8 (1), 12151. doi:10.1038/s41598-018-29755-2
Webb, P. A. (1993). “PoreSizer 9320 and AutoPore II 9220 data collection, reduction and presentation,” in Micromeritics, 1993.
Young, R. A. (1995). The Rietveld method. Oxford, United Kingdom: Oxford University Press on Demand.
Zargari, S., Prasad, M., Mba, K. C., and Mattson, E. D. (2013). Organic maturity, elastic properties, and textural characteristics of self resourcing reservoirs. Geophysics 78 (4), D223–D235. doi:10.1190/geo2012-0431.1
Keywords: shale, mudrock, Eagle Ford, rock physics, maturation, source rock, organic matter
Citation: de Lacerda DLP, Morschbacher MJ, Justen JCR, Vasquez GF, Spigolon ALD, Menezes TR and Skinner R (2023) On the evolution of artificially maturated hydrocarbon source rocks. Front. Earth Sci. 11:1131730. doi: 10.3389/feart.2023.1131730
Received: 26 December 2022; Accepted: 23 March 2023;
Published: 25 May 2023.
Edited by:
Junfang Zhang, Commonwealth Scientific and Industrial Research Organisation (CSIRO), AustraliaReviewed by:
Jie Zou, Chengdu University of Technology, ChinaCopyright © 2023 de Lacerda, Morschbacher, Justen, Vasquez, Spigolon, Menezes and Skinner. This is an open-access article distributed under the terms of the Creative Commons Attribution License (CC BY). The use, distribution or reproduction in other forums is permitted, provided the original author(s) and the copyright owner(s) are credited and that the original publication in this journal is cited, in accordance with accepted academic practice. No use, distribution or reproduction is permitted which does not comply with these terms.
*Correspondence: D. L. P. de Lacerda, ZG91Z2xhcy5sYWNlcmRhQHBldHJvYnJhcy5jb20uYnI=
Disclaimer: All claims expressed in this article are solely those of the authors and do not necessarily represent those of their affiliated organizations, or those of the publisher, the editors and the reviewers. Any product that may be evaluated in this article or claim that may be made by its manufacturer is not guaranteed or endorsed by the publisher.
Research integrity at Frontiers
Learn more about the work of our research integrity team to safeguard the quality of each article we publish.