 Xiaoqian Li
 Xinlin He1,2*
 Guang Yang
- 1College of Water Conservancy & Architectural Engineering, Shihezi University, Shihezi, China
- 2Key Laboratory of Cold and Arid Regions Eco-Hydraulic Engineering of Xinjiang Production & Construction Corps, Shihezi, China
- 3Zhejiang Ecological Civilization Academy, Anji, China
- 4School of Public Affairs, Zhejiang University, Hangzhou, China
Understanding the drought characteristics of mountainous areas in northwest China with sparse rainfall stations requires high precision, as well as high-resolution precipitation data. Considering the spatial relationship of precipitation and environmental factors, this study downscales Global Precipitation Measurement (GPM) and Multi-Source Weighted-Ensemble Precipitation (MSWEP) based on the geographically weighted regression (GWR) and multi-scale geographically weighted regression (MGWR) models integrated with interpolation. A high-resolution (1 km×1 km) precipitation dataset during 1979–2020 is reconstructed in the Tianshan Mountains, and the drought characteristics are analyzed by using the optimal dataset. The results show that: 1) Compared with GWR, MGWR model has higher downscaling accuracy; 2) The optimal MSWEP downscaling dataset (CC = 0.93, |BIAS| = 0.48%) compared to GPM (CC = 0.81, |BIAS| = 1.87%) is closer to the observed precipitation; 3) In the past 40 years, 71% and 9% of the Tianshan Mountains show significant wetting and drying trends respectively, and 16 drought events are identified. 4) The West subregion of the Tianshan Mountains is characterized by low frequency, long duration and high severity of drought events. The characteristics of the East are opposite to those of the West. Occasional extreme drought events occur in the North and South. This paper provides data support and method reference for the study of water-vapor balance and regional ecohydrological process in the arid area of Northwest China.
1 Introduction
Under the trend of global warming, extreme disasters occur frequently all over the world, and the spatiotemporal distribution of precipitation becomes more and more unstable (Fan et al., 2022). In particular, the Northwest mountainous areas of China far away from the ocean are characterized by drought and water shortage (Chen et al., 2015). In the context of global warming, the northwest mountain areas of China have also experienced significant warming, and the continuous warming has intensified the interannual fluctuation of precipitation (Yue et al., 2020), resulting in frequent drought disasters (Wang et al., 2017), ecological environment destruction (Chen et al., 2015), and economic and social development losses and disasters (Wen et al., 2017). Therefore, it is urgent to realize the monitoring of temporal and spatial changes of precipitation and study regional drought, which has important practical significance (Qin et al., 2014).
At present, regional drought monitoring is often achieved through spatial interpolation of rainfall station data and remote sensing precipitation estimation (Chung et al., 2014; Qin et al., 2014). Traditional drought monitoring is realized through the precipitation observation data obtained from meteorological stations, but for the high-altitude mountainous areas in northwest China, which are located in the inland arid areas, there are often problems of insufficient point density and unequal distribution (Chung et al., 2014). Although interpolation can obtain spatiotemporal continuous precipitation data, its accuracy is also limited by the number of stations. The obtained precipitation interpolation results have limited retrieval ability for spatial precipitation, and they are prone to ignore extreme precipitation (Nashwan et al., 2019), which is difficult to reflect the spatiotemporal details of drought (Chen et al., 2018). With the continuous development of remote sensing technology, multi-source satellite precipitation products have been widely used in hydrological research (Chen et al., 2014; Zhou et al., 2017), effectively making up for the problems of traditional monitoring, such as time consuming and power consumption and insufficient site observation data, etc., with the advantages of wide coverage, good space-time continuity, and strong timeliness of data acquisition. Yu et al. (2022) used GPM data to complete the spatiotemporal monitoring of drought in mainland China. Alijanian et al. (2022) combined MSWEP data to realize drought monitoring in the Zayandehrood Basin, a key area of the Iranian plateau, showing that remote sensing data can more accurately represent the temporal and spatial distribution of drought in the absence of site data. Although the accuracy and drought monitoring potential of satellite products have been independently assessed at home and abroad (Tan et al., 2018; Yan et al., 2018; Wei et al., 2021), there are few studies comprehensively comparing the quality of quantitative precipitation product estimation data from different sources and the applicability of drought monitoring in the same region.
However, no matter GPM or MSWEP, most evaluation studies on them are carried out at national or larger scale (Li et al., 2022; Qi et al., 2022), because the spatial resolution of precipitation products (0.1°) cannot meet the research needs of medium and small scale (Wang et al., 2018), which may ignore the difference of drought monitoring potential caused by complex terrain in medium and small scale regions. In order to realize more accurate drought monitoring at a small regional scale, it is necessary to conduct spatial downscaling of satellite products. Therefore, various attempts have been made to develop downscaling models for precipitation products. Common spatial downscaling methods include partial least square method (Campozano et al., 2016; Zhang et al., 2018), multiple linear regression (Zhang and Yan, 2015), random forest algorithm (Jing et al., 2016) and artificial neural network (Mendes et al., 2010; Sharifi et al., 2019). Among them, the Geographically Weighted Regression (GWR) model was the best (Xu et al., 2015; Zhao et al., 2018; Lu et al., 2020). Based on the spatial non-stationary characteristics of surface parameters, GWR and its extended models have largely solved the spatial heterogeneity problem ignored by traditional regression models in the implementation of precipitation downscaling (Chen et al., 2020; Fu et al., 2020). However, the latest research points out that GWR often uses a single bandwidth to calculate the weight, which will result in the same scale characteristics for the spatial variation of all parameter estimates (Chen et al., 2021). For high-altitude mountainous areas with complex and changeable topographic features (Frei and Schär, 1998), the effects of various surface physical parameters on the spatial and temporal distribution of precipitation are often significantly different in different spatial ranges (Bhutiyani et al., 2010; Zhu et al., 2018). On this basis, Fotheringham et al. (Fotheringham et al., 2017) first proposed Multi-scale Geographically Weighted Regression (MGWR) model in October 2017. Different from GWR, this model applies different bandwidths to solve different parameters (Oshan et al., 2019), which allows the conditional relationship between response variables and different prediction variables to change at different spatial scales, and more comprehensively present the scale characteristics corresponding to different parameter estimates. In this study, MGWR2.0 (Li and Fotheringham, 2020), the latest version of this application software released in March 2020, is selected, which further increases the confidence interval of bandwidth.
To sum up, current studies on the use of satellite products to estimate precipitation in mountainous areas and to monitor temporal and spatial changes of regional drought events often have the following shortcomings: 1) Most of the hydroclimatic analysis of the study area is based on a single satellite product, and the topographic effects of precipitation and drought characteristics (Anjum et al., 2019; Lakew, 2020) in high-altitude mountainous areas are ignored; 2) Focusing on the spatial distribution of precipitation change and drought events, ignoring their spatial heterogeneity, mainly due to the low resolution of satellite products, which cannot reflect the detailed texture of precipitation change and drought characteristics (Golian et al., 2019; Wei et al., 2021); 3) Most of them lack comparative analysis of precipitation estimation by different satellite products (Zhang et al., 2018; Wang et al., 2019), which cannot provide reference for the application of precipitation products in other research fields. Therefore, these assessments are not always available or reliable. Based on these deficiencies, this study comprehensively considered the responses of different environmental variables (topographic factors and climate factors) to precipitation in mountainous areas by means of geographic variability test (GVT), and fully considered the spatial heterogeneity of the effects of different surface parameters on precipitation in mountainous areas; The GWR and MGWR downscaling models were improved by interpolation method, and the spatial resolution (from 0.1° × 0.1° to 1km × 1 km) and accuracy of precipitation products were improved; The comparison of the applicability of the downscaling results of multi-source precipitation products provides data support and method reference for the application of high resolution precipitation dataset to the spatio-temporal monitoring of drought characteristics in the northwest mountainous areas.
As the largest ecosystem in the arid region of Central Asia (Liang-Liang et al., 2022), the Tianshan Mountains is particularly sensitive to global warming (Domrös and Peng, 2012) and play an important decisive role in the climatic process of Central Asia and the regional climate system (Xu et al., 2018; Chen et al., 2022). Most previous studies on the climate of Tianshan Mountains were based on observational data (Sakai et al., 2010; Yao et al., 2018a; Yue et al., 2020). However, stations in the Tianshan Mountains are very sparse. 70% of meteorological stations are located in the low mountain belt and piedmont plain (Hu et al., 2016), and there is a lack of stations above the middle and high mountains, so it is difficult to understand the precipitation distribution in this region in depth. At the same time, high-altitude mountains intercept a large amount of water vapor, making the Tianshan Mountains the source of most rivers in the arid northwest region (Cai et al., 2019). Therefore, obtaining the precipitation distribution with high spatial and temporal resolution in this region is not only a prerequisite for understanding the drought trend in the Tianshan Mountains (Zhang et al., 2015), but also plays a crucial role in maintaining the water-climate balance and ecosystem in the arid area of Northwest China (Zhang et al., 2018; Yu et al., 2021). Therefore, this study takes Tianshan Mountains as the research area, proposing a spatial downscaling model based on GWR and MGWR models to correct multi-source precipitation products by integrating ground data and meteorological data with interpolation method. Based on slope, aspect, DEM, wind speed, temperature, sunshine duration, and relative humidity, this paper combined GWR and MGWR2.2 models with Kriging interpolation to conduct spatial downscaling of GPM and MSWEP, and compared the downscaling results with measured data. Finally, the optimal high-resolution precipitation dataset is used to analyze the drought conditions in the last 40 years in detail, which provides scientific support for spatial precipitation inversion and drought early warning system in mountainous areas.
2 Materials and methods
2.1 Study area
Tianshan Mountains (39°30′-45°45′N, 74°10′-96°15′E) straddle the border between China and Kyrgyzstan and are the largest mountain system in Central Asia (Xu et al., 2010). Considering the availability of stations, this study focuses on the Tianshan Mountains in China (Figure 1A), which is geographically located in Xinjiang Province, China. The altitude of the study area varies greatly (321 m–7426 m), the complex topography of intersecting mountains and basins insulates the region from ocean currents, resulting in a distinctly temperate continental arid climate characterized by extreme temperature differences and uneven precipitation in winter and summer, ranging from 100 mm/year in the low mountain desert to 900 mm/year in the high windward slope (Hu et al., 2016). In order to facilitate the study of precipitation differences under complex terrain conditions in the Tianshan Mountains, the K-nearest neighbor method (Zhengyong et al., 2015) was adopted in this study to divide the Tianshan Mountains into four subregions, as shown in Figure 1B. According to Gu (Yang et al., 2015), dry and wet conditions in the Tianshan Mountains were roughly divided (Figure 1B): the whole Tianshan Mountains are dominated by arid areas (52%) and semi-arid areas (31%), and some extreme dry and dry areas (15%) are mainly distributed in the low rainfall area of Turpan Hami basin in the Eastern Tianshan Mountains (203 mm/a), a few semi-humid areas (2%) are mainly distributed in the northern part of Tianshan Mountains (424 mm/a), including the Ili Valley and the main peak area of precipitation in the middle of Tianshan Mountains, which is basically consistent with the zoning results of Wei et al.(2022).
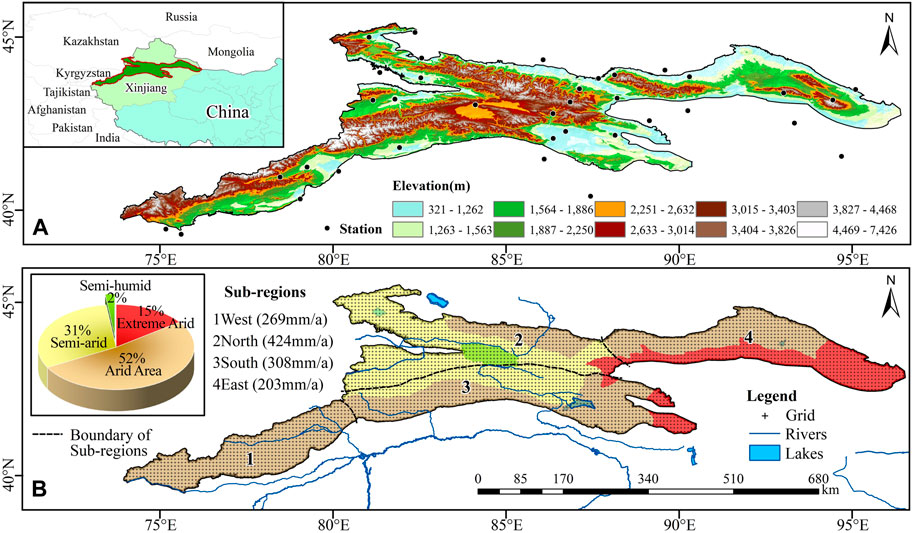
FIGURE 1. (A) Geographical location, topography and distribution of meteorological stations in the Tianshan Mountains; (B) Zoning boundary and drought conditions in the Tianshan Mountains.
2.2 Data collection and processing
2.2.1 Remote sensing data
GPM is a new generation of global satellite precipitation product after TRMM (Tropical Rainfall Measuring Mission), which has the advantages of wide coverage and sophisticated inversion algorithm. It is widely used in the study of climate change and hydrological processes (Hou et al., 2014; Tang et al., 2016). This research chooses version is GPM-IMERG (Integrated Multi-satellite Retrievals for GPM) V6 Final-Run (https://gpm.nasa.gov/data/directory). It provides global daily precipitation data of 0.1°×0.1° from June 2000 to the present (February 2023).
MSWEP is a multi-source integrated precipitation product derived from the advantages of station data, remote sensing data and reanalysis data, characterized by a long time scale and high spatial resolution (Alijanian et al., 2017; Beck et al., 2019). Compared with MSWEP V1, MSWEP V2.2 used in this study improved the spatial resolution from 0.25° to 0.1°, and the time series also improved from 1979 to 2015 to 1979-2020, providing 3°h gridded precipitation data (http://www.gloh2o.org/).
In this paper, the overlapping period from 2000 to 2020, which can be obtained from multi-source data, is selected for research during downscaling. The projection, rotation, format conversion and unit standardization of GPM and MSWEP data were carried out, and the corresponding monthly, seasonal and annual precipitation data were combined by raster calculator for downscaling.
2.2.2 Environmental variables
Tianshan Mountains are characterized by complex terrain with large elevation changes (321–7426 m) and a temperate continental climate with obvious fluctuations (Domrös and Peng, 2012). The extreme temperature in winter and summer leads to uneven precipitation in Tianshan Mountains (Domrös and Peng, 2012; Chen et al., 2016). Therefore, considering the selection of environmental variables from the aspects of terrain factor and climate factor, it provides a necessary basis for the change trend of precipitation downscaling model in the study area. DEM is derived from SRTM data with a spatial resolution of 90 m (http://gscloud.cn/), and slope and aspect are extracted by ArcGIS as topographic factors. Climate factors come from China Meteorological Data Network (http://data.cma.cn/), including temperature (TEM), relative humidity (RHU), wind speed (WIN), sunshine duration (SSD), maximum temperature (MAX) and minimum temperature (MIN). Factors strongly correlated with precipitation were selected as explanatory variables by correlation test, and grid data were formed by Kriging interpolation (Seo et al., 2015). In order to facilitate downscaling, explanatory variables need to maintain the same resolution as precipitation products. The convolution method (Kumar et al., 2017) was used to resampling raster data of altitude, slope, aspect and climate factors to 0.1° and 1 km. Compared with the nearest neighbor method and bilinear method, the convolution method takes into account both the resolution and fidelity of the data, and generally achieves better resampling effect (Awada et al., 2019).
2.2.3 Ground observations data
The ground observation data were obtained from the daily scale sites of the National Meteorological Information Network (http://www.nmic.gov.cn/). Quality control was carried out on all the station data (Li et al., 2017), and the missing data was obtained by linear interpolation using the latest available data. Limited by the complex terrain and inconvenient transportation in mountainous areas, the available meteorological stations in Tianshan Mountains are very sparse. The spatial distribution of stations is shown in Figure 1A. A total of 36 stations are used in this study, and the available time series is from 1951 to 2020.
2.2.4 Spatial downscaling process of GPM and MSWEP data
In this study, a combination of geographically weighted regression and Kriging interpolation method is proposed to downscale GPM and MSWEP (spatial resolution is 0.1°×0.1°), and through precision test to generate a high resolution (1 km×1 km) precipitation dataset, which is applied to the spatiotemporal monitoring of drought characteristics in the study area. The realization of downscaling is based on two basic assumptions: first, there is a correlation between precipitation and the selected environmental variable factors, and it can be explained by the established model; Secondly, the model established at a lower spatial resolution consistent with the precipitation product can also use the interpolation results of environmental variables to predict the precipitation at a higher resolution, which is also called the “relational scale invariant” hypothesis (Duan and Li, 2016). The downscaling model construction and data processing process is shown in Figure 2. Specific steps are as follows:
1. At the time scale, the daily precipitation data of GPM and MSWEP and environmental variables were unified into the monthly scale, and the factors with strong correlation with precipitation were selected as explanatory variables through correlation test.
2. Explanatory variables with spatial resolution of 1°km×1°km and 0.1°×0.1° were prepared by Kriging interpolation and resamping tools in ArcGIS, wherein the latter was used to match spatial resolution of GPM and MSWEP products (0.1°×0.1°).
3. The relationship between the explanatory variables and the two precipitation products were established by the test of geographic variability (GVT), and the explanatory variables were screened into two types: spatially variable local variables and spatially fixed global variables.
4. Local variables and global variables with coarse resolution (0.1°×0.1°), as well as GPM and MSWEP, were introduced into GWR and MGWR models, and the corresponding intercepts, residuals, and coefficients of each variable with coarse resolution (0.1°×0.1°) were calculated.
5. The intercept, residual and coefficient were interpolated by Kriging interpolation method, and the 1°km×1 km raster data were obtained. As a represent of geostatistical interpolation method, Kriging interpolation has the ability to measure the prediction accuracy and is suitable for interpolating uniformly distributed grid points (Seo et al., 2015).
6. Xiaolong Li, Xiaolong Li, The interpolation results of interceptions, residuals and coefficients were calculated with the explanatory variables of the spatial resolution of 1°km×1 km to obtain the high-resolution monthly precipitation data of GPM and MSWEP. The corresponding seasonal and annual precipitation grids were obtained by using the grid calculator in ArcGIS for addition.
7. Five statistical indicators, CC, BIAS, NSCE, RMSE, and SDR, were used to test the accuracy of the downscaling results at time and space scales.
8. According to the comprehensive evaluation results, a set of high-resolution precipitation products with the highest accuracy was selected and applied to the spatiotemporal monitoring of drought characteristics in the Tianshan Mountains.
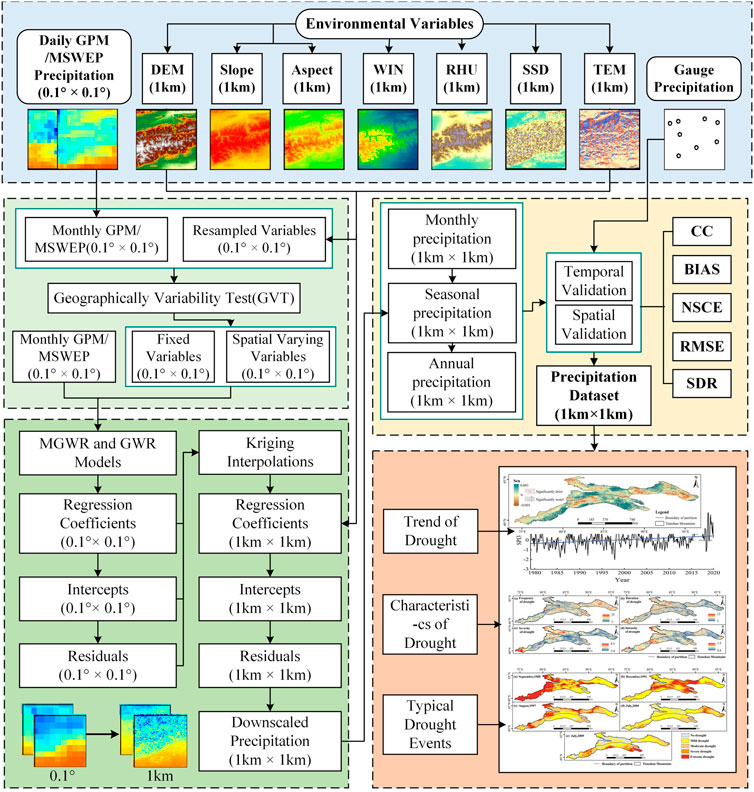
FIGURE 2. A comprehensive flow chart for data processing and downscaling model construction based on an improved geographical weighted regression model (GWR and MGWR).
2.2.5 GWR and MGWR regression models
As an extension of the traditional least squares regression method, GWR was first proposed by Brunsdon (Brunsdon et al., 1998), which described the dynamic relationship between the causal variables and explanatory variables in the geographic space, rather than the single regression that took the study area as a whole (Lu et al., 2022). Therefore, it has been widely applied in the study of complex scale-dependent characteristics between meteorological elements and topographic elements in high-altitude mountainous areas (Chu, 2012; Kumari et al., 2017). The mathematical expression of GWR model is as follows:
In the formula,
Among them,
Where,
MGWR is an extended form of GWR, which deals with mixed coefficients with spatial variation (local variables) and fixed or constant coefficients (global variables) in calculation (Fotheringham et al., 2017). Generally speaking, MGWR is a generalized GWR model, which introduces additional global variables to better represent the spatial heterogeneity of precipitation in the regression model. In this study, GVT was used to identify spatial variation (local) and fixed (global) environmental variables in the study area. Diff of Criterion (DIF) is adopted as the index to judge the fixed and variable terms in the model (Mei et al., 2006). A positive value of DIF indicates that the factor is specified as a local variable in the GWR model and as a global variable otherwise. In the GWR model, we repeated GVT for all environment variables to determine fixed and varying variables, so as to facilitate the construction of MGWR model. The mathematical expression of MGWR model is as follows:
Where,
2.2.6 Accuracy evaluation
The accuracy verification of the datasets includes the performance comparison of the two downscaling models and the accuracy assessment of the spatial-temporal correlation between the downscaling results and the measured precipitation, which is divided into the following two steps:
1. Performance comparison of the two models. Through Akaike information criterion correction (AICc) and residual sum of squares, the downscaling results of two commonly used spatial weight functions (Chao et al., 2018) (adaptive bivariate weight function and fixed Gaussian weight function) under two different models (GWR and MGWR) were respectively compared with the original satellite precipitation data. It is believed that smaller AICc and residual sum of squares are more favorable (Abdollahipour et al., 2021).
2. Accuracy evaluation of temporal and spatial correlation between the downscaling results and the measured precipitation. As for the comparison of spatial correlation, the grid data with the same resolution as the downscaling results was obtained by interpolating the measured data, and the grid data was used as real spatial precipitation to evaluate the data accuracy of the downscaling results. As for the accuracy of data in time series, based on the comparison of point data, this study compared and analyzed the correlation and deviation between the measured precipitation at the station and the nearest downscaling grid data from different scales of year, seasonal and month. In this study, five statistical indexes including correlation coefficient (CC), relative bias (BIAS), Nash coefficient (NSE), root mean square error (RMSE) and standard deviation ratio (SDR) were selected to reflect the degree of consistency between downscaling results and the measured data. The calculation formula is as follows:
Where: n is the length of precipitation series; Si and Gi are grid precipitation data and site measured precipitation data, respectively. S and G correspond to the average time series of the two precipitation data.
2.3 Application of downscaling results to drought monitoring
2.3.1 Theil-Sen median (Sen) trend and Mann-Kendall (M-K) significance test
The variation of drought trend is an important index of drought monitoring. This study analyzed the variation of dry and wet trends in different subregions of Tianshan Mountains based on Sen trend and Mann-Kendall (MK) significance test. M-K non-parametric test method can judge the mutation points of the sequence and the trend of each interval, so as to realize the significance test of the trend analysis results (Huang et al., 2015).
2.3.2 Standardized precipitation index (SPI)
The Standardized Precipitation Index (SPI) was proposed by McKee (McKee et al., 1993) in 1993, which only relies on precipitation data to quantitatively describe regional drought conditions. Research (Chang et al., 2018; Adarsh and Janga Reddy, 2019) showed that SPI(SPI3) on a 3-month time scale can better reflect soil water deficit in the underlying surface of arid northwest China. Therefore, SPI3 is selected as the drought research index in this study, and its range is [-3,3], the value represents the degree of dry and wet with positive values representing humidity and negative values representing drought, and the larger the value is, the wetter it is. Supplementary Table S1 is the drought grade table of standardized precipitation index SPI3 obtained according to the national standard of Meteorological Drought Grade GB/T20481-2006.
2.3.3 Identification and quantitative characterization of drought events
Based on the run course theory (Yevjevich, 1967), this study identified drought events and quantitatively analyzed the drought characteristics of drought events, as shown in Figure 3. The paper only focuses on drought events with a long duration and a high drought peak: drought (SPI<0) for 3 consecutive months or more and the peak value less than −1.0 (Guo et al., 2022). The time when SPI starts to be negative and recovers to be positive are defined as the beginning and end time of drought event respectively, and the period is the duration of drought (Formula 10). Drought severity is defined as the cumulative value of SPI during drought (Formula 11). Drought intensity is defined as the ratio of drought severity to drought duration (Formula 12). Peak value of drought is the minimum value reached by SPI during drought, and the corresponding month is the peak drought time (Formula 13).
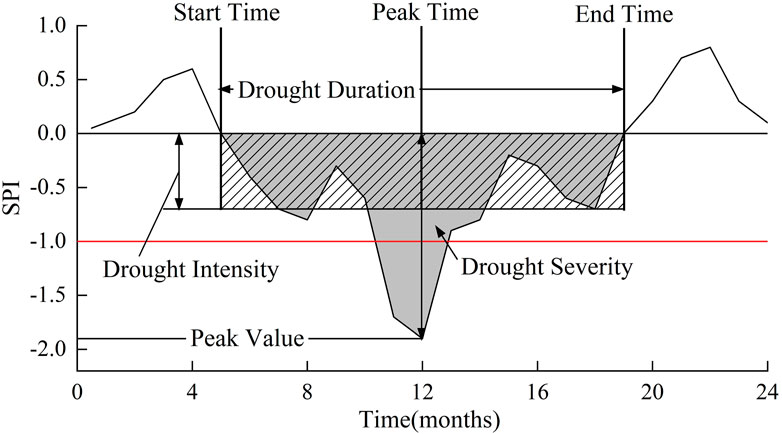
FIGURE 3. Schematic diagram of drought events and their basic characteristics.
Where,
3 Results
3.1 Precipitation response to environmental variables in the Tianshan Mountains
Correlation analysis was conducted between the monthly precipitation mean extracted from two kinds of satellite products GPM and MSWEP and various environmental variable factors (Figure 4). Draw a conclusion: GPM monthly precipitation was extremely significant positively correlated with DEM and RHU (p<0.001), extremely significant negatively and significant negatively correlated with TEM, WIN and SSD (p<0.01), respectively (also see Supplementary Figure S1). There were positive correlation (p<0.05) and negative correlation (p<0.05) with ASPECT, SLOPE and MIN, respectively. MSWEP was extremely significant positively correlated with DEM, ASPECT, SLOPE and RHU (p<0.001), extremely significant negatively and significant negatively correlated with SSD, TEM and WIN (p<0.01), respectively. And negatively correlated with MIN (p<0.05). Meanwhile, the monthly precipitation of GPM and MSWEP had no correlation with MAX. Therefore, DEM, WIN, RHU, SSD, TEM, and DEM, ASPECT, SLOPE, WIN, RHU, SSD, TEM were selected as explanatory variables of GPM and MSWEP respectively. In order to avoid the deviation caused by multicollinearity of explanatory variables, variance inflation factor and variance Inflation factor (VIF) are selected as indicators to determine whether collinearity exists between factors (Supplementary Table S2), and explanatory variables with collinearity are eliminated.
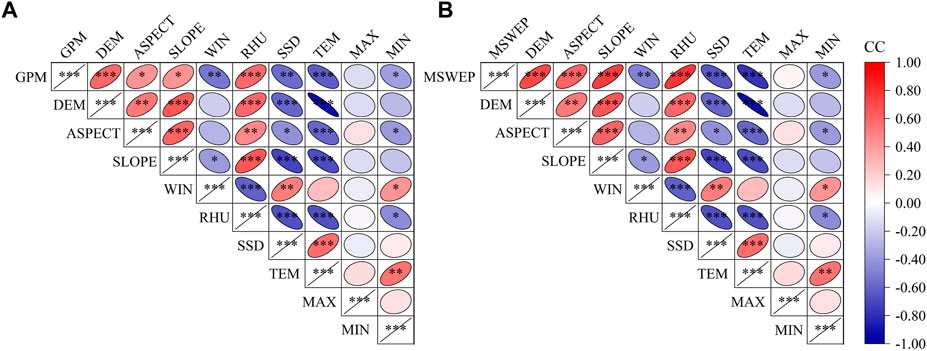
FIGURE 4. Correlation analysis between precipitation and environmental factors (A). GPM; (B). MSWEP).
In addition, we also conducted a geographic variability test to evaluate the responses of selected explanatory variables to spatial varying (local) and fixed (global) variables across the study area. Variables with positive standard variance values (DIFF) were taken as fixed variables. Table 1 respectively describes the GVT statistics corresponding to the environment variables of the DIFF-based GPM and MSWEP. It can be seen that, the DIFF value of GPM is positive (135.24), which should be specified as fixed variables, and others should be introduced into the model as varying variations. Accordingly, DEM (190.58), ASPECT (190.58) and SLOPE (31.42) are specified as global variables of MSWEP, while others are local variables.
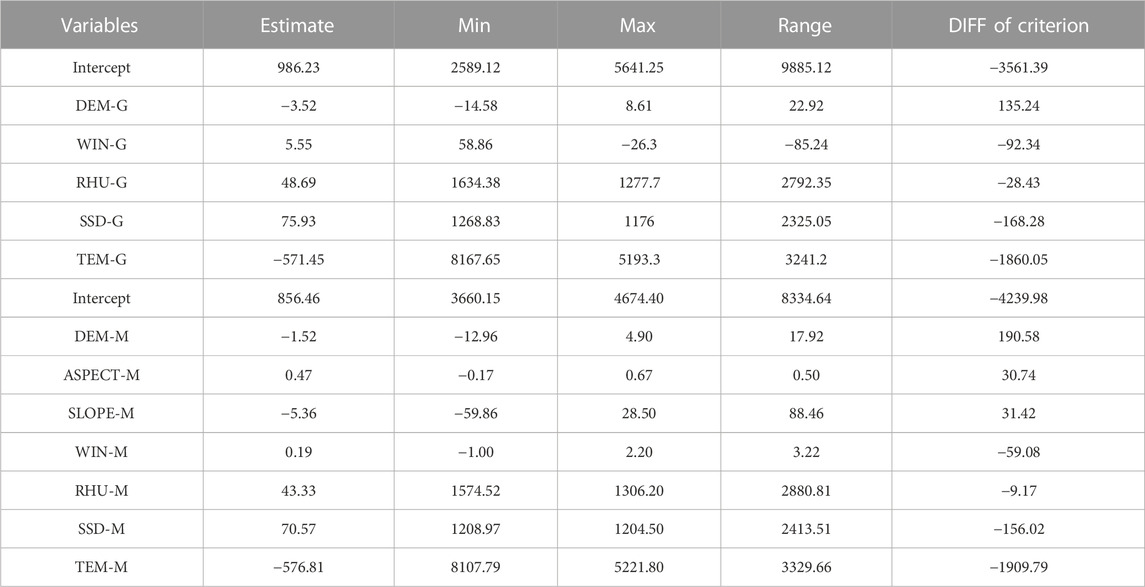
TABLE 1. Geographical Variability Test (GVT) of Environmental Variables based on Standard DIFF.
3.2 Comparison of GWR and MGWR models
The establishment of the regression relationship between remote sensing products and explanatory variables is a key step for downscaling. In this section, GWR and MGWR were modeled with the filtered environmental factors of GPM and MSWEP as independent variables and the measured precipitation as dependent variables. The prediction performance of two different spatial weight functions (adaptive double square weight function and fixed Gaussian weight function) was compared respectively (Table 2). The optimal model is the one with the highest correlation coefficient (R2) and adjusted correlation coefficient (Adj.R2) and the lowest Akaike information criterion correction (AICc) and sum of residual squares. The results show that compared with GWR, the MGWR model has a smaller AICc value due to the consideration of the bandwidth number of different factors, which indicates that the differentiation of environmental variables into local and global variables may reduce the AICc value, thus improving the prediction accuracy of the model and avoiding overfitting. Compared with the two weight functions, BI corresponds to the larger R2 and Adj. R2, the smallest AICc and the sum of residual squares, while the GU is the opposite. Therefore, we chose BI for the downscaling process.
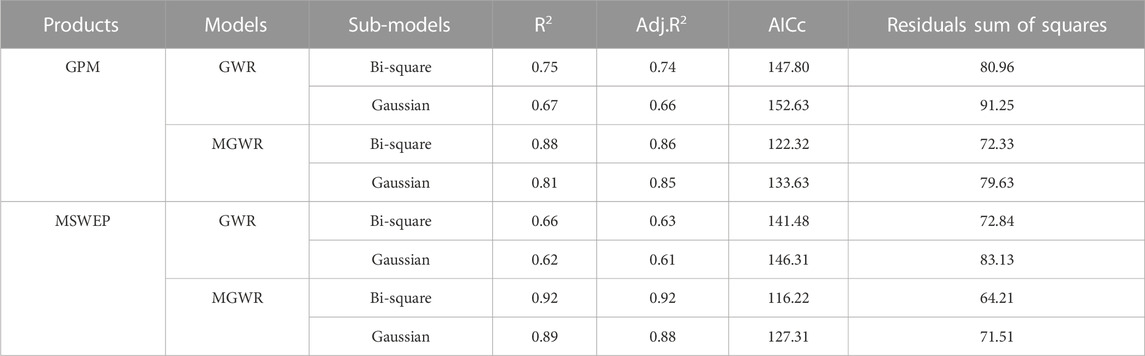
TABLE 2. Compares the performance of GWR and MGWR models using two different weight functions (GU and BI).
Supplementary Figure S2 further reveals the accuracy difference of the downscaling results of GWR (Supplementary Figures S2A–D) and MGWR (Supplementary Figures S2E–H) according to R2 and residual. For the two precipitation products, both models showed consistent R2 variation range (0.2–1.0) when estimating precipitation across the study area. The difference was that MGWR (R2>0.9) showed higher R2 than GWR in most areas. Compared with GWR (Supplementary Figures S2A, C), MGWR model results of the two products (Supplementary Figures S2E, G) significantly improved the lower R2 in the east of the South Tianshan. Compared with GPM, the phenomenon of abnormally low correlation between MSWEP and measured precipitation in the middle Tianshan Mountains has a lower probability of occurrence, which is because the central Tianshan Mountains’ fluctuation changes obviously and are located on the windward slope of the westerly air flow, which usually forms strong topographic rain (Xu et al., 2018). It greatly interferes with GPM products based on microwave detection. However, MSWEP products are revised with multi-source data (Liu et al., 2019), which weakens the occurrence of outliers. Although the spatial distribution regularity of residuals of the two products under GWR (Supplementary Figures S2B, D) and MGWR (Supplementary Figures S2F, H) models is not obvious, for GPM, the latter significantly improves the overestimation phenomenon within the residuals range of the former (1 mm<residuals<5 mm). For MSWEP, MGWR downscaling results also have a better performance than GWR in improving the underestimated precipitation phenomena (-5 mm<residuals<−1 mm) Therefore, in terms of the spatial distribution of R2 and residuals, MGWR model outperforms GWR.
3.3 Accuracy evaluation of GPM and MSWEP downscaling results
GWR and MGWR models with BI weight function were selected to downscale GPM and MSWEP respectively (from the spatial resolution of 0.1°×0.1°, also approximate to 10km×10km, to 1km×1 km), which were denoting as gGPM, mGPM, gMSWEP and mMSWEP respectively. By comparing the correlation and deviation between the measured interpolation precipitation and descending scale results of different time scales (such as month, season and year) and spatial scales, the dataset with the highest accuracy was selected for monitoring the drought characteristics of the Tianshan Mountains.
3.3.1 Accuracy evaluation of time series
To analyse the accuracy of downscaling results of different products in different time series, the precipitation data of measured stations in Tianshan Mountains and the raster data of corresponding grid points were included into the same series, and the downscaling data were analysed on monthly, seasonal and annual scales, respectively. Figure 6 shows the scatter density of measured monthly precipitation at rainfall stations and GPM, gGPM, mGPM, MSWEP, gMSWEP, and mMSWEP precipitation at corresponding locations during 2000–2020, respectively. It can be seen from Figures 5A, D that both the GPM (BIASGPM=−6.21%) and MSWEP (BIASMSWEP=−4.83%) underestimated the monthly precipitation in the Tianshan Mountains, and MSWEP (CC=0.63) had a higher correlation with the measured precipitation than GPM (CC=0.51). For GPM, the GWR model can significantly improve the underestimation (BIASGPM=−6.21%; BIASgGPM=−2.65%) and the degree of aggregation of scatter points (Figure 5B), while mGPM (Figure 5C) is better than gGPM, but the difference is very small. The downscaling comparison results of MSWEP are different from those of GPM. Compared with GWR, the correlation coefficient of MGWR model results (CCgMSWEP=0.77; CCmMSWEP=0.93) and Nash coefficient (NSEgMSWEP =0.70; NSEmMSWEP =0.88) is further improved, and quantitative error (RMSEgMSWEP =7.5; RMSEmMSWEP =1.3) decreases significantly, which has stronger variance interpretation ability for rainfall at stations (RgMSWEP2=0.77; RmMSWEP2 = 0.96). This may be because compared with GWR, which uses a single kernel function to calculate the weight of impact factors, MGWR can capture the difference of impact scales of different variables, so that the impact of terrain and climate factors fitted by the model on precipitation is more in line with reality. For MSWEP, which is itself the result of multi-source data fusion, the data can be revised twice (Sun et al., 2022). However, GPM, based on multi-satellite global observation system, does not consider the influence of local topography on precipitation in the study area (Nwachukwu et al., 2020). The introduction of ground data through GWR model can effectively improve the fitting degree of gGPM and measured precipitation, but whether to consider the different scales of impact factors (MGWR) does not have much positive impact on the improvement of data accuracy. It may introduce more biases.
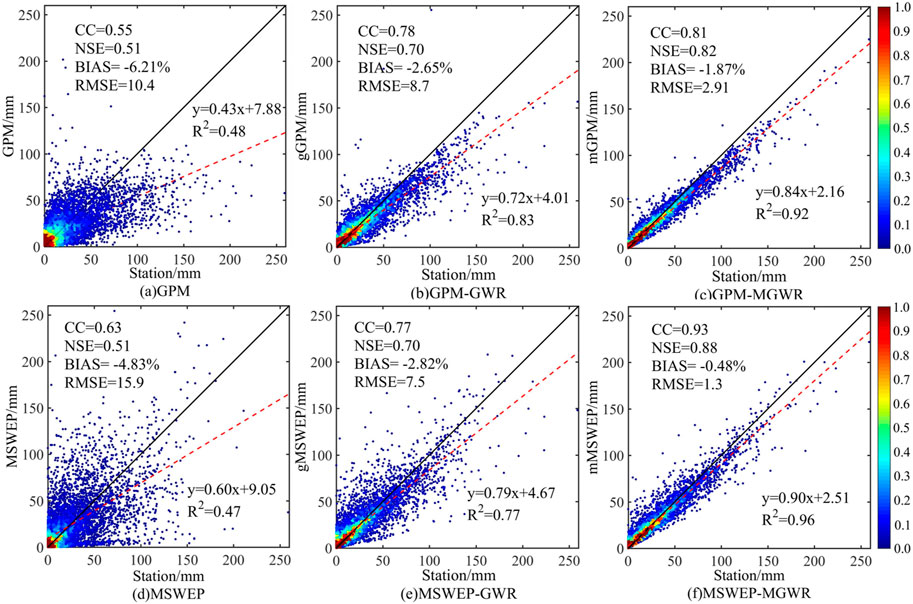
FIGURE 5. Scatter density of GPM and MSWEP and their downscaling results with measured monthly precipitation (A) GPM; (B) GPM-GWR; (C) GPM-MGWR; (D) MSWEP; (E) MSWEP-GWR; (F) MSWEP-MGWR.
To further refine the accuracy differences of different downscaling results in each month of the year, the time series of the correlation between GPM (Figure 6A), MSWEP (Figure 6B), their downscaling results and the measured monthly precipitation during the study period are drawn in Figure 6. The correlation of six kinds of data presents regular changes of volatility during the year. The original grid data of GPM showed a weak correlation with the measured data (CC>0.2). The results of GWR and MGWR showed a similar improvement to the original data, especially a very strong correlation with the measured precipitation around June of each year (CC>0.8). MSWEP and the measured data basically showed a moderate correlation (CC>0.4), except for some months, gMSWEP and mMSWEP realized a strong correlation (CC>0.6) and a very strong correlation (CC>0.8) with the measured data, respectively. The six kinds of data show a similar law in each month of the year: they all reach the maximum of annual correlation in June-August when measured precipitation is abundant, and they reach the minimum in December-February of the next year when precipitation is scarce. To further verify the seasonal characteristics of the correlation, the accuracy differences of six kinds of data are compared and verified in different seasons and annual average precipitation scales in Figure 9.
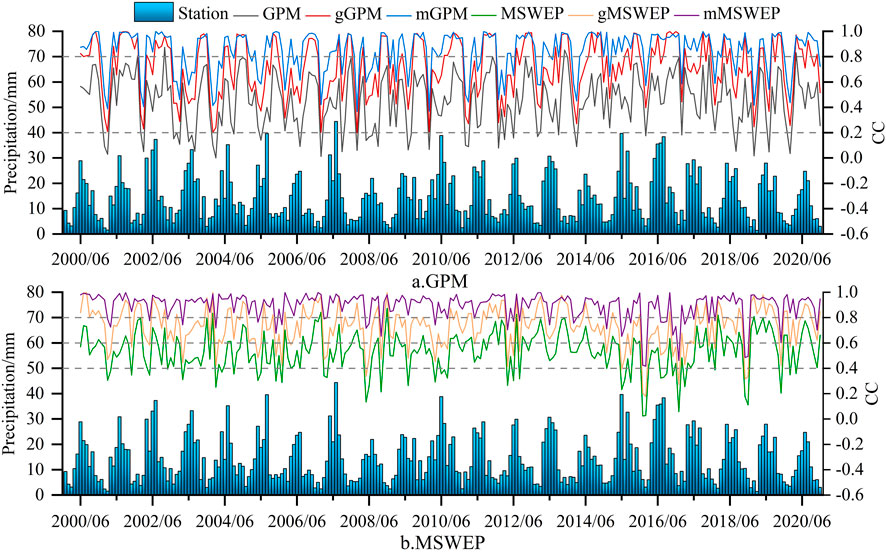
FIGURE 6. Time series changes of the measured precipitation and the correlation (CC) of GPM, MSWEP, the downscaling results and the measured precipitation (A) GPM and its downscaling results; (B) MSWEP and its downscaling results.
Based on the ground site data and the corresponding grid data extracted from GPM and MSWEP and their two downscaling results respectively, this section analyses the applicability of six kinds of data at the annual scale. The Taylor diagram (Supplementary Figure S3) is used to draw the SDR, CC and RMSE of six kinds of precipitation datasets. The position of each point on the Taylor diagram represents the matching degree between the dataset and the measured data. The closer the distance between the dot of the dataset and the dot of the site, the stronger the correlation and the smaller the error. The results of the six datasets have strong correlation with the observed precipitation data of summer (Supplementary Figure S3C) and autumn (Supplementary Figure S3D) in the Tianshan Mountains. The applicability of the annual scale (Supplementary Figure S3A) ranks the second, and the correlation of spring (Supplementary Figure S3B) and winter (Supplementary Figure S3E) is the worst. This verifies the discussion result of the month series correlation in Figure 6: whether satellite products or their downscaling results, their similarity to the measured data in different seasons is positively correlated with the precipitation abundance, which may be related to the causes of seasonal precipitation in the study area: In winter and early spring, the Tianshan Mountains are affected by the Siberian air mass (Zhang et al., 2012), and the weather is dry and cold, resulting in trace precipitation with very low intensity and perennial snow cover in the high altitude area, which greatly interferes with the precipitation detection of remote sensing products (Zhang et al., 2018). However, in summer and autumn (especially in summer), the precipitation mainly comes from the air mass with water vapor in the Atlantic (Zhang et al., 2016). When they pass through the Tianshan Mountains with complex terrain, they form convective rain with high intensity. Meanwhile, there is less snow and ice cover in summer, which brings higher accuracy for satellite remote sensing monitoring precipitation. As can be seen from Supplementary Figure S3, in most cases, the order of six data dots and observation stations from near to far is: mMSWEP, mGPM, gMSWEP, gGPM, MSWEP, GPM, which is also the precision order of the six to identify the annual precipitation in the Tianshan Mountains. In general, the correlation between the mMSWEP dataset and the measured data at different time scales is more than 0.8, indicating that MGWR has the best scaling effect on MSWEP, and can achieve high-precision precipitation inversion in mountainous areas with high spatial resolution.
3.3.2 Accuracy evaluation of spatial scale
Figures 7A–G shows the spatial distribution of satellite products, downscaling results and interpolated monthly mean precipitation at stations in the Tianshan Mountains during 2000–2020. Both the satellite products and the downscaling results can basically capture the spatial precipitation pattern of more precipitation in the West and less in the East, more in the North and less in the South of the Tianshan Mountains. However, both GPM (Figure 7A) and MSWEP (Figure 7B) seem to have missed the high precipitation in the Tianshan Mountains. Especially, it is difficult for GPM to continuously capture the differences in the spatial distribution of precipitation caused by the mountainous terrain. The downscaling models of GWR and MGWR can significantly improve the phenomenon that GPM and MSWEP satellite products underestimate the high value of measured precipitation (Figure 7G). The difference is that although MGWR-GPM (Figure 7C) can better improve the spatial discontinuities of GWR-GPM (Figure 7B) (such as the aggregation of high precipitation values in the West subregion of Tianshan Mountains), the former can significantly weaken the impact of the geographically weighted regression method on precipitation results by integrating background fields of different explanatory variables to achieve downscaling. However, it cannot be completely eliminated and even magnified in local areas (such as the “ox’s eye” phenomenon at the junction peak of the North and South Tianshan Mountains). For MSWEP (Figures 7D–F), compared with the downscaling results of GWR (Figure 7E) and MGWR (Figure 7F), the “ox’s eye” phenomenon was overcome, and the phenomenon of low overestimation and high underestimation of the measured precipitation by satellite products was more significantly improved (Figure 7G).
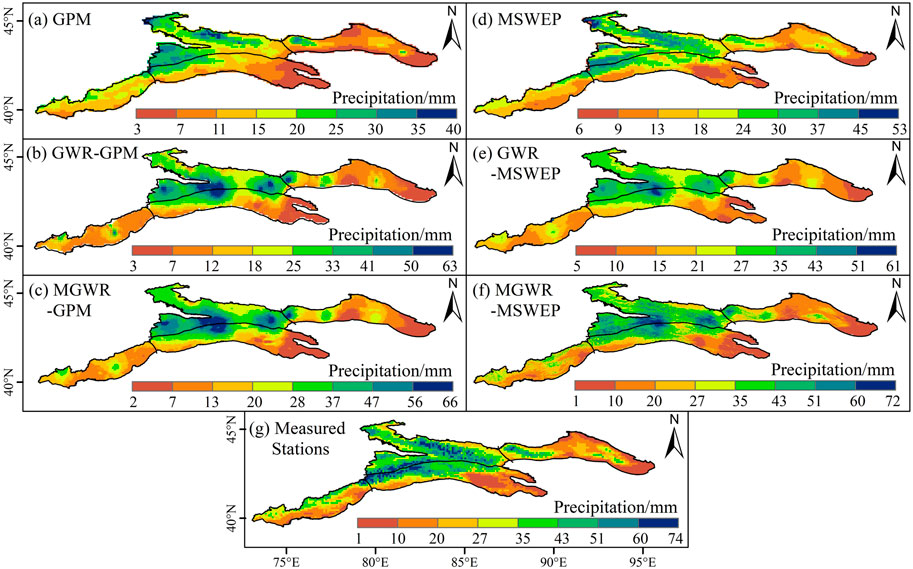
FIGURE 7. Spatial distribution of satellite products, downscaling results and interpolation of monthly precipitation in Tianshan Mountains (A) GPM; (B) GWR-GPM; (C) MGWR-GPM; (D) MSWEP; (E) GWR-MSWEP; (F) MGWR-MSWEP; (G) Measured Stations.
To further quantify the spatial distribution difference of downscaling results’ error, box charts of the accuracy statistical indicators of GPM and MSWEP and their downscaling results in different subregions are shown in Figure 8. The correlation coefficient and the mean relative deviation between monthly precipitation and measured precipitation of the 6 datasets analysed in Section 3.3.1 (Figure 5) (marked successively on the right axis of Figure 8) were used as the measurement standard for the regional differences. All kinds of products and their downscaling results showed a relatively consistent rule: the correlation with the measured precipitation showed a downward trend from Northwest to Southeast, which was basically consistent with the spatial distribution trend of precipitation in the Tianshan Mountains with more precipitation in the West and less precipitation in the East, more precipitation in the North and less precipitation in the South (Figure 7G). The correlation coefficient is used to reflect the consistency between data, so it is also necessary to discuss the accuracy change of the overall data in different subregions through the spatial distribution of the relative deviation: different data all showed a small underestimation of the precipitation in the West (−6.21%<BIAS<0), and the precipitation in the West subregion near the Ili Valley is stable with little topographic fluctuation and obvious regularity of precipitation (Figure 7G). Satellite remote sensing products can well detect the distribution characteristics of precipitation. The low estimation of precipitation in the South is greater than that in the North, and the GWR and MGWR models effectively narrow the deviation range between the North and South. GPM and MSWEP and their downscaling results show the phenomenon of underestimated and overestimated precipitation in the East subregion respectively, and the relative maximum deviation range in the four subregions. The East Tianshan Mountains are mainly distributed in the Turpan-Ha Basin (Domrös and Peng, 2012), which is far away from the ocean and the terrain is closed. Moreover, under the influence of the hot and dry subtropical continental air mass, it is difficult for the water vapor at the top of the atmosphere to fall to the ground completely (Hu et al., 2016). This results in the monitoring error of precipitation products.
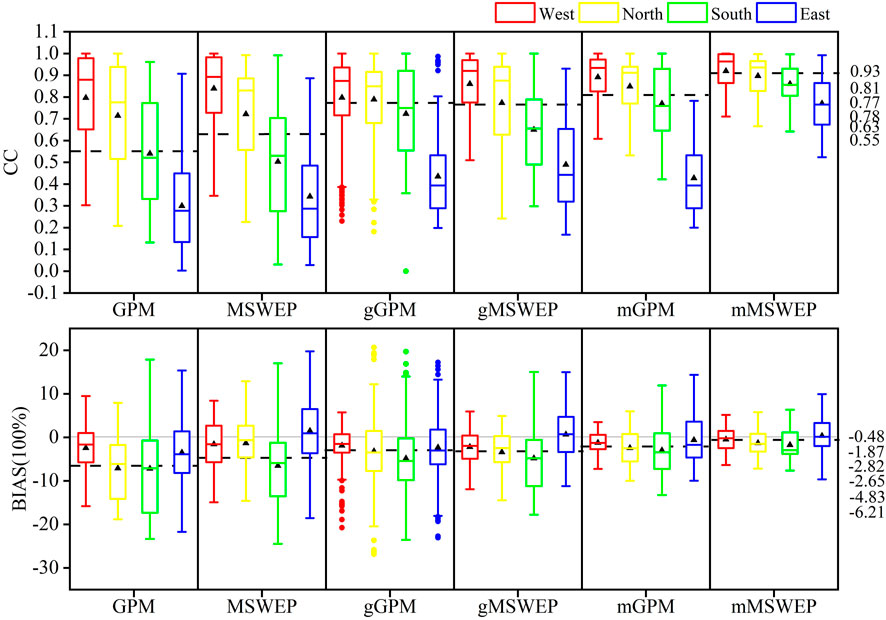
FIGURE 8. Accuracy evaluation of GPM, MSWEP and their downscaling results in different sub-regions (In the box diagram, the solid line represents the median, the black triangle represents the mean, the four horizontal lines from top to bottom are the top edge, the top quartile, the bottom quartile and the bottom edge respectively, and the round dot represents the outlier).
In particular, there are some outliers in the correlation and relative deviation between gGPM and measured precipitation in different sub-regions, and the grid locations of these outliers basically appear at the aggregation of outliers in Figure 7B, which further indicates that GWR has a certain applicability limitation to the downscaling effect of GPM, and there is still a large room for improvement In summary, mMSWEP has the highest fitting degree with the spatial distribution of measured precipitation in Tianshan Mountains, and can reflect the precipitation differentiation characteristics in different subregions with a high resolution (1 km×1 km).
3.3.3 Temporal and spatial analysis of drought characteristics in Tianshan Mountains
According to the research results in Section 3.3, compared with GPM, the mMSWEP dataset obtained through the downscaling of MGWR model has higher accuracy in different time series and spatial scales, and its correlation of monthly precipitation is basically above 0.7, meeting the basic requirements of drought detection using remote sensing data (Tan et al., 2018). Therefore, in this section, high-resolution (1km×1 km) and long-time series (1979–2020) mMSWEP dataset will be used to invert the spatial and temporal distribution of drought characteristics in the Tianshan Mountains and provide technical support for drought monitoring, early warning and drought relief in the northwest mountainous areas of China.
3.3.3 Analysis of drought trend
Based on the 3-month SPI index (SPI3), this section uses the Sen slope coupled MK test method to analyse the spatiotemporal variation of dry and wet conditions in the Tianshan Mountains during 1979–2020, pixel by pixel. The pixels that passed the MK test accounted for 94.5% of the whole Tianshan Mountains. According to the calculation results, the slope estimation results were divided into five grades (Figure 9). Among them, 71% of the areas showed a significant trend of wetting, 15% were slightly wet areas, only 9% showed a significant trend of drying, mainly concentrated in the East Tianshan Mountains, but a small part near the Alatao Mountain in the west of North and the west of the South subregion. The variation trend of dryness and wetness shown in Figure 9 is basically consistent with the distribution pattern of average drought zones reflected in Figure 2 according to the station data over the years -- the North subregion is wetter than the South and the West is wetter than the East, but it shows a richer and clearer spatial texture, and more details of drought are also monitored.
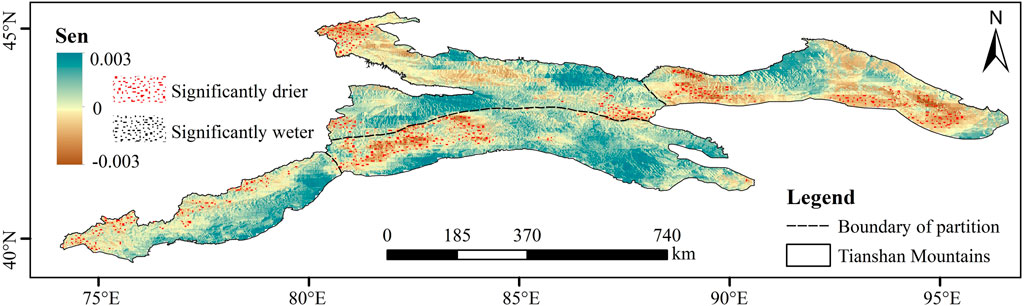
FIGURE 9. Spatial distribution of SPI3 during 1979–2020.
At the subregional scale, SPI3 drought index was calculated based on regional mean precipitation data and time series of Tianshan Mountains and its four subregions were analysed (Figure 10). During 1979-2020, the overall wetting trend of Tianshan Mountains was obvious, with a slope of 0.0016 (Figure 10E), and passed the significance level test of 0.05. In the past 40 years, the basic order of the wetting trend of different regions in Tianshan Mountains is as follows: North (Figure 10B)> West (Figure 10A)> East (Figure 10D) > South (Figure 10C), which is basically consistent with the spatial distribution of Figure 9. Among them, the North and South regions passed the significance level test of 0.05, and the change trend of the West and East only passed the significance level test of 0.1. Since 2000, the overall wetting trend has been intensified, which may be due to the enhanced water vapor transport from high latitudes in the northern Hemisphere with the global warming since the 21st century, and the “three-stage water vapor relay transport” from the tropical Indian Ocean and Arabian Sea to the Central Asian mountains through the western Indian Ocean, the southern Arabian Peninsula and Central Asia (Guo et al., 2022).
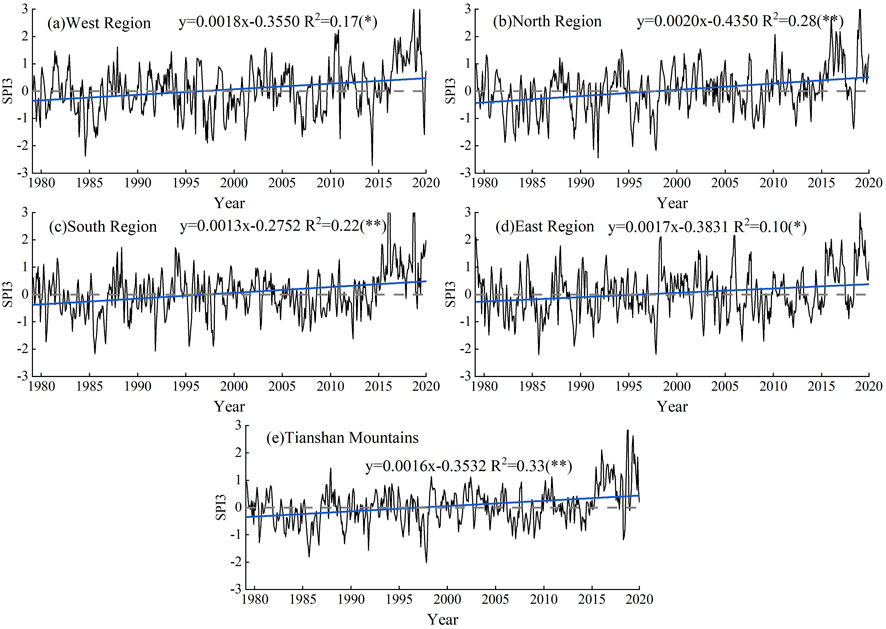
FIGURE 10. Variation trend of SPI(SPI3) time series in the Tianshan Mountains and its subregions (A) West Region; (B) North Region; (C) South Region; (D) East Region; (E) Tianshan Mountains).
3.3.4 Analysis of spatial characteristics of drought events
To explore the drought events and their characteristics in the Tianshan Mountains, drought events were extracted pixel by pixel based on SPI3 and range-length theory, and the number of drought events and the average of their characteristics (severity, intensity, and peak value) were calculated based on the pixel by pixel. The results are shown in Figure 11.
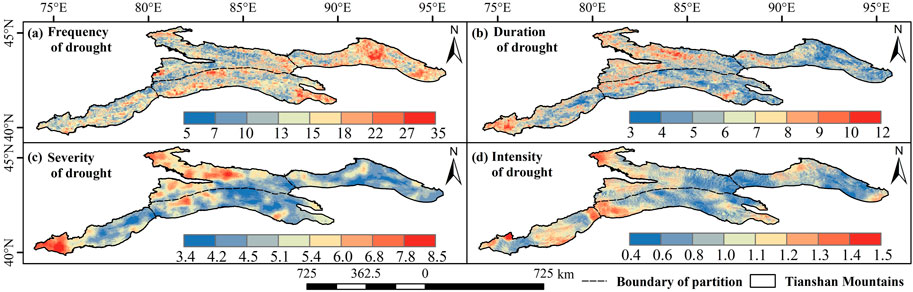
FIGURE 11. Spatial distribution of drought characteristics (A) Frequency of drought;(B) Duration of drought; (C) Severity of drought; (D) Intensity of drought.
Figure 11A shows the frequency of drought events identified during 1979–2020. As can be seen from the figure, droughts have occurred more than 30 times in most areas of the East Tianshan Mountains in the past 40 years. In the North and West, the frequency of drought is low, and the frequency is less than 10 times. As can be seen from Figure 11B, the drought in the north slope of the North Tianshan Mountains and the area near Halkatawu Mountain in the West Tianshan Mountains has a longer duration, with an average duration of 10 months Figure 11C shows the spatial distribution of the average severity of all drought events over the past 40 years. It is not difficult to see that most regions with a longer duration of drought also have a higher severity, such as the junction of the West region and the Northern slope of Kunlun Mountains and the vicinity of Yilian Habirga Mountain in the North region, indicating that the drought severity in these areas is mainly affected by the longer duration of drought. The difference is that parts of high severity also occur in the North region of the Tianshan Mountains and the western part of the South region of the Tianshan Mountains, and the drought severity in these areas is mainly affected by the high intensity (Figure 11D).
3.3.5 Typical drought events
Based on the SPI index calculated by the average precipitation in the study area, the drought events in the Tianshan Mountains during 1979–2020 were identified in combination with the run theory method, and the duration, intensity, severity, peak value, and other basic characteristics were quantified. Based on the three-month SPI drought index, 16 drought events can be classified by consensus, and the basic characteristics of drought events are shown in Table 3.
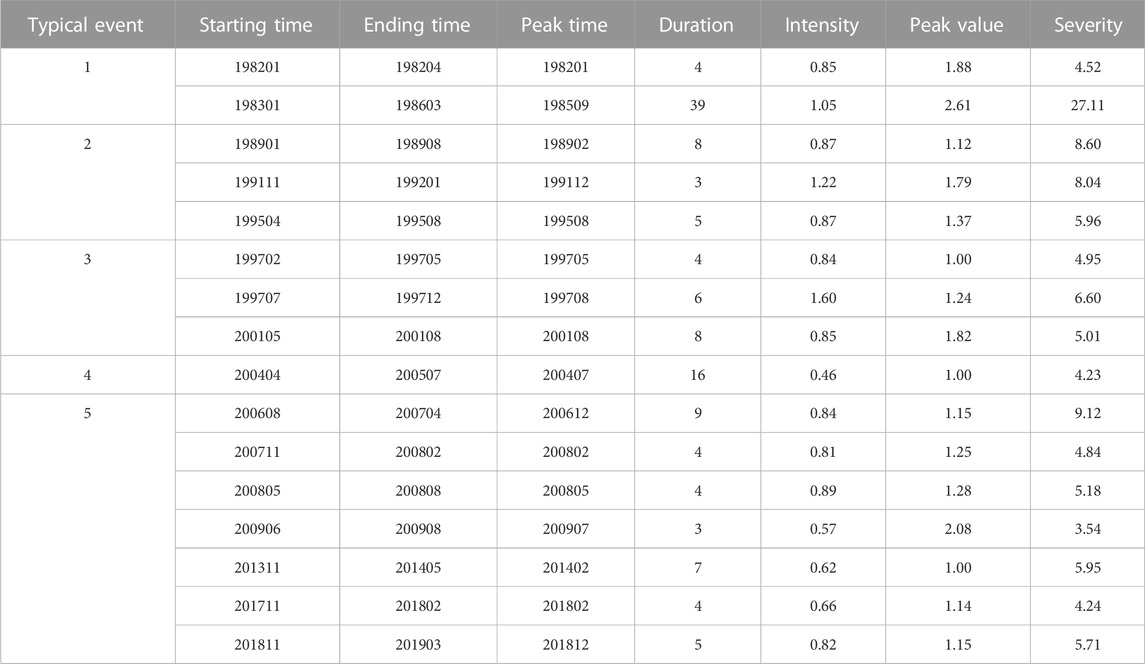
TABLE 3. Typical drought events and their basic characteristics in the Tianshan Mountains.
Five typical drought events were selected and analysed one by one according to the duration, severity and intensity of drought, the underlined contents in Table 3 were the five typical drought events and their drought characteristics. Figure 12 shows the spatial distribution of peak drought in the five drought events.
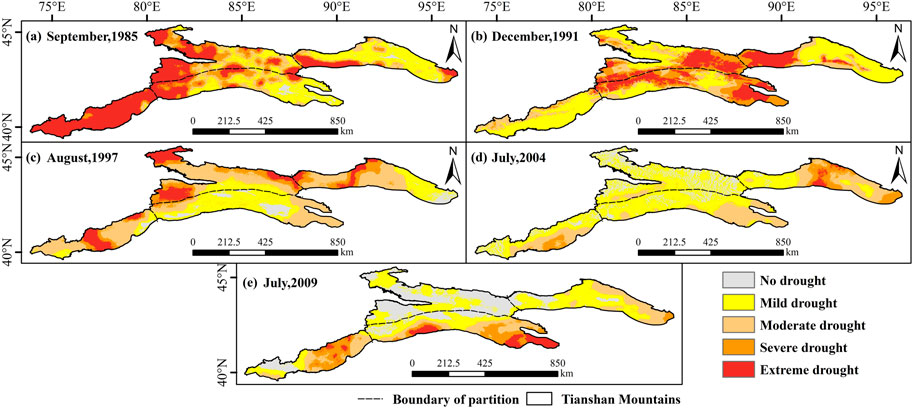
FIGURE 12. Spatial distribution of drought peak in five typical drought events (A) September, 1985; (B) December, 1991; (C) August, 1997; (D) July, 2004; (E) July, 2009).
Typical drought event one is the drought event with the longest duration and the highest severity. The drought began in January 1983 and lasted for 39 months. It reached its peak in September 1985 with the absolute value of SPI reaching 2.61, which was in an extreme drought state. In March 1986, the drought condition of this drought event returned to the normal level. Figure 12A shows the spatial distribution of drought in the Tianshan Mountains in September 1985. As can be seen from the figure, 96% of the Tianshan Mountain area is in the state of drought, especially the West, North and South of the Tianshan Mountain, and the west of the East region near the Turpan-Hami Basin show SPI value <-2, which is in the state of extreme drought. The area of extreme drought accounts for 30% of the total area of the Tianshan Mountain area. Mahmood (Mahmood et al., 2010) obtained a similar conclusion in related studies that extreme drought events occurred in the Tianshan Mountains during 1983–1986, and the drought was mainly concentrated in the western part of the Tianshan Mountains.
Typical drought event two began in November 1991 and ended in January 1992. As can be seen from Table 3, the drought event lasted only 3 months, with a high drought intensity of 1.22 and a drought severity of 8.04. This drought event is a typical type of short-time high-intensity drought. Figure 12B shows the spatial distribution of SPI drought level in December 1991. It can be seen from the figure that drought covered more than 98% of the Tianshan Mountains in that month, and the areas of severe and extreme drought accounted for 15% and 27%. The North and South Tianshan Mountains were affected by severe and extreme drought levels. The Western and Eastern sections of the East region showed extreme drought and slight drought, respectively. The opposite of this drought event is typical drought event 5 (Figure 12E), which belongs to the typical short-time low-intensity drought type. In addition to the severe and extreme drought in the West of the Tianshan Mountains and the eastern part of the South region, the East region, and the North region the of Tianshan Mountains mainly have mild drought and no drought, respectively. When studying the drought in Xinjiang, Yao et al. (Yao et al., 2018b) proposed that the drought in 2009 was a low-intensity and low-impact drought event, mainly affecting parts of the southern slope of the Tianshan Mountains. According to statistics of Xinjiang Water Resources Department (Communique, 2009) in 2009, drought affected 49.9×10⁴hm2 of crops in the whole region, including 1.83×10⁴hm2 of no harvest area and 597×104hm2 of severe drought grassland. The drinking water of 165 ×104 million people and 37.8×10⁴ million livestock were seriously affected. Among them, Aksu, Baicheng and Kumish areas are suffering from severe drought (which are located near the West of the Tianshan Mountains and the Eastern part of the South).
Typical drought event 3 was the most intense drought event among all the drought events, and its intensity value reached 1.60. It occurred from July 1997 to December 1997 and lasted for 6 months with a severity of 6.60. Such short duration but high intensity drought events often have a greater impact on ecosystems and vegetation than long time, low intensity drought events. Figure 12C shows the SPI classification distribution in August, the most severe month of drought. As can be seen from the figure, about 86% of the area is in a state of drought, and about 25% of the area is in an extreme state of drought. These areas are mainly distributed in the West and middle part of the East Tianshan Mountains.
Typical drought event four belongs to the drought event with long duration but lowest drought intensity. The drought event began in April 2004 and ended in July 2005. The intensity of drought was only 0.46, the duration was 16 months, and the severity was only 4.23. Li et al.(2016) pointed out that 2004 was a typical drought year in Xinjiang, and most regions of Xinjiang were affected by drought to some extent, including the Tianshan Mountains. In July 2004, the drought event was the most severe month. 70% of the Tianshan Mountain area was in the state of drought, but the intensity was not high, and the drought was mainly slight (Figure 12D). Only a small part of the East Tianshan Mountains was in extreme drought. According to statistics of Xinjiang Water Resources Department (Communique, 2009), the drought in 2004 was the longest in 15 years, compared with 1990–2004.
Based on the spatial analysis of drought characteristics (Figure 11) and typical drought events (Figure 12), the West region has drought characteristics of low frequency, long duration, and high severity, while the East region has completely opposite drought characteristics: high frequency, short duration, and low severity. Occasional short - term high - severity drought events occur in North and South regions.
4 Discussion
4.1 Demonstration of the “relational scale invariant” hypothesis
In this study, whether GWR or MGWR models, the downscaling of satellite products as a geographically weighted regression model is based on the hypothesis of “relational scale invariant”, which is also the case in previous studies (Fotheringham et al., 2017; Oshan et al., 2019). Different statistical regression models were introduced to apply the relationship between precipitation and surface physical parameters at low spatial resolution to high spatial resolution, to improve the detailed texture of low-resolution precipitation product images (Xu et al., 2015; Zhao et al., 2018). This method has strong operability and high accuracy. By considering the physical mechanism affecting the formation and distribution characteristics of precipitation, the consistency of spectral information of precipitation products before and after downscaling is ensured. However, since the land cover types and topographic characteristics of the mountain surface are more complex and variable than those of the plain area, some studies have shown that the " relational scale invariant " hypothesis can be successfully applied to areas with uniform terrain and land cover (Lu et al., 2020), but there may be some applicable conditions and limitations for mountain areas with geomorphic changes and undulating elevations.
Therefore, in this section, the downscaling result images of GPM and MSWEP monthly precipitation in Tianshan Mountains with a resolution of 1 km (Figures 9B,C,E,F) and topographic factor (mainly DEM) images with a resolution of 1 km are spatially aggregated to 2km, 5km, 10 km (0.1°) and 25 km (0.25°). In this paper, the effective raster image element value is used to verify the variation rule of statistical relationship between downscaling results and topographic factors at different resolution scales. As can be seen from Supplementary Table S2, as the difference between image resolution increases, the difference between regression coefficient and intercept between precipitation and elevation relationship also increases, especially the regression coefficient has obvious changes. However, when the difference between the two resolutions is 2–5 times, the relationship between precipitation and elevation changes little, basically satisfying the assumption that the relationship scale is unchanged. When the difference is more than 10 times, the change of the relationship between precipitation and elevation can no longer be ignored, which indicates that the " relational scale invariant " hypothesis based on the geographical weighted regression model for downscaling still has certain limitations. In this study, the downscaling within a small-scale range (from 0.1°×0.1° to 1km×1 km) is acceptable. Moreover, the improved MGWR model not only increases the spatial resolution, but also significantly improves the monitoring accuracy of MSWEP, showing better performance compared with other downscaling methods (Figure 7; Figure 8). However, for other precipitation products with lower resolution (such as 0.25°×0.25° TRMM), a large-scale reduction in the study area with non-uniform topography needs to be achieved gradually by classification, and the hypothesis of " relational scale invariant " is not universally applicable.
4.2 Advantages of the improved downscaling model
The downscaling results based on the improved MGWR model not only show more abundant and clear spatial texture caused by precipitation of different typographs in mountainous areas, but also show more accurate prediction accuracy than satellite product source data and other downscaling models (GWR, OLS (Yue et al., 2016)). On the one hand, considering the functional relationship between precipitation and scale factors is the key factor to determine the downscaling effect, which mainly comes from the important influence of statistical regression model. For the study area with complex terrain and large climate change (such as the Tianshan Mountains), there are obvious spatial heterogeneity scale differences in the effects of multiple factors on the distribution of precipitation. It is difficult for the classical GWR model and general linear regression OLS model to reveal the spatial heterogeneity scale effect between precipitation and scale factors in mountainous areas. MGWR model improves the classical statistical regression model by allowing each covariate factor to have different bandwidth Settings (Fotheringham et al., 2017), and it gives the influence scale range of different variables. MGWR model can better explain the effects of different environmental variables on the spatial variation of precipitation in mountainous areas by providing a more real and effective spatial process description.
On the other hand, for the two selected satellite data, the improved MGWR algorithm can obviously capture the detailed texture inside the original precipitation product image grid (0.1°), which degrades the “broken spot” effect in the results of other downscaling models to a certain extent (Figures 7B,E), especially in the mid belt of the Tianshan Mountains with large precipitation changes and severe topographic relief (Hu et al., 2016). This is mainly derived from the integrated Kriging interpolation method (Sharifi et al., 2019), which holds that the properties of environmental factors changing continuously in space are very irregular and cannot be simulated by a simple smoothing function. In this study, the method of dynamically determining the variable value (Zhang et al., 2010) according to the optimization criterion function is applied to the spatial interpolation of the regression relationship between precipitation and explanatory variables by Kriging, to make the interpolation function in the best state and facilitate the smoothing of spatial data. The error distribution results of different spatiotemporal scales also show the advantages of this fusion model: the downscaling results of MGWR, mMSWEP is highly correlated with the measured precipitation at monthly (Figures 5F, Figure 6B), quarterly (Figures 9B–E) and annual (Figure 9A) scales (CC>0.8). Higher precision spatial differentiation characteristics (Figure 7F) and very small (|BIAS| ≤ 0.48%) deviation distribution (Figure 8), which are also displayed in different subregions. This further confirms the feasibility and applicability of the improved MGWR algorithm in the process of spatial downscaling of remote sensing precipitation products.
4.3 Limitations and future directions
In this paper, based on the improved MGWR algorithm of Kriging interpolation, the spatial downscaling of satellite products in the Tianshan Mountains has been realized. While ensuring the high resolution and high accuracy of precipitation estimation results, drought monitoring in the northwest mountains of China has been realized. Although there are many advantages, there are still some shortcomings and limitations.
On the one hand, the MGWR applied in this paper mainly uses three topographic factors (elevation, slope, and aspect) which are closely related to precipitation in mountainous areas, and four meteorological elements (temperature, relative humidity, wind speed and sunshine duration). However, for the conversion function construction of GPM and MSWEP, there may be some insufficient characterization (the improved MGWR model in this study has different scaling effects on GPM and MSWEP). The construction of relational model and the selection of scale factor are directly related to whether the precipitation inversion with high spatial resolution and accuracy can be obtained. However, the selection of scale factors is not the same in many current downscaling studies on precipitation products, it is mainly affected by the comprehensive influence of surface environment characteristics (Zhang et al., 2019), acquisition time limit and availability of auxiliary variables (Chen et al., 2019) and other factors. For example, in this study, the downscaling model constructed has good applicability for MSWEP, but still has great room for improvement for GPM. On the other hand, due to the complex land cover and special climate environment in the study area, the downscaling relationship of precipitation products constructed by using MGWR does not have obvious universality in different zones. The reason may be that MGWR considers the spatial variation scale relationship between precipitation and scale factors. Although there is heterogeneity in geographical location and features in different subregions, the regression models constructed still have similar forms, which may ignore the spatial non-stationary relationship in local regions. At the same time, when constructing the downscaling transformation relationship for precipitation, the assumed “relational scale invariant” is most satisfied when the resolution scale difference is small (Supplementary Table S3). Therefore, it is expected that the spatial sharpening processing of satellite precipitation products by gradually downscaling will be achieved with higher accuracy in future research.
In order to obtain year-round and all-weather spatial precipitation data, in recent years, a large number of researchers have proposed a variety of schemes in terms of cloud descending water monitoring reconstruction with multi-source auxiliary information (Zhao and Duan, 2020) and precipitation fusion of multiple elements of collaborative thermal infrared, ground factors, meteorological environment variables and microwave remote sensing data (Duan et al., 2017). Whether these methods can be applied to the subsequent spatial downscaling of precipitation products will also be a key issue to be discussed and solved in future studies.
5 Conclusion
This paper used improved GWR and MGWR models with Kriging interpolation, and statistical relationships between satellite products (GPM and MSWEP) and environmental factors to generate high-resolution (1 km×1 km) grid precipitation data. The spatial-temporal characteristics of drought in the Tianshan Mountains during 1979–2020 were analyzed using the downscaling results. Overall findings of the current study are:
(1) Based on GVT, DEM, DEM, SLOPE, and ASPECT were respectively screened as fixed variables in the downscaling process of GPM and MSWEP, while WIN, RHU, SSD and TEM were variable variables.
(2) Taking the original data of satellite products as reference, the downscaling results of MGWR model based on the Bi-square weight function had higher correlation and smaller residuals with the measured values.
(3) The downscaling results of MGWR on MSWEP showed the best performance in different time scales (CC>0.8, |BIAS|≤0.48), and showed a richer and clearer spatial texture of topographic precipitation.
(4) The Tianshan Mountains had a wet trend in recent 40 years. The West Tianshan Mountains had the characteristics of low frequency, long time and high severity of drought events, while the East showed high frequency, short time and low severity. Occasional short-term high-severity drought events occur in North and South. A total of 16 severe drought events were identified.
Data availability statement
The raw data supporting the conclusion of this article will be made available by the authors, without undue reservation.
Author contributions
Conceptualization, XqL, XlL, YD, and JY; data curation, XH and GY; formal analysis, XqL, YD and HT; funding acquisition, XH and GY; investigation, XqL, YD, and JY; methodology, XqL, XlL, and HT; project administration, XH; resources, XH and XlL; software, XqL, YD, HT, and JY; supervision, XH, XlL, and GY; validation, XqL; Visualization, XqL and YD; Writing–original draft, XqL; Writing–review and editing, XH, XlL and GY All authors have read and agreed to the published version of the manuscript.
Funding
This research was funded by the third comprehensive scientific investigation project in Xinjiang (Grant Nos. SQ2021xjkk02704), Xinjiang Production and Construction Corps scientific and technological break-through project (Grant Nos. 2021AB021), International cooperation and exchange project of Xinjiang production and Construction Corps (Grant Nos. 2022BC001) and the National Natural Science Foundation of China (Grant Nos. U1803244, 51969027, 52269006).
Acknowledgments
The authors are very grateful to all reviewers, chief editors and associate editors for their valuable comments and suggestions, which not only greatly improved the quality of this paper but also have immense value for our future research.
Conflict of interest
The authors declare that the research was conducted in the absence of any commercial or financial relationships that could be construed as a potential conflict of interest.
Publisher’s note
All claims expressed in this article are solely those of the authors and do not necessarily represent those of their affiliated organizations, or those of the publisher, the editors and the reviewers. Any product that may be evaluated in this article, or claim that may be made by its manufacturer, is not guaranteed or endorsed by the publisher.
Supplementary material
The Supplementary Material for this article can be found online at: https://www.frontiersin.org/articles/10.3389/feart.2023.1128990/full#supplementary-material
References
Abdollahipour, A., Ahmadi, H., and Aminnejad, B. (2021). Evaluating the reconstruction method of satellite-based monthly precipitation over Golestan province, Northern Iran. Acta Geophys. 69 (6), 2305–2323. doi:10.1007/s11600-021-00623-4
Adarsh, S., and Janga Reddy, M. (2019). Evaluation of trends and predictability of short-term droughts in three meteorological subdivisions of India using multivariate EMD-based hybrid modelling. Hydrol. Process. 33 (1), 130–143. doi:10.1002/hyp.13316
Alijanian, M., Rakhshandehroo, G. R., Dehghani, M., and Mishra, A. (2022). Probabilistic drought forecasting using copula and satellite rainfall based PERSIANN-CDR and MSWEP datasets. Int. J. Climatol. 42, 6441–6458. doi:10.1002/joc.7600
Alijanian, M., Rakhshandehroo, G. R., Mishra, A. K., and Dehghani, M. (2017). Evaluation of satellite rainfall climatology using CMORPH, PERSIANN-CDR, PERSIANN, TRMM, MSWEP over Iran. Int. J. Climatol. 37 (14), 4896–4914. doi:10.1002/joc.5131
Anjum, M. N., Ahmad, I., Ding, Y., Shangguan, D., Zaman, M., Ijaz, M. W., et al. (2019). Assessment of IMERG-V06 precipitation product over different hydro-climatic regimes in the Tianshan Mountains, North-Western China. Remote Sens. 11 (19), 2314. doi:10.3390/rs11192314
Awada, H., Ciraolo, G., Maltese, A., Provenzano, G., Hidalgo, M. A. M., and Còrcoles, J. I. (2019). Assessing the performance of a large-scale irrigation system by estimations of actual evapotranspiration obtained by Landsat satellite images resampled with cubic convolution. Int. J. Appl. Earth Observation Geoinformation 75, 96–105. doi:10.1016/j.jag.2018.10.016
Beck, H. E., Wood, E. F., Pan, M., Fisher, C. K., Miralles, D. G., Van Dijk, A. I., et al. (2019). MSWEP V2 global 3-hourly 0.1 precipitation: Methodology and quantitative assessment. Bull. Am. Meteorological Soc. 100 (3), 473–500. doi:10.1175/bams-d-17-0138.1
Bhutiyani, M. R., Kale, V. S., and Pawar, N. J. I. (2010). Climate change and the precipitation variations in the northwestern himalaya: 1866-2006. Int. J. Climatol. 30 (4), 535–548. doi:10.1002/joc.1920
Brunsdon, C., Fotheringham, A. S., and Charlton, M. (1998). Spatial nonstationarity and autoregressive models. Environ. Plan. A 30 (6), 957–973. doi:10.1068/a300957
Cai, P., Hamdi, R., Luo, G., He, H., Zhang, M., Termonia, P., et al. (2019). Agriculture intensification increases summer precipitation in Tianshan Mountains, China. Atmos. Res. 227, 140–146. doi:10.1016/j.atmosres.2019.05.005
Campozano, L., Tenelanda, D., Sanchez, E., Samaniego, E., and Feyen, J. J. A. I. M. (2016). Comparison of statistical downscaling methods for monthly total precipitation: Case study for the paute river basin in southern Ecuador. Adv. Meteorology 2016, 6526341. doi:10.1155/2016/6526341
Chang, C. T., Wang, H. C., and Huang, C. Y. (2018). Assessment of MODIS-derived indices (2001–2013) to drought across Taiwan’s forests. Int. J. biometeorology 62 (5), 809–822. doi:10.1007/s00484-017-1482-2
Chao, L., Zhang, K., Li, Z., Zhu, Y., Wang, J., and Yu, Z. (2018). Geographically weighted regression based methods for merging satellite and gauge precipitation. J. Hydrology 558, 275–289. doi:10.1016/j.jhydrol.2018.01.042
Chen, C., Chen, Q., Duan, Z., Zhang, J., Mo, K., Li, Z., et al. (2018). Multiscale comparative evaluation of the GPM IMERG v5 and TRMM 3B42 v7 precipitation products from 2015 to 2017 over a climate transition area of China. Remote Sens. 10 (6), 944. doi:10.3390/rs10060944
Chen, C., Hu, B., Li, Y. J. H., and Sciences, E. S. (2021). Easy-to-use spatial random-forest-based downscaling-calibration method for producing precipitation data with high resolution and high accuracy. Hydrol. Earth Syst. Sci. 25 (11), 5667–5682. doi:10.5194/hess-25-5667-2021
Chen, F., Gao, Y., Wang, Y., Qin, F., and Li, X. (2019). Downscaling satellite-derived daily precipitation products with an integrated framework. Int. J. Climatol. 39 (3), 1287–1304. doi:10.1002/joc.5879
Chen, F., Liu, Y., Liu, Q., and Li, X. (2014). Spatial downscaling of TRMM 3B43 precipitation considering spatial heterogeneity. Int. J. Remote Sens. 35 (9), 3074–3093. doi:10.1080/01431161.2014.902550
Chen, H., Chen, Y., Li, D., Li, W., and Yang, Y. (2022). Identifying water vapor sources of precipitation in forest and grassland in the north slope of the Tianshan Mountains, Central Asia. J. Arid Land 14 (3), 297–309. doi:10.1007/s40333-022-0090-0
Chen, S., Xiong, L., Ma, Q., Kim, J. S., Chen, J., and Xu, C. Y. (2020). Improving daily spatial precipitation estimates by merging gauge observation with multiple satellite-based precipitation products based on the geographically weighted ridge regression method. J. Hydrol. X. 589, 125156. doi:10.1016/j.jhydrol.2020.125156
Chen, Y., Li, W., Deng, H., Fang, G., and Li, Z. (2016). Changes in central asia’s water tower: Past, present and future. Sci. Rep. 6 (1), 35458–35512. doi:10.1038/srep35458
Chen, Y., Li, Z., Fan, Y., Wang, H., and Deng, H. (2015). Progress and prospects of climate change impacts on hydrology in the arid region of northwest China. Environ. Res. 139, 11–19. doi:10.1016/j.envres.2014.12.029
Chu, H. J. (2012). Assessing the relationships between elevation and extreme precipitation with various durations in southern Taiwan using spatial regression models. Hydrol. Process. 26 (21), 3174–3181. doi:10.1002/hyp.8403
Chung, C. T., Power, S. B., Arblaster, J. M., Rashid, H. A., and Roff, G. L. (2014). Nonlinear precipitation response to El Niño and global warming in the Indo-Pacific. Clim. Dyn. 42 (7), 1837–1856. doi:10.1007/s00382-013-1892-8
Duan, S. B., Li, Z. L., and Leng, P. (2017). A framework for the retrieval of all-weather land surface temperature at a high spatial resolution from polar-orbiting thermal infrared and passive microwave data. Remote Sens. Environ. 195, 107–117. doi:10.1016/j.rse.2017.04.008
Duan, S. B., and Li, Z. L. (2016). Spatial downscaling of MODIS land surface temperatures using geographically weighted regression: Case study in northern China. IEEE Trans. Geoscience Remote Sens. 54 (11), 6458–6469. doi:10.1109/tgrs.2016.2585198
Fan, M., Xu, J., Li, D., and Chen, Y. (2022). Response of precipitation in tianshan to global climate change based on the berkeley Earth and ERA5 reanalysis products. Remote Sens. 14 (3), 519. doi:10.3390/rs14030519
Fotheringham, A. S., Yang, W., and Kang, W. (2017). Multiscale geographically weighted regression (MGWR). Ann. Am. Assoc. Geogr. 107 (6), 1247–1265. doi:10.1080/24694452.2017.1352480
Frei, C., and Schär, C. J. (1998). A precipitation climatology of the Alps from high-resolution rain-gauge observations. Int. J. Climatol. 18 (8), 873–900. doi:10.1002/(sici)1097-0088(19980630)18:8<873:aid-joc255>3.0.co;2-9
Fu, S., Xing, Z., Ji, Y., Zhao, Y., Sun, M., Li, H., et al. (2020). Improved flood simulation accuracy by downscaling remotely sensed precipitation data in the Qixing Wetland Watershed. Ecol. Eng. 158, 106038. doi:10.1016/j.ecoleng.2020.106038
Golian, S., Javadian, M., and Behrangi, A. (2019). On the use of satellite, gauge, and reanalysis precipitation products for drought studies. Environ. Res. Lett. 14 (7), 075005. doi:10.1088/1748-9326/ab2203
Guo, H., Li, M., Nzabarinda, V., Bao, A., Meng, X., Zhu, L., et al. (2022). Assessment of three long-term satellite-based precipitation estimates against ground observations for drought characterization in northwestern China. Remote Sens. 14 (4), 828. doi:10.3390/rs14040828
Hou, A. Y., Kakar, R. K., Neeck, S., Azarbarzin, A. A., Kummerow, C. D., Kojima, M., et al. (2014). The global precipitation measurement mission. Bull. Am. meteorological Soc. 95 (5), 701–722. doi:10.1175/bams-d-13-00164.1
Hu, Z., Hu, Q., Zhang, C., Chen, X., and Li, Q. (2016). Evaluation of reanalysis, spatially interpolated and satellite remotely sensed precipitation data sets in central Asia. J. Geophys. Res. Atmos. 121 (10), 5648–5663. doi:10.1002/2016jd024781
Huang, S., Chang, J., Leng, G., and Huang, Q. (2015). Integrated index for drought assessment based on variable fuzzy set theory: A case study in the yellow river basin, China. J. Hydrology 527, 608–618. doi:10.1016/j.jhydrol.2015.05.032
Jing, W., Yang, Y., Yue, X., and Zhao, X. J. R. S. (2016). A spatial downscaling algorithm for satellite-based precipitation over the Tibetan plateau based on NDVI, DEM, and land surface temperature. Remote Sens. (Basel). 8 (8), 655. doi:10.3390/rs8080655
Kumar, B., Lakshmi, V., and Patra, K. C. (2017). Evaluating the uncertainties in the SWAT model outputs due to DEM grid size and resampling techniques in a large Himalayan river basin. J. Hydrologic Eng. 22 (9), 04017039. doi:10.1061/(asce)he.1943-5584.0001569
Kumari, M., Singh, C. K., Bakimchandra, O., and Basistha, A. (2017). Geographically weighted regression based quantification of rainfall–topography relationship and rainfall gradient in Central Himalayas. Int. J. Climatol. 37 (3), 1299–1309. doi:10.1002/joc.4777
Lakew, H. B. (2020). Investigating the effectiveness of bias correction and merging MSWEP with gauged rainfall for the hydrological simulation of the upper Blue Nile basin. J. Hydrology Regional Stud. 32, 100741. doi:10.1016/j.ejrh.2020.100741
Li, Y., Feng, A., Liu, W., Ma, X., and Dong, G. (2017). Variation of aridity index and the role of climate variables in the Southwest China. Water 9 (10), 743. doi:10.3390/w9100743
Li, Y., Pang, B., Ren, M., Shi, S., Peng, D., Zhu, Z., et al. (2022). Evaluation of performance of three satellite-derived precipitation products in capturing extreme precipitation events over beijing, China. China 14 (11), 2698. doi:10.3390/rs14112698
Li, Z., and Fotheringham, A. S. (2020). Computational improvements to multi-scale geographically weighted regression. Int. J. Geogr. Inf. Sci. 34 (7), 1378–1397. doi:10.1080/13658816.2020.1720692
Li, Z., Hao, Z., Shi, X., Déry, S. J., Li, J., Chen, S., et al. (2016). An agricultural drought index to incorporate the irrigation process and reservoir operations: A case study in the tarim river basin. Glob. Planet. Change 143, 10–20. doi:10.1016/j.gloplacha.2016.05.008
Liang-Liang, L., Jian, L., and Ru-Cong, Y. (2022). Evaluation of CMIP6 HighResMIP models in simulating precipitation over central Asia. Adv. Clim. Change Res. 13 (1), 1–13. doi:10.1016/j.accre.2021.09.009
Liu, J., Shangguan, D., Liu, S., Ding, Y., Wang, S., and Wang, X. (2019). Evaluation and comparison of CHIRPS and MSWEP daily-precipitation products in the Qinghai-Tibet Plateau during the period of 1981–2015. Atmos. Res. 230, 104634. doi:10.1016/j.atmosres.2019.104634
Lu, B., Hu, Y., Murakami, D., Brunsdon, C., Comber, A., Charlton, M., et al. (2022). High-performance solutions of geographically weighted regression in R. Geo-spatial Inf. Sci. 25, 536–549. doi:10.1080/10095020.2022.2064244
Lu, X., Tang, G., Wang, X., Liu, Y., Wei, M., and Zhang, Y. J. R. S. (2020). The development of a two-step merging and downscaling method for satellite precipitation products. Remote Sens. (Basel). 12 (3), 398. doi:10.3390/rs12030398
Mahmood, R., Shuanglin, L., and Babar, K. (2010). Causes of recurring drought patterns in Xinjiang, China. J. Arid Land 2 (4), 279–285.
McKee, T. B., Doesken, N. J., and Kleist, J. (1993). “The relationship of drought frequency and duration to time scales,” in Proceedings of the 8th conference on applied climatology (Boston, MA, USA: Department of Atmospheric Science), 179–183.
Mei, C. L., Wang, N., and Zhang, W. X. (2006). Testing the importance of the explanatory variables in a mixed geographically weighted regression model. Environ. Plan. A 38 (3), 587–598. doi:10.1068/a3768
Mendes, D., Marengo, J. A. J. T., and Climatology, A. (2010). Temporal downscaling: A comparison between artificial neural network and autocorrelation techniques over the amazon basin in present and future climate change scenarios. Theor. Appl. Climatol. 100 (3), 413–421. doi:10.1007/s00704-009-0193-y
Nashwan, M. S., Shahid, S., and Wang, X. (2019). Assessment of satellite-based precipitation measurement products over the hot desert climate of Egypt. Remote Sens. 11 (5), 555. doi:10.3390/rs11050555
Nwachukwu, P. N., Satge, F., Yacoubi, S. E., Pinel, S., and Bonnet, M. P. (2020). From TRMM to GPM: How reliable are satellite-based precipitation data across Nigeria? Remote Sens. 12 (23), 3964. doi:10.3390/rs12233964
Oshan, T. M., Li, Z., Kang, W., Wolf, L. J., and Fotheringham, A. S. (2019). mgwr: A Python implementation of multiscale geographically weighted regression for investigating process spatial heterogeneity and scale. ISPRS Int. J. Geo-Information 8 (6), 269. doi:10.3390/ijgi8060269
Qi, S., Lv, A. J. E. S., and Research, P. (2022). Applicability analysis of multiple precipitation products in the Qaidam Basin, Northwestern China. Northwest. China 29 (9), 12557–12573. doi:10.1007/s11356-021-13291-0
Qin, Y., Chen, Z., Shen, Y., Zhang, S., and Shi, R. (2014). Evaluation of satellite rainfall estimates over the Chinese Mainland. Remote Sens. 6 (11), 11649–11672. doi:10.3390/rs61111649
Sakai, A., Fujita, K., Narama, C., Kubota, J., Nakawo, M., and Yao, T. (2010). Reconstructions of annual discharge and equilibrium line altitude of glaciers at Qilian Shan, northwest China, from 1978 to 2002. Hydrol. Process. 24 (19), 2798–2806. doi:10.1002/hyp.7700
Seo, Y., Kim, S., and Singh, V. P. (2015). Estimating spatial precipitation using regression kriging and artificial neural network residual kriging (RKNNRK) hybrid approach. Water Resour. Manag. 29, 2189–2204. doi:10.1007/s11269-015-0935-9
Sharifi, E., Saghafian, B., and Steinacker, R. J. J. O. G. R. A. (2019). Downscaling satellite precipitation estimates with multiple linear regression, artificial neural networks, and spline interpolation techniques. spline Interpolat. Tech. 124 (2), 789–805. doi:10.1029/2018jd028795
Sun, G., Wei, Y., Wang, G., Shi, R., Chen, H., and Mo, C. (2022). Downscaling correction and hydrological applicability of the three latest high-resolution satellite precipitation products (GPM, GSMAP, and MSWEP) in the pingtang catchment, China. Adv. Meteorology 2022, 1–23. doi:10.1155/2022/6507109
Tan, M. L., Chua, V. P., Tan, K. C., and Brindha, K. (2018). Evaluation of TMPA 3B43 and NCEP-CFSR precipitation products in drought monitoring over Singapore. Int. J. remote Sens. 39 (8), 2089–2104. doi:10.1080/01431161.2018.1425566
Tang, G., Ma, Y., Long, D., Zhong, L., and Hong, Y. (2016). Evaluation of GPM Day-1 IMERG and TMPA Version-7 legacy products over Mainland China at multiple spatiotemporal scales. J. hydrology 533, 152–167. doi:10.1016/j.jhydrol.2015.12.008
Wang, C., Tang, G., Han, Z., Guo, X., and Hong, Y. J. J. (2018). Global intercomparison and regional evaluation of GPM IMERG Version-03, Version-04 and its latest Version-05 precipitation products: Similarity, difference and improvements. Similarity, Differ. Improv. 564, 342–356. doi:10.1016/j.jhydrol.2018.06.064
Wang, L., Chen, R., Han, C., Yang, Y., Liu, J., Liu, Z., et al. (2019). An improved spatial–temporal downscaling method for TRMM precipitation datasets in alpine regions: A case study in northwestern China’s qilian mountains. Remote Sens. 11 (7), 870. doi:10.3390/rs11070870
Wang, X., Jiang, D., and Lang, X. (2017). Future extreme climate changes linked to global warming intensity. Sci. Bull. 62 (24), 1673–1680. doi:10.1016/j.scib.2017.11.004
Water Xinjiang Communique (2009). Xinjiang Water Resources Bulletin (2002-2009) [EB/OL]. Available at: http:/slt.Xinjiang.gov.cn/slt/slnb/list_ej.shtml
Wei, L., Jiang, S., Ren, L., Wang, M., Zhang, L., Liu, Y., et al. (2021). Evaluation of seventeen satellite-reanalysis-and gauge-based precipitation products for drought monitoring across mainland China. Atmos. Res. 263, 105813. doi:10.1016/j.atmosres.2021.105813
Wei, W., Zhang, X., Liu, C., Xie, B., Zhou, J., and Zhang, H. (2022). A new drought index and its application based on geographically weighted regression (GWR) model and multi-source remote sensing data. Environ. Sci. Pollut. Res. 30, 17865–17887. doi:10.1007/s11356-022-23200-8
Wen, X., Wu, X., and Gao, M. (2017). Spatiotemporal variability of temperature and precipitation in gansu province (northwest China) during 1951–2015. Atmos. Res. 197, 132–149. doi:10.1016/j.atmosres.2017.07.001
Xu, M., Kang, S., Wu, H., and Yuan, X. (2018). Detection of spatio-temporal variability of air temperature and precipitation based on long-term meteorological station observations over Tianshan Mountains, Central Asia. Atmos. Res. 203, 141–163. doi:10.1016/j.atmosres.2017.12.007
Xu, S., Wu, C., Wang, L., Gonsamo, A., Shen, Y., and Niu, Z. J. R. (2015). A new satellite-based monthly precipitation downscaling algorithm with non-stationary relationship between precipitation and land surface characteristics. Remote Sens. Environ. 162, 119–140. doi:10.1016/j.rse.2015.02.024
Xu, X., Kleidon, A., Miller, L., Wang, S., Wang, L., and Dong, G. (2010). Late quaternary glaciation in the tianshan and implications for palaeoclimatic change: A review. Boreas 39 (2), 215–232. doi:10.1111/j.1502-3885.2009.00118.x
Yang, G., Sun, N., and Jin, L. (2015). Division of arid regions in China. Beijing: China Water and Power Press, 92–148.
Yan, G., Liu, Y., and Chen, X. J. I. J. o. R. S. (2018). Evaluating satellite-based precipitation products in monitoring drought events in southwest China. Int. J. Remote Sens. 39 (10), 3186–3214. doi:10.1080/01431161.2018.1433892
Yao, J., Zhao, Y., Chen, Y., Yu, X., and Zhang, R. (2018a). Multi-scale assessments of droughts: A case study in Xinjiang, China. Sci. Total Environ. 630, 444–452. doi:10.1016/j.scitotenv.2018.02.200
Yao, J., Zhao, Y., and Yu, X. (2018b). Spatial-temporal variation and impacts of drought in Xinjiang (Northwest China) during 1961–2015. PeerJ 6, e4926. doi:10.7717/peerj.4926
Yevjevich, V. M. (1967). Objective approach to definitions and investigations of continental hydrologic droughts. Colorado State University.
Yu, L., Leng, G., and Python, A. (2022). A comprehensive validation for GPM IMERG precipitation products to detect extremes and drought over mainland China. Weather Clim. Extrem. 36, 100458. doi:10.1016/j.wace.2022.100458
Yu, Y., Chen, X., Malik, I., Wistuba, M., Cao, Y., Hou, D., et al. (2021). Spatiotemporal changes in water, land use, and ecosystem services in Central Asia considering climate changes and human activities. J. Arid Land 13 (9), 881–890. doi:10.1007/s40333-021-0084-3
Yue, T., Zhao, N., Fan, Z., Li, J., Chen, C., Lu, Y., et al. (2016). CMIP5 downscaling and its uncertainty in China. Glob. Planet. Change 146, 30–37. doi:10.1016/j.gloplacha.2016.09.003
Yue, X., Liu, G., Chen, J., and Zhou, C. (2020). Synergistic regulation of the interdecadal variability in summer precipitation over the Tianshan mountains by sea surface temperature anomalies in the high-latitude Northwest Atlantic Ocean and the Mediterranean Sea. Atmos. Res. 233, 104717. doi:10.1016/j.atmosres.2019.104717
Zhang, C., Chen, X., Shao, H., Chen, S., Liu, T., Chen, C., et al. (2018a). Evaluation and intercomparison of high-resolution satellite precipitation estimates—GPM, TRMM, and CMORPH in the Tianshan Mountain area. Remote Sens. 10 (10), 1543. doi:10.3390/rs10101543
Zhang, F., Bai, L., Li, L., and Wang, Q. (2016). Sensitivity of runoff to climatic variability in the northern and southern slopes of the Middle Tianshan Mountains, China. J. Arid Land 8 (5), 681–693. doi:10.1007/s40333-016-0015-x
Zhang, Q., Shen, Z., Xu, C. Y., Sun, P., Hu, P., and He, C. (2019). A new statistical downscaling approach for global evaluation of the CMIP5 precipitation outputs: Model development and application. Sci. Total Environ. 690, 1048–1067. doi:10.1016/j.scitotenv.2019.06.310
Zhang, Q., Singh, V. P., Li, J., Jiang, F., and Bai, Y. (2012). Spatio-temporal variations of precipitation extremes in Xinjiang, China. J. Hydrology 434, 7–18. doi:10.1016/j.jhydrol.2012.02.038
Zhang, Q., Sun, P., Li, J., Singh, V. P., and Liu, J. (2015). Spatiotemporal properties of droughts and related impacts on agriculture in Xinjiang, China. Int. J. Climatol. 35 (7), 1254–1266. doi:10.1002/joc.4052
Zhang, T., Li, B., Yuan, Y., Gao, X., Sun, Q., Xu, L., et al. (2018b). Spatial downscaling of TRMM precipitation data considering the impacts of macro-geographical factors and local elevation in the Three-River Headwaters Region. Remote Sens. Environ. 215, 109–127. doi:10.1016/j.rse.2018.06.004
Zhang, X., and Yan, X. J. C. D. (2015). A new statistical precipitation downscaling method with bayesian model averaging: A case study in China. Clim. Dyn. 45 (9), 2541–2555. doi:10.1007/s00382-015-2491-7
Zhang, Y., Li, Y., Ji, X., Luo, X., and Li, X. (2018c). Fine-resolution precipitation mapping in a mountainous watershed: Geostatistical downscaling of TRMM products based on environmental variables. Remote Sens. 10 (1), 119. doi:10.3390/rs10010119
Zhang, Z., Yu, D., Shi, X., Warner, E., Ren, H., Sun, W., et al. (2010). Application of categorical information in the spatial prediction of soil organic carbon in the red soil area of China. Soil Sci. Plant Nutr. 56 (2), 307–318. doi:10.1111/j.1747-0765.2010.00457.x
Zhao, N., Yue, T., Chen, C., Zhao, M., and Fan, Z. J. I. J. O. C. (2018). An improved statistical downscaling scheme of Tropical Rainfall Measuring Mission precipitation in the Heihe River basin, China. China 38 (8), 3309–3322. doi:10.1002/joc.5502
Zhao, W., and Duan, S. B. (2020). Reconstruction of daytime land surface temperatures under cloud-covered conditions using integrated MODIS/Terra land products and MSG geostationary satellite data. Remote Sens. Environ. 247, 111931. doi:10.1016/j.rse.2020.111931
Zhengyong, Z., Xinlin, H., Lin, L., Zhongqin, L., and Puyu, W. (2015). Spatial distribution of rainfall simulation and the cause analysis in China's Tianshan Mountains area. Adv. Water Sci. 26 (4), 500–508.
Zhou, X., Ni, G. H., Shen, C., Sun, T. J. H., and Sciences, E. S. (2017). Remapping annual precipitation in mountainous areas based on vegetation patterns: A case study in the nu river basin. Hydrol. Earth Syst. Sci. 21 (2), 999–1015. doi:10.5194/hess-21-999-2017
Keywords: remotely sensed data, multi-scale geographically weighted regression, precipitation data fusion, drought monitoring, Tianshan mountains
Citation: Li X, He X, Li X, Du Y, Yang G, Tian H and Yu J (2023) Construction of high-resolution precipitation dataset and its implication to drought over the Tianshan Mountains, China. Front. Earth Sci. 11:1128990. doi: 10.3389/feart.2023.1128990
Received: 21 December 2022; Accepted: 20 February 2023;
Published: 01 March 2023.
Edited by:
Zhenliang Yin, Northwest Institute of Eco-Environment and Resources (CAS), ChinaReviewed by:
Xu Min, Northwest Institute of Eco-Environment and Resources (CAS), ChinaWeihua Wang, Xinjiang Institute of Ecology and Geography (CAS), China
Copyright © 2023 Li, He, Li, Du, Yang, Tian and Yu. This is an open-access article distributed under the terms of the Creative Commons Attribution License (CC BY). The use, distribution or reproduction in other forums is permitted, provided the original author(s) and the copyright owner(s) are credited and that the original publication in this journal is cited, in accordance with accepted academic practice. No use, distribution or reproduction is permitted which does not comply with these terms.
*Correspondence: Xinlin He, aGV4aW5saW4yMDAyQDE2My5jb20=; Xiaolong Li, MTMxNTA0MDE4MTZAMTYzLmNvbQ==