 Bhumi Raj Budhathoki
 Tirtha Raj Adhikari
 Suraj Shrestha
 Ram Prasad Awasthi
- 1Central Department of Hydrology and Meteorology, Tribhuvan University, Kathmandu, Nepal
- 2Kathmandu Center for Research and Education, Chinese Academy of Sciences, Tribhuvan University, Kathmandu, Nepal
- 3Institute of Fundamental Research and Studies, Kathmandu, Nepal
- 4Department of Hydrology and Meteorology, Government of Nepal, Kathmandu, Nepal
Hydrological models are widely used and often regarded as reliable tools for accurately estimating various components of the water balance. In a remote Himalayan catchment, such as Tamakoshi basin, where limited hydrometric dataset is available, such models often provide essential insights that are crucial to water researchers and planners. In this regard, we employed the semi-distributed HBV-light (version 4.0.0.25) hydrological model for glacierized Tamakoshi river basin and attempted to quantify various water balance components. For our model tests, using the daily streamflow records, we selected two distinct periods, i.e., 2004–2008 as a calibration period whilst 2011–2012 for model validation. Based on our findings, the model was able to reasonably predict the streamflow (validation efficiency: Nash-Sutcliffe Efficiency of 0.82 and percent bias −21%). At our site, HBV-light model predicted that the change in streamflow was mostly governed by monsoonal rain (62%) followed by baseflow (20%), glacier melt (13%) and snowmelt (5%). As expected, the streamflow peaked during the month of August where monsoon-induced rain and melting of glaciers significantly contributed to river flow. As a result, monsoon period showcased largest fluctuation in water storage while negligible change was observed during post-monsoon season. Nonetheless, our findings revealed that the baseflow contribution to streamflow was maximum during the month of October and lowest during February. Our findings indicated that the water balance of the Tamakoshi basin is largely influenced by monsoonal rain during June–September window as well as baseflow and glacier melt during the dry season. Runoff components contribution to streamflow was increasing but water storage changes was decreasing in recent decade (2011–2020). We believe our findings are crucial for future initiatives involving water resources, water-induced disaster management, and studies of climate change may benefit from the findings of this study, especially in a region with limited hydrometric data availability.
1 Introduction
Water balance and streamflow depend on the different runoff components of the hydrological cycle and their various forms. Streamflow consists mainly of two parts: surface flow and sub-surface flow, where surface flow consists of direct runoff from rain and snow-glacier melt and sub-surface flow is the infiltration of water from the soil to sub-soil. Firstly, Thornthwaite and Mather (1955) introduced water balance models with revisions. The water balance and hydrological regimes are affected by the changing climate. Due to the changing climate, the water availability downstream is changing continuously, in the past and the future (Bajracharya et al., 2018). Climate change and rising temperatures have an impact on snow and glacier areas, influencing future water availability downstream. Snow and glacier areas that significantly melt contribute to streamflow in snow and glacier-fed river basin systems (Khadka et al., 2014). The changing climate influences the hydrological processes that impact river flow regimes and freshwater availability in catchment-scale hydrology in the Himalayan River basin (Adhikari et al., 2022).
After the 1960s, hydrological modeling systems were launched to simulate hydrological processes. Several hydrological models have been developed in recent years such as HBV model (Bergström, 1976; Bergstrom, 1992), SWAT model (Arnold et al., 1998), JAMS J2000 model (Krause, 2002), SPHY model (Terink et al., 2015), GDM model (Kayastha et al., 2020), etc to estimate water balance and components through model parameterization. The hydrological models simulate the streamflow components, such as the glacier-snow melt and cover, evaporation, precipitation and baseflow over the basin. The classification of streamflow components by different methods includes empirical or statistical methods and hydrological modeling; hydrological modeling is a robust approach to the separation of streamflow components (Wu et al., 2021). Different hydrological processes such as baseflow, snow-glacier runoff, and rain runoff are contained in the streamflow components and contribute to river flow (Khanal et al., 2021). Runoff and its components are responsible for streamflow and the fluctuations in runoff from year to year regulate streamflow (Adnan et al., 2022). Depending on the availability of datasets, snow and glacier melting in Himalayan areas are conceptualized in simple or complex ways (Hock, 2003). The change in glacier melt runoff significantly affects the water availability in the Himalayan River basin (Singh et al., 2021). Snow melt, discharge, evaporation and snowfall are sensitive to climate change in the Himalayan River basin, causing an effect on hydrological regimes (Nepal, 2016). Hydrological phenomena vary in space and time from sub-basin to basin scale, as well as on daily, sub-daily, and decadal scales (Khanal et al., 2021). In recent decades, the Himalayan river basin has observed a rise in the frequency of extreme streamflow occurrences (Gaire et al., 2022). The hydrological extremes and water balance components are changing in different physiographic regions as well as from the river basin scale to the sub-basin scale (Budhathoki et al., 2021). Few researches have quantified the contribution of streamflow to the Himalayan river basin. In a number of these studies, the glacier model SPHY was used to simulate the contribution of streamflow to the HMA upstream rivers. The various streamflow components were included in the SPHY model (Khanal et al., 2021). To close the gaps left by earlier research in the Tamakoshi River Basin, the HBV model simulates the contribution of each component to streamflow.
The purpose of this study is to determine the availability of water in the Tamakoshi river basin’s hydrological cycle in various forms. However, changes in water storage, total water balance and streamflow contribution components are important to the estimation of water availability. Understanding streamflow processes is crucial for water resource projects. This study looks at how rain runoff, baseflow runoff, snowmelt runoff, and glacier melt runoff affect water balance. The components of streamflow contribution are changing as a result of changes in hydrological processes, which has an impact on changes in water storage. The water balance and its component’s contributions to runoff estimation and water availability for hydropower, irrigation, and drinking water planning, development, and management.
2 Study area
The Tamakoshi river is a trans-boundary Himalayan river basin and one of the main tributaries of the Koshi river basin system, located in eastern Nepal on the southern slope of the central Himalayas (Figure 1). The basin is geographically located on Nepal’s political border in the districts of Dolakha and Ramechhap. At the Busti gauging station, the basin covers 2,933.29 km2, of which 1,444.57 km2 is on Chinese territory. Tamakoshi river basin is located 27020’ N to 28020’ N and 85040’ E to 86040’ E with elevations ranging from 849 masl to 6,945 masl. The climate of this basin is subtropical at lower elevations and varies to tundra at higher elevations (Karki et al., 2016). This basin’s runoff and water balance are dominated by the monsoon rainfall.
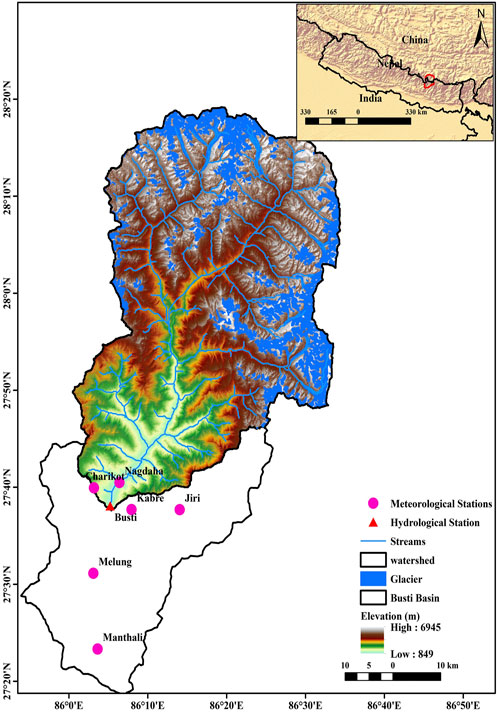
FIGURE 1. Study area (Tamakoshi river basin with black boundary) showing its topographical map along with its locations of streams with gauging stations, climate stations and glacier cover used in this study.
2.1 Hypsometric curve (elevation-area distribution)
Regions with and without glaciers need to simulate the area, elevation, and aspect. In the catchment setting, the basin area is divided into 13 elevation zones every 500 m. The height and air temperature both affect precipitation (rain or snow). In order to adjust for temperature and precipitation, PCALT should be set at 10%/100 m and TCALT at −0.65/100 m, respectively, as the elevation rises. The total area to Aspect wise East-west horizontal is 1,327.85 km2, North oriented area occupied 618.64 km2 and South oriented area occupied 901.62 km2 among them 253.59 km2 area covered by the glacier in Tamakoshi river basin. The curve in Figure 2 depicts the area elevation dispersion.
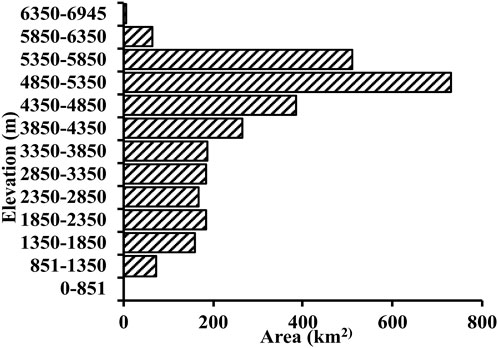
FIGURE 2. Hypsometric distribution of the area of the study basin.
3 Data and methods
3.1 Input data
For dynamic datasets, observations are precipitation, temperature, evapotranspiration and discharge from ground stations. These datasets are collected from the Department of Hydrology and Meteorology (DHM). The climatic datasets processing in this study using normal ratio method to fill in the rainfall data (Shrestha et al., 2019a; Shrestha et al., 2019b), evaporation data was calculated using Thornwaite method based on the mean monthly temperature and the lapse rate method is used to fill in the temperature data (Adhikari et al., 2022). The dynamic datasets are discharge and climatic stations used in this research in Table 1.
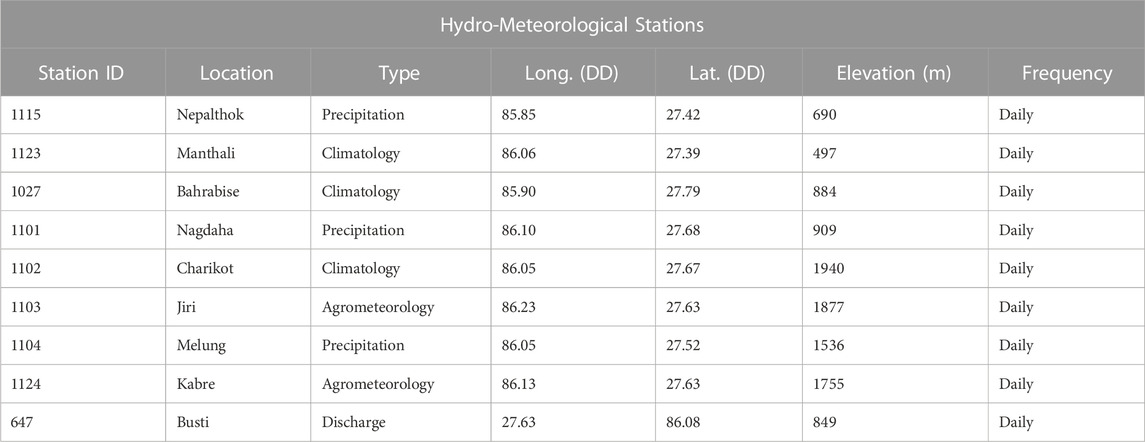
TABLE 1. List of hydro-meteorological stations used in the study.
HBV model requires mainly dynamic as well as static datasets. Static datasets are DEM and glacier data. The Digital Elevation Model (DEM) Shuttle Rader Topographic Mission (SRTM) Hydrosheds (http://hydrosheds.cr.usgs.gov/) data was used. The glaciers inventory datasets RGI 6.0 South Asia East is used (RGI 6.0 Consortium 2017).
3.2 HBV model
The Hydrologiska Byrns avdeling for Vattenbalans (HBV), HBV-light version 4.0.0.25 model is a conceptual approach since it incorporates some physical processes and basin structure. Utilizing temperature and precipitation data as inputs, the Precipitation-Runoff Model assesses stream flow and simulates streamflow (Vormoor et al., 2018). By combining evaluations of precipitation, climate, and land use, basin responses to water balance, flow regimes, climate change, flood peaks and volumes, the interaction between soil and water, and sediment yields are assessed (Adhikari et al., 2022). According to Siebert et al. (2012), the HBV light version features a routine for precipitation in snow, soil moisture, reaction, and routing that includes lakes and glaciers (Siebert., 2005). HBV model continuously simulates discharge at glacierized and non-glacierized zone elevation-wise at the desired site within the basin area.
3.3 Streamflow components
HBV model simulates the streamflow contribution parameters in Tamakoshi river basin. The streamflow contribution of the Tamakoshi river basin is primarily made up of four components: baseflow runoff, glacier melt runoff, snowmelt runoff, and rain runoff. The snow formation process depends on critical temperature. The melt contribution by snow and glacier depends upon degree day factor. The streamflow contribution at hydrological station Busti simulated by HBV model is calculated using Eq. 1
where QTot is total contributed discharge, Qrr is discharge contributed by rain runoff, Qsm is discharge contributed by snowmelt runoff, Qgm is discharge contributed by glacier melt runoff and Qbf is discharge contributed by baseflow runoff.
3.4 Water balance storage
The water balance was evaluated by hydrological cycle components using HBV model. The water balance estimated at Busti gauging station is based on the principle of water mass conservation, i.e., entering and discharging of water (Milly, 1994). The water availability storage is changing spatially and temporally. The water balance is account for the change in water storage. Water balance components simulated by model are discharge (Qsim), observed discharge (Qobs), precipitation, actual evaporation and potential evaporation. The changing of water storage is calculated by using Eq. 2.
where ∆S changes in storage, P is Precipitation, Q is discharge and ET is actual evapotranspiration.
3.5 Calibration and validation
The hydrological model HBV light was set up at Tamakoshi river basin at Busti gauging station (ID 647). With the help of observed daily discharge records, the model was manually calibrated. Trial parametrization served as the basis for manual calibration. The model was calibrated from 2004 to 2008 and validated from 2011 to 2012 and was evaluated with Nash-Sutcliffe Efficiency (NSE) (Nash and Sutcliffe, 1970), Coefficient of Determination (R2), and Volume Difference (Pbias). Using Eq. 3, NSE can be determined which ranges from infinite ∞ to 1, where closer to 1 is perfect model efficiency. Coefficient of Determination (R2) is the fitting of the simulated discharge with the observed discharge as measured by Eq. 4. Higher values of R2, which range from 0 to 1, are optimal for fitting. The volume difference between observed and simulated discharge evaluated by Pbias is less than ±25 calculated using Eq. 5.
where Oi is measured observed discharge, Si is simulated discharge,
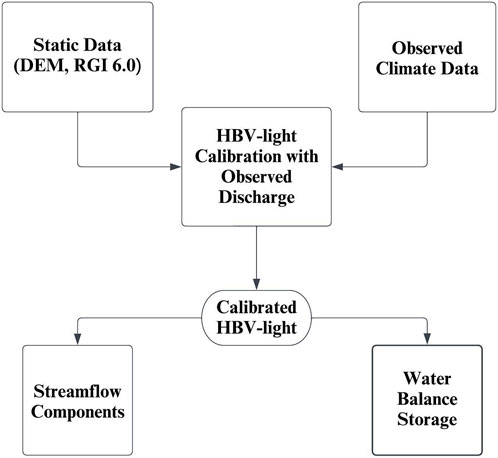
FIGURE 3. Flow chart of methodology.
4 Results
4.1 Performance of HBV light model
The HBV light model performed admirably and was successfully implemented in the Tamakoshi river basin. The model was calibrated and validated against observed discharge at the gauging station Busti in daily time step data using a manual approach based on the trial-and-error process (Figure 4). In this research, the only dynamic datasets used were solely observed station data, which was taken from DHM. The model was calibrated at Busti station (ID 647) in 2004–2008 and validated in 2011–2012. The model performance at Busti, the Nash-Sutcliffe Efficiency (NSE) is 0.77, Coefficient of Determination (R2) estimated simulated discharge is 0.77, and the simulated volume (Pbias) is slightly biased by −3%. Similarly, the model was validated with the same calibrated parameters and values (Table 2). The validated performance of the model NSE is 0.82 and R2 estimated simulated discharge is 0.87, and the simulating volume difference Pbias is −21%. The validated model performance period is better than the calibration period. The peak flow is overestimated due to the rating estimation by the Department of Hydrology and Meteorology (DHM) and cascading flooding in Himalayan catchments. The river discharge is not uniformly continuous and regular due to extreme events of precipitation and physical processes that block the river and stream at upstream sites. Landslides and debris flow have blocked the river and small streams, with the majority of landslides causing debris flow occurring in the summer. In recent years, most infrastructure has been built without regard for watershed and drainage management. DHM classified discharge as poor, fair, or good, but there is only fair discharge at Busti station (ID 647).
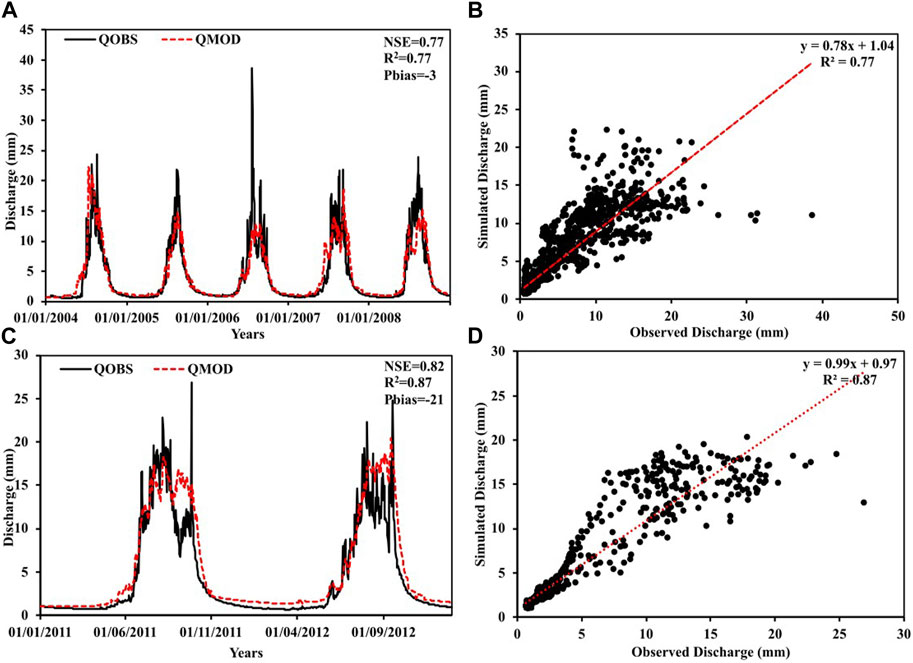
FIGURE 4. Daily observed (black) and HBV-light simulated (red) streamflow during the: calibration (2004–2008, (A) and validation (2011–2012, (C) for the Tamakoshi river basin. Scatter plots show the fit between the observed and simulated values for the calibration (B) and validation (D) periods.
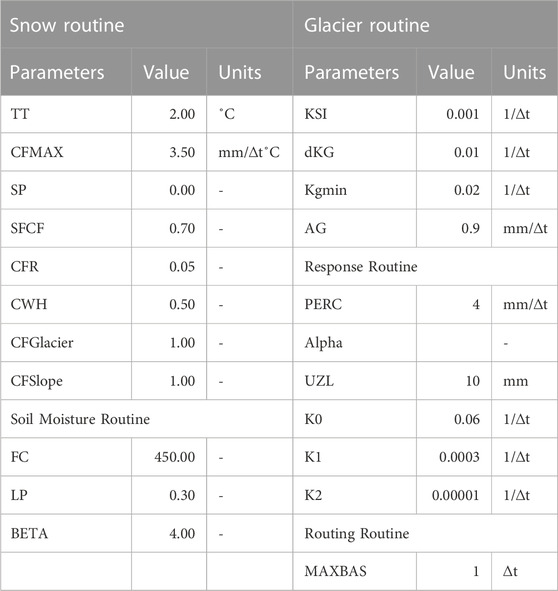
TABLE 2. Optimized Values of the different model parameters HBV-light during calibration.
4.2 Water balance components contribution to streamflow
In this study, the streamflow components are primarily classified as rain-snow precipitation, which is determined by the critical temperature, actual evapotranspiration, rain runoff, snowmelt runoff, and glacier melt runoff. The streamflow components and their contribution to the river flow at Busti Station are estimated for the 30 years 1991–2020. The streamflow components are rain, baseflow and snow-glacier melt that contribute to Busti discharge station in hydrological cyclic processes. These streamflow components influence river discharge at Busti hydrological station in terms of monthly, seasonal, and annual variations.
Figures 5A, B showed that the monthly average streamflow contribution from snow melt ranged from 0.88 mm to 27.78 mm, glacier melt contributions ranged from 2.75 mm to 58.05 mm, baseflow contributions ranged from 35.40 mm to 41.55 mm, and rain runoff contributions ranged from 5.09 mm to 476.41 mm. Depending on streamflow, the total discharge might range from 45.01 mm to 601.05 mm. The results also showed that the rain runoff in August, baseflow in October, snowmelt in July, and glacier melt in August were the monthly factors that had the greatest impact on streamflow. Snowmelt in February, baseflow in February, rain runoff in March and glacier melt in February all contributed to the lowest monthly streamflow. In terms of the total discharge, the highest streamflow occurred in August and the lowest discharge occurred in February. The analysis reveals that from June to October, rain runoff predominates, while from November to May, baseflow predominates in terms of total streamflow.
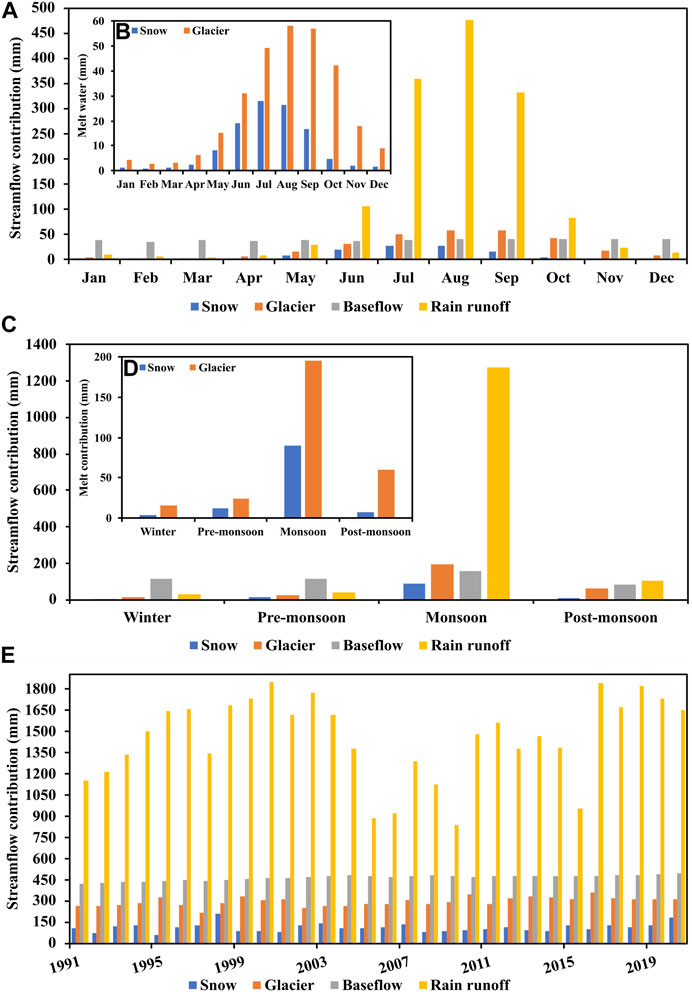
FIGURE 5. Monthly (A), seasonal (C) and annual (E) variations in simulated streamflow components where snow and glacier melt contribution are shown in monthly (B) and seasonal (D) variations.
Figures 5C, D showed that the seasonal streamflow contribution from snow melt ranged from 3.56 mm to 90.12 mm, glacier melt contributions ranged from 15.48 mm to 195.53 mm, baseflow contributions ranged from 81.23 mm to 156.02 mm, and rain runoff contributions ranged from 28.94 mm to 1,272.83 mm. Depending on streamflow, the total discharge might range from 161.66 mm to 1714.49 mm. The results showed that streamflow components contribution is generally maximum during the summer season (JJAS), with minimum streamflow varying according to contribution components in the winter (DJF) and pre-monsoon (MAM) seasons. Similarly, rain runoff contributes the most to total streamflow, while snowmelt contributes the least. Although baseflow contributed during the pre-monsoon season, streamflow contribution peaked during the monsoon season and then declined in winter. The seasonal maximum streamflow contribution in monsoon season 74% and minimum streamflow occurred in winter 7% but baseflow contributed in post-monsoon season (Supplementary Figure S1A).
Figure 5E showed that the snow melt contribution to the annual simulated streamflow varied from 62.88 mm to 211 mm; glacier melt contribution varied from 217.08 mm to 358.05 mm; baseflow varied from 424.26 mm to 494.28 mm, and rain runoff varied from 836.10 mm to 1845.51 mm. Annually, the contributions from the runoff component were as follows: the snowmelt contribution was highest in 1998 and lowest in 1995; the contribution from glacier melt to streamflow was highest in 2016 and lowest in 1997; the contribution from rain runoff was highest in 2000 and lowest in 2009, and the contribution from baseflow to streamflow was highest in 2020 and lowest in 1991. The total runoff contribution to streamflow at Busti was at its maximum in 2016 with a value of 2,777.11 mm and at its minimum in 2009 with a value of 1,690.17 mm. Among the water balance components relatively rain runoff contribution was maximum, i.e., 62%, then gradually baseflow 20%, glacier melt 13% and snowmelt 5% contribute to cumulative streamflow (Supplementary Figure S1B).
The decadal change shows the changes in different water components and variables over the past 3 decades (1991–2020). The Supplementary Table S2 includes the values of glacier melt, snowmelt, baseflow, rain runoff, and total discharge. Firstly, in the recent decade (2011–2020), the maximum contributions were observed from the runoff components, including snowmelt (116.63 mm), glacier melt (317.94 mm), baseflow (479.65 mm), and rain runoff (1,544.88 mm) and total discharge (2,459.11 mm). Secondly, the minimum contributions from the runoff components were snowmelt (107.53 mm), rain runoff (1,292.27 mm) and total discharge (2,161.38 mm), observed in the previous decade (2001–2010) of the past 3 decades. Similarly, the minimum values for glacier melt (282.80 mm), and baseflow (442.45 mm) were observed in the previous decade (1991–2000).
4.3 Water balance storage
The availability of water components in the hydrological cycle estimated by model simulation should be reasonable; however, there are some differences between observed and simulated discharge due to WMO standard meteorological network availability, real-time data, complex territory, data collection, and rating estimation. The change in water balance storage at Busti station is estimated to have occurred over a 30-year period from 1991 to 2020. The principle of mass conservation governs water balance storage: incoming water equals outgoing water, where incoming water is precipitation and outgoing water is discharge and evaporation of water bodies. Eq. 2 is used to compute the changing water storage in the Tamakoshi river basin at the Busti gauging station. The components of streamflow are precipitation, evaporation, total discharge from rain runoff, baseflow, snowmelt, and glacier melt runoff, which are responsible for water storage changes. The water storage varied temporally, as in annually, seasonally, monthly, and decadal.
Figure 6A showed that from April to August, the water balance storage was positive, but the subsequent month’s statistics revealed a decrease in the water balance storage. The incidence of precipitation led to a negative water balance storage. In the basin’s water balance, maximum water storage was reached in July at 253.49 mm, and minimum water storage was reached in October at −142.89 mm. From September to March, the monthly water balance storage contributed to streamflow supplemented by groundwater, where groundwater is recharged by falling precipitation and snow-glacier processes. Water is mostly stored from April to August, and less water is stored from September to December.
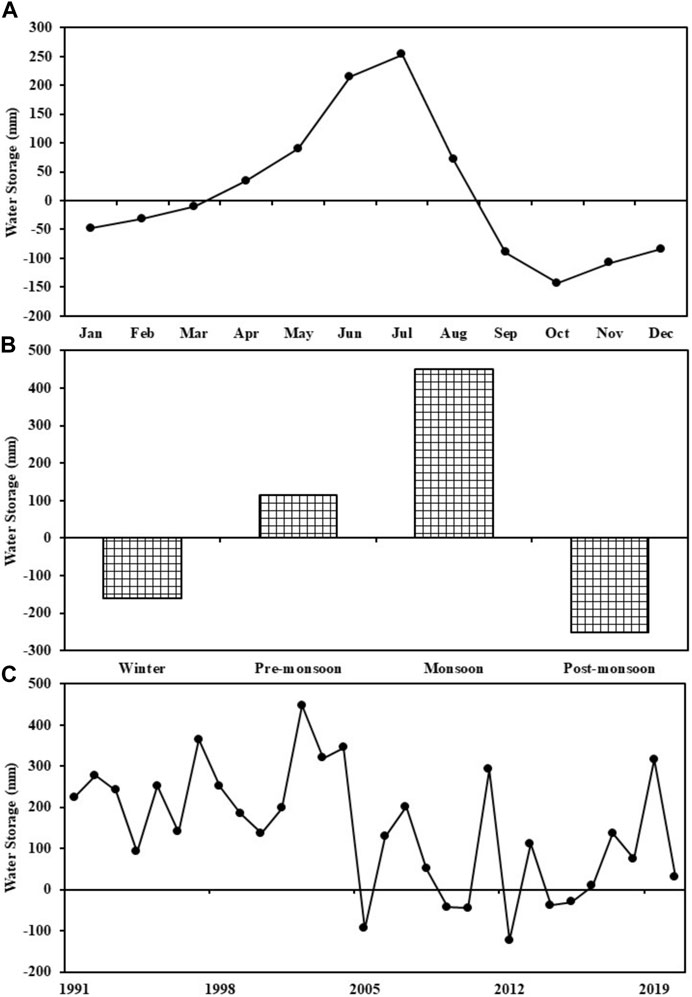
FIGURE 6. Water storage at the monthly (A), seasonal (B), and annual (C) time scale.
Figure 6B demonstrated that the water balance was positive during the pre-monsoon and monsoon seasons and negative during the post-monsoon and winter seasons. The post-monsoon season has the least amount of water storage with a value of −251.05 mm compared to the monsoon season which has a water storage of 449.26 mm. Precipitation was found 81%, 14%, 3%, and 2% in monsoon, pre-monsoon, post-monsoon and winter season respectively on water balance storage in basin (Table 3). Also, 74% total discharge occurred in monsoon season, 11% in post-monsoon season, 7% in winter season and 8% in pre-monsoon season on streamflow contribution on water balance storage. Similarly, 40% evapotranspiration occurred in monsoon season, 20% in post-monsoon season, 14% in winter season and 25% in pre-monsoon season on water balance storage in basin.

TABLE 3. Seasonal water balance storage components.
Similarly, Figure 6C showed that the water balance was positive during most of the years with a few exceptions. In the basin’s water balance, maximum water storage was reached in the year 2002 with 447.35 mm, and minimum water storage was reached in the year 2012 with −122.81 mm. Decadal maximum changes in water storage (216.29 mm) were observed in the previous dacade (1991–2000) while the minmum changes in water storage (78.09 mm) were observed in the recent decade (2011–2020) of the past 3 decades (Supplementary Table S2).
5 Discussion
Using the HBV model, this study investigated the temporal variation of the water balance component’s contribution to streamflow and water storage changes in the Tamakoshi river basin. Previously, limited research in the same basin was conducted using the SWAT model to investigate the climate change impacts on hydropower development and the SRM model to analyze the climate change impact on glacier and snowmelt contributions (Shrestha et al., 2016; Khadka et al., 2014). SWAT model didn’t include a glacier input feature; therefore, the model didn’t simulate the glacier melt runoff during hydropower impact analysis, although SWAT included using the T-index approach to estimate the meltwater contribution from snow and glaciers (Thakuri and Salerno, 2016). Hydrological modeling has been biased to simulate the baseflow and rain runoff flow contributions to streamflow in past studies, which are important to winter and monsoon streamflow. This study investigated the effects of streamflow components (rain runoff, baseflow, snow and glacier melt contribution to water balance and water storage change at Busti gauging station) using the HBV model with station data. There had previously been no research in the Tamakoshi river basin using this combination of research designs.
SPHY model simulations simulated runoff component responses in the glacierized Narayani river basin at Devghat. This model successfully simulated four runoff components: rain runoff, baseflow, snowmelt, and glacier melt runoff. According to Khanal et al. (2021) and Wijngaard et al. (2017), the contribution of rain runoff to streamflow is 63%–65%. Baseflow is approaching 21%, with snowmelt contributing 9%–12% and glacier melt contributing 3%–4%. This study closely matches the contribution of baseflow and rain runoff to streamflow, but the results of the contribution of snow and glacier melt to streamflow varied because the Narayani basin has an area coverage that is approximately 37 times greater than that of the Tamakoshi river basin, even though the total melting contribution is almost certainly similar. According to Zhang et al. (2022), rain runoff dominates total streamflow at downstream stations, but snow and glacier melt predominate at upstream stations in the Himalayan drainage basins (Mukhopadhyay and Khan, 2015). As a result, the runoff contribution to streamflow by components is not uniform; there are differences. For example, In the Gilgit river basin, glacier melting is at its highest, or 45%, while baseflow gradually drops to 27%, snowmelt to 24%, and rain runoff to 5% (Adnan et al., 2022).
Our findings closely match the pattern of streamflow contribution, but the percentage of contribution varies slightly due to the basin’s area coverage. Our results show that rain runoff contributes 62%, baseflow contributes 20%, snowmelt contributes 5%, and glacier melt contributes 13% of total streamflow in the Tamakoshi river basin. The majority of streamflow components contribute during the summer season, but snowmelt contributions are more prevalent during the pre-monsoon season and glacier melt contributions are more prevalent during the post-monsoon season. The contribution of snow and ice melting to streamflow was 17.7% annually while in the spring season (24.7%), summer season (17%), autumn season (16.4%), and winter season (30.9%) (Khadka et al., 2014). Our research, however, revealed that the contribution to overall streamflow made by snow and glacier melting in the winter is minimal and peaks in the post-monsoon season. Our results differed from the melting contribution to streamflow because there are two processes of runoff: surface and subsurface, which are different runoff contributors; glacier melting, baseflow, and rain runoff were not categorized; and Khadka et al. (2014) estimated only snow and ice melting contributions. Snow is not converted directly to surface runoff; instead, it is transformed into glacier and groundwater recharge storage. The melting processes of snow and glacier-fed river basins rely on heat energy for surface runoff and subsurface runoff contribution to streamflow (Lang, 1986). The model simulation period was 10 years, but our simulation duration was 30 years. Observed baseflow is the dominant flow of total streamflow during winter and pre-monsoon, and rain runoff is the dominant flow during monsoon and post-monsoon. The results show that rain runoff dominates total streamflow from May to October, while baseflow dominates total streamflow from November to April. Maximum snowmelt and glacier melt were observed during pre-monsoon and post-monsoon total streamflow. The river basin where most of the precipitation occurred in the summer season, the Ganga river basin, is 71% (Khanal et al., 2021). It states that precipitation is dominant in the summer season, which is similar to our results, but the amount of rainfall received quietly differed from our results because the area coverage of the Ganga river is greater than that of the Tamakoshi river. Tamakoshi river basin receives 80% of its water during the monsoon season (Khadka et al., 2014). Similarly, 80% of rainfall falls during the monsoon season, which is closely related to our findings. April-August water storage change is positive and September-March shows the negative water storage change simulated by using the same modeling approach as the other two models, SWAT and BTOPMC, in the KV watershed (Thapa et al., 2017); our result is completely similar to that result. Streamflow is dominant in the summer season compared with the dry season because the maximum precipitation occurs in summer season (Shrestha et al., 2016). Our results show that 78% of streamflow occurred in the summer season. The majority of streamflow occurred during the summer. Thus, runoff component’s contributions to changes in streamflow and water balance storage vary depending on the characteristics of the basin. The river discharge usually increases in the high Himalayan river basin due to an increase in melt and liquid precipitation fraction (Manabe et al., 2004; Khanal et al., 2021). Similarly, our results showed the decadal changes that the water input to the system has been increasing over time. The streamflow components were increasing in the most recent decade than the previous decades. However, water storage changes were observed to decrease throughout the decades. Water storage changes decreasing in the recent decade due to the increase in runoff components contribution to river discharge and evaporation.
This research attempted to determine the temporal variation of the simulated water balance component’s relative contributions and water storage changes on streamflow in the Tamakoshi river basin. The response of water balance components and changing water storage is significant for estimating water availability in downstream basins and for further research in other basins as needed.
6 Conclusion
In this research, water balance, streamflow components, water storage change and their trends have been evaluated in the Tamakoshi river basin (TRB). In the basin, the HBV 4.0 model performed well for hydrological simulation. Nash-Sutcliffe Efficiency (NSE), Determination (R2), and volume difference (Pbias) are employed as the model performance indicators. Overall durations, the flow pattern was almost perfectly replicated by the model. Overall, the model is underappreciated, but it is adequate. There are slight variations between the calibrated period’s simulated and observed discharge throughout the course of 5 years. The water balance, water storage change and streamflow components were estimated at gauging station Busti during a 30-year period. The discharge predicted by the model is 2,198 mm, and the basin-wide precipitation total was 2,903.52 mm. Rainfall in the river basin is predominately monsoonal, with an average rate of 80% leading to 74% of the discharge taking place during the monsoon season.
Although baseflow contributes during the pre-monsoon season, the simulated streamflow contribution is maximum in the summer and minimum in the winter. The Busti gauging station’s water balance has improved as a result of the storage improvements. Rain runoff contributes the most to streamflow, whereas snowmelt contributes the least. The flow was at its highest in August and its lowest in February. Results showed that water storage increased during rainy months and decreased during dry months.
As a result, water resource project planners and developers should base their decisions on the temporal variability of water availability and its contribution components to sustainable development. This study makes use of meteorological observation from DHM stations to estimate the components of the water balance and the changes in water storage at the Busti gauge station. Since the network of meteorological stations cannot be tolerated, satellite and reanalysis meteorological data products may produce superior results. It is also advised to consider how future climate change may affect the components of streamflow and water balance.
Data availability statement
The original contributions presented in the study are included in the article/Supplementary Material, further inquiries can be directed to the corresponding author.
Author contributions
BRB: conceptualization, formal analysis, methodology, and writing—original draft. TRA: conceptualization, formal analysis, methodology, writing—review and editing, and supervision. SS: conceptualization, formal analysis, writing—review and editing, supervision. RPA: investigation, visualization, validation. All authors listed have made a substantial, direct, and intellectual contribution to the work and approved it for publication.
Funding
The first author is supported by University Grant Commission, Nepal (UGC award no: PhD-076/77 S&T -15) PhD Fellowship.
Acknowledgments
We thank the Department of Hydrology and Meteorology (DHM), Nepal for providing available data.
Conflict of interest
The authors declare that the research was conducted in the absence of any commercial or financial relationships that could be construed as a potential conflict of interest.
The handling editor ST declared a shared affiliation with the author(s) BRB, TRA & SS at the time of review.
Publisher’s note
All claims expressed in this article are solely those of the authors and do not necessarily represent those of their affiliated organizations, or those of the publisher, the editors and the reviewers. Any product that may be evaluated in this article, or claim that may be made by its manufacturer, is not guaranteed or endorsed by the publisher.
Supplementary material
The Supplementary Material for this article can be found online at: https://www.frontiersin.org/articles/10.3389/feart.2023.1128959/full#supplementary-material
SUPPLEMENTARY FIGURE S1 | Relative contribution of runoff components to streamflow’s at the seasonal (A) and annual (B) time scale.
References
Adhikari, T. R., Talchabhadel, R., Shrestha, S., Sharma, S., Aryal, D., and Pradhanang, S. M. (2022). The evaluation of climate change impact on hydrologic processes of a mountain river basin. Theor. Appl. Climatol. 150, 749–762. doi:10.1007/s00704-022-04204-3
Adnan, M., Liu, S., Saifullah, M., Iqbal, M., Ali, A. F., and Mukhtar, M. A. (2022). Spatiotemporal variations in runoff and runoff components in response to climate change in a glacierized subbasin of the Upper Indus Basin, Pakistan. Front. Earth Sci. 1516. doi:10.3389/feart.2022.970349
Arnold, J. G., Srinivasan, R., Muttiah, R. S., and Williams, J. R. (1998). Large area hydrologic modeling and assessment part I: Model development 1. JAWRA J. Am. Water Resour. Assoc. 34, 73–89. doi:10.1111/j.1752-1688.1998.tb05961.x
Bajracharya, A. R., Bajracharya, S. R., Shrestha, A. B., and Maharjan, S. B. (2018). Climate change impact assessment on the hydrological regime of the Kaligandaki Basin, Nepal. Sci. Total Environ. 625, 837–848. doi:10.1016/j.scitotenv.2017.12.332
Bergström, S. (1976). Development and application of a conceptual runoff model for Scandinavian catchments.
Budhathoki, A., Babel, M. S., Shrestha, S., Meon, G., and Kamalamma, A. G. (2021). Climate change impact on water balance and hydrological extremes in different physiographic regions of the West Seti River Basin, Nepal. Ecohydrol. Hydrobiology 21, 79–95. doi:10.1016/j.ecohyd.2020.07.001
Hock, R. (2003). Temperature index melt modelling in mountain areas. J. hydrology 282, 104–115. doi:10.1016/s0022-1694(03)00257-9
Karki, R., Talchabhadel, R., Aalto, J., and Baidya, S. K. (2016). New climatic classification of Nepal. Theor. Appl. Climatol. 125, 799–808. doi:10.1007/s00704-015-1549-0
Kayastha, R. B., Steiner, N., Kayastha, R., Mishra, S. K., and Mcdonald, K. (2020). Comparative study of hydrology and icemelt in three Nepal river basins using the Glacio-Hydrological Degree-Day Model (GDM) and observations from the Advanced Scatterometer (ASCAT). Front. Earth Sci. 7, 354. doi:10.3389/feart.2019.00354
Khadka, D., Babel, M. S., Shrestha, S., and Tripathi, N. K. (2014). Climate change impact on glacier and snow melt and runoff in Tamakoshi basin in the Hindu Kush Himalayan (HKH) region. J. Hydrology 511, 49–60. doi:10.1016/j.jhydrol.2014.01.005
Khanal, S., Lutz, A. F., Kraaijenbrink, P. D., van Den Hurk, B., Yao, T., and Immerzeel, W. W. (2021). Variable 21st century climate change response for rivers in High Mountain Asia at seasonal to decadal time scales. Water Resour. Res. 57, e2020WR029266. doi:10.1029/2020wr029266
Krause, P. (2002). Quantifying the impact of land use changes on the water balance of large catchments using the J2000 model. Phys. Chem. Earth, Parts A/B/C 27, 663–673. doi:10.1016/s1474-7065(02)00051-7
Lang, H. (1986). Forecasting meltwater runoff from snow-covered areas and from glacier basins. River flow Model. Forecast. 3, 99–127.
Manabe, S., Milly, P., and Wetherald, R. (2004). Simulated long-term changes in river discharge and soil moisture due to global warming/Simulations à long terme de changements d’écoulement fluvial et d’humidité du sol causés par le réchauffement global. Hydrological Sci. J. 49. doi:10.1623/hysj.49.4.625.54429
Milly, P. (1994). Climate, interseasonal storage of soil water, and the annual water balance. Adv. Water Resour. 17, 19–24. doi:10.1016/0309-1708(94)90020-5
Mukhopadhyay, B., and Khan, A. (2015). A reevaluation of the snowmelt and glacial melt in river flows within Upper Indus Basin and its significance in a changing climate. J. Hydrology 527, 119–132. doi:10.1016/j.jhydrol.2015.04.045
Nash, J. E., and Sutcliffe, J. V. (1970). river flow forecasting through conceptual models part I—a discussion of principles. J. hydrology 10, 282–290. doi:10.1016/0022-1694(70)90255-6
Nepal, S. (2016). Impacts of climate change on the hydrological regime of the Koshi river basin in the Himalayan region. J. Hydro-Environment Res. 10, 76–89. doi:10.1016/j.jher.2015.12.001
Prasad Gaire, N., Zaw, Z., Bräuning, A., Sharma, B., Raj Dhakal, Y., Timilsena, R., et al. (2022). Increasing extreme events in the central Himalaya revealed from a tree-ring based multi-century streamflow reconstruction of Karnali River Basin. J. Hydrology 610, 127801. doi:10.1016/j.jhydrol.2022.127801
Seibert, J. (2005). HBV light version 2, user’s manual. Uppsala: Department of Earth Sciences, Uppsala University.
Seibert, J., and Vis, M. J. (2012). Teaching hydrological modeling with a user-friendly catchment-runoff-model software package. Hydrology Earth Syst. Sci. 16, 3315–3325. doi:10.5194/hess-16-3315-2012
Shrestha, S., Bajracharya, A. R., and Babel, M. S. (2016). Assessment of risks due to climate change for the upper Tamakoshi hydropower project in Nepal. Clim. Risk Manag. 14, 27–41. doi:10.1016/j.crm.2016.08.002
Shrestha, S., Yao, T., and Adhikari, T. R. (2019a). Analysis of rainfall trends of two complex mountain river basins on the southern slopes of the Central Himalayas. Atmos. Res. 215, 99–115. doi:10.1016/j.atmosres.2018.08.027
Shrestha, S., Yao, T., Kattel, D. B., and Devkota, L. P. (2019b). Precipitation characteristics of two complex mountain river basins on the southern slopes of the central Himalayas. Theor. Appl. Climatol. 138, 1159–1178. doi:10.1007/s00704-019-02897-7
Singh, V., Jain, S. K., and Shukla, S. (2021). Glacier change and glacier runoff variation in the Himalayan Baspa river basin. J. Hydrology 593, 125918. doi:10.1016/j.jhydrol.2020.125918
Terink, W., Lutz, A. F., Simons, G. W. H., Immerzeel, W. W., and Droogers, P. (2015). SPHY v2. 0: Spatial processes in hydrology. Geosci. Model. Dev. 8, 2009–2034. doi:10.5194/gmd-8-2009-2015
Thakuri, S., and Salerno, F. (2016). Glacio-hydrological simulation in dudh Koshi River Basin, Nepal. Int. J. Sci. Dev. Res. 1, 72–78.
Thapa, B. R., Ishidaira, H., Pandey, V. P., and Shakya, N. M. (2017). A multi-model approach for analyzing water balance dynamics in Kathmandu Valley, Nepal. J. Hydrology Regional Stud. 9, 149–162. doi:10.1016/j.ejrh.2016.12.080
Thornthwaite, C., and Mather, J. (1955). The water balance. Centerton, N. J. Drexel Institute of Technology - laboratory of climatology. Berlin, Germany: ScienceOpen.
Vormoor, K., Heistermann, M., Bronstert, A., and Lawrence, D. (2018). Hydrological model parameter (in) stability–“crash testing” the HBV model under contrasting flood seasonality conditions. Hydrological Sci. J. 63, 991–1007. doi:10.1080/02626667.2018.1466056
Wijngaard, R. R., Lutz, A. F., Nepal, S., Khanal, S., Pradhananga, S., Shrestha, A. B., et al. (2017). Future changes in hydro-climatic extremes in the upper indus, ganges, and brahmaputra river basins. PloS one 12, e0190224. doi:10.1371/journal.pone.0190224
Wu, J., Li, H., Zhou, J., Tai, S., and Wang, X. (2021). Variation of runoff and runoff components of the upper shule river in the northeastern qinghai–tibet plateau under climate change. Water 13, 3357. doi:10.3390/w13233357
Keywords: HBV model, flow contribution, Tamakoshi river basin, streamflow components, water balance storage
Citation: Budhathoki BR, Adhikari TR, Shrestha S and Awasthi RP (2023) Application of hydrological model to simulate streamflow contribution on water balance in Himalaya river basin, Nepal. Front. Earth Sci. 11:1128959. doi: 10.3389/feart.2023.1128959
Received: 21 December 2022; Accepted: 11 May 2023;
Published: 22 May 2023.
Edited by:
Sudeep Thakuri, Central Department of Environmental Science, Institute of Science and Technology, Tribhuvan University Kirtipur, NepalCopyright © 2023 Budhathoki, Adhikari, Shrestha and Awasthi. This is an open-access article distributed under the terms of the Creative Commons Attribution License (CC BY). The use, distribution or reproduction in other forums is permitted, provided the original author(s) and the copyright owner(s) are credited and that the original publication in this journal is cited, in accordance with accepted academic practice. No use, distribution or reproduction is permitted which does not comply with these terms.
*Correspondence: Suraj Shrestha, dGhlc2hyZXN0aGEuYW1pZ29AZ21haWwuY29t