 Yupeng Li
 Jingyuan Li1,2
 Fan Ping
95% of researchers rate our articles as excellent or good
Learn more about the work of our research integrity team to safeguard the quality of each article we publish.
Find out more
ORIGINAL RESEARCH article
Front. Earth Sci. , 07 April 2023
Sec. Atmospheric Science
Volume 11 - 2023 | https://doi.org/10.3389/feart.2023.1128672
This article is part of the Research Topic Observation Characteristics and Formation Mechanisms of Severe Weather Events View all 13 articles
A heavy snowfall event that struck Beijing during February 12-13, 2022, affected some of the training sessions and events of the Winter Olympic Games. This heavy snowfall event was simulated using the Advanced Research Weather Research and Forecasting Model with both the two-moment bulk scheme (BULK) and the spectral bin microphysics scheme (BIN), and the differences in surface precipitation, radar reflectivity, and cloud microphysics processes were compared and analyzed. It was found that surface precipitation was dominated by solid precipitation particles. The 24-h accumulated precipitation of the BULK simulation was larger than that of the BIN simulation, but both were smaller than that observed. The BIN simulation was closer to the observations in terms of the trends of variation in precipitation rate and radar reflectivity during the period of heavy precipitation. The maximum and minimum vertical velocities of the BIN simulation were notably higher than those of the BULK simulation, and the water vapor content of the BIN scheme at the heights of the −10 to −20°C levels and above the −38°C level was substantially higher than that of the BULK scheme. The contents of cloud water and snow simulated by the BIN scheme were much higher than those simulated by the BULK scheme. The nucleation of ice crystals in the middle and high layers of the BULK scheme was obvious, whereas such a process was not evident in the BIN scheme. The net production rate of ice crystals and snow simulated by the BULK scheme was stronger near the surface than that simulated by the BIN scheme, and a second peak in the conversion rate existed at heights very close to the surface below 1 km, which might account for the greater intensity of precipitation in the BULK scheme. The latent heat simulated by the BULK scheme was larger (smaller) than that simulated by the BIN scheme below (above) the height of 2 km.
Heavy snowfall is one of the major catastrophic weather events that occur in high-latitude regions in winter. Such events are often accompanied by high winds, cold waves, low visibility, and freezing weather that can affect transportation, water conservancy, electricity supply, agricultural production, and people’s lives. Spatially extensive and long-duration blizzard events cause the most serious impact, but local heavy or extremely heavy blizzards are typical high-impact events that can often endanger life and property (Changnon and Changnon, 2006; Wang et al., 2010; Jiao et al., 2021; Wang et al., 2022). Heavy snowfall in winter occurs frequently in northern China and on the Qinghai–Tibet Plateau. For example, heavy snowfall occurred in November 2021 in Liaoning Province (Northeast China), which paralyzed transportation, closed schools, damaged crops, affected 152,000 people, and caused direct economic losses of 4.496 billion yuan. Wintertime precipitation can also affect southern China such as the freezing rain and snowfall that occurred in 2008, which caused severe damage to many southern provinces (Sun et al., 2010; Li et al., 2021).
Heavy snowfall is mainly caused by cold cloud processes, and the ice-phase cloud microphysics process plays a very important role in the formation of heavy snowfall. Therefore, it is important to study the microphysics process of ice-phase cloud and the parameterization scheme of cloud microphysics for improved prediction of heavy snowfall events (Lin and Bueh, 2006). Currently, there are very large uncertainties regarding both the characteristics of ice-phase particles within clouds and the ice-phase cloud microphysical processes. Consequently, obtaining a reasonable description of ice-phase cloud microphysical processes is one of the important challenges that must be addressed to improve cloud microphysical parameterization and numerical weather prediction models (Khain and Pinsky, 2018; Morrison et al., 2020).
The description of cloud microphysical processes in numerical weather models is achieved using microphysical parameterization schemes. Depending on the description of the hydrometeors, cloud microphysical parameterization schemes can be divided broadly into two categories: bulk schemes (hereafter, BULK) and bin schemes (hereafter, BIN). In a BULK scheme, the particle size distribution (PSD) of the hydrometeors is assumed as an empirical function that does not change during the simulation. A BULK scheme consumes fewer computational resources and is therefore used widely in practical operations and theoretical studies. However, a BULK scheme is suitable only for describing the overall PSD of the hydrometeors in clouds, and is not suitable for describing the evolution of the PSD caused by the change in particle size within a specific range (Xu and Duan, 1999). In contrast, a BIN scheme divides cloud particles into tens or hundreds of bins according to the microphysical characteristics of the hydrometeors, e.g., phase state, particle size, shape, and density, and it describes the prediction equations of each bin of particles and the interconversion process between them (Li et al., 2009a; Yin et al., 2017).
Earlier comparative analyses of BIN and BULK simulations focused on using idealized models to study strong convective weather. Lynn et al. (2005) found that the radar echoes simulated by the BIN scheme can more reasonably characterize the initiation and progression of strong convection in comparison with those simulated by the BULK scheme. Khain et al. (2009) also determined that the BIN scheme can simulate the dynamics and cloud microphysical structure of a squall line more realistically. Li et al. (2009a) revealed that the BULK scheme simulated a multicell storm with rapid and strong evolution leading to convection on a summertime squall line, whereas the BIN scheme produced a unicell storm with little temporal variation in the regeneration of its leading cell. Igel and van den Heever. (2017) studied the difference in condensation and evaporation rates in non-precipitating shallow cumulus clouds using simulations of BIN and BLK schemes in the same model framework, and found that the condensation rate is significantly affected by the width of drop size distribution (DSD).
With recent improvements in computer performance, it is now possible to compare the BIN scheme and the BULK scheme in relation to real cases. Fan et al. (2012) conducted a comparison of the two-moment BULK and BIN schemes for a case of strong convection in China. Their results showed that the BULK scheme simulated much higher cloud droplet numbers, and that the cloud condensation nuclei had contrasting effects on convection and precipitation between the two schemes. Yin et al. (2017) used the BIN and BULK schemes for a comparative analysis of a squall line in eastern China. Their results showed that the BULK scheme produced a well-organized but shorter radar structure, whereas the BIN scheme simulated scattered but stronger radar echoes that were more consistent with the observations. Moreover, the BULK scheme produced better performance in simulating strong rainfall areas and precipitation amounts. Chen et al. (2021) analyzed the differences between the BIN and BULK schemes with regard to the simulation of the initiation of a mesoscale convective system in the area of Beijing (China). They found that the BIN scheme simulated a lower rainwater mass center, stronger latent heat release, and more intense precipitation. Zhang et al. (2022) used the BULK and BIN schemes to analyze Typhoon In-Fa which struck mainland China in 2021. They reported considerable differences between the two microphysics schemes in the simulation of the precipitation, path, and intensity of the typhoon. Moreover, the performance of each scheme was greatly affected during the different periods of typhoon landfall.
Earlier comparative studies on summertime strong convection, simulated using the BIN and BULK schemes and idealized experiments or real case scenarios, have revealed new understanding. However, similar research on weak convection such as wintertime heavy snowfall remains lacking. Furthermore, it has been identified that cold cloud-related microphysical properties such as ice nuclei and the PSD of snow in China differ markedly from those in other regions (Yin et al., 2011; Wang et al., 2015). Therefore, it is of great scientific importance to conduct a comparative study of the BULK and BIN schemes in relation to wintertime snowfall in China, to investigate their performance in simulating winter precipitation, and to clarify the main cloud microphysical processes and their differences. The findings will improve cloud microphysical parameterization, local optimization of sensitive parameters, and the capability of numerical models in forecasting winter precipitation.
In this study, a heavy snowfall event that occurred during the Winter Olympic Games in Beijing, on February 12-13, 2022, was simulated using the Weather Research and Forecasting (WRF) regional numerical model with the BULK and BIN cloud microphysics schemes. Based on the simulations, the precipitation, radar reflectivity, and dynamic characteristics simulated by the BIN and BULK schemes were further compared, and the cloud microphysical characteristics of the two simulations such as the spatiotemporal evolution characteristics of the hydrometeors, main microphysical process, and release of latent heat were analyzed. The findings of these analyses will help reveal the differences in cloud microphysical processes between the BULK and BIN schemes and provide a basis for the improvement of both schemes. Moreover, the results will also help improve understanding of the mechanism of snowfall development in northern China, and provide reference for improved forecasting of wintertime precipitation.
The remainder of this paper is organized as follows. Section 2 introduces the data and methodology. Section 3 provides an overview of the heavy snowfall event and the setup of the numerical experiments. Section 4 analyzes the simulation results. Our discussion and conclusions are presented in Section 5.
The model initial and boundary conditions were obtained from the 6-hourly National Centers for Environmental Prediction Final Analysis (NCEP-FNL) 0.25° × 0.25° dataset. The NCEP-FNL was also used for the analysis of the synoptic-scale circulation situation.
Surface rain gauge observations were observed by Automated Weather Stations (AWS), which were provided by the National Meteorological Information Center of the China Meteorological Administration. The locations of the AWSs are marked in Figure 1A, and the precipitation accumulated at 1-h intervals at the location of each AWS is used. We also used the operational S-band radar observation at Beijing station. The location of the radar is marked in Figure 1A. The radar operates in the volume coverage pattern 21 (VCP-21) scanning mode, consisting of nine elevation angles: 0.5°, 1.5°, 2.4°, 3.4°, 4.3°, 6.0°, 9.9°, 14.6°, and 19.5°. The temporal resolution of radar reflectivity data is 6 min. We interpolated the station and radar observations onto a 0.01° × 0.01° latitude-longitude grid in the Beijing area to facilitate comparison and analysis of the observations with the simulations.
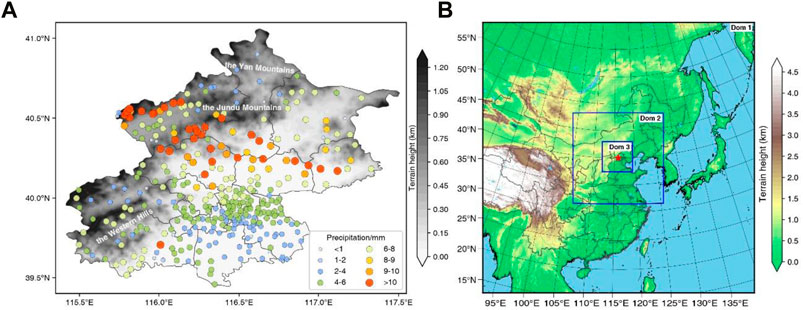
FIGURE 1. (A) Observed 24-h accumulated precipitation (colored scatter points, unit: mm) and terrain height (shading, unit: km) in the Beijing area from 1800 UTC on February 12 to 1800 UTC on February 13, 2022. (B) Domain configuration of the simulation and terrain height (shading; unit: km). Red asterisk indicates the location of the center of the domain.
The numerical simulations were performed using the WRF Version 4.2 model. The WRF model is a fully compressible non-hydrostatic, primitive equation model with multiple-nesting capabilities that can enhance the resolution over areas of interest (Skamarock et al., 2019). Figure 1B shows the configuration of the three nested domains used in this research, and Table 1 lists the configurations of the simulation. Domain 1 had the coarsest mesh with 601 × 601 grid points in the north–south and east–west directions, respectively, and horizontal grid spacing of 9 km. Domain 2 was nested within domain 1 with 601 × 601 grid points at 3-km grid spacing. Domain 3 was nested within domain 2 with 601 × 601 grid points at 1-km grid spacing. The three domains were run together with a one-way nest. All domains were centered over Beijing to represent the regional-scale circulation and to resolve the complex flows within this region. The number of vertical layers was 51 and the model top was set at 50 hPa. The model data from the 1 × 1 km domain output at 1-h intervals were used for the analysis.
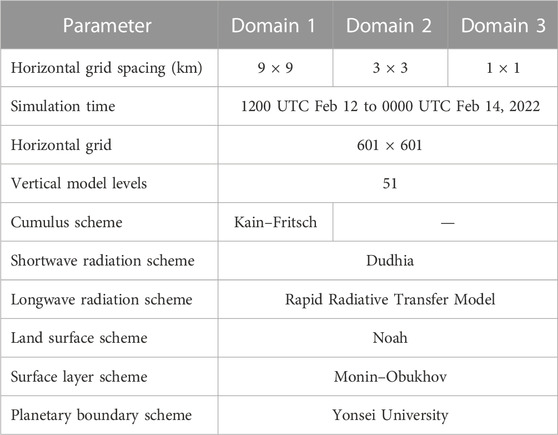
TABLE 1. Setup of model parameters.
The NCEP-FNL analyses were interpolated to the WRF model grid to provide the initial conditions for 1200 UTC on February 12, 2022, as well as the 6-hourly lateral boundary conditions for the outermost domain. The boundary conditions for the 3 × 3 km grid and the 1 × 1 km grid were obtained from the outer domain. The simulations over all domains started at 1200 UTC on February 12, 2022, and they were integrated for 36 h.
The model physics schemes used included the following: 1) the Kain–Fritsch cumulus scheme (Kain, 2004) in the outermost domain (disabled in the two inner domains); 2) the Yonsei University planetary boundary layer scheme (Hong et al., 2006); 3) the revised MM5 Monin–Obukhov similarity scheme for the surface layer (Jiménez et al., 2012); 4) the unified Noah land surface scheme (Chen and Dudhia, 2001a; 2001b); 5) the Rapid Radiative Transfer Model (Mlawer et al., 1997) for longwave radiative flux calculations; and 6) the Dudhia shortwave scheme (Dudhia, 1989).
With other model configurations remaining fixed, two microphysical schemes, namely the two-moment WDM6 bulk parameterization scheme (Lim and Hong, 2010) and the HUJI (Hebrew University of Jerusalem, Israel) spectral bin full version microphysics scheme (Khain et al., 2004) were selected to represent the BULK and BIN schemes, respectively. The BULK scheme includes five categories of cloud particles (i.e., cloud water, rainwater, ice crystals, snow, and graupel); the BIN scheme includes the same five categories of cloud particles but with the addition of hail. Moreover, the ice crystal particles in the BIN scheme are expanded into three detailed subcategories: column, dendrite, and plate. Each category of cloud particles is divided into 33 bins according to their mass. And the ratio between 2 adjacent bins is set to a constant value of 2 (Khain et al., 2004), In contrast, the PSD in BULK scheme is typically assumed to follow a gamma or exponential distribution. Table 2 gives a further description of the differences between the two schemes.

TABLE 2. Differences between BIN and BULK schemes.
The heating process in the cloud microphysics includes condensation, freezing and deposition. Evaporation, melting and sublimation are considered cooling processes. Based on the methods used by (Hjelmfelt et al., 1989), the latent heating and cooling rates were defined as follows:
Where Lv, Lf and Ls are the latent heats of evaporation, melting, and sublimation, respectively. Cp is the specific heat at a constant pressure. Pcond, Pfrz, Pdep, Pevp, Pmlt, and Psub are the rates of mass change due to condensation, freezing, deposition, evaporation, melting, and sublimation.
The first snowfall after the Chinese New Year of the Tiger struck Beijing on February 12-13, 2022. Some of the training sessions and events related to the Winter Olympic Games were affected by unfavorable weather conditions such as low visibility and high wind speed associated with this snowfall event. Figure 1. A shows the distribution of the 24-h accumulated precipitation in Beijing from 1800 UTC on February 12 to 1800 UTC on February 13, 2022. It can be seen that the accumulated precipitation in Beijing was generally more than 4 mm; however, it was more than 8 mm in central–northern areas and more than 10 mm at several stations. The band of heaviest snowfall was aligned broadly in a northwest–southeast pattern, and the center of heaviest snowfall was mainly located over the southern slopes of the Jundu Mountains, indicating that topography had an important influence on this snowfall event.
Figure 2 shows the synoptic-scale circulation situation of different pressure levels on February 13, 2022. As can be seen from Figures 1B, 2A, before the occurrence of the snowfall, an upper-level cold vortex was maintained over Northeast Asia at 500 hPa, with its center located over the northwest of Heilongjiang Province, China. The cold air within the southward flow on the western side of the cold vortex was transported from high-latitude regions toward the west of the Beijing area, and the Beijing area was located in the region of positive vorticity advection ahead of the trough. At the same time, there was a strong upper-level jet at 200 hPa. The center of this jet was located to the south of the upper-level cold vortex, and the maximum wind speed was >90 m s−1. The Beijing area was located in the area of the ascent on the left side of the jet stream entrance region, which was conducive to the occurrence of the snowfall event. A low vortex existed at 850 hPa to the northwest of Beijing (Figure 2C), and there was strong water vapor transport toward Beijing from the south. The Beijing area was located in front of the inverted trough at the surface, which was conducive to the occurrence of upward movement (Figure 2D). The 0°C isotherm was located near Tianjin Bay, and the temperature decreased steadily from the southeast toward the northwest and from the coast toward inland areas, indicating that the precipitation of this event was dominated by ice-phase precipitation particles.
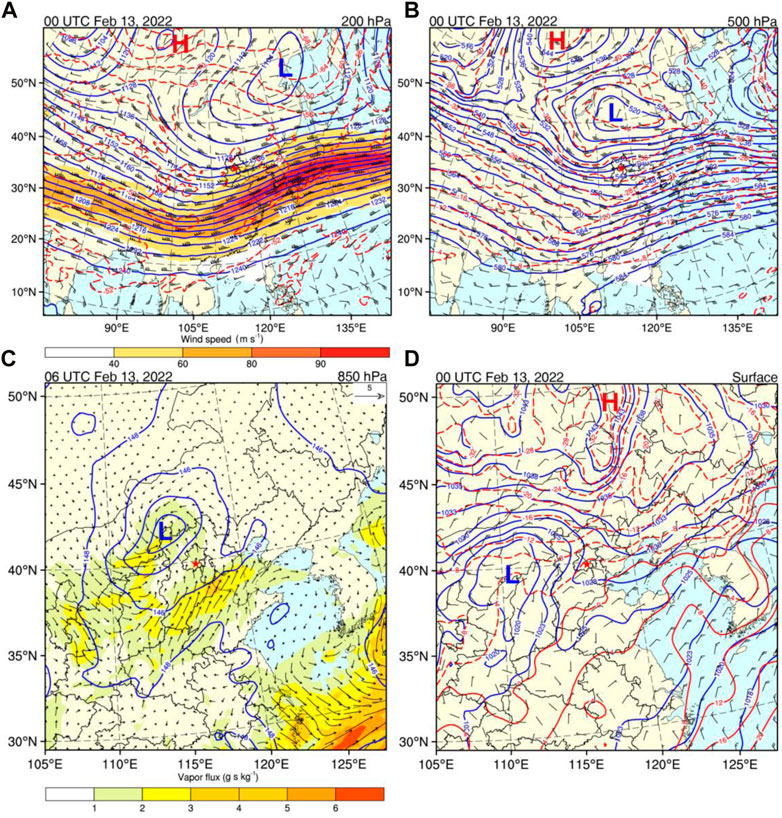
FIGURE 2. Synoptic-scale atmospheric circulation fields on February 13, 2022. (A) Upper-level jet (shading; unit: m s−1), geopotential height (blue contours; unit: dagpm), temperature (red contours; unit: °C), and wind field (barb symbols) at 200 hPa for 0000 UTC. (B) Geopotential height (blue contours; unit: dagpm), temperature (red contours; unit: °C), and wind field (barbs) at 500 hPa for 0000 UTC. (C) Geopotential height (blue contours; unit: dagpm) and water vapor flux (shading and vector arrows; unit: g s kg−1) at 850 hPa for 0600 UTC. (D) Sea level pressure (blue contours; unit: hPa), temperature (red contours; unit: °C), and wind field (barb symbols) at the surface for 0000 UTC. Red asterisk indicates the location of the Beijing station (No.: 54,511). Half and full wind barb symbols denote 2 and 4 m s−1, respectively.
Figure 3 shows sounding profiles from Beijing (Station No.: 54,511) obtained on February 12 and 13, 2022. Before the snowfall occurred (Figure 3A), there was cold advection in the lower layer, the dewpoint depression was approximately 10°C, and the air was dry. There was an inversion layer at 950 hPa, indicating the existence of potential instability, and there was an obvious wet layer at 800 hPa above the inversion layer, providing environmental conditions favorable for the occurrence of enhanced convection. Additionally, the temperature was <0°C throughout the entire profile, indicating that the precipitation was mainly in the form of solid precipitation particles. By 0000 UTC on February 13 (Figure 3B), the level below 600 hPa had reached saturation, indicating that snowfall had occurred at this time. The temperature inversion or neutral layer was more obvious and the thickness had increased. The wind direction in the lower level also changed from northeasterly to southeasterly, and the wind direction rotated clockwise from low to high between 900 and 800 hPa in the lower level, indicating warm advection in the lower level that was favorable for further development and maintenance of snowfall.
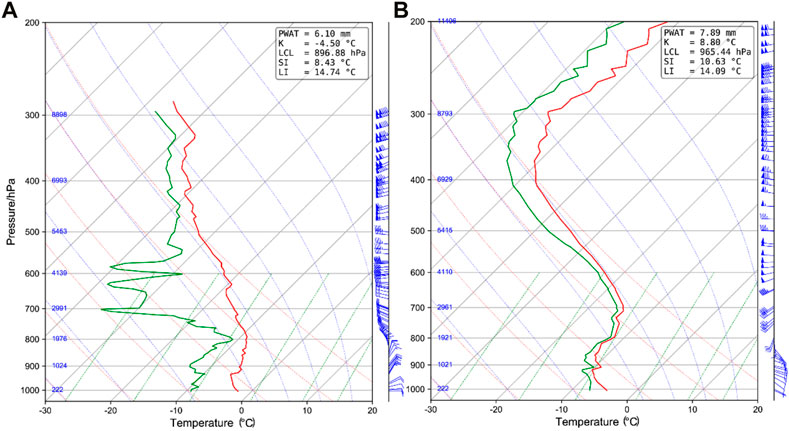
FIGURE 3. Observed sounding over Beijing (Station No.: 54,511): (A) 1200 UTC on February 12, 2022 and (B) 0000 UTC on February 13, 2022. Full wind barb symbol denotes 4 m s−1.
To compare the simulation results of precipitation for both the BULK and the BIN schemes, Figure 4 shows the accumulated surface precipitation of different periods observed by AWSs and simulated by the model using the two different microphysics schemes. The 12-h accumulated precipitation from 1800 UTC on February 12 to 0600 UTC on February 13, 2022 is shown in Figures 4A1–C1. The observations show that the precipitation mainly occurred at the junction between the Jundu Mountains and the southern Beijing Plain, and that the zone of heaviest snowfall was aligned broadly in an east–west direction. The simulation results of the BULK and BIN schemes were generally consistent with the observations but the amount of precipitation was smaller. The 12-h accumulated precipitation during 0600–1800 UTC on February 13, 2022, is shown in Figures 4A2–C2. The precipitation in this period had weakened, and the precipitation was evidently smaller than that accumulated in the previous 12-h period. Moreover, the maximum precipitation observed was <4 mm, whereas the precipitation simulated by the BIN and BULK schemes in this period was greater with centers of heavier precipitation distributed in an east–west band. The 24-h accumulated precipitation from 1800 UTC on February 12 to 1800 UTC on February 13, 2022, is shown in Figures 4A3–C3. The heaviest observed precipitation was mainly located at the junction of the northern mountainous area and the plain area, broadly aligned in the northwest–southeast direction, whereas the heaviest simulated precipitation of the BIN and BULK schemes was aligned in the east–west direction. The precipitation simulated by the BULK scheme was larger than that simulated by the BIN scheme, but the precipitation of both was smaller than that observed.
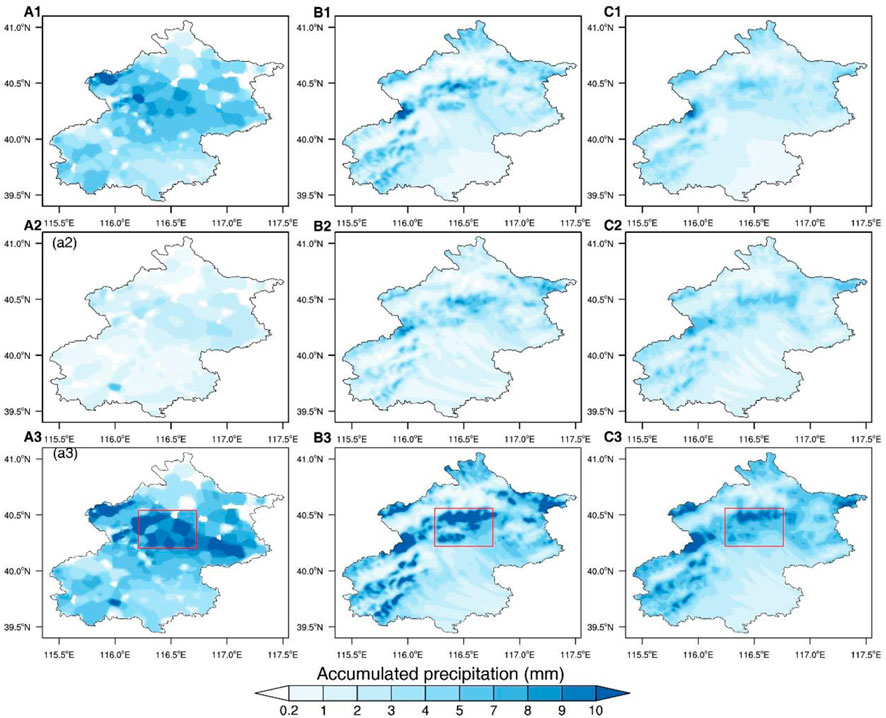
FIGURE 4. Accumulated 12-h and 24-h precipitation (unit: mm) of the (A1)–(A3) observations, (B1)–(B3) BULK scheme, and (C1)–(C3) BIN scheme in the Beijing area. Panels marked (A) are for 1800 UTC on February 12 to 0600 UTC on February 13, 2022, panels marked (B) are for 0600 UTC to 1800 UTC on February 13, 2022, and panels marked (C) are for 1800 UTC on February 12 to 1800 UTC on February 13, 2022. Red rectangle indicates the region selected for later analysis.
The distribution of the 24-h accumulated precipitation shows that the area of heaviest precipitation was located over central–northern Beijing, i.e., the southern slopes of the Jundu Mountains. Therefore, we selected this area for further analysis (i.e., the red rectangles in Figure 4).
The evolution of the two simulations and the observed hourly regional average precipitation for the selected area of heaviest precipitation is shown in Figure 5. From 2100 UTC on February 12 to 1600 UTC on February 13, the observed precipitation first strengthened and then weakened. The peak precipitation appeared at 0400 UTC on February 13, with a value of approximately 1.15 mm h−1. Although the simulation results of the two schemes broadly reproduce the temporal evolution characteristics of the observed precipitation, some differences are evident between the precipitation simulated by the two schemes. The peak precipitation of the BIN scheme occurred at 0500 UTC on February 13, whereas the peak precipitation of the BULK scheme occurred at 0600 UTC on February 13. Both schemes underestimated the peak value of precipitation with a 1 to 2-h lag. During the period of heavy precipitation (i.e., during 0200–0700 UTC on February 13), the temporal evolution of precipitation simulated by the BIN scheme was closer to that of the observations, showing a more symmetrical increase and weakening of the precipitation rate, whereas the precipitation rate in the BULK scheme changed slowly and showed a fluctuating characteristic.

FIGURE 5. Time series of area-averaged precipitation rate in the simulations and observations from 1800 UTC on February 12 to 1800 UTC on February 13, 2022, at 1-h intervals.
Figure 6 shows the composite radar reflectivity of the BULK and BIN schemes at 0400 UTC on February 13, 2022, together with the observed composite radar reflectivity at 0300 UTC on February 13, 2022. The observed radar echoes were mainly located over the south–central part of Beijing, and the echo band with values of >25 dBZ (maximum: >30 dBZ) was mainly aligned in the northwest–southeast direction over the central–northwest part of Beijing. However, the echo band of the BULK scheme was notably further eastward compared with that of the observations. Moreover, the zone of strong echoes was located over the eastern boundary of Beijing, and the echo intensity was weaker than that of the observations; the maximum echo intensity was <25 dBZ. The zone of strong echoes of the BIN scheme was located near the Jundu Mountains, and the maximum intensity of the echoes was also <25 dBZ. The zone of strong echoes was broadly aligned in the northwest–southeast direction but located slightly further north than that observed. Overall, the location of the radar echoes simulated by the BIN scheme was closer to that of the observations.
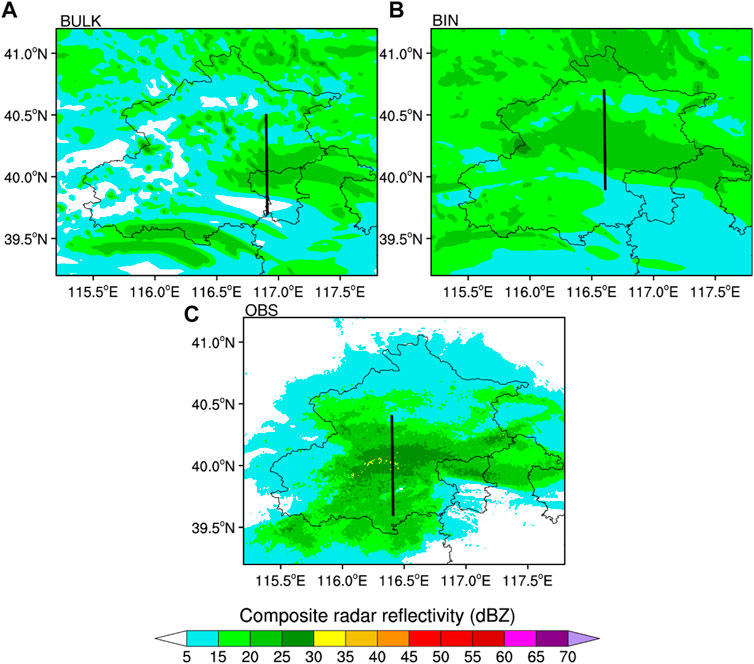
FIGURE 6. Composite radar reflectivity of (A) the BULK scheme and (B) the BIN scheme at 0400 UTC on February 13, 2022, and (C) observed composite radar reflectivity at 0300 UTC on February 13, 2022. Black lines denote the locations of the cross sections shown in Figure 7.
Figure 7 shows vertical cross sections of the simulated and observed radar reflectivity. As can be seen from Figure 7C, the observed radar echoes had a maximum value of >27 dBZ and the echo top height was approximately 7 km. Liu et al. (2022) found a maximum radar echo top height of approximately 7-8 km in a snowfall event over Beijing, which is consistent with our results (see Figure 4 therein). However, the echo top height is much lower for winter precipitation systems in comparison with that of strong convective systems in summer (Chen et al., 2021; Li et al., 2022). The peak value of the radar echoes simulated by the BULK scheme was >24 dBZ, but the area of the strong echoes was much smaller than that observed. Moreover, the height of the radar echo top was <3 km, i.e., approximately half that observed. The maximum echo simulated by the BIN scheme was >21 dBZ, which was smaller in comparison with the observations, but the area of echoes with values of >21 dBZ was closer to that observed. Moreover, the strong echo heights of both the BIN scheme and the observations ranged from the ground to approximately 2 km. The top of the echoes simulated by the BIN scheme reached the height of up to 6 km, which was also closer to that of the observations.
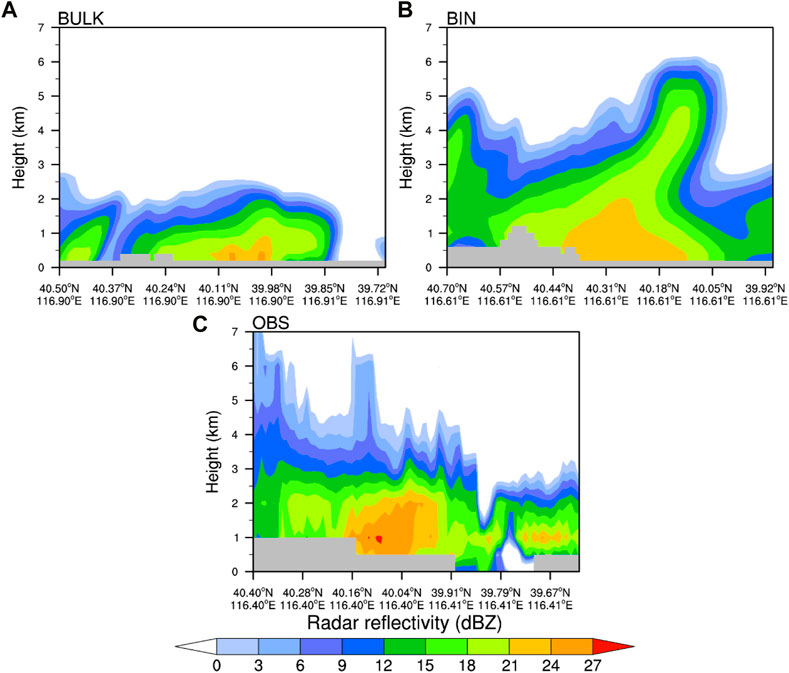
FIGURE 7. As in Figure 6 but for vertical cross sections of radar reflectivity along the black lines shown in Figure 6. The gray zones in the figure indicate the terrain.
Figure 8 shows time–height contours of the simulated and observed radar echoes averaged over the region (see red rectangles in Figures 4A3–C3). As can be seen from Figure 8C, the observed radar echoes were most obvious during 0000–1500 UTC on February 13, 2022. The echoes showed a double-peaked feature, with the strongest echoes occurring at approximately 0400 UTC on February 13, and the top height of the echoes extended to approximately 7 km. During 0000–0600 UTC on February 13, 2022, the radar echoes simulated by the BULK scheme, shown in Figure 8A, the BULK scheme failed to reproduce the double-peaked feature at the beginning of precipitation, and the echo top height was lower, i.e., <4 km. In contrast, the BIN scheme reproduced the double-peaked structure of the observed radar echoes during the same period (Figure 8B), with a higher echo top height than the BULK scheme that was closer to that of the observations. While the observed radar echoes were <8 dBZ and the top of the echoes was <4 km during 0600–1000 UTC on February 13, 2022, the radar echoes simulated by both the BIN scheme and the BULK scheme were stronger (>14 dBZ) than those observed.
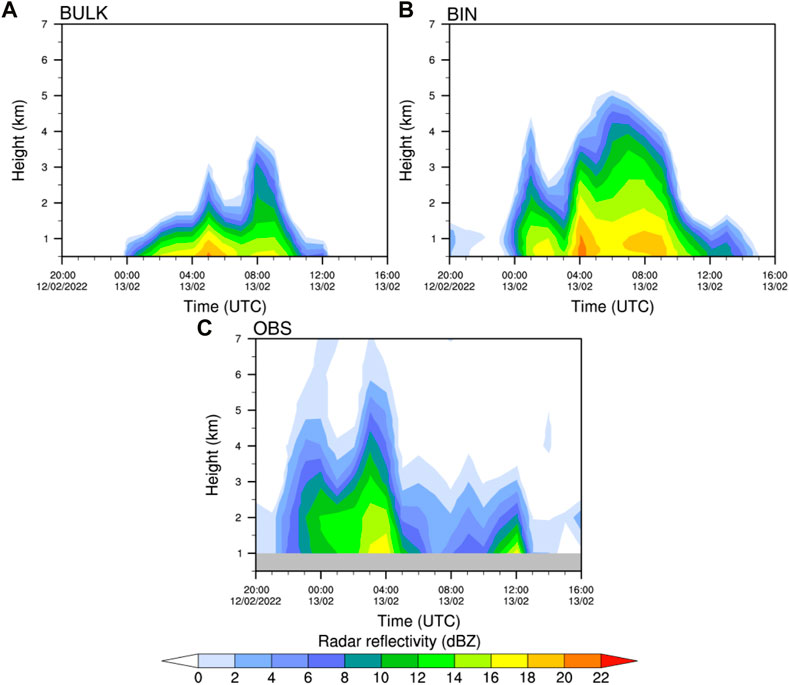
FIGURE 8. Time-height cross sections of regional average radar reflectivity for (A) the BULK scheme, (B) the BIN scheme, and (C) the observations from 2000 UTC on February 12 to 1600 UTC on February 13, 2022 (unit: dBZ). Regions used to calculate the regional average are shown in the red rectangles in Figures 4A3–C3.
In summary, it is evident that the radar echoes simulated by the BIN scheme were closer to those of the observations in terms of horizontal distribution, echo top height, and area of strong echoes. Consistent with our results, radar echoes simulated by the BIN scheme were also found to be more realistic in previous studies (Lynn et al., 2005; Li et al., 2009a; Yin et al., 2017). However, the subject of the earlier research was summertime strong convection rather than wintertime precipitation.
Cloud microphysical processes can provide feedback to the kinematic and moisture fields, which means that it is important to investigate feedback effects on environmental fields when comparing the BIN and BULK schemes. Here, we focus on the effects of the BIN and BULK schemes on environmental conditions such as vertical velocity and water vapor. Figure 9A shows the vertical profiles of the maximum upward and downward velocities during the period of precipitation. It can be seen that the peaks of the maximum updraft and downdraft for both the BIN simulation and the BULK simulation occurred near the surface, i.e., the maximum downward (upward) velocity peaked at a height of approximately 0.5 km (0.8 km). Additionally, the maximum upward and downward velocities of the BIN simulation were markedly stronger than those of the BULK simulation, and the differences were greater at levels with temperatures greater than −38°C (i.e., below 5.8 km). It is clear from the previous analysis that the top height of the radar echoes simulated by the BIN scheme was higher than that of the BULK scheme, indicating that the stronger upward motion in the BIN scheme caused more vigorous convection and a higher top of the radar echo (see Figure 7). Many previous studies on summertime strong convection found stronger updrafts in BULK scheme simulations than in BIN scheme simulations (Li et al., 2009a; 2009b; Khain and Lynn, 2009; Fan et al., 2012; Yin et al., 2017), which is different from our results. This suggests that cloud microphysical processes are substantially different between summertime precipitation and wintertime precipitation. Figure 9B shows the average vertical profile of the water vapor mixing ratio. The water vapor content was maximum in the near-ground layer, decreased with increasing height, and was markedly greater at the heights of the −10 to −20°C levels and above the −38°C level for the BIN scheme than for the BULK scheme, probably because the BULK scheme consumed more water vapor than the BIN scheme in the region selected, which means that the conversion rate of water vapor to cloud particles was higher.
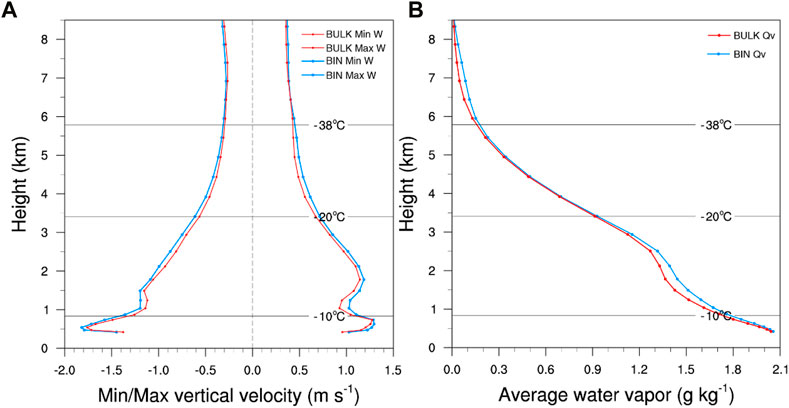
FIGURE 9. Vertical profiles of (A) maximum and minimum vertical velocity (unit: m s−1) and (B) average water vapor mixing ratio (g kg−1) simulated by the BULK and BIN schemes from 2000 UTC on February 12 to 1600 UTC on February 13, 2022. Regions used to calculate the vertical profiles are shown in Figures 4A3–C3.
Here, we investigate the differences in the temporal and vertical distributions of the cloud particles during the snowfall event simulated by the BULK and BIN schemes. Figure 10 shows the temporal evolution of different cloud particles. The temporal evolution of cloud water, shown in Figure 10A, indicates that the cloud water simulated by the BULK scheme was mainly concentrated at heights from the ground to 1.3 km, and that the cloud water content was higher at 2000 UTC on February 12, shortly after the onset of the snowfall, and that it then decreased continuously until 0800 UTC on February 13, 2022. The BIN scheme simulated a region with high values of cloud water content up to the height of 3 km, and it indicated notably higher cloud water content in comparison with that of the BULK scheme throughout the period of precipitation, i.e., the maximum value was more than twice that of the BULK scheme. It can be seen from Figure 10B that the rainwater content simulated by the BULK scheme was 0, whereas the BIN scheme simulated a small amount of rainwater near the end of the period of precipitation. Figure 10C shows the evolution of ice crystals. The maximum height to which the ice crystals extended was broadly the same for both the BULK scheme and the BIN scheme, i.e., up to approximately 7 km. The region of high values for both simulations was mainly located between the −20 and −38°C levels, with a multicenter structure, but the peak for the BULK scheme was substantially higher than that for the BIN scheme. Another difference is that the ice crystal content of the BULK simulation was markedly greater than that of the BIN scheme at heights between the −20°C level and the ground throughout precipitation, i.e., with a difference of up to 2-3 times. Figure 10D shows the time–height contours of snow for the two simulations. Most snow simulated by the BULK scheme was below 4 km, while that simulated by the BIN scheme could reach up to 5 km in most periods. In contrast to the distribution of ice crystals, the snow simulated by the BULK scheme was much smaller than that simulated by the BIN scheme at heights between the −20°C level and the ground, i.e., the maximum difference was approximately 1 time greater. Figure 10E shows the evolution of graupel. The graupel simulated by the BULK scheme mainly appeared during 0000–1200 UTC on February 13, and it extended vertically up to 3.5 km. The graupel simulated by the BIN scheme mainly appeared near the end of the period of precipitation, i.e., during 1,100–1600 UTC on February 13, and it was mainly distributed at heights of <2 km; however, the content was greater than that of the BULK scheme. Figure 10F shows the time–height contours of the ice water content (IWC). The IWC simulated by the BULK and BIN schemes was mainly distributed below the height of the −38°C level, and the area with values of >0.09 g kg−1 mainly appeared near the ground during 0000–1200 UTC on February 13, 2022. The IWC simulated by the BIN scheme was greater than that simulated by the BULK scheme.
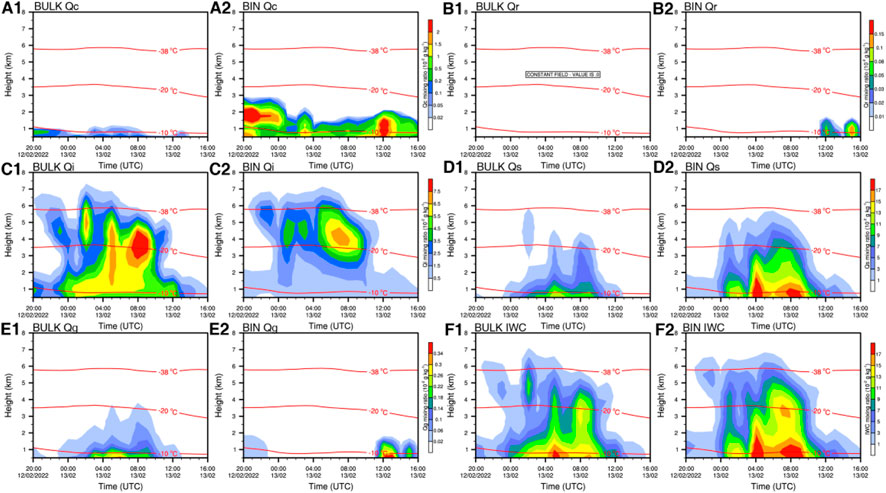
FIGURE 10. Time–height contours of cloud hydrometeors (shading; unit: g kg−1) of the BULK and BIN simulations for 2000 UTC on February 12 to 1600 UTC on February 13, 2022: (A1,A2) cloud water (Qc), (B1,B2) rainwater (Qr), (C1,C2) cloud ice (Qi), (D1,D2) snow (Qs), (E1,E2) graupel (Qg), and (F1,F2) ice water content (IWC). The three horizontal red lines from low to high indicate the −10, −20, and −38°C isotherms, respectively.
Figure 11 shows the average profiles for each cloud hydrometeor simulated by the BULK and BIN schemes for the selected regions throughout precipitation. The main particles in the clouds were ice crystals and snow, and in the near-ground layer (height: <2.5 km), the cloud water content simulated by the BIN scheme was substantially greater than that by the BULK scheme. At heights of 4.5 to 1 km, the ice crystal content simulated by the BULK scheme showed an overall trend of increase with decreasing height, with a peak occurring at approximately 1 km height. Below 1 km, the ice crystal content decreased with decreasing altitude. Conversely, the ice crystal content simulated by the BIN scheme showed a trend of decrease with decreasing height, with a peak occurring at 4.5 km and the lowest ice crystal content occurred at the ground. The snow content of the BULK scheme simulation increased with decreasing height and the peak occurred at the ground, whereas that of the BIN scheme simulation also increased with decreasing height, but with the peak at the height of approximately 0.6 km. Moreover, the snow content of the BIN scheme simulation was substantially larger than that of the BULK scheme. The BULK and BIN simulations both showed increase in IWC with decreasing height, with the peak of the BULK scheme occurring at approximately 0.6 km and the peak of the BIN scheme occurring at a slightly higher height than that of the BULK scheme. The IWC of the BIN scheme was greater than that of the BULK scheme at all altitudes. Generally, the vertical profiles of cloud water, snow, and ice crystals simulated by the BULK and BIN schemes exhibited marked differences.

FIGURE 11. Average vertical profiles of the mixing ratio (unit: 10–2 g kg−1) for cloud hydrometeors from 2000 UTC on February 12 to 1600 UTC on February 13, 2022, for the BULK and BIN simulations.
Surface precipitation is formed by cloud particles falling to the ground. According to the above analysis, the precipitation particles in this snowfall event were mainly ice-phase particles. Therefore, it is important to determine how the ice-phase particles were generated, how they evolved within the cloud, what specific transformation processes occurred, and which were the main processes involved. Because transformations of cloud particles involve latent heating or cooling processes, the results discussed above indicate that differences exist in the representation of these latent heating or cooling processes between the BULK and BIN schemes. Consequently, this section analyzes the processes related to ice crystal and snow conversion, and the overall cloud microphysical processes of heating or cooling.
Figure 12A shows the average vertical profiles of the conversion rates of ice-crystal- and snow-related cloud microphysical transformation terms simulated by the BULK and BIN schemes. The specific meanings of each transformation term are listed in Tables A1, A2. The figure shows that ice first formed at heights of 4–7.5 km through ice nucleation (Pigen), and that the ice crystals grew mainly through deposition (Pidep), i.e., the main process of ice crystal growth, and that this process mainly occurred below 5 km, with a peak at approximately 1.3 km. The ice crystals grew continuously through collision and collection. When the ice crystals reached a larger size, they were converted into snow through autoconversion (Psaut). Therefore, the profile shape of Psaut is similar to that of Pidep, but the height is much lower and the peak is below 1 km. The snow crystals then grew through the processes of deposition (Psdep) and accretion of ice crystals by snow (Psaci), both of which occurred at heights below 5 km, i.e., below the Psaut profile, because both processes occurred only after the snow crystals were produced. In contrast, snow and ice crystals in the BIN simulation were mainly generated from four microphysical processes, i.e., deposition growth of ice crystals and snow (Pidep and Psdep) and accretion of ice crystals and cloud water by snow (Psaci, Psacw). At the height of the −38°C level, the ice-phase particles in the BIN scheme were mainly produced by ice crystal deposition, whereas in the BULK scheme, they were mainly produced by ice nucleation. Between the −20 and −10°C levels, the ice-phase particles in the BIN scheme were mainly produced by the deposition of snow, whereas they were mainly generated by the deposition of ice crystals in the BULK scheme.
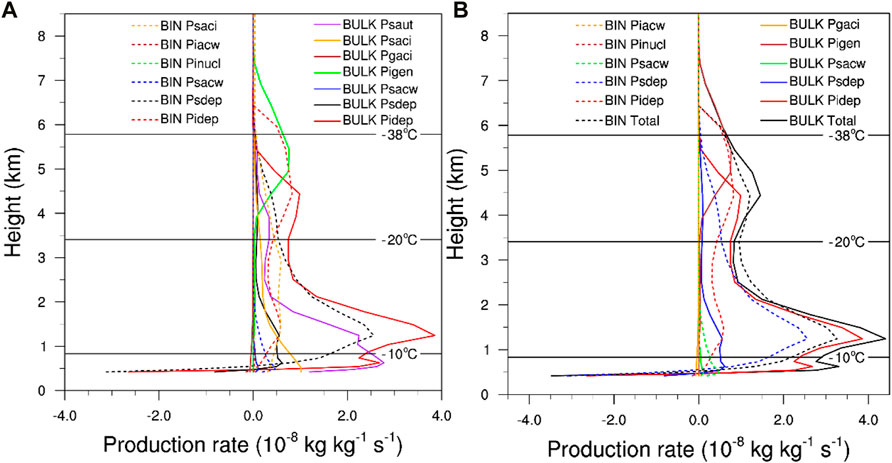
FIGURE 12. Average vertical profiles of production rates of microphysical processes (unit: 10–8 kg kg−1 s−1) from 2000 UTC on February 12 to 1600 UTC on February 13, 2022 for the BULK and BIN simulations: (A) ice-crystal- and snow-related source and sink terms, and (B) budget profiles of microphysical conversion for ice crystals and snow combined.
Figure 12B shows the budgets of the conversion terms of the microphysical process for ice crystals and snow combined for the BULK and BIN simulations. From the source and sink terms of the snow and ice crystals, it can be seen that the overall net production rate of ice crystals and snow simulated by the BULK scheme was larger than that of the BIN scheme at levels below 2 km and above 4 km. In comparison with the BIN scheme, other than the peak in the net conversion rate at approximately 1.3 km, there was also a second peak at a height very close to the surface below 1 km. As can be seen from Figure 11, the simulation of the BULK scheme produced a smaller average snow content than that of the BIN scheme throughout the entire precipitation process, indicating that the BULK scheme simulates more surface precipitation and that the precipitation intensity is greater. One possible reason is that the peak value of each source term of snow in the BULK scheme was closer to the ground than that in the BIN scheme, which allowed snow to fall to the ground faster.
The heating process in cloud microphysics includes condensation, freezing, and deposition; conversely, evaporation, melting, and sublimation are considered cooling processes. Based on the methods used by Hjelmfelt et al. (1989), the average profiles of the latent heating for the BULK and BIN schemes are illustrated in Figure 13. It can be seen that the main latent heating terms in the BULK scheme are ice nucleation (Pigen), deposition of ice crystals and snow (Pidep and Psdep, respectively), and condensation growth of water vapor (Pcond), while those in the BIN scheme are similar. Below the height of 2 km, the latent heat released by cloud microphysical processes in the BULK scheme is larger than that released in the BIN scheme, whereas the converse is true at heights above 2 km.
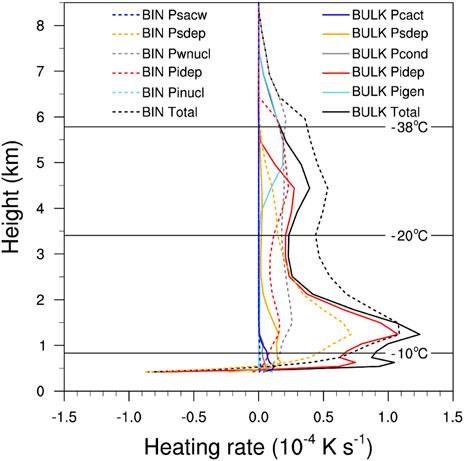
FIGURE 13. Average profiles of latent heating and cooling rates (unit: 10–4 K s−1) for various microphysical processes from 2000 UTC on February 12 to 1600 UTC on February 13, 2022, for the BULK and BIN simulations.
To investigate the simulation capability of the BIN and BULK microphysical schemes for winter precipitation events and their differences, we used the WRF regional numerical model with the BULK and BIN schemes to simulate a snowfall event that occurred in Beijing during the Winter Olympic Games on February 12-13, 2022. The simulations using the two schemes broadly reproduced the spatiotemporal evolution characteristics of the precipitation event. Based on the refined simulation results, the outputs of the BULK and BIN schemes were further investigated to analyze the differences in precipitation, radar reflectivity, and cloud microphysical processes of the heavy snowfall event dominated by cold cloud processes in winter. The differences between the BULK and BIN simulations are summarized into the conceptual models in Figure 14, and the detailed conclusions are as follows.
(1) The heavy snowfall event in the Beijing area during February 12-13, 2022, mainly occurred against the background of an upper-level cold vortex, formed under the combined favorable conditions of an upper-level jet at 200 hPa and a low-level vortex at 850 hPa. From the soundings and surface temperature field, it was established that the overall air temperature over the Beijing area was <0°C; thus, the surface precipitation was dominated by solid precipitation particles.
(2) The 24-h accumulated precipitation simulated by the BULK scheme was greater than that simulated by the BIN scheme, but both were smaller in comparison with the observations. For regional average hourly precipitation, although the BULK and BIN schemes both broadly reproduced the precipitation evolution, they underestimated the precipitation with a 1-2-h lag in the early and middle period of the precipitation event (i.e., from 2200 UTC on February 12 to 0700 UTC on February 13, 2022), and in the period of heavy precipitation (i.e., from 0200 to 0700 UTC on February 13, 2022). The precipitation simulated by the BIN scheme showed a pattern of more symmetrical growth and weakening, which was closer to that of the observations than that produced by the BULK scheme. However, the BIN and BULK simulations both overestimated the precipitation in the weakening period (i.e., from 0800 to 1800 UTC on February 13, 2022). Additionally, comparison of the radar reflectivity horizontal distributions, vertical cross sections, and time–height contours revealed that the radar reflectivity simulated by the BIN scheme was generally closer than that simulated by the BIN scheme to that of the observations.
(3) Comparative analysis of the maximum/minimum vertical velocities and water vapor between the BULK and BIN schemes revealed that the maximum upward and downward velocities simulated by the BIN scheme were substantially stronger than those of the BULK scheme, and that the difference between them was greater when the temperature was greater than −38°C (i.e., below 5.8 km), indicating stronger upward motion and more vigorous convection in the BIN scheme. The water vapor content of the BIN scheme was markedly higher than that of the BULK scheme at heights from the −10 to −20°C levels and above the −38°C level, possibly because the BULK scheme converts more water vapor into cloud particles through various cloud microphysical processes in comparison with that converted by the BIN scheme.
(4) The vertical distribution of cloud particles simulated by the BULK and BIN schemes differed substantially, with the BIN scheme simulating much more cloud water and snow than the BULK scheme, and the BULK scheme simulating more snow than the BIN scheme at most altitudes below 5 km. Although the vertical profile of IWC for the two schemes showed similar evolution trends, the IWC simulated by the BIN scheme was larger.
(5) By analyzing the conversion rate and the latent heating of the cloud microphysical processes in the BULK and BIN schemes, it was found that nucleation of ice crystals in the middle and upper layers of the BULK scheme was notable but not as obvious as that in the BIN scheme. The net production rate of ice crystals and snow combined, as simulated by the BULK scheme, was stronger nearer the surface than that simulated by the BIN scheme. Moreover, a second peak in the conversion rate existed at heights very close to the surface below 1 km, which might account for the greater intensity of precipitation in the BULK scheme. Below the height of 2 km, the BULK scheme simulated greater latent heating than that simulated by the BIN scheme, whereas the converse was true at heights above 2 km.
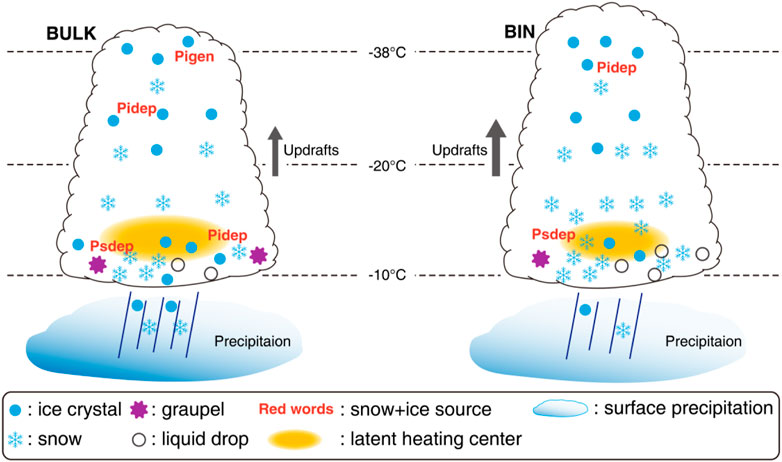
FIGURE 14. Schematic depicting the differences in the simulations between the BULK and BIN schemes.
The descriptions of cloud microphysical processes by the BULK and BIN schemes, and by some other multimoment schemes, include certain assumptions and therefore have specific advantages and shortcomings. Consequently, it is very important to undertake detailed comparison and analysis of different cloud microphysical schemes in different applications to improve the understanding and applicability of such schemes (Li et al., 2009a). Previous comparison of the BULK and BIN schemes has mainly focused on strong convection in summer; however, this study focused on their applicability to a snowfall event that occurred in winter. It is expected that the findings of this study will provide a better understanding of the differences between the BULK and BIN schemes with regard to the simulation of microphysical processes during weak convection in winter, and serve as reference for improvement of the BULK and/or BIN schemes. However, this study was based on the results obtained from a single case, which means that our findings are preliminary and case-dependent, and that further simulation studies of other cases will be needed to validate our results. Furthermore, detailed analyses and sensitivity experiments should also be performed to investigate the mechanisms responsible for the distinctive differences between the results produced by the BULK and BIN schemes. Finally, obtaining more detailed observations, especially those that can reveal information within clouds, e.g., aircraft observations and satellite-based cloud radar (Morrison et al., 2020), which can be used in combined with high-resolution numerical simulations, will form an essential part of the continued improvement of cloud microphysical parameterization schemes.
The raw data supporting the conclusion of this article will be made available by the authors, without undue reservation.
YL designed the study and wrote the initial manuscript; JyL and FP discussed and contributed to the idea; LL improved the manuscript; JiL performed data analysis.
This research was funded by the National Key R&D Program of China (Grant number 2018YFC1506801), the Key Scientific and Technology Research and Development Program of Jilin Province (Grant number 20180201035SF), the Innovative Development Project of China Meteorological Administration (Grant number CXFZ2022J007), the National Natural Science Foundation of China (Grant number 41875077 and 42105013). Simulations were carried out on the Earth System Numerical Simulation Facility (EarthLab), which was supported by the National Key Scientific and Technological Infrastructure project.
The authors declare that the research was conducted in the absence of any commercial or financial relationships that could be construed as a potential conflict of interest.
All claims expressed in this article are solely those of the authors and do not necessarily represent those of their affiliated organizations, or those of the publisher, the editors and the reviewers. Any product that may be evaluated in this article, or claim that may be made by its manufacturer, is not guaranteed or endorsed by the publisher.
Changnon, S. A., and Changnon, D. (2006). A spatial and temporal analysis of damaging snowstorms in the United States. Nat. Hazards 37, 373–389. doi:10.1007/s11069-005-6581-4
Chen, F., and Dudhia, J. (2001a). Coupling an advanced land surface–hydrology model with the Penn State–NCAR MM5 modeling system. Part I: Model implementation and sensitivity. Mon. Weather Rev. 129, 569–585. doi:10.1175/1520-0493(2001)129<0569:caalsh>2.0.co;2
Chen, F., and Dudhia, J. (2001b). Coupling an advanced land surface–hydrology model with the Penn State–NCAR MM5 modeling system. Part II: Preliminary model validation. Mon. Weather Rev. 129, 587–604. doi:10.1175/1520-0493(2001)129<0587:caalsh>2.0.co;2
Chen, Y., Ping, F., Zhou, S., Shen, X., and Sun, Y. (2021). Influence of microphysical processes on the initiation of the mesoscale convective system of a rainstorm over Beijing. Atmos. Res. 254, 105518. doi:10.1016/j.atmosres.2021.105518
Dudhia, J. (1989). Numerical study of convection observed during the winter monsoon experiment using a mesoscale two-dimensional model. J. Atmos. Sci. 46, 3077–3107. doi:10.1175/1520-0469(1989)046<3077:Nsocod>2.0.Co;2
Fan, J., Leung, L. R., Li, Z., Morrison, H., Chen, H., Zhou, Y., et al. (2012). Aerosol impacts on clouds and precipitation in eastern China: Results from bin and bulk microphysics: Aerosol impacts on clouds. J. Geophys. Res. 117, 1–21. doi:10.1029/2011JD016537
Hjelmfelt, M. R., Roberts, R. D., Orville, H. D., Chen, J. P., and Kopp, F. J. (1989). Observational and numerical study of a microburst line-producing storm. J. Atmos. Sci. 46, 2731–2744. doi:10.1175/1520-0469(1989)046<2731:OANSOA>2.0.CO;2
Hong, S. Y., Noh, Y., and Dudhia, J. (2006). A new vertical diffusion package with an explicit treatment of entrainment processes. Mon. Weather Rev. 134, 2318–2341. doi:10.1175/mwr3199.1
Igel, A. L., and van den Heever, S. C. (2017). The role of the gamma function shape parameter in determining differences between condensation rates in bin and bulk microphysics schemes. Atmos. Chem. Phys. 17, 4599–4609. doi:10.5194/acp-17-4599-2017
Jiao, B., Ran, L., Shen, X., and Qi, Y. (2021). Trigger mechanism of a snow burst event in Northeast China. Atmos. Ocean. Sci. Lett. 14, 100017. doi:10.1016/j.aosl.2020.100017
Jiménez, P. A., Dudhia, J., González-Rouco, J. F., Navarro, J., Montávez, J. P., and García-Bustamante, E. (2012). A revised scheme for the WRF surface layer formulation. Mon. Weather Rev. 140, 898–918. doi:10.1175/MWR-D-11-00056.1
Kain, J. S. (2004). The Kain-Fritsch convective parameterization: An update. J. Appl. Meteorology 43, 170–181. doi:10.1175/1520-0450(2004)043<0170:Tkcpau>2.0.Co;2
Khain, A., and Lynn, B. (2009). Simulation of a supercell storm in clean and dirty atmosphere using weather research and forecast model with spectral bin microphysics. J. Geophys. Res. Atmos. 114, D19209. doi:10.1029/2009JD011827
Khain, A. P., Leung, L. R., Lynn, B., and Ghan, S. (2009). Effects of aerosols on the dynamics and microphysics of squall lines simulated by spectral bin and bulk parameterization schemes. J. Geophys. Res. Atmos. 114, D22203. doi:10.1029/2009JD011902
Khain, A., Pokrovsky, A., Pinsky, M., Seifert, A., and Phillips, V. (2004). Simulation of effects of atmospheric aerosols on deep turbulent convective clouds using a spectral microphysics mixed-phase cumulus cloud model. Part I: Model description and possible applications. J. Atmos. Sci. 61, 2963–2982. doi:10.1175/JAS-3350.1
Khain, A. P., and Pinsky, M. (2018). Physical processes in clouds and cloud modeling. 1st ed. Cambridge University Press. doi:10.1017/9781139049481
Li, N., Jiao, B., Ran, L., Shen, X., and Qi, Y. (2021). On the mechanism of a terrain-influenced snow burst event during midwinter in Northeast China. Adv. Atmos. Sci. 38, 800–816. doi:10.1007/s00376-020-0104-9
Li, X., Tao, W.-K., Khain, A. P., Simpson, J., and Johnson, D. E. (2009a). Sensitivity of a cloud-resolving model to bulk and explicit bin microphysical schemes. Part I: Comparisons. J. Atmos. Sci. 66, 3–21. doi:10.1175/2008JAS2646.1
Li, X., Tao, W.-K., Khain, A. P., Simpson, J., and Johnson, D. E. (2009b). Sensitivity of a cloud-resolving model to bulk and explicit bin microphysical schemes. Part II: Cloud microphysics and storm dynamics interactions. J. Atmos. Sci. 66, 22–40. doi:10.1175/2008JAS2647.1
Li, Y., Li, J., Ping, F., and Gao, Z. (2022). Influence of the terminal velocity of graupel on the simulation of a convective system over Beijing. Atmos. Res. 274, 106181. doi:10.1016/j.atmosres.2022.106181
Lim, K.-S. S., and Hong, S.-Y. (2010). Development of an effective double-moment cloud microphysics scheme with prognostic cloud condensation nuclei (CCN) for weather and climate models. Mon. Weather Rev. 138, 1587–1612. doi:10.1175/2009MWR2968.1
Lin, W., and Bueh, C. (2006). The cloud processes of a simulated moderate snowfall event in North China. Adv. Atmos. Sci. 23, 235–242. doi:10.1007/s00376-006-0235-7
Liu, X., He, H., Chen, Y., Gao, Q., Wang, Y., and Yang, Y. (2022). Numerical simulation studies of atmospheric hydrometeor transportation characteristics and snowfall microphysical mechanism during a snowfall system in beijing. Chin. J. Atmos. Sci. (in Chinese) 46, 507–519. doi:10.3878/j.issn.1006-9895.2110.20212
Lynn, B. H., Khain, A. P., Dudhia, J., Rosenfeld, D., Pokrovsky, A., and Seifert, A. (2005). Spectral (bin) microphysics coupled with a mesoscale model (MM5). Part II: Simulation of a CaPE rain event with a squall line. Monthly Weather Review 133, 59–71. doi:10.1175/MWR-2841.1
Mlawer, E. J., Taubman, S. J., Brown, P. D., Iacono, M. J., and Clough, S. A. (1997). Radiative transfer for inhomogeneous atmospheres: RRTM, a validated correlated-k model for the longwave. Journal of Geophysical Research Atmospheres 102, 16663–16682. doi:10.1029/97JD00237
Morrison, H., van Lier-Walqui, M., Fridlind, A. M., Grabowski, W. W., Harrington, J. Y., Hoose, C., et al. (2020). Confronting the challenge of modeling cloud and precipitation microphysics. J Adv Model Earth Syst 12, e2019MS001689. doi:10.1029/2019MS001689
Skamarock, W. C., Klemp, J. B., Dudhia, J., Gill, D. O., Liu, Z., Berner, J., et al. (2019). A description of the advanced research WRF model version 4. Boulder, CO, USA: National Center for Atmospheric Research, 145. doi:10.5065/1dfh-6p97
Sun, J., Wang, H., Yuan, W., and Chen, H. (2010). Spatial-temporal features of intense snowfall events in China and their possible change. Journal of Geophysical Research Atmospheres 115, D16110. doi:10.1029/2009JD013541
Wang, C., Liu, H., and Lee, S.-K. (2010). The record-breaking cold temperatures during the winter of 2009/2010 in the Northern Hemisphere. Atmospheric Science Letters 11, 161–168. doi:10.1002/asl.278
Wang, D., Yin, J., and Zhai, G. (2015). In-situ measurements of cloud-precipitation microphysics in the East Asian monsoon region since 1960. J Meteorol Res 29, 155–179. doi:10.1007/s13351-015-3235-7
Wang, S., Ping, F., Meng, X., and Li, Y. (2022). Numerical simulation of a large-scale snowstorm process in northern China using different cloud microphysical parameterization schemes. Chinese Journal of Atmospheric Sciences (in Chinese) 46, 599–620. doi:10.3878/j.issn.1006-9895.2107.21064
Xu, H., and Duan, Y. (1999). Some questions in studying the evolution of size distribution spectaum of hydrometeor particles. Acta Meteorologica Sinica (in Chinese) 57, 451–460.
Yin, J., Wang, D., and Zhai, G. (2011). Long-term in situ measurements of the cloud-precipitation microphysical properties over East Asia. Atmospheric Research 102, 206–217. doi:10.1016/j.atmosres.2011.07.002
Yin, L., Ping, F., and Mao, J. (2017). A comparative study between bulk and bin microphysical schemes of a simulated squall line in East China: Comparative research between bulk and bin microphysical scheme. Atmos. Sci. Lett 18, 195–206. doi:10.1002/asl.742
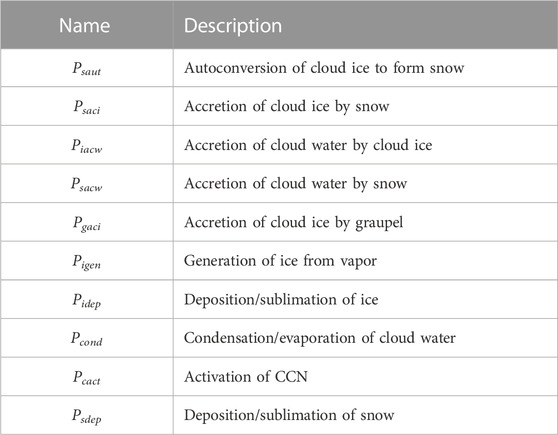
TABLE A1. Description of the main microphysical processes in WDM6 scheme.
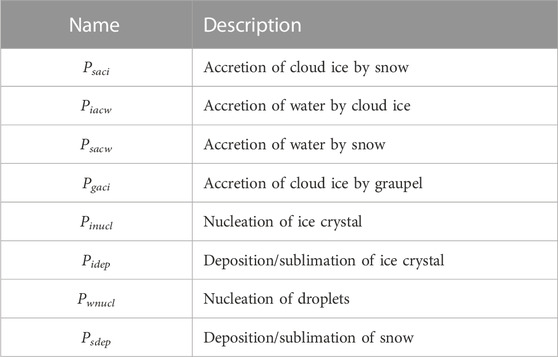
TABLE A2. Description of the main microphysical processes in HUJI bin scheme.
Keywords: heavy snowfall, numerical simulation, microphysical scheme, bin, bulk
Citation: Li Y, Li J, Ping F, Li L and Li J (2023) Comparative study of bin and bulk microphysical schemes in simulating a heavy snowfall event that occurred in Beijing during the 2022 Winter Olympic Games. Front. Earth Sci. 11:1128672. doi: 10.3389/feart.2023.1128672
Received: 21 December 2022; Accepted: 29 March 2023;
Published: 07 April 2023.
Edited by:
Youcun Qi, Institute of Geographic Sciences and Natural Resources Research, Chinese Academy of Sciences (CAS), Beijing, ChinaReviewed by:
Zhai Guoqing, Zhejiang University, ChinaCopyright © 2023 Li, Li, Ping, Li and Li. This is an open-access article distributed under the terms of the Creative Commons Attribution License (CC BY). The use, distribution or reproduction in other forums is permitted, provided the original author(s) and the copyright owner(s) are credited and that the original publication in this journal is cited, in accordance with accepted academic practice. No use, distribution or reproduction is permitted which does not comply with these terms.
*Correspondence: Fan Ping, cGluZ2ZAbWFpbC5pYXAuYWMuY24=
Disclaimer: All claims expressed in this article are solely those of the authors and do not necessarily represent those of their affiliated organizations, or those of the publisher, the editors and the reviewers. Any product that may be evaluated in this article or claim that may be made by its manufacturer is not guaranteed or endorsed by the publisher.
Research integrity at Frontiers
Learn more about the work of our research integrity team to safeguard the quality of each article we publish.