 Zhi Tang*
 Hao Wu
95% of researchers rate our articles as excellent or good
Learn more about the work of our research integrity team to safeguard the quality of each article we publish.
Find out more
ORIGINAL RESEARCH article
Front. Earth Sci. , 21 March 2023
Sec. Economic Geology
Volume 11 - 2023 | https://doi.org/10.3389/feart.2023.1126120
This article is part of the Research Topic Mechanics and Seepage Behaviors of Deep Reservoir Rocks View all 7 articles
Many field observations have found that damage to the support did not increase with the magnitude of the impact ground pressure. To enhance the impact protection performance of “support and surrounding rock” system. From the perspective of preventing the resonance of the “support and surrounding rock” system, the dynamic response of energy-absorbing and anti-scouring column is studied. Using the block theory, a dynamic model of the roadway enclosure-absorbing anti-scouring column under impact loading was established, and the dynamic response equation of the rock block at the support end was obtained. Based on the structural dynamics and Love shell theory, the characteristic equations of the energy-absorbing and anti-scouring column were derived, and the theoretical equations for the natural frequency and vibration mode function of the energy-absorbing and anti-scouring column were obtained. The ABAQUS numerical simulation method was used to carry out pre-stress modal analysis and harmonious response analysis of energy-absorbing and anti-scouring columns and conventional columns. We obtained the natural frequencies and vibration modes of the two columns and analyzed the effect of the setting load on the modalities of the columns. The column dynamic response law was determined by monitoring the displacement and velocity response curves at different positions. The results show that the natural frequency and vibration mode of the energy-absorbing and anti-scouring column are related to the density, elastic modulus, and length. The vibration of the energy-absorbing and anti-scouring column has two forms: beam vibration mode and cylindrical shell vibration mode, and the first four orders of vibration mode are transverse bend. The setting load has a small effect on the natural frequency and vibration mode of both types of columns, where the natural frequency decreases as the setting load increases. When the excitation frequency is close to the vibration frequency of the surrounding rock, the radial, axial, and circumferential response amplitudes of the primary and secondary columns of the energy-absorbing and anti-scouring column are the largest. Reinforcement and strengthening measures should be implemented to reduce the column deformation amplitude.
The rock-burst dynamic hazard in coal mines becomes more and more serious with an increase in mining depth. The control of the deep roadway envelope is one of the key tools for deep mining (Qi et al., 2020). The coordinated role of support and roadway envelope is the core problem in controlling the deformation of deep roadway envelope (Pan et al., 2003). It was found that in addition to the inadequate strength of the support, another reason for the damage of the support in impacted ground pressure roadways is the heavy vibration of the support-rock system. The large acceleration generated by vibration makes the surrounding rock repeatedly impact the support. The surrounding rock is broken. The support is no longer in close contact with the surrounding rock, and the support fails or is damaged due to vibration, which eventually leads to the destabilization of the support-rock system (Wu et al., 2018; Chen et al., 2019). Therefore, the roadway support under a rock burst should not only have a high strength to resist the impact of strong loads but also good overall stability and ability to resist vibration loads.
Field observations showed that damage to the support did not increase with the magnitude of the rock burst. The Laohu Terrace Mine experienced impact ground pressure in August 2015 in the lower part of the F25 fault. A microseismic magnitude of 4.4 was recorded, and strong tremors were felt at the working face but without damage to the whole mine. In September 2017, a rock burst occurred in the area of 160–180 m in the wind flow back down in the channel east of the 58008-3 open cut. A microseismic magnitude of 2.6 was recorded, with 100–200 mm floor heave occurring in the roadway. The reasons are related not only to the distance of the source point from the bracket but also to the frequency of the shock wave and the natural frequency of the bracket when the shock occurs. When the vibration frequency of rock burst is close to the natural frequency of the support, even small magnitudes of rock burst can produce large-impact damage. The large acceleration generated by vibration makes the surrounding rock repeatedly impact the support. The characteristics of the rock-burst pressure loads acting on the surrounding rock and the dynamic response of the support are key to improving the impact resistance of the roadway (Jiang et al., 2005). Pan et al. (2020) concluded that the vibration frequencies of different types of rock burst acting on the support are different and classified the impact events into coal body release energy type, roof and floor release energy type, and fault envelope release energy type with dominant frequencies of 25–40, 10–25, and 1–10 Hz, respectively. Zhu et al. (2012) found, based on on-site microseismic monitoring data, that the energy of blast vibration signals is more concentrated at 375–500 Hz, and the energy of the rock-breaking signal is mostly concentrated in the frequency band of 0–125 Hz. Xu et al. (2022) believed that in the roadway of a rock burst, roadway support needs to consider the time–frequency characteristics of the impact load, improve the support strength along the impact load direction, and design scientific and reasonable impact strength to avoid resonance damage of the support. Niu and Liu (2014) studied the propagation and attenuation law of impact vibration waves in the rock-surrounding medium of the roadway and the response characteristics of the surrounding rock of the roadway when a rock burst occurs, providing a theoretical basis for the impact vibration wave propagation law. Guo et al. (2006) concluded that when the main frequency of the bursting vibration wave is close to the natural frequency of the building, even a small vibration will produce a powerful vibration effect, thus causing damage to the building. In terms of roadway support, most are designed according to quasi-static envelope pressure (Hou et al., 2022; Kang et al., 2015; Wang and Pang, 2016), and less research has been carried out on the response law of roadway support under dynamic action. The energy-absorbing and anti-scouring hydraulic support is anti-scouring support equipment designed for the problem of rock bursts in the roadway (Chen et al., 2019). The energy-absorbing and anti-scouring column is one of the key components, the dynamic response law of which has not yet been studied in depth. Therefore, in this paper, based on the dynamic model of the overburdened rock and support system of the discontinuous block system (Pan et al., 2012), the dynamics model of the roadway surrounding rock in energy-absorbing and anti-scouring columns is established. The dynamic response equations for an energy-absorbing and anti-scouring column under impact loading are obtained. Based on the wave propagation method and Love shell theory, characteristic equations for the natural frequencies of the cylindrical shell structure are obtained. Based on the finite element analysis software, ABAQUS, the modal analysis and the harmonic response analysis were carried out for the energy-absorbing and anti-scouring column and the conventional column. The dynamic response law of two types of columns is investigated and provides a reference for the design of an energy-absorbing and anti-scouring column.
For the roadway envelope-support system, the roadway is simplified to a block structure divided by weak surfaces (ranging from large faults to small joints) with soft mechanical properties. A body of coal rock in a discontinuous state, divided by fissures and cracks, is abstracted as a regular block. Abstraction of the part of the medium with soft mechanical properties between the coal rock masses is performed using a Kelvin model. Since the stiffness coefficient of the coal rock mass is much greater than the stiffness coefficient of its own weak structural surfaces (joints, fissures, and weak media in fractures), it can be considered a rigid body (Tang et al., 2015; Wang et al., 2014). The column is simplified as a spring-mass-damping system and is connected to the overlying rock mass with mass, mn; stiffness, kn; and damping, cn. Initially, the block is subjected to an impact load of f(t), and the viscous elastomer between the rock blocks will deform to a certain extent under the block’s own gravity and reach static equilibrium. The dotted line in Figure 1 shows the static equilibrium position. It is assumed that the displacement of the ith rock mass due to the deformation of the viscoelastic body at the time of reaching static equilibrium is δi. The differential equation for the dynamic response of the roadway surrounding rock energy-absorbing and anti-scouring column system under impact load f(t) is as follows:

FIGURE 1. Dynamics model of surrounding rock-column system in the roadway.
where
where
Based on the conditions of static equilibrium, it follows that:
Equation 2 is substituted in Eq. 1 to obtain:
Equation 3 can be expressed as
Equation 4 can be written as
where
Under the initial shock load perturbation f(t), the solution to Eq. 3 is
where Φ is the matrix tensed by the generalized eigenvectors of an asymmetric real matrix B−1A of order 2n in the state space. That is,
The displacement, velocity, and acceleration responses of the rock mass at the support end are solved as
Analysis of the natural frequency and natural vibration pattern of the energy-absorbing and anti-scouring column is used to determine the inherent dynamic characteristics. The energy-absorbing and anti-scouring column is simplified to a pole model, and the one-dimensional fluctuation equations are used to solve for the natural frequency and vibration functions of the energy-absorbing and anti-scouring column. It is assumed that the material of the energy-absorbing and anti-scouring column is a continuous, homogeneous, isotropic linear elastomer. The one-dimensional fluctuation equation for its longitudinal free vibration is
where u (x,t) is the longitudinal displacement of the section on the pole at the point x from the origin at moment t, ρ is the density, E is the modulus of elasticity, and a0 is the velocity of the elastic longitudinal wave as it propagates along the pole’s longitudinal direction. Assuming synchronous movement of the points of the column,
where Φ(x) is the longitudinal vibration amplitude of the section of the column at x from the origin and q(t) is the modal coordinate. Substituting Eq. 10 into Eq. 8 gives
where substituting Eq. 12 into Eq. 11 gives
The general solution of Eq. 12 is
where c1, c2, and ω are determined by the boundary conditions of the pole. The principal vibration of the ith order is
The free vibration of a system is the superposition of an infinite number of principal vibrations. The vibration function of the column is
Assuming that the boundary conditions of the column are poles fixed at both ends, the boundary conditions are
Here, q(t) cannot be constantly zero.
The natural frequency and vibration function can be obtained as
Since the zero natural frequency corresponds to a zero vibration function, the zero natural frequency is removed.
The dynamic coupling between the surrounding rock and the column under impact loading can be found by Eq. 1. Further analysis shows that the dynamic response of the rock-column system is related to its stiffness, deformation, damping, mass, and external loads. The dynamic response of the column is related to its modulus of elasticity, density, and length, as can be seen from Eq. 20. The aforestated analysis provides the theoretical basis for the design of the column parameters.
In addition to the simplification of the column into a pole model, the structure of the energy-absorbing device, the primary cylinder and the secondary cylinder have the characteristics of a cylindrical shell structure. Its vibration forms are not only beam vibration modes in the length direction but also plate and shell vibration modes in the circular section (Yu et al., 2021). The natural frequencies and vibration modes are also worth investigating. Solving for natural frequencies and vibration modes of cylindrical shell structures is performed using the wave propagation method. For a cylindrical shell structure with a thickness of h, a radius of R in the middle plane, and a length of L, the reference surface is located on its middle surface. Using the column coordinate system (x, θ, z), the x coordinate is taken from the axial direction of the shell, and the θ and z coordinates are the circumferential and radial directions of the shell, respectively, as shown in Figures 2. u, v, and w are displacement functions in the x, θ, and z directions, respectively.
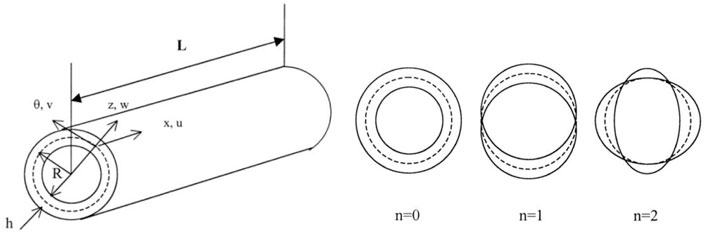
FIGURE 2. Coordinate system and circumferential modal shapes.
The equilibrium equation for a cylindrical shell using Love’s theory can be written as
where N and M are the force and moment resultants defined as
For thin-walled cylindrical shells, the stresses and strains in the thickness direction are not considered in Eq. 22, and the intrinsic structure relationship is as follows:
where σx, σθ, and σxθ are x-directional positive stress, θ-directional positive stress, and xθ-directional tangential stress, respectively. ex, eθ, and exθ are the strains in the x and z directions and the tangential strain at distance z from the reference surface, respectively. According to Love’s first approximation theory, the strain component in Eq. 23 is defined as a linear function of the thickness coordinate z as follows:
where e1, e2, and γ are the strains on the reference surface, and k1, k2, and τ are the curvatures of the reference surface. Both the reference surface strain and curvature are defined as follows:
By substituting Eqs. 24, 25 into Eq. 23, and then substituting the resulting equation into Eq. 22, the force and moment results can be obtained as
where Aij, Bij, and Dij are the extensional, coupling, and bending stiffness defined, respectively, as
According to the generalized Hooke’s law, the components of the matrix of intrinsic relations are
where E and ν are Young’s modulus and Poisson’s ratio of the shell material, respectively. By substituting Eq. 26, with substitution of Eqs. 27, 28 into Eq. 21, the result can be written in a matrix form as
where Lij (i, j = 1, 2, 3) is the differential operator with respect to x and θ.
The fluid filled in the cylindrical shell satisfies the acoustic wave equation and the equation of motion of the fluid can be written in the cylindrical coordinate system (x, θ, and r) as
where t is the time, p is the acoustic pressure, and c is the sound speed of the fluid. The x and θ coordinates are the same as those of the shell, where the r coordinate is taken from the x-axis of the shell.
The displacement of the shell is expressed in terms of wave propagation, defined as
where Um, Vm, and Wm are the wave amplitudes in the x, θ, and z directions, respectively. ω is the circular driving frequency. u, v, and w are associated with the axial wavenumber, km, and the circumferential mode parameter, n.
The dynamic pressure of the fluid is given as
where Jn ( ) is the Bessel function of order n. km and kr are the axial and radial wavenumbers, respectively. The radial wavenumber kr is related to the axial wavenumber km by the usual vector relation (krR)2=Ω2(CL/Cf)2-(kmR)2, where Ω is the non-dimensional frequency, and CL and Cf are the sound speed of the shell and fluid, respectively.
To ensure that the fluid remains in contact with the shell wall, the fluid radial displacement and the shell radial displacement must be equal at the interface of the shell inner wall and the fluid. This coupling condition is then given as
where ρf is the density of the contained fluid, and the prime on the Jn ( ) denotes differentiation with respect to the argument krR.
Substituting Eq. 31 into Eq. 29, and taking into account the acoustic pressure on the inner wall of the shell and the coupling Eq. 34, we obtain the equation of motion of the coupled system in symmetric matrix form as
where Cij (i,j=1; 2,3) are the parameters from the Lij after they are operated with the x and θ. FL is the fluid-loading term due to the presence of the fluid acoustic field and is given by
Expansion of the determinant of the amplitude coefficients in Eq. 35 provides a system characteristic equation in the form
where F (km,ω) is a complex transcendental function, not a polynomial function as in the uncoupled situation. This characteristic function can be used to investigate the wave propagation and the natural frequency in the shell.
In the first case, the frequency ω is given, and Eq. 37 is reduced as
With Eq. 38, one can find the wavenumber km curve with the varying frequency ω.
Equation 37 is used to obtain the coupled natural frequencies of the finite shell filled with fluid. In this case, the wavenumber km is specific according to the appropriate boundary conditions of the shell. Equation 37 can then be written as
where both P1(ω) and P2(ω) are polynomial functions. For the sake of brevity, the coefficients are not given here. In the case of uncoupled analysis, FL=0. Equation 39 can be written as
Solving the abovementioned equation, one obtains three positive roots and three negative roots. The three positive roots are the coupled angular frequencies of the cylindrical shell in the axial, circumferential, and radial directions. The lowest of the three positive roots represents the flexural vibration, and the other two are in-plane vibrations.
Zhang et al. (2001a) studied the vibration characteristics of finite-length cylindrical shells in finite flow fields using the wave propagation method. It is considered that the axially propagating wavenumber is related to the boundary conditions at the ends of the cylindrical shell and that when the boundary conditions are fixed at both ends, km = (2 m+1)π/2.
In the case of coupling analysis, Eq. 39 is a non-linear transcendental equation. The frequency ω can be obtained by the iterative Newton method with a starting value ω0, which is taken from the frequency of the uncoupled mode.
The aforestated theoretical analysis illustrates the vibration response of the column from a one-dimensional perspective, while in the real world, the vibration of the column is multidimensional. The finite element software, ABAQUS, which is concerned with modal analysis and other functions, can effectively analyze the dynamic response of complex structures in three dimensions (Su et al., 2021; Li et al., 2021; Yang, 2021).
The energy-absorbing and anti-scouring column is composed of an energy-absorbing device, the primary column, the secondary column, and the extension section, which are modeled by ABAQUS. The design and model diagram are shown in Figure 3, and the parameters of the column are shown in Table 1. The materials of the cylinder, live column, and energy-absorbing device of the column are made of Q345 steel with a yield strength of 345 MPa, a modulus of elasticity of 210 MPa, and Poisson’s ratio of 0.28. The energy-absorbing device consists of a thin-walled cylinder and a variable-diameter compression mold. The thin-walled cylinder has an inner diameter of 160 mm, a wall thickness of 10 mm, and a height of 200 mm. The variable diameter mold has a diameter of 160 mm at the fine end and 190 mm at the coarse end, with a taper angle of 20° and a table height of 40 mm. The material for both parts is T700L, with a yield strength of 730 MPa, a modulus of elasticity of 210 MPa, and a Poisson’s ratio of 0.35. The mesh selection is from C3D8R. The contact between the parts is surface-to-surface, and the friction coefficient is taken as 0.25. The model is constrained to all degrees of freedom at two ends, and a 40.6 MPa load is applied to the internal surface of the cylinder. The step is set to load first, followed by the frequency step.
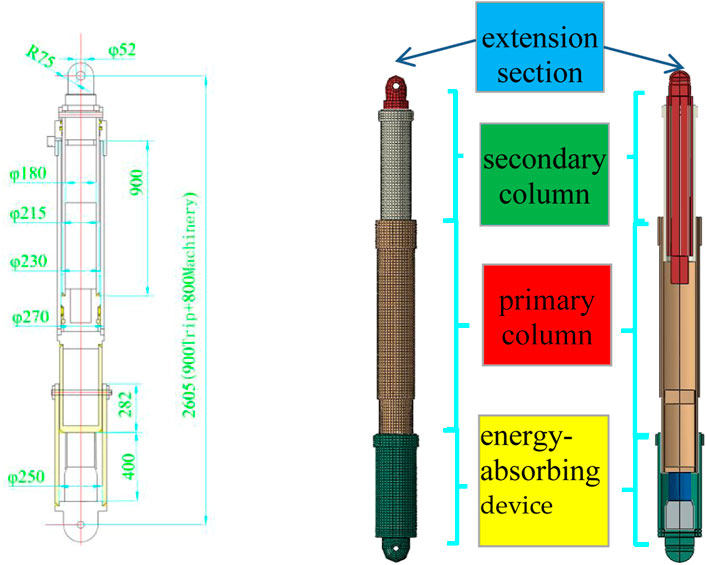
FIGURE 3. Design drawing and model of energy-absorbing and anti-scouring columns.
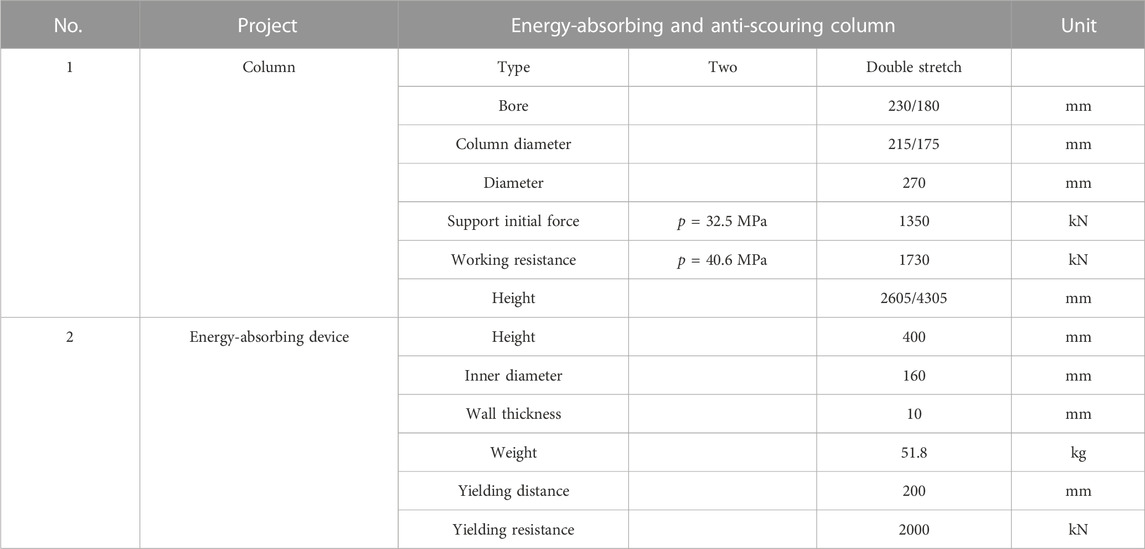
TABLE 1. Parameters of the energy-absorbing and anti-scouring column.
The modal analysis of a column under working resistance can be considered a modal analysis problem for a pre-stressed structure. The purpose of considering the static load applied to the structure is to obtain the stiffness matrix of the loaded structure for the modal analysis, and the variation of the stiffness matrix has an effect on the inherent frequency of the model. The energy-absorbing and anti-scouring column has a working resistance of 1730 kN (40.6 MPa), and a pressure of 40.6 MPa is applied to the surface of the primary column to simulate the operating pressure of the pumping station. Only the detailed positions of the columns are simplified in ABAQUS, ensuring that the analysis results are closer to the actual situation. To ensure that a sufficient number of modes are extracted in the frequency extraction analysis step, the judging criterion is that the movable mass in the main direction of motion accounts for more than 90% of the total effective mass, and some of the effective mass statistics are shown in Table 2. The total effective mass of the energy-absorbing and anti-scouring column model is 0.9347731t, with the effective mass of the model component in the y-direction accounting for 90.4% of the total mass (greater than 90%). Microseismic is a phenomenon that coal (rock) rupture around a shaft or working face with vibration energy greater than 100 J and a frequency of 0.1 Hz–150 Hz. The National Standard of the People’s Republic of China on Methods for the Determination, Monitoring, and Prevention of Impact Ground Pressure Part 4: Microseismic Monitoring Methods suggests that the frequency response range of microseismic sensors should cover 0.1 Hz–600 Hz. The low order mode of the energy-absorbing and anti-scouring column can reflect the dynamic performance of the structure, so 0–1,000 Hz (the first 15 orders) is chosen to study its natural frequency and vibration mode. The natural frequency and vibration mode are shown in Table 3, and the vibration mode diagrams are shown in Figure 4.
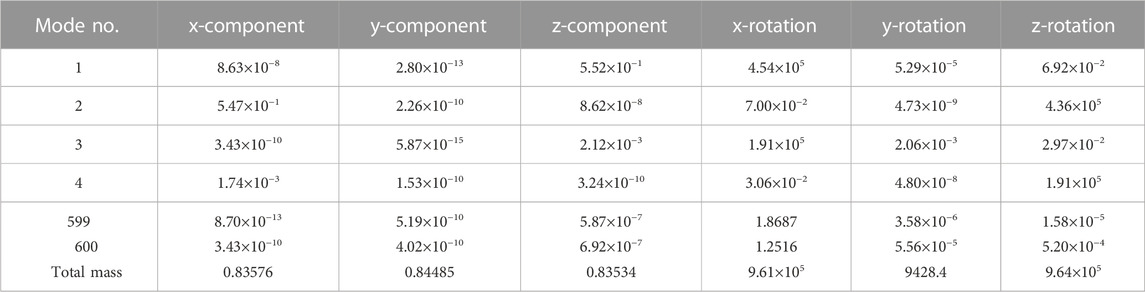
TABLE 2. Effective mass of the energy-absorbing and anti-scouring column.
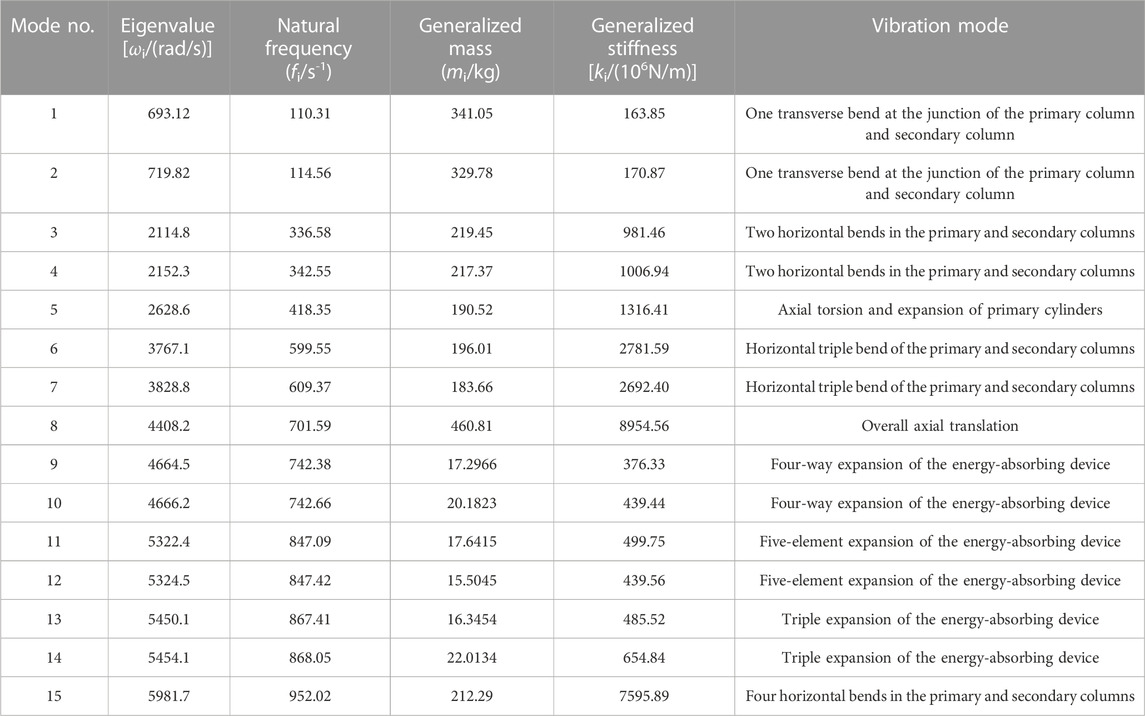
TABLE 3. Frequency and vibration mode for the first 15 orders of the energy-absorbing and anti-scouring column.
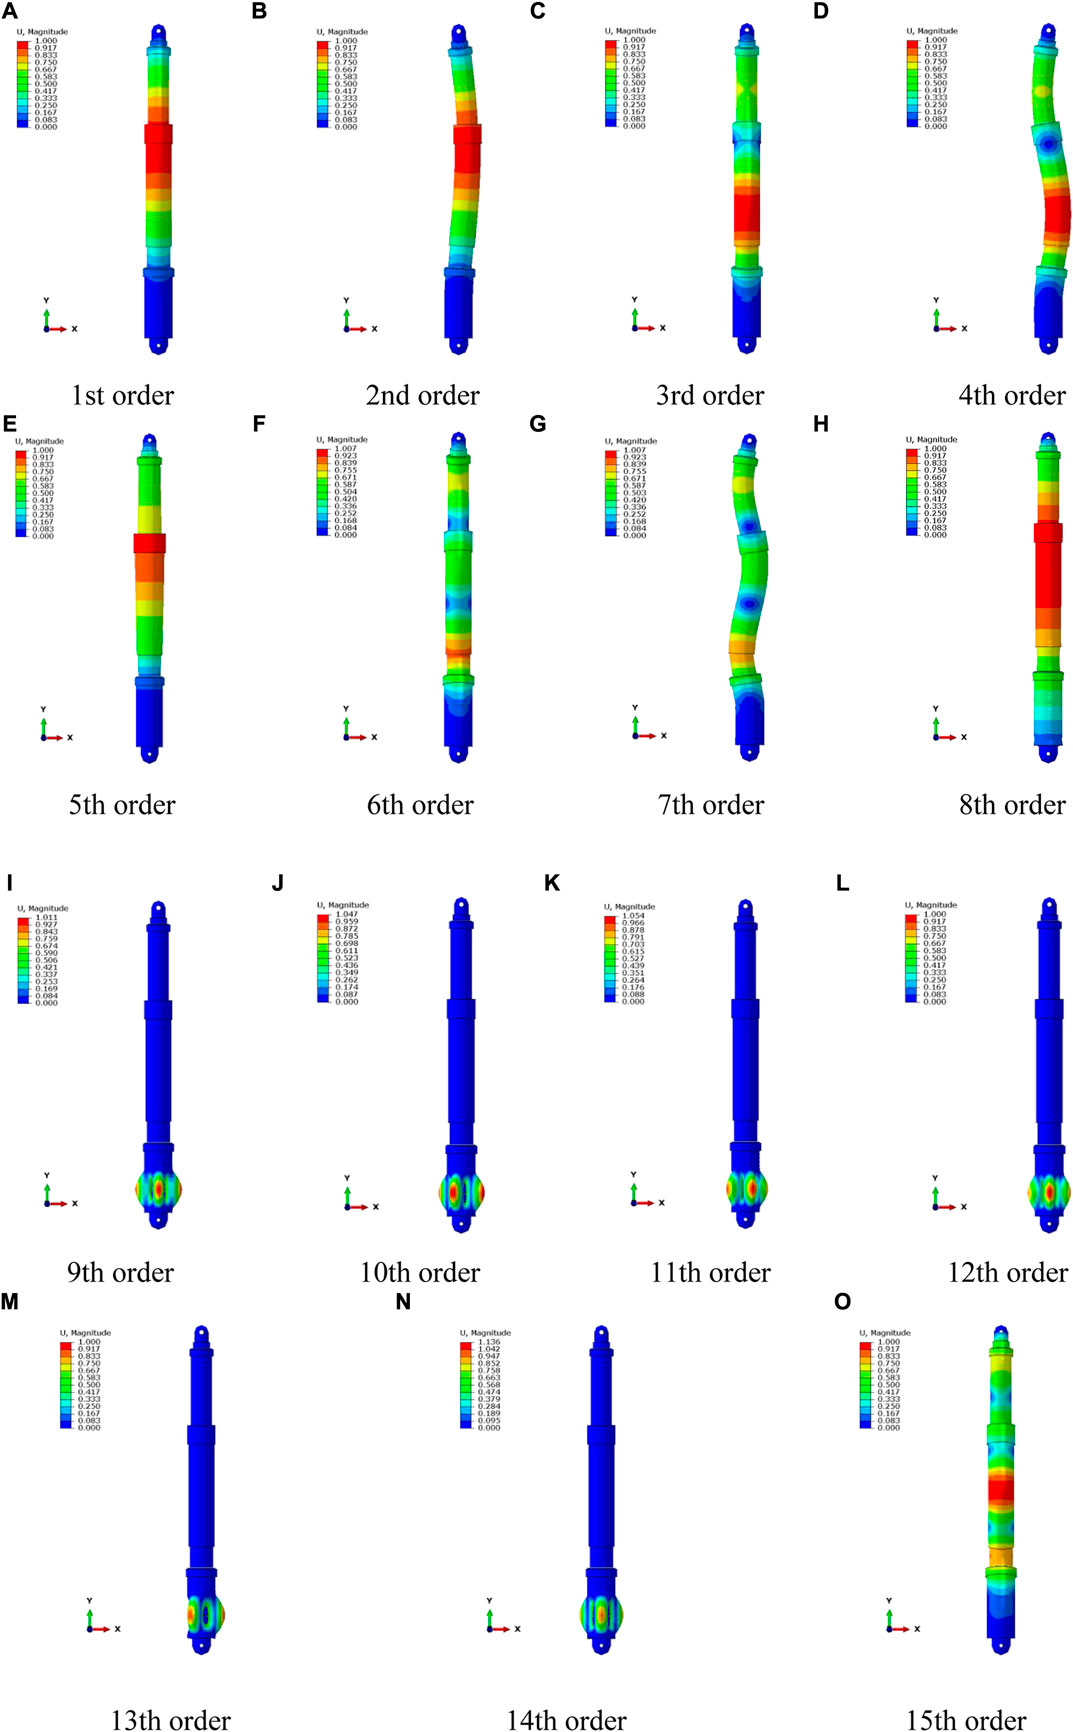
FIGURE 4. (Continued.) Vibrational model of the first 15 orders of the energy-absorbing and anti-scouring column (A–O).
From Tables 1, 2 and Figure 4, it can be seen that
(1) The energy-absorbing and anti-scouring column is dominated by flat movements in three directions, and the extraction of the first 600 orders of modal numbers ensures that there are sufficiently accurate modal frequency results.
(2) The first four orders of natural frequencies of the energy-absorbing and anti-scouring column are 110.31, 114.56, 336.58, and 342.55 Hz, respectively. These four order frequencies are relatively close to the vibration frequency of the rock burst, especially the first two order modes. The fifth-order natural frequency is close to 400 Hz, and the sixth-order natural frequency is much higher than the vibration frequency of the rock burst and the microseismic monitoring range. Therefore, the focus should be on the deformation of the energy-absorbing and anti-scouring column at the first four orders of inherent frequency.
(3) In the first 15 vibrations, the deformation is mainly by transverse bending of the energy-absorbing and anti-scouring column and circumferential expansion of the energy-absorbing device. This is due to the fact that when the energy-absorbing device vibrates, there is not only a beam vibration mode in the length direction but also a plate and shell vibration mode in the circular section. When the frequency reaches the shell vibration mode, a cylindrical shell in-plane vibration pattern is excited. The first four orders of modal vibration are all transverse bending, and the column is easily destabilized and bent. It should be ensured that the column is not working in the environment near the first four order frequencies, or it will resonate and produce excessive amplitude.
(4) In the first 15 order vibration modes, the position of the energy-absorbing and anti-scouring column deformation occurs mainly in the primary column, the connection between the primary and secondary columns, and the energy-absorbing device. Therefore, the design of the columns requires reinforcement and structural optimization of the abovementioned locations to ensure that the columns have good stability in working conditions.
The magnitude of the setting force is relative to the working resistance of support and is related to the characteristics of the roof. There are no clear rules on the choice of setting force. Wang et al. (2017) considered that the setting force of the support is generally 0.75–0.85 times the strength of the support. Song et al. (2020) suggested that the setting force of the support be generally set at 50%–80% of the rated working resistance. Therefore, modal analyses were carried out for energy-absorbing and anti-scouring columns with setting forces of 50%, 60%, 70%, and 80% of the working resistance. The 1st-order vibration modes of the column at each setting force are shown in Figure 5. The frequencies and vibrations are shown in Table 4. The frequency–order curve is shown in Figure 6.
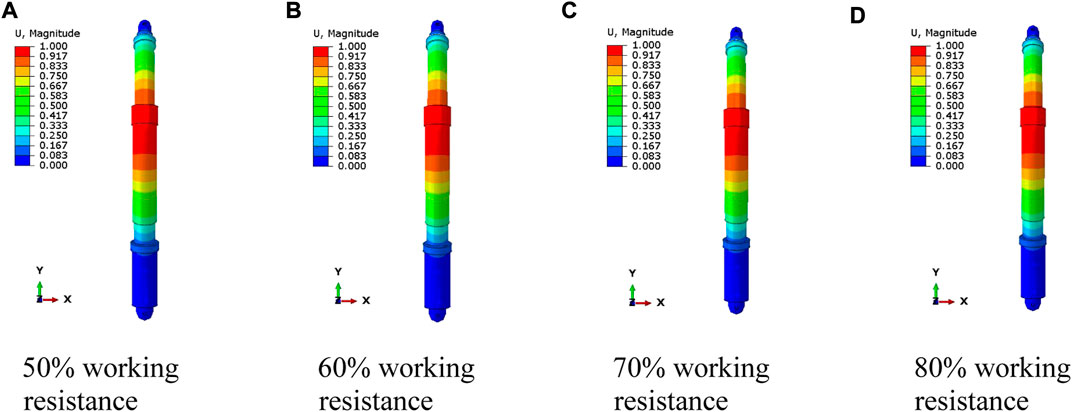
FIGURE 5. 1st-order vibration mode of column with different setting forces (A–D).
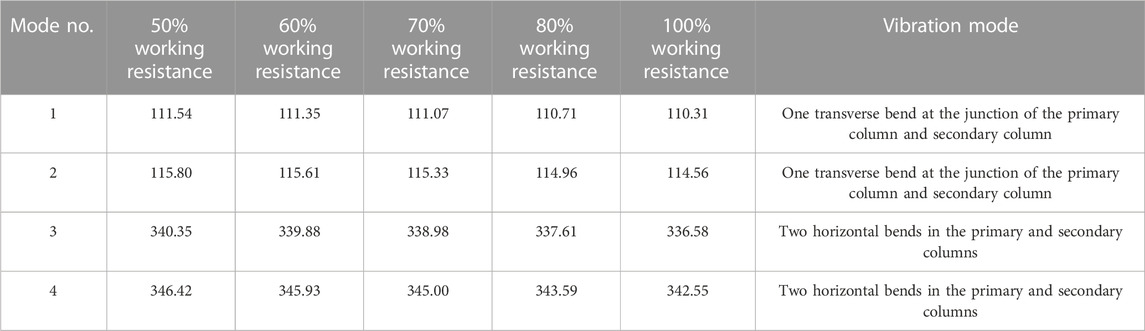
TABLE 4. Frequency and vibrational mode of the first 4th-order of column at different setting forces.
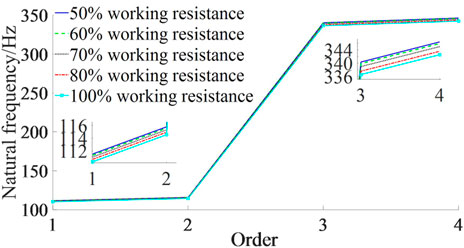
FIGURE 6. Natural frequency–order curves of column for different setting forces.
From Figures 5, 6 and Table 4 it can be seen that
(1) The vibration mode of the column is approximately the same from 1st to 4th order for different setting forces, indicating that the setting force does not change the vibration mode of the column.
(2) With different setting forces, the column’s 1st- to 4th-order intrinsic frequency varies in the same trend. It shows the rule that the 1st- and 2nd-order natural frequencies are similar, the 3rd- and 4th-order natural frequencies are similar, and the 2nd- and 3rd-order natural frequencies show a larger difference. It shows that increasing the initial bracing force has no effect on the variation rule of the column’s natural frequency.
(3) The 1st-order natural frequency for 50%, 60%, 70%, 80%, and 100% working resistance decreases gradually from 111.54 to 110.31 Hz. The 2nd-order natural frequency decreases gradually from 115.80 to 114.56 Hz; the 3rd-order natural frequency decreases gradually from 340.35 to 336.58 Hz, and the 4th-order natural frequency decreases gradually from 346.42 to 342.55 Hz. It is suggested that the same-order natural frequency of the column decreases as the setting force increases, but the decrease is small. The initial bracing force has almost no effect on the natural frequency of the energy-absorbing anti-scouring column.
The harmonic response analysis in ABAQUS needs to be set after the frequency step and the step set to steady-state dynamics. The sweep range is set to 1–2,000 Hz, and the critical attenuation fraction is taken as 0.05. Considering that the column is mainly under axial compression, a point at the top of the column is chosen as the excitation point. Load is along the axial direction of the column (y direction), and the magnitude is 1000 kN. The result obtained is related to the direction of the load, so as long as the direction of the load is determined, the frequency value corresponding to the response amplitude can be determined. The magnitude of load and position of the action point only changes the magnitude, not the frequency value corresponding to the magnitude. One monitoring point is at the connection between the energy-absorbing device and the primary column, and one is at the connection between the primary cylinder and the secondary column. One monitoring point is in the middle of the energy-absorbing device, primary column, and secondary column. The vibration response of the columns at critical locations is monitored. The monitoring points are located as shown in Figure 7. The amplitude response curves for the monitoring points are shown in Figure 8, and the velocity response curves are shown in Figure 9.

FIGURE 7. Layout of measurement points.
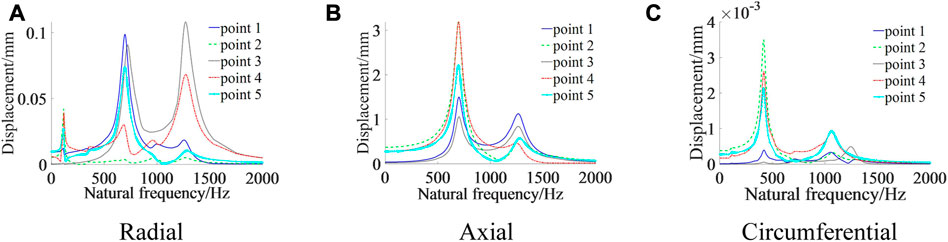
FIGURE 8. Displacement–frequency curve of the measurement point (A–C).
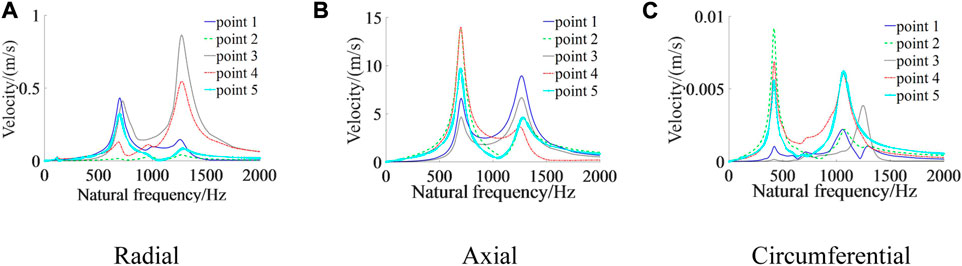
FIGURE 9. Velocity–frequency curve of the measurement point (A–C).
From Figures 7–9, it can be seen that
(1) In the radial direction, the displacement and velocity response curves for each measurement point produce peaks around 114 Hz, 700 Hz, and 1269 Hz, respectively. In the axial direction, the displacement and velocity response curves for each measurement point produce peaks around 700 Hz and 1260 Hz, respectively; in the circumferential direction, the displacement and velocity response curves for each measurement point produce peaks around 114 Hz, 417 Hz, and 1060 Hz, respectively. Comparing the modal analysis results, it can be seen that 114 Hz, 417 Hz, 700 Hz, 1060 Hz, and 1269 Hz are close to the 2nd-, 5th-, 8th-, 17th-, and 23rd-order natural frequencies of the column, respectively. This means that the amplitude response of the five measurement points is approximately the same in all three directions, and all have a sudden increase in amplitude at some order of the column’s natural frequency value.
(2) The magnitude of the harmonic response analysis is the relative value of each point, reflecting the relative motion of each position. Analysis of displacement and velocity amplitudes at each measurement point: in the radial direction, the maximum amplitude is found at the connection between the primary column and secondary cylinder when the excitation frequency is around 114 Hz. The maximum amplitude at the connection between the energy-absorbing device and the primary cylinder is around 700 Hz. The maximum amplitude at the energy-absorbing device is around 1269 Hz. In the axial direction, the excitation frequency is around 700 Hz, with the greatest amplitude at the connection between the primary cylinder and secondary column and at the midpoint of the primary column. Around 1260 Hz, the amplitude is greatest at the connection between the energy-absorbing device and the primary column. In the circumferential direction, the excitation frequencies are around 114 Hz and 417 Hz, with the greatest amplitude at the connection between the primary cylinder and secondary column. The amplitude is greatest around 1060 Hz at the midpoint of the secondary column. It shows that different positions on the column have different amplitudes and speeds of movement in the same direction and at different frequencies. At an excitation frequency close to 114 Hz (when the excitation frequency is close to rock-burst surrounding rock vibration frequency), the displacement and velocity at the connection between the primary cylinder and secondary column reach maximum values in the radial, axial, and circumferential directions. Therefore, reinforcement measures should be taken here to reduce the magnitude of column deformation and ensure that the columns can play a supporting role.
(3) Under axial excitation, the amplitude of the displacement and velocity response curves of the column in the three directions from largest to smallest are axial > radial > circumferential, respectively. The degree of dynamic response is greater in the axial direction, 10 times greater than in the radial direction, and 1,000 times greater than in the circumferential direction. It shows that when the axial excitation frequency is equal to the column’s natural frequency, the column deforms dramatically in the axial direction, followed by the radial direction, with less deformation in the circumferential direction.
The conventional column is composed of a primary column, secondary column, and extension sections, which are modeled by ABAQUS. The design and model diagram are shown in Figure 10, and the parameters of the column are shown in Table 5. The column and cylinder of the conventional column are made of Q345 steel with a yield strength of 345 MPa, a modulus of elasticity of 210 MPa, and a Poisson’s ratio of 0.28. The components are assembled according to the design drawings, the model is divided reasonably, and the mesh is selected from C3D8R. The contact between the components is surface-to-surface and the coefficient of friction is taken as 0.25. The model is constrained to all degrees of freedom at both ends and a load of 40.6 MPa is applied to the internal surface of the cylinder. The step is set to apply the load first, followed by frequency extraction.
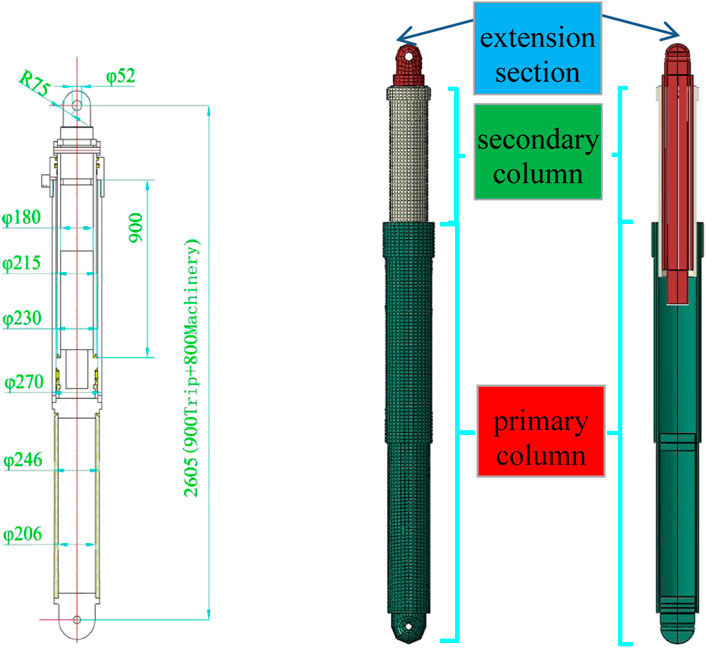
FIGURE 10. Design drawings and model drawings of the conventional column.

TABLE 5. Parameters of the conventional column.
Some of the effective mass statistics are shown in Table 6, the total effective mass of the conventional column model is 0.7910027t, and the effective mass of the model in the y-direction component accounts for 91.59% of the total mass (greater than 90%). The modal state of the conventional column, especially the low order modal state, can reflect the dynamic performance of the structure, so 0–1,000 Hz (the first 10 orders) was chosen to study its inherent frequency and vibration pattern. The inherent frequency is shown in Table 7, and the vibration pattern is shown in Figure 11.
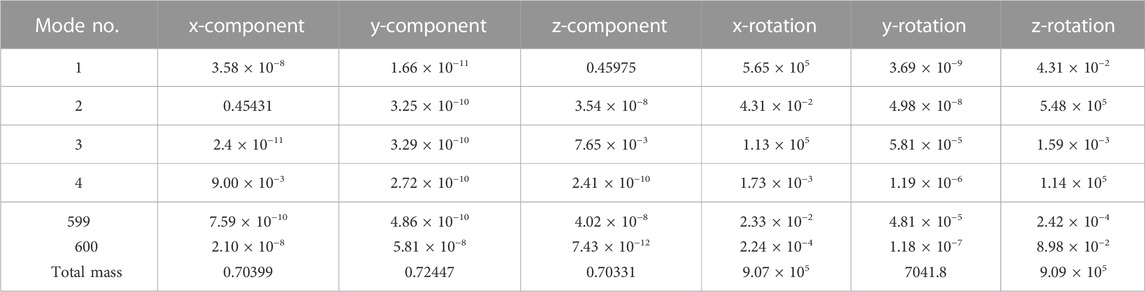
TABLE 6. Effective mass of conventional column.
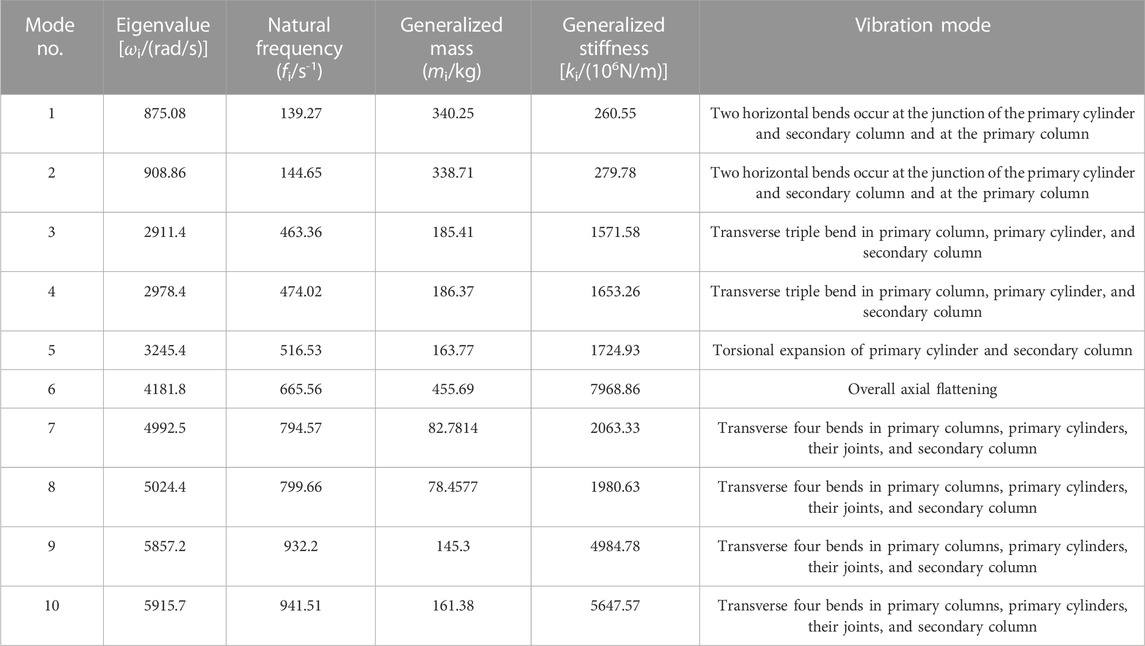
TABLE 7. Frequency and vibration mode for the first 10 orders of the conventional column.

FIGURE 11. Vibrational mode diagram for the first ten orders of the conventional column (A–J).
From Table 6, Table 7, and Figure 11, it can be seen that
(1) The conventional column is mainly moving flat in three directions, and the extraction of 600th-order modal numbers ensures that there are sufficiently accurate modal frequency results.
(2) The first 2nd-order natural frequencies of conventional columns are 139.27, 144.65, 463.36, and 474.02 Hz, respectively, which are closer to the vibration frequency when rock burst occurs, while the 3rd- and 4th-order natural frequencies are greater than 400 Hz, and the 5th-order natural frequencies are much higher than the vibration frequency and microseismic monitoring range when rock burst occurs. Therefore, we should focus on the deformation of conventional columns at the first 4th-order natural frequency.
(3) In the first 10 vibration modes of conventional columns, the main deformation mode is transverse bending, and only beam vibration modes are produced. The first four orders of vibration mode are all transverse bending, and unstable bending is easy to occur in the column. It should be ensured that the column does not work in the environment near the first 4th-order frequency, or it will resonate and produce excessive amplitude.
(4) In the first 10 orders of vibration mode of the conventional column, the deformation is mainly in the primary column, the primary cylinder, the connection between the primary cylinder and secondary column, and the secondary column. Therefore, in the design of the column, it is necessary to strengthen and optimize the structure of the above-mentioned locations to ensure that it has good stability in working conditions.
Modal analysis was carried out for conventional columns with setting forces of 50%, 60%, 70%, and 80% of working resistance. The 1st-order vibration pattern of the column at each initial bracing force is shown in Figure 12, the vibration frequency is shown in Table 8, and the frequency–order curve is shown in Figure 13.
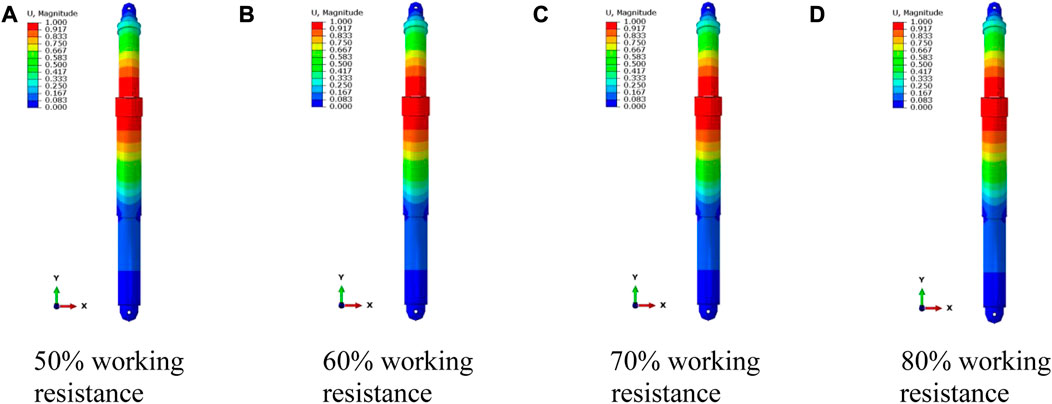
FIGURE 12. 1st-order vibration mode of column with different setting forces (A–D).
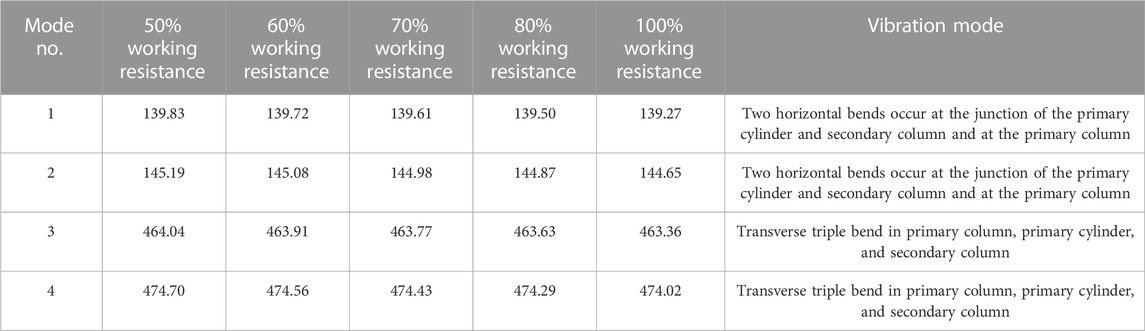
TABLE 8. Vibrational modes and frequencies of the first 4th-order for columns with different setting forces.
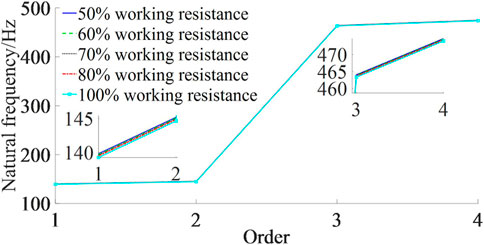
FIGURE 13. Column frequency–order curves for different setting forces.
From Figure 12, Figure 13, and Table 8, it can be seen that
(1) The vibration mode of the column is more or less the same from 1st- to 4th-order for different setting forces. This means that setting force does not change the vibration mode of the column.
(2) With different setting forces, the column’s 1st- to 4th-order natural frequencies change in the same trend, showing that the 1st- and 2nd-orders’ natural frequencies are similar, the 3rd- and 4th-orders’ natural frequencies are similar, and the 2nd- and 3rd-orders’ natural frequencies are more different. This indicates that increasing the setting force has no effect on the variation of natural frequencies.
(3) The first-order natural frequencies corresponding to 50%, 60%, 70%, 80%, and 100% working resistance decrease gradually from 139.83 to 139.27 Hz. The 2nd-order natural frequency decreases gradually from 145.19 to 144.65 Hz. The 3rd-order natural frequency decreases gradually from 464.04 to 463.36 Hz. The 4th-order natural frequency decreases gradually from 474.70 to 474.02 Hz. It shows that the same-order inherent frequency of the column decreases with the increase of the initial bracing force, but the decrease is small, and it can be considered that the setting force has almost no effect on the natural frequency of the conventional column.
The harmonic response analysis setup in ABAQUS is the same as the energy-absorbing and anti-scouring column. A point at the top of the column is chosen as the excitation point, and the load is along its axial direction (y direction) with a magnitude of 1000 kN. One measurement point is set up at the connection between the primary column and primary cylinder, and one measurement point is set up at the connection between the primary cylinder and secondary column. The energy-absorbing devices, the primary column, and the secondary column each have one monitoring point in the middle. The monitoring points are arranged as shown in Figure 14, the displacement response curve for each monitoring point is shown in Figure 15, and the velocity response curve is shown in Figure 16.
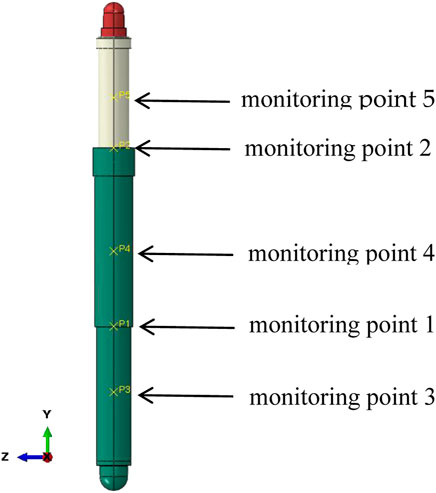
FIGURE 14. Layout of measurement points.
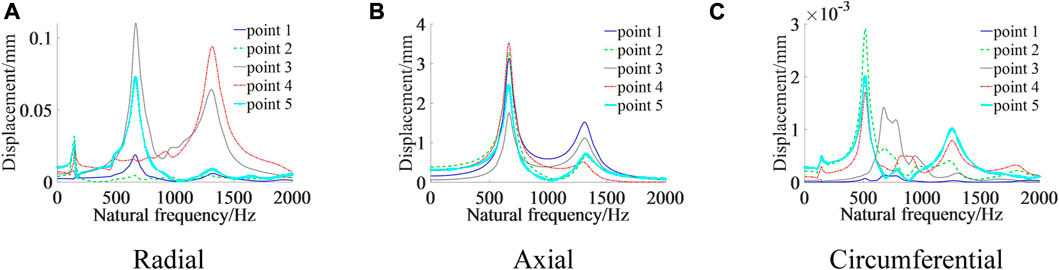
FIGURE 15. Displacement–frequency curve of the measurement point.
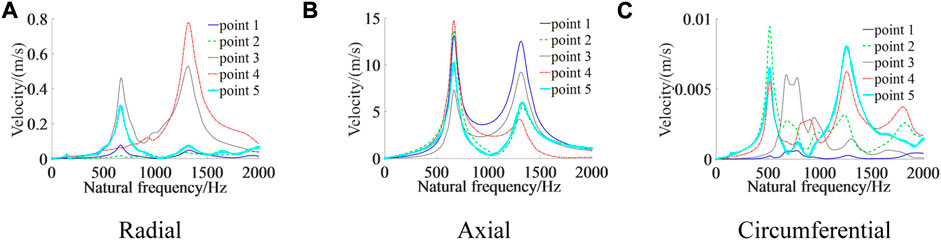
FIGURE 16. Velocity–frequency curve of the measurement point.
From Figures 14–16, it can be seen that
(1) In the radial direction, the displacement and velocity response curves for the five measurement points produce peaks around 144 Hz, 665 Hz, and 1311 Hz, respectively. In the axial direction, the displacement and velocity response curves for the five measurement points produce peaks around 665 Hz and 1311 Hz, respectively. In the circumferential direction, the displacement and velocity response curves for the five measurement points produce peaks around 144 Hz, 513 Hz, and 1250 Hz, respectively. Comparing the modal analysis results, it can be seen that 144 Hz, 513 Hz, 665 Hz, and 1250 Hz are close to the 2nd-, 5th-, 6th-, and 15th-order inherent frequencies of the column, respectively. This indicates that the amplitude response of the five measurement points is approximately the same in all three directions, and all of them have a sudden increase in amplitude around a certain order of the column’s intrinsic frequency value.
(2) In the radial direction, the amplitude is greatest at the connection between the primary cylinder and secondary column when the excitation frequency is near 144 Hz. At 665 Hz, the amplitude is greatest at the midpoint of the primary column, and at 1311 Hz, the amplitude is greatest at the primary cylinder. In the axial direction, the amplitude is greatest at the midpoint of the primary cylinder when the excitation frequency is around 665 Hz, and around 1311 Hz when the amplitude is greatest at the connection between the primary column and the primary cylinder. In the circumferential direction, the amplitude is greatest at the midpoint of the secondary column when the excitation frequency is around 144 Hz. At 513 Hz, the amplitude is greatest at the location where the primary cylinder is connected to the secondary column, and at 1250 Hz, the amplitude is greatest at the midpoint of the secondary column. It shows that different positions on the column have different amplitudes and speeds of movement in the same direction and at different frequencies. When the excitation frequency is close to 144 Hz (when the excitation frequency is close to the shock ground pressure surrounding rock vibration frequency), the displacement and velocity at the connection between the primary cylinder and secondary column reach the maximum in the radial and axial directions. The displacement and velocity at the midpoint of the secondary column reach the maximum in the circumferential direction. Therefore, strengthening and reinforcement measures should be taken at the joints and secondary columns to reduce the deformation of the columns and ensure that they play a supporting role.
(3) Under axial excitation, the displacement and velocity response amplitudes of the column in the three directions are axial >radial >circumferential, from largest to smallest, respectively. Maximum dynamic response is in the axial direction, which is 10 times greater than the radial direction, and 1,000 times greater than the circumferential direction. This means that when the axial excitation frequency is equal to the column’s intrinsic frequency, the column deforms dramatically in the axial direction, followed by the radial direction, with less deformation in the circumferential direction.
A comparison of natural frequencies and vibration mode characteristics of two columns in the range of 0–1,000 Hz is shown in Table 9, from which the following can be seen:
(1) Similarity: as two columns have a symmetrical structure, a situation arises where the value of the natural frequency of two orders is close, and the characteristics of the vibration mode are the same.
(2) Difference: the conventional column has one form of beam vibration mode, while the energy-absorbing and anti-scouring column vibration mode mainly has two forms: beam vibration mode and cylindrical shell vibration mode, and the two forms are independent of each other. The energy-absorbing device is the main location where the cylindrical shell vibration mode occurs. Furthermore, the main deformation locations of energy-absorbing and anti-scouring column vibration modes are the primary column, the secondary column, the connection between the primary cylinder and the secondary column, and the energy-absorbing device. The main deformation locations for conventional column vibration modes are the primary column, the secondary column, and the connection between the primary cylinder and secondary column.
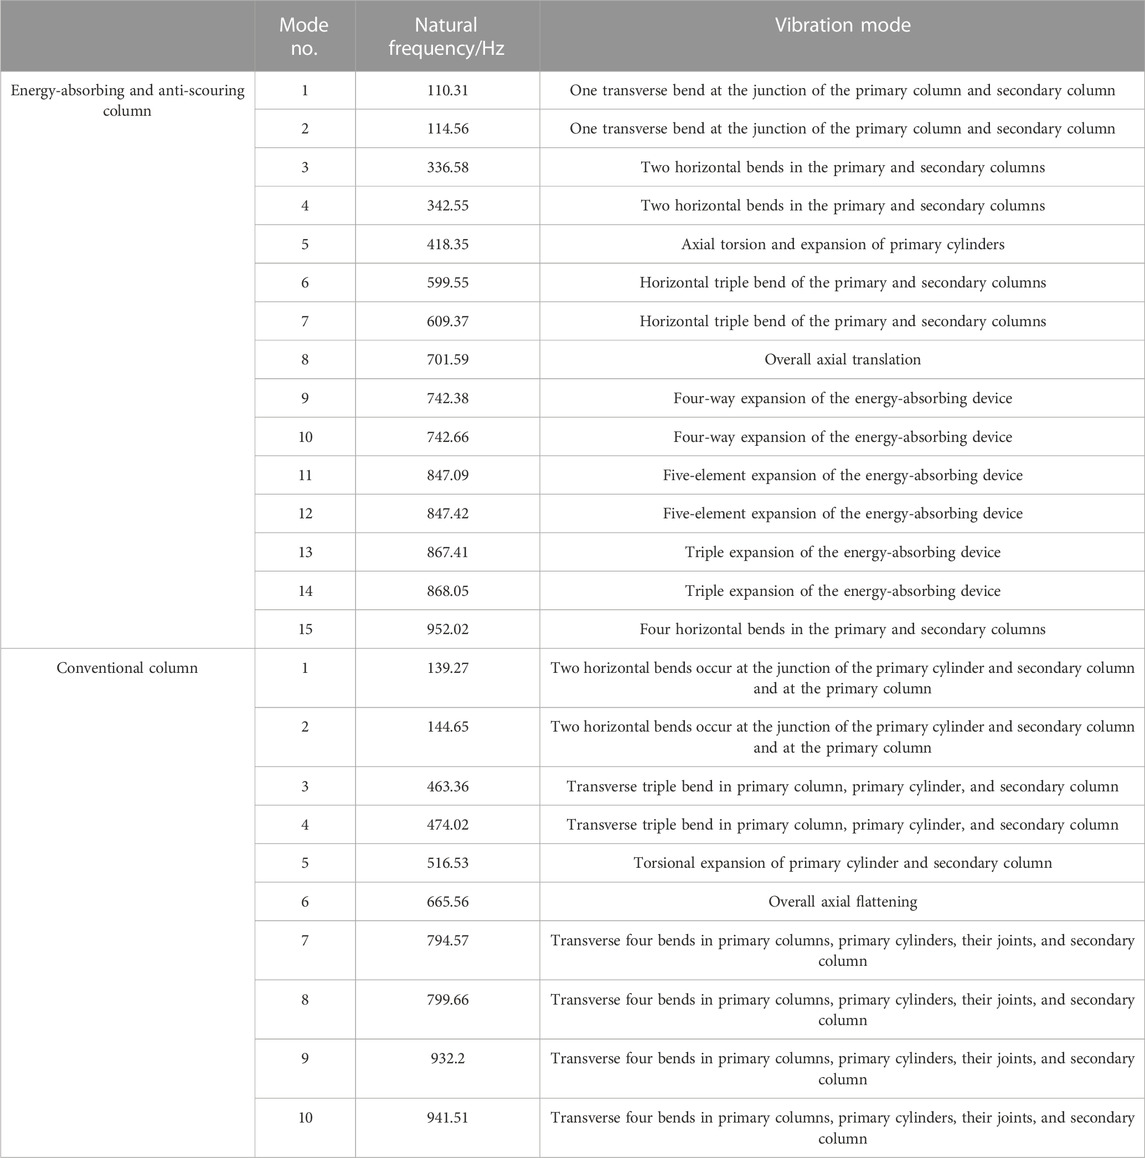
TABLE 9. Comparison of low-order natural frequencies and vibration mode characteristics of columns.
A comparison of the results of the modal analysis for two columns taking the first 4th-order mode with setting forces of 50%, 60%, 70%, 80%, and 100% of the working resistance is shown in Table 10, which shows the following
(1) Similarity: the natural frequency of both columns decreases as the setting force increases. The amount of change in the natural frequency of the energy-absorbing and anti-scouring column from 50% to 100% working resistance, 1st- to 4th-order, is 1.23, 1.24, 3.77, and 3.87 Hz, respectively. The amount of variation in the natural frequency of the conventional column is 0.56, 0.54, 0.68, and 0.68 Hz, respectively. It can be assumed that setting force has a small effect on the natural frequency of both columns. The vibration modes of the two columns do not change for different setting forces, which means that it has a small effect on the vibration mode.
(2) Differences: from 50% to 100% of the working resistance, the amount of change in natural frequency of energy-absorbing and anti-scouring column of order 1–4 is 2.20, 2.30, 5.54, and 5.69 times that of the conventional column, respectively. This indicates that the natural frequency of the energy-absorbing and anti-scouring column is more influenced by setting force than the conventional column. The vibration modes of the energy-absorbing anti-scouring column are one horizontal bend at the connection between the primary cylinder and secondary column and two horizontal bends for the primary and secondary cylinders. The vibration modes of the conventional column are two horizontal bends at the connection between the primary cylinder and secondary column and the primary column and three horizontal bends of the primary column, primary cylinder, and secondary column.
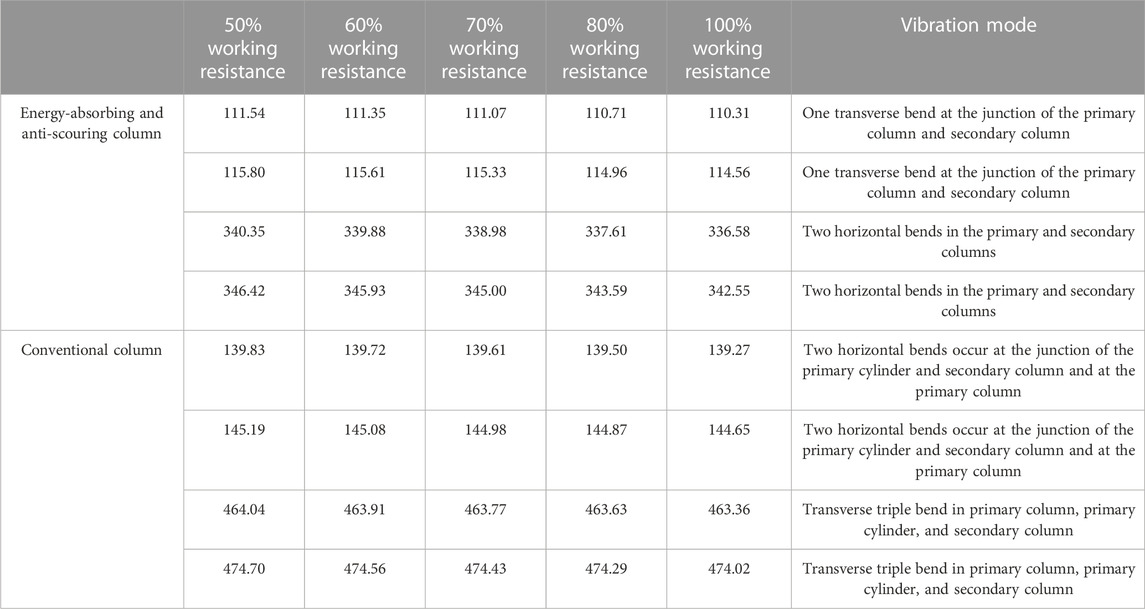
TABLE 10. Effect of different setting forces on column’s natural frequencies and vibration modes.
A comparison of harmonic response analysis results is shown in Table 11. From Table 11, the following can be seen:
(1) Similarities: the displacement and velocity response curves of both columns have a sudden increase in amplitude at a certain order of natural frequency values and approximately the same displacement and velocity response rule. The range of displacement and velocity amplitudes is approximately the same, with the greatest degree of axial dynamic response under axial excitation, followed by radial and the least circumferential.
(2) Differences: different directions, frequencies, and locations of measurement points are shown at the amplitude increase of the response curve. The response curves of the energy-absorbing and anti-scouring column in the radial direction correspond to wave peaks with frequencies of 114, 700, and 1269 Hz, respectively. The locations of measurement points are at the connection between the primary cylinder and secondary column, at the connection between the energy-absorbing device and primary column, and at the midpoint of the energy-absorbing device. The corresponding frequencies in the axial direction are 700 and 1260 Hz, and the locations of the measurement points are at the connection between the primary cylinder and secondary column, at the midpoint of the primary column, and at the connection between the energy-absorbing device and primary column. The corresponding frequencies in the circumferential direction are 114, 417, and 1060 Hz, and the locations of the measurement points are at the connection between the primary cylinder and secondary column and at the midpoint of the secondary column. Conventional column response curves in the radial direction with wave peaks correspond to frequencies of 144, 665, and 1311 Hz, respectively, at the connection between the primary and secondary columns, at the midpoint of the primary column, and at the midpoint of the primary cylinder. The corresponding frequencies in the axial direction are 665 and 1311 Hz, respectively, at the midpoint of the primary cylinder and at the connection between the primary column and primary cylinder. The corresponding frequencies in the circumferential direction are 144, 513, and 1250 Hz at the midpoint of the secondary column, at the connection between the primary cylinder and secondary column, and at the midpoint of the secondary column, respectively.
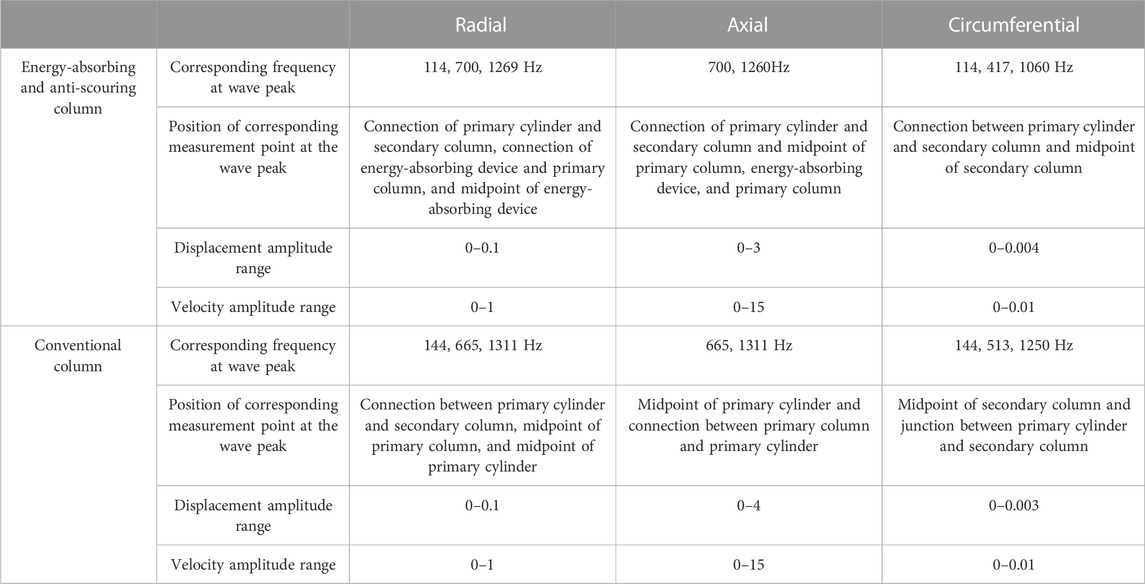
TABLE 11. Comparison of column harmonic response analysis results.
In this study, a model of roadway rock-absorbing and energy-absorbing column dynamics is developed, and theoretical equations for the column natural frequency and vibration mode function are derived. Modal analysis and harmonic response analysis of pre-stressed energy-absorbing and anti-scouring columns and conventional columns using ABAQUS finite element software led to the following conclusions:
(1) The natural frequency and vibration mode of the energy-absorbing and anti-scouring column are related to density, modulus of elasticity, and length. It has two forms: beam vibration mode and cylindrical shell vibration mode.
(2) The first four orders of natural frequencies of energy-absorbing and anti-scouring columns are close to the vibration frequencies of rock burst, while the first two orders of natural frequencies of conventional columns are close to the vibration frequencies of rock burst. The first four orders of vibration mode of both columns are transverse bending.
(3) The setting force has a small effect on the natural frequency and vibration mode of the energy-absorbing and anti-scouring column and the conventional column. The natural frequency decreases with the increase of the setting force.
(4) Both the displacement and velocity response curves of the energy-absorbing and anti-scouring column show peaks around the natural frequency. The displacement and velocity responses are consistent.
(5) When the excitation frequency is close to the vibration frequency of the surrounding rock, the radial, axial, and circumferential response amplitude at the connection between the primary cylinder and secondary column of the energy-absorbing and anti-scouring column is the largest, and reinforcement and strengthening measures should be taken here to reduce the deformation amplitude.
(6) Under axial excitation, the energy-absorbing and anti-scouring column has the greatest axial dynamic response, and the degree of axial deformation is dramatic.
The original contributions presented in the study are included in the article/Supplementary Material; further inquiries can be directed to the corresponding author.
Conceptualization: ZT; methodology: ZT; software: HW; validation: ZW, DJ, and YF; investigation: ZW; resources: ZT; data curation: HW; writing—original draft preparation: HW; writing—review and editing: ZT; visualization: HW; supervision: ZT; project administration: ZT; funding acquisition: ZT.
This study was funded by the National Natural Science Foundation of China (51804152 and 52174116) and the Discipline Innovation Team of Liaoning Technical University (LNTU20TD08).
The authors declare that the research was conducted in the absence of any commercial or financial relationships that could be construed as a potential conflict of interest.
All claims expressed in this article are solely those of the authors and do not necessarily represent those of their affiliated organizations, or those of the publisher, the editors, and the reviewers. Any product that may be evaluated in this article, or claim that may be made by its manufacturer, is not guaranteed or endorsed by the publisher.
Chen, Z. C., Tang, Z., and Xu, X. Q. (2019). Design and application of self-moving flexible shield hydraulic support. J. China Coal Soc. 44 (2), 724–730. doi:10.13225/j.cnki.jccs.2019.0917
Guo, X. B., Xiao, Z. X., Zhang, J. C., and Liu, Q. (2006). On attenuating characteristic of blasting seismic waves in propagating process“. China Min. Mag. 3, 51–53. Available at: https://kns.cnki.net/kcms/detail/detail.aspx?FileName=ZGKA200603014&DbName=CJFQ2006.
Hou, G. Y., Liang, J. P., and Li, X. R. (2022). Research on principles and methods of roadway support design under conventional conditions. Chin. J. Rock Mech. Eng. 41 (04), 691–711. doi:10.13722/j.cnki.jrme.2021.0250
Jiang, Y. D., Zhao, Y. X., Song, Y. Q., Liu, W. G., and Zhu, J. D. (2005). Analysis of blasting tremor impact on roadway stability in coal mining. Chin. J. Rock Mech. Eng. (17), 3131–3136. Available at: https://kns.cnki.net/kcms/detail/detail.aspx?FileName=YSLX200517020&DbName=CJFQ2005.
Kang, H. P., Wu, Y. Z., and He, J. (2015). Rock bolting performance and field practice in deep roadway with rock burst. J. China Coal Soc. 40 (10), 2225–2233. doi:10.13225/j.cnki.jccs.2015.6016
Li, J. X., Gan, L., Chen, Z., Liu, L., Wu, J. Q., and Yan, Y. B. (2021). Vibration characteristics analysis and structural optimization of the overhead rigid catenary cantilever support device. J. Vib. Shock 40 (12), 203–209. doi:10.13465/j.cnki.jvs.2021.12.025
Ma, X. D., Li, H. B., and Feng, H. P. (2006). Analysis of dynamic paramaters for underground excavation under seismic loading. Chin. J. Undergr. Space Eng. 1, 83–86. Available at: https://kns.cnki.net/kcms/detail/detail.aspx?FileName=BASE200601017&DbName=CJFQ2006.
Niu, J. C., and Liu, B. T. (2014). Numerical simulation and spectrum characteristics analysis of vibration wave propagation effects produced by rockburst in surrounding rocks of roadway. Chin. J. Rock Mech. Eng. 33 (S1), 3256–3262. doi:10.13722/j.cnki.jrme.2014.s1.093
Pan, Y. S., Jia, B. X., Wang, S., and Guo, Y. (2012). Three-dimension of model and its application mines seismic wave propagation. J. China Coal Soc. 37 (11), 1810–1814. doi:10.13225/j.cnki.jccs.2012.11.016
Pan, Y. S., Li, Z. H., and Zhang, M. T. (2003). Distribution,type,mechanism and prevention of rockbrust in China. Chin. J. Rock Mech. Eng. 11, 1844–1851. Available at: https://kns.cnki.net/kcms/detail/detail.aspx?FileName=YSLX200311022&DbName=CJFQ2003.
Pan, Y. S., Xiao, Y. H., and Li, G. Z. (2020). Roadway hydraulic support for rockburst prevention in coal mine and its application. J. China Coal Soc. 45 (1), 90–99. doi:10.13225/j.cnki.jccs.YG19.1762
Qi, Q. X., Pan, Y. S., Li, H. T., Jiang, Y. D., Shu, Y. L., Zhao, S. K., et al. (2020). Theoretical basis and key technology of prevention and control of coal-rock dynamic disasters in deep coal mining. J. China Coal Soc. 45 (5), 1567–1584. doi:10.13225/j.cnki.jccs.DY20.0453
Song, G. F., Wang, Z. W., and Zhong, X. Y. (2020). Dynamic impact mechanism of hard roof strata and coupling mechanism of “constrain-convergence” between support and surrounding rock. J. Min. Saf. Eng. 37 (05), 951–959. doi:10.13545/j.cnki.jmse.2020.05.011
Su, J. X., Jiang, C., Nie, S. W., and Cheng, C. (2021). Experimental study on the vibration characteristics of a grinding-wheel-rack for internal gear form grinding. J. Vib. Shock 40 (14), 100–107. doi:10.13465/j.cnki.jvs.2021.14.014
Tang, Z., Pan, Y. S., and Wang, K. X. (2015). Dynamic analysis of support for surrounding rock of rockburst roadway. Chin. J. Geotechnical Eng. 37 (08), 1532–1538. doi:10.11779/CJGE201508025
Wang, G. F., Pang, Y. H., and Li, M. Z. (2017). Hydraulic support and coal wall coupling relationship in ultra large height mining face. J. China Coal Soc. 42 (2), 518–526. doi:10.13225/j.cnki.jccs.2016.0699
Wang, G. F., and Pang, Y. H. (2016). Shield-roof adaptability evaluation method based on coupling of parameters between shield and roof strata. J. China Coal Soc. 41 (6), 1348–1353. doi:10.13225/j.cnki.jccs.2015.1357
Wang, K. X., Meng, C. Y., Yang, Y., and Li, Q. (2014). Dynamic response of roadway support on pendulum type waves propagation in overburden block rock mass. J. China Coal Soc. 39 (2), 347–352. doi:10.13225/j.cnki.jccs.2013.2020
Wu, Y. Z., Chen, J. Y., and Jiao, J. K. (2018). Damage and failure mechanism of anchored surrounding rock with impact loading. J. China Coal Soc. 43 (9), 2389–2397. doi:10.13225/j.cnki.jccs.2018.0415
Xu, L. M., Ma, L., Jiang, X. N., Lu, K. X., Xiao, Y. H., and Zhu, L. Y. (2022). Study on dynamic response law of O-shaped support under rockburst loading. Coal Sci. Technol. 50 (04), 49–57. doi:10.13199/j.cnki.cst.2019-0469
Yang, J. Z. (2021). Modal analysis for multi-angle vibrating screen based on ANSYS Workbench. J. China Coal Soc. 40 (12), 203–209. doi:10.13225/j.cnki.jccs.2012.s1.043
Yu, J. X., Li, Z. M., Yu, Y., ZhAO, M. R., Cui, Y. P., Zhao, Y., et al. (2021). Wet modal vibration analysis for submarine fluid-conveying pipeline under axial tension and hydrostatic pressure. J. Vib. Shock 40 (12), 90–96. doi:10.13465/j.cnki.jvs.2021.12.012
Zhang, X. M., Liu, G. R., and Lam, K. Y. (2001a). Coupled vibration analysis of fluid-filled cylindrical shells using the wave propagation approach. Appl. Acoust. 62 (3), 229–243. doi:10.1016/S0003-682X(00)00045-1
Zhang, X. M., Liu, G. R., and Lam, K. Y. (2001b). Frequency analysis of cylindrical panels using a wave propagation approach. Appl. Acoust. 62 (5), 527–543. doi:10.1016/S0003-682X(00)00059-1
Zhu, Q. J., Jiang, F. X., Yu, Z. X., and Yin, Y. M., (2012). On energy distribution characters about blasting vibration and rock fracture microseismic signal. Chin. J. Rock Mech. Eng. 31 (04), 723–730. Available at: https://kns.cnki.net/kns8/manage/export?filename=yslx201204011&dbname=CJFD2012.
Keywords: energy-absorbing and anti-scouring, dynamic response, modal analysis, harmonic response analysis, ABAQUS
Citation: Tang Z, Wu H, Wu Z, Jia D and Fu Y (2023) Modal analysis and harmonic response analysis of energy-absorbing and anti-scouring columns. Front. Earth Sci. 11:1126120. doi: 10.3389/feart.2023.1126120
Received: 17 December 2022; Accepted: 27 February 2023;
Published: 21 March 2023.
Edited by:
Jun Lu, Shenzhen University, ChinaReviewed by:
Huan Zhang, Taiyuan University of Technology, ChinaCopyright © 2023 Tang, Wu, Wu, Jia and Fu. This is an open-access article distributed under the terms of the Creative Commons Attribution License (CC BY). The use, distribution or reproduction in other forums is permitted, provided the original author(s) and the copyright owner(s) are credited and that the original publication in this journal is cited, in accordance with accepted academic practice. No use, distribution or reproduction is permitted which does not comply with these terms.
*Correspondence: Zhi Tang, dGFuZ3poaTAxMjdAMTYzLmNvbQ==
Disclaimer: All claims expressed in this article are solely those of the authors and do not necessarily represent those of their affiliated organizations, or those of the publisher, the editors and the reviewers. Any product that may be evaluated in this article or claim that may be made by its manufacturer is not guaranteed or endorsed by the publisher.
Research integrity at Frontiers
Learn more about the work of our research integrity team to safeguard the quality of each article we publish.