 Tianbo Sui
 Chengming Ye
 Rong Tang
94% of researchers rate our articles as excellent or good
Learn more about the work of our research integrity team to safeguard the quality of each article we publish.
Find out more
ORIGINAL RESEARCH article
Front. Earth Sci. , 10 March 2023
Sec. Environmental Informatics and Remote Sensing
Volume 11 - 2023 | https://doi.org/10.3389/feart.2023.1124425
Detecting and analyzing changes of water resources is critical for human survival and societal development in the Qinghai Tibet Plateau (QTP). We implemented the cosine similarity method to complete the migration of samples and achieve a more accurate random forest classifier (mean Kappa = 0.872) for each period. Based on these classifiers and 45,370 Landsat images, we estimated the surface water distribution of the QTP for six periods between 1990 and 2020 based on the Google Earth Engine platform. The results indicate that the QTP has a surface water area of 57,229 ± 3,248 km2 (1990–1995), 58,444 ± 3,248 km2 (1996–2000), 67,319 ± 3,704 km2 (2001–2005), 67,399 ± 2,798 km2 (2006–2010), 70,286 ± 3,033 km2 (2011–2015), 75,176 ± 2,785 km2 (2016–2020), that the area of water rose by ap-proximately 31.3% and continued to increase. The area of permanent water remained constant between 1990 and 2020 at 47,280 km2. On the QTP, the change in water area can be split into four regions: rapid increase (Qiangtang Plateau), slow increase (eastern basins), decrease (northern and northeastern basins), and relatively stable (southern basins). About 186,408 km2 area of land is significantly losing water bodies, while about 589,567 km2 area of land is significantly gaining water bodies. This study provides higher accuracy temporal distribution data of water bodies in the Qinghai-Tibet Plateau, and quantitatively evaluates the area changes of water bodies from multiple spatial scales. Research provides an important scientific reference for hydrological research and effective management of water resources in important rivers in the QTP.
As one of the most important resources on land, surface water is closely related to human production and life, and its spatial distribution and temporal changes can play an important role in the indication of climate change (Deng et al., 2019). The QTP contain a significant amount of freshwater resources, accounting for more than half of China’s lakes. The QTP is the primary source of more than 10 rivers, including the Yangtze river, the Yellow river, and the Brahmaputra river. It is also known as the “Asian water tower,” it is critical for human survival, social stability, and growth in the QTP (Immerzeel et al., 2010; Pritchard, 2019). Simultaneously, the presence and status of surface water in the QTP are critical indicators of climate and environmental change. The imbalanced status of surface water would increase the frequency of natural disasters such as ice collapse and glacier lake outbursts. Thus, examining the temporal and spatial variance of surface water in QTP contributes to our understanding of climate change and helps us prevent natural disasters.
Long-term and large-scale monitoring are advantages of remote sensing technology, which is essential for surface water monitoring. The water monitoring technology of remote sensing is improving daily as a result of the efforts of several scholars. Early water extraction was accomplished by the use of spectral index in combination with threshold segmentation, spectral index such as the normalized difference water index (NDWI) (McFeeters, 1996), modified normalized difference water index (MNDWI) (Xu, 2006), automated water extraction index (AWEI) (Feyisa et al., 2014) and threshold segmentation algorithm Otsu. (1979). However, the performance of each water body spectral index varies according to its geographical context, and the machine learning method gives a more precise and general way for water body extraction. For instance, using the random forest algorithm to extract the Yangtze River Basin’s water bodies (Wang et al., 2018), extracting water from urban areas using convolutional neural networks (Wang et al., 2020), using neural networks to extract high spatial resolution water bodies from low spatial resolution imagery (Qin et al., 2020).
Remote sensing has achieved fruitful results in the research of surface water extraction thanks to the advances of water extraction technologies (Mao et al., 2020). Remote sensing technology has realized the long time series monitoring of the dynamic changes of global water bodies (Donchyts et al., 2016; Yamazaki and Trigg, 2016), and the accuracy and spatial resolution of global water body extraction are gradually improving (Carroll et al., 2009; Feng et al., 2016; Pekel et al., 2016). The QTP’s surface water is dominated by lakes (including salt lakes), glacier lakes, rivers, and their tributaries. Lakes account for a sizable portion of surface water. Studies show that lakes on the QTP were expanding (Wan et al., 2014; Zhang et al., 2017). There are numerous glacier lakes within the QTP. Changes in the status of glacier lakes may directly result in glacier lake outbursts and other disasters (Chen et al., 2017; Lu et al., 2020; Wu et al., 2020). Zhang et al. (2015) carried out remote sensing interpretation and manual boundary correction for the glacier lakes of QTP in several periods. According to the research, the quantity and extent of glacial lakes in the QTP were increasing. In addition to monitoring the area of water bodies on the QTP, several studies have estimated the water storage volumes on the QTP (Song et al., 2013; Qiao et al., 2019). However, due to the accuracy of water extraction and the absence of support for large-scale remote sensing data calculating capability, long-term surface water change monitoring is still lacking throughout the QTP.
Google Earth Engine (GEE) is a cloud computing platform and has large scale geospatial data analysis capabilities. Researchers can solve deforestation, drought, disasters, diseases, food security, water resources management, climate monitoring, and environmental protection problems more effectively by using the GEE platform (Gorelick et al., 2017). This paper employs GEE in combination with machine learning methods to extract the QTP’s surface water from 1990 to 2020 and to determine the QTP’s surface water change trend in each watershed.
We used the Top-Of-Atmosphere (TOA) reflectance imagery from the Landsat satellite Thematic Mapper (TM), Enhanced Thematic Mapper Plus (ETM+), and Operational Land Imager (OLI) covering the entire QTP (Figure 1). A total of 45,370 Landsat imagery were utilized in this study to reduce the detrimental impact of clouds on water classification by keeping the image cloud cover score below 30%. Figure 1 displays the total number of images selected in each tile of the study area.
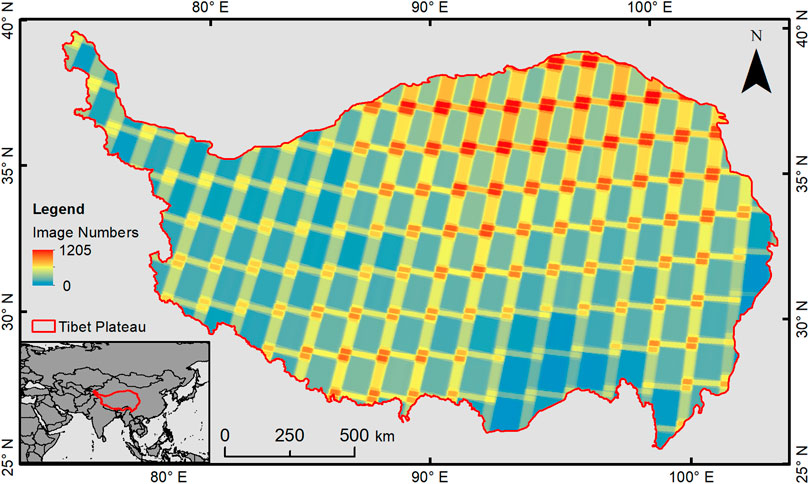
FIGURE 1. Landsat image numbers and QTP location (1990–2020 Landsat TM, ETM+ and OLI image).
The period 1990–2020 was separated into six time periods (Table 1), and the cloud-free images for each period were obtained by applying the 25% percentile composite (Corbane et al., 2020) approach to all images in that period. The GEE platform provides the “ee.Reducer.percentile” function that implements the percentile image composite method. To reduce the error introduced by the Landsat EMT+ sensor failure in 2003, only a subset of Landsat ETM+ images were used in 2013 following the sensor failure and paired with Landsat 5 and Landsat 8 images.

TABLE 1. Statistics of image number in each period.
Water classification consists of three steps (Figure 2): first, construct water samples and select suitable features, then use cosine similarity to select the water samples for different periods, and finally train the random forest classifier (Breiman, 2001) on the samples from each period to obtain the water map for that period. Each stage is detailed in full below.
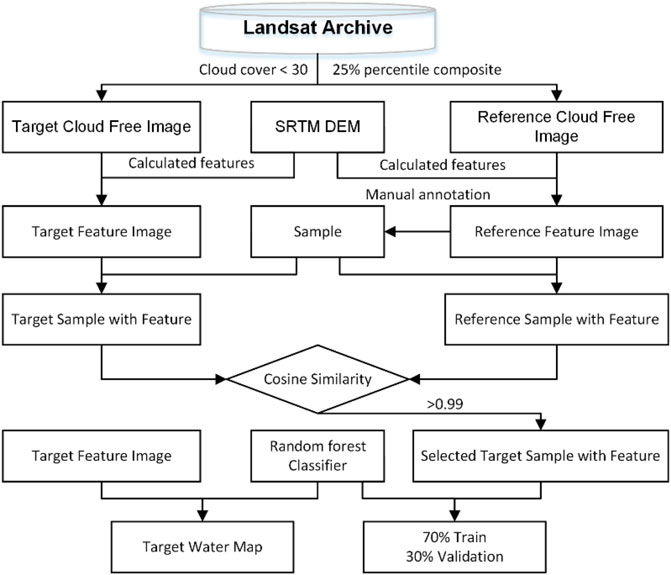
FIGURE 2. The flowchart of surface water extraction.
Water samples were collected manually from cloud-free and high-resolution sentinel imagery between 2016 and 2020. There are 28,786 samples in total, with 21,227 being non-water samples and 7,559 being water samples. The accuracy of the random forest also depends on the selection of input features. This study the input features (Table 2) are composed of three parts: 1) six spectral bands, including blue band, green band, red band, near-infrared band (NIR), short-wave infrared band 1 (SWIR1), and short-wave infrared band 2 (SWIR2); 2) spectral index, including normalized difference vegetation index (NDVI), MNDWI, NDWI, AWEI; 3) topographic features, including digital elevation models (DEM) and slope. The DEM data for this study was collected from the Shuttle Radar Topography Mission (SRTM) (Farr et al., 2007), which has a spatial resolution of 30 m Table 2.
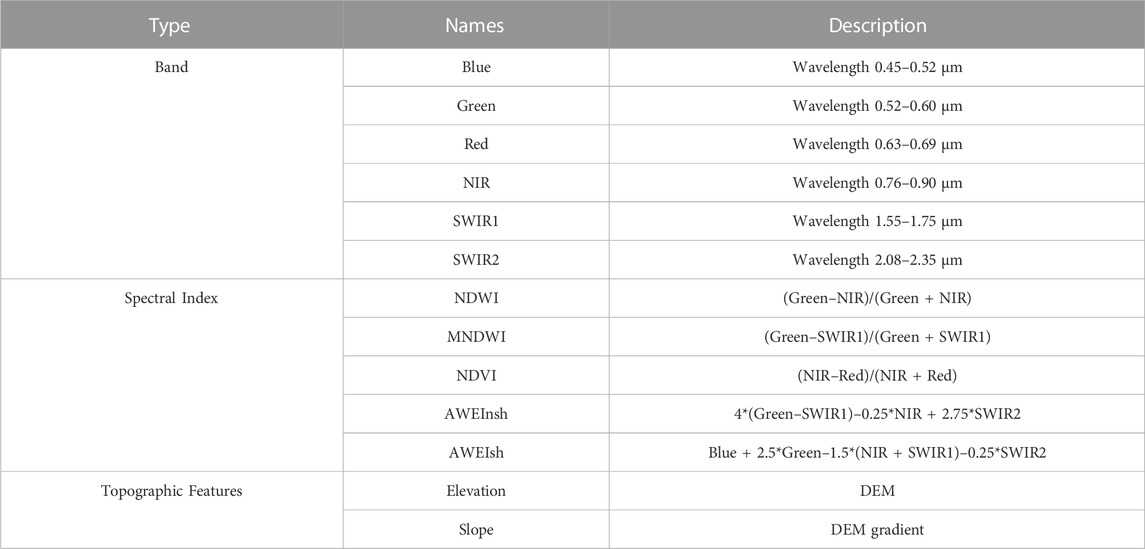
TABLE 2. Features list of water classification.
To reduce misclassification induced by a change in sample type over time (water to non-water or non-water to water), this study employs the cosine similarity method. By calculating the cosine similarity between the target sample features and the reference sample features, only samples with a cosine similarity greater than 0.99 are preserved, and the sample type is assumed to be unchanged. The cosine similarity is calculated using
where
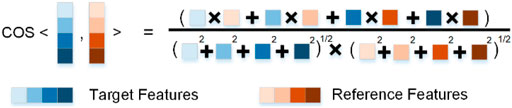
FIGURE 3. Calculation of cosine similarity between reference features and target features.
As reference samples, we chose manually annotated samples from 2016 to 2020 based on cloud-free Landsat imagery and high-resolution sentinel images, Figure 4 illustrates their features. The random forest water classifier was trained in each period using samples filtered by cosine similarity (Table 3).

FIGURE 4. Sample features statistics. (A) Spectral features; (B) spectral index features.
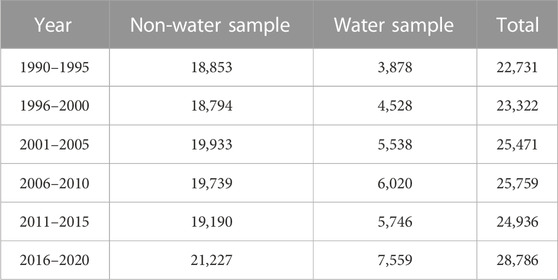
TABLE 3. Number of samples in each period.
The primary source of the misclassification in water mapping was the terrain shadow (Carroll et al., 2016). In the post-process, this study masks pixels in the classification results that have a slope more than 10° and a probability of being identified as water of less than 0.85 in the random forest classification. This efficiently reduces misclassification due to terrain shadows and further improves the accuracy of the final water map. The commission error, omission error, overall accuracy (OA), and kappa coefficient (Congalton, 1991) were used as the classification accuracy assessments. Additionally, high-resolution aerial photographs captured by unmanned aerial vehicles (UAV) were used to validate the extracted surface water’s boundary precision.
This study adjusts the random forest classifier parameters and evaluates its accuracy using 30% of the samples in each period. Table 4 list the accuracy assessment of the random forest classifier in each period. The results show that the classifier from 2016 to 2020 has the highest classification accuracy (OA = 96.1%, kappa = 0.899). The classifier between 1990 and 1995, which is the furthest removed from the reference year, has the lowest accuracy (OA = 95%, kappa = 0.847).
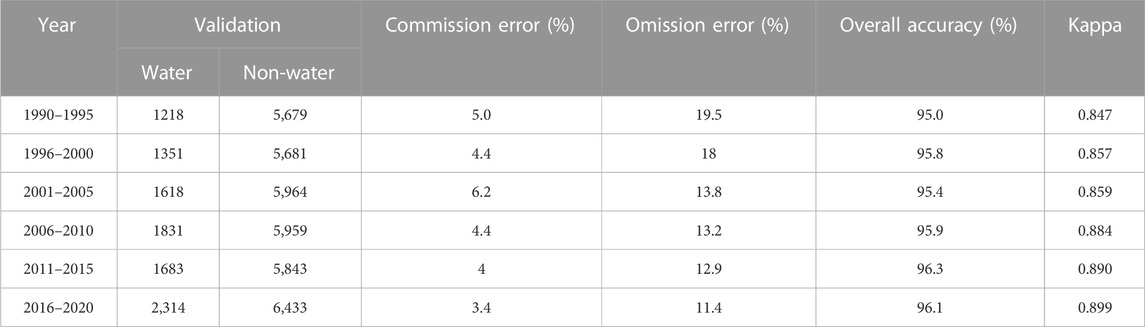
TABLE 4. Muti-temporal random forest classifier accuracy.
We evaluate the boundary accuracy for water extraction in this study using the mean intersection over union (mIOU) (Ghorbanzadeh et al., 2019) and the Sister Lake UAV image as validation data (Figure 5). Sister Lake National Wetland Park (30°18′N, 99°33′E) is located in the northeast of Batang County. It is the main birthplace and water supply area of Maqu, an important first-class tributary on the upper left bank of the Jinsha River, with an altitude of 4,486 m. We manually marked the lake boundary in the UAV images. The results show that the area of Sister Lake in the UAV image is 322,711 m2, the water area extracted from the Landsat image is 315,462 m2, and the overall area error is 2.25%. The perimeter of the Sister Lake is about 2,433 m, the mIOU is 91.8%, and the average boundary error is about 2.97 m, which is about 1/10 Landsat pixels (the size of Landsat pixels is 30 m). In addition, this paper also provides a qualitative analysis of the boundary differences between the UAV images and the extracted water bodies at Xinluhai, located at 31°51′N, 99°07′E (Supplementary Figure S1). The results show that the extracted water body boundaries match well with the water body boundaries from the UAV images.
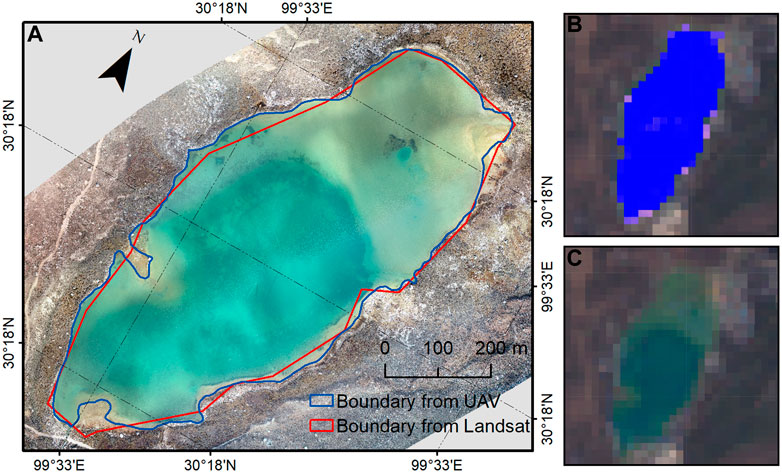
FIGURE 5. Boundary accuracy assessment. (A) The boundary from Landsat and UAV; (B) extraction water from Landsat; (C) Landsat image in Sister Lake (composed with red, green, blue bands).
We also compared this study with the global 10 m resolution land cover mapping (https://esa-worldcover.org/en) provided by the European Space Agency (ESA). This product used Sentinel-1 and Sentinel-2 image and has a minimum overall accuracy of 75%. The results of the comparison show that in the classification of surface water, especially for the extraction of small tributaries, the extraction results of this paper have less omission error (Figures 6B–D) and commission error (Figure 6A), and the extracted rivers have better continuity.
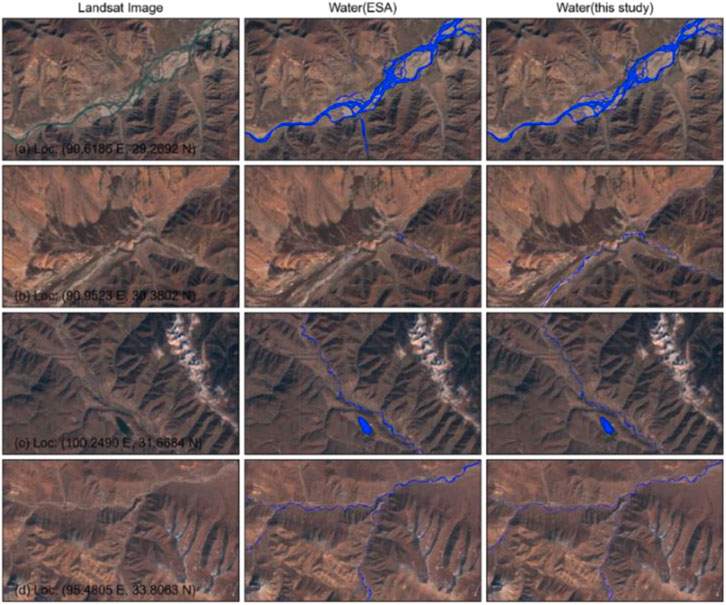
FIGURE 6. Comparisons the water extraction results of this study and ESA water. (A-D) is the different location of the QTP.
We acquired the QTP water map in six periods from 1990 to 2020 using a large number of remote sensing imagery and a high accuracy automated water extraction approach and estimated the uncertainty (Loosvelt et al., 2012) of the water area, obtained a pixel-level uncertainty map for each period (Supplementary Figure S2). The results show that the QTP has an area of water bodies 57,229 ± 3,248 km2 (1990–1995), 58,444 ± 3,248 km2 (1996–2000), 67,319 ± 3,704 km2 (2001–2005), 67,399 ± 2,798 km2 (2006–2010), 70,286 ± 3,033 km2 (2011–2015), 75,176 ± 2,785 km2 (2016–2020) (Figure 7). The QTP’s surface water area has increased significantly from 1990 to 2020, and its total water area has increased by as much as 31.3%.
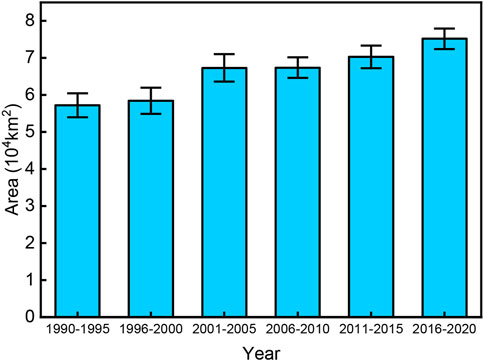
FIGURE 7. Water area and its uncertainty from 1990 to 2020.
The permanent water bodies of the QTP give a minimal estimate of the total amount of water in the QTP. Permanent water is defined in this paper as water that existed from 1990 to 2020, and its spatial distribution is shown in Figure 8. These surface waters are primarily made up of big lakes (Qinghai Lake) and rivers (Jinsha River) with the exception of water bodies that arise and disappear with seasonal changes in the QTP. The QTP contains approximately 47,280 km2 of permanent water bodies, which are widely distributed across the plains in the central part of the QTP.
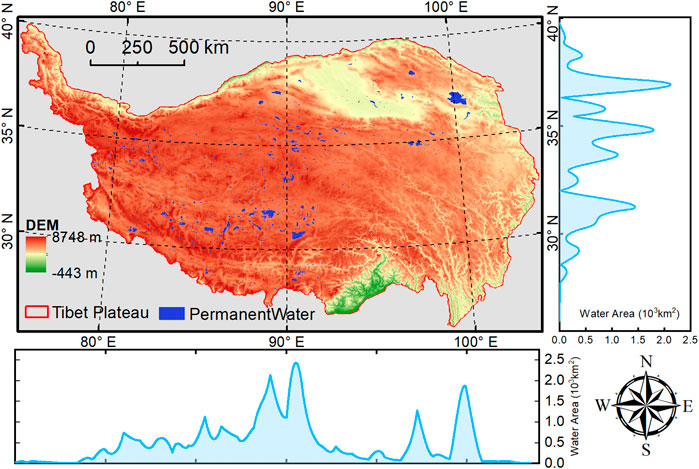
FIGURE 8. Permanent water in QTP.
The QTP contains a total of 32 tertiary watersheds, with watersheds derived from Resource and Environment Science and Data Center (https://www.resdc.cn/data.aspx?DATAID=278). We counted the surface water area within each watershed for each period, obtained the linear change trend of surface water area change within the watershed, and tested the trend of change for significance (Figure 9). The trend analysis reveals that there are 20 watersheds within the QTP with an increasing trend in surface water area and 12 watersheds with a decreasing trend in surface water area. Watersheds with increasing surface water area are primarily found in the center and eastern portions of the QTP, whereas those with decreased surface water area are primarily found in the northern and western parts of the QTP.
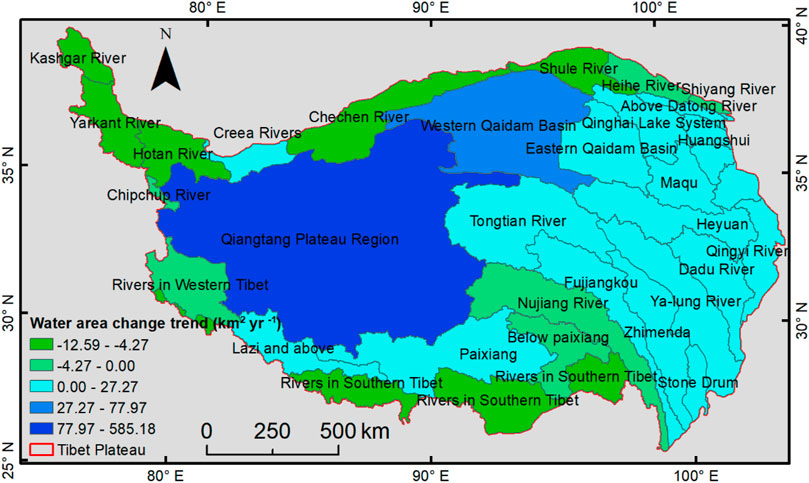
FIGURE 9. Surface water area change trend in the watershed (1990–2020).
There are about 10 watersheds which the surface water area is in a relatively stable state (area increase or decrease less than 1 km2 yr-1), and these watersheds are mainly located in the southern portions of the QTP. However, not all watersheds had significant trends (p-value < 0.05), and only 14 of the 32 watersheds had significant trends, and all watersheds with significant trends are listed in Table 5. Trends in surface water area changes for all 32 watersheds are presented in Supplementary Table S1. Among these watersheds, the surface water area is increasing in as many as 11 watersheds, mainly in the Qiangtang Plateau and some watersheds in the eastern part of the QTP, while the surface water area is decreasing in only 3 watersheds in the northern part of the QTP.
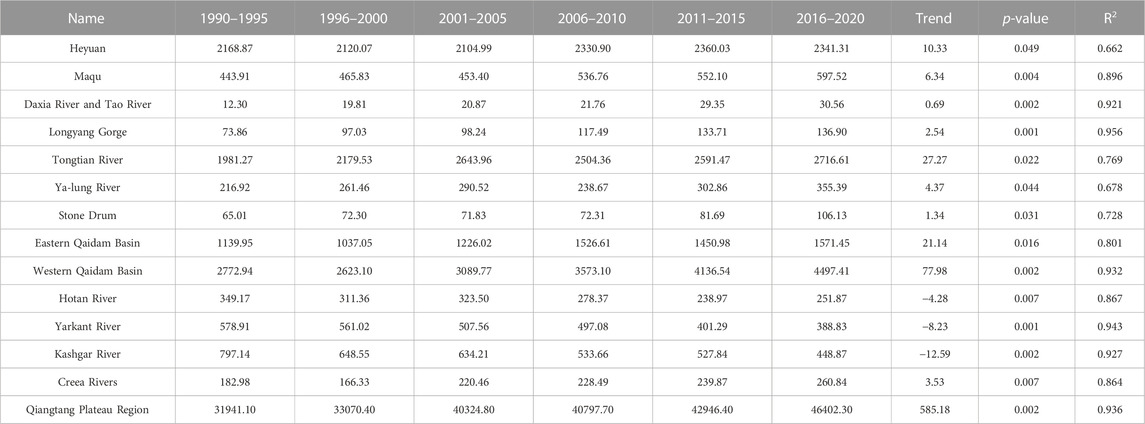
TABLE 5. Watersheds with significant changes in surface water area (km2, Trend: km2 yr-1).
The Qiangtang Plateau, located in the center of the QTP, is the watershed with the biggest surface water area and the fastest changing water area trend in the QTP. The water area of Qiangtang Plateau increased from 31,941.10 km2 to 46,402.30 km2 between 1990 and 2020, with a net increase of 14,461.20 km2 and an area change rate of 45.2%. The trend of water area in the Qiangtang Plateau is 585.18 km2 yr-1, which is significant (p-value = 0.001, R2 = 0.93, where the R2 is the coefficient of determination). The Western Qaidam Basin, located in the northeastern portion of the Qiangtang Plateau, is the basin with the largest increase in water area outside of the Qiangtang Plateau, and its change trend within the Qiangtang Plateau is significantly greater than that of other watersheds. The water area of the Western Qaidam Basin increased from 2,772.94 km2 to 4,497.41 km2 between 1990 and 2020, a net increase of 1,724.47 km2 with an area change trend of 77.98 km2 yr-1 (p-value = 0.002, R2 = 0.93). The Kashgar River watershed, which is in the northernmost part of the QTP, is the watershed with the largest reduction in surface water area in the QTP, with a reduction of 348.27 km2 in water body area between 1990 and 2020, with an area change rate of −43.6% and an area change trend of −12.59 km2 yr-1 (p-value = 0.002, R2 = 0.927).
The water area change trend on the QTP exhibit various spatial distribution, with the Qiangtang Plateau and Western Qaidam Basin exhibiting strong increase, the eastern part exhibiting slow increase, the northern and northwestern parts exhibiting decrease surface water area, and the southern part exhibiting stable surface water area.
To further analyze the geographical distribution of changes in water area, this study divided the QTP into 3,120 grids of 27,600 x 32,200 m in size and conducted statistical and trend analysis on the grids’ surface water area. There are approximately 913 grids with significant (p-value < 0.05) surface water area changes in an area of approximately 775,976.85 km2, representing 29% of the total area of the QTP, which is shown in Figure 10. The center portion of the QTP has significant regions of increased surface water area, whereas the northern and northern western parts of the QTP have significant areas of decreased surface water area. The results of the trend analysis show that about 186,408 km2 land areas in the QTP are experiencing a significant decrease in surface water area, accounting for only 24% of the total significant change area, while another 589,567 km2 land areas are experiencing increase in water area (with significance), accounting for 76% of the total area. The area of water bodies with the largest increasing trend is located in the northeastern portion of the QTP, with a rate of change of 6.51 km2 yr-1 (p-value = 0.0005, R2 = 0.96), and the area of surface water with the largest decrease trend is located in the southern part of the QTP, with a rate of change of −1.35 km2 yr-1 (p-value = 0.012, R2 = 0.81). The water area changes slowly in the majority of grids, with approximately 84% of areas experiencing increase in water body area exhibiting a trend below 1 km2 yr-1 and 99% of areas experiencing a significant decrease in water body area exhibiting a trend greater than −1 km2 yr-1.
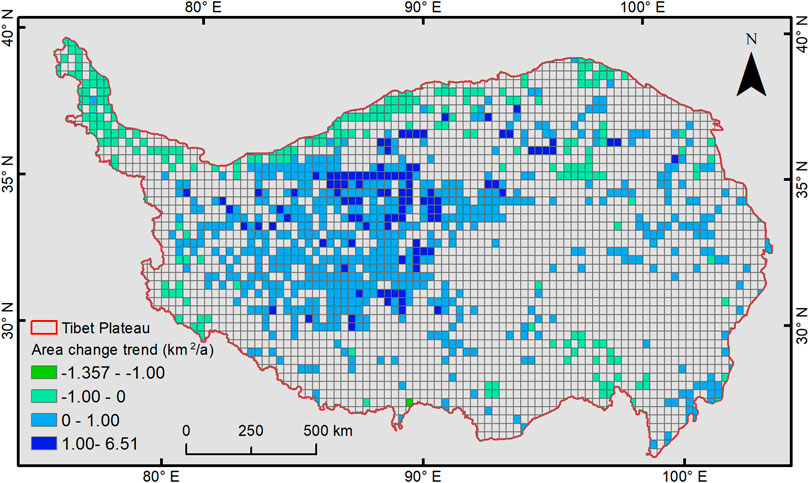
FIGURE 10. The region of significant change in surface water area (1990–2020).
In summary, the majority of the gained water area inside the QTP occurs in the Qiangtang Plateau, while the loss in water body area occurs in a large number of regions along the QTP’s northern boundary, and in general, the QTP’s surface water area continues to expand.
In this paper, we used 45,370 Landsat remote sensing images and a high-precision random forest water classification model to determine the surface water distribution on the QTP for six time periods between 1990 and 2020. By analyzing the multi-temporal changes trend of surface water, the following conclusions are mainly obtained in this paper.
1) Surface water on the QTP since 1990 to 2020, the net increase in the water body area of 17,947 km2, accounting for 31.3% of the total, and the state of continuous growth in the water body area, and about 47,280 km2 of water bodies have not changed, the main distribution of these water bodies in the Qiangtang Plateau.
2) The spatial distribution pattern of water body trends on the QTP was found to be mainly composed of the Qiangtang Plateau and the Western Qaidam Basin as a zone of rapid water area increase, the eastern basin of the QTP as a zone of low water area increase, the northern and northwestern basins of the QTP as a zone of decrease water area, and the southern part of the QTP as a zone of the stable water body area.
3) The rate and location of surface water area change in the QTP were obtained. About 186,408 km2 land areas in the QTP are experiencing a significant decrease in surface water area from 1990 to 2020, and as many as 589,567 km2 land areas are experiencing a significant increase in surface water area concentrated in the Qiangtang Plateau.
The original contributions presented in the study are included in the article/Supplementary Material, further inquiries can be directed to the corresponding author.
TS: Conceptualization, methodology, software, investigation, formal analysis, writing—original Draft. CY: Conceptualization, funding acquisition, resources, supervision, writing—review and editing. RT: Visualization, investigation; RW: Resources, supervision.
This work was supported in part by the Second Tibetan Plateau Scientific Expedition and Research Program (STEP) under Grant 2019QZKK0902, the National Natural Science Foundation of China under Grant 42071411, the Strategic Priority Research Program of the Chinese Academy of Sciences under Grant XDA23090203, and the key research and development program of Sichuan Province (2022YFG0200).
The authors declare that the research was conducted in the absence of any commercial or financial relationships that could be construed as a potential conflict of interest.
All claims expressed in this article are solely those of the authors and do not necessarily represent those of their affiliated organizations, or those of the publisher, the editors and the reviewers. Any product that may be evaluated in this article, or claim that may be made by its manufacturer, is not guaranteed or endorsed by the publisher.
The Supplementary Material for this article can be found online at: https://www.frontiersin.org/articles/10.3389/feart.2023.1124425/full#supplementary-material
Carroll, M. L., Townshend, J. R., DiMiceli, C. M., Noojipady, P., and Sohlberg, R. A. (2009). A new global raster water mask at 250 m resolution. Int. J. Digital Earth 2, 291–308. doi:10.1080/17538940902951401
Carroll, M., Wooten, M., DiMiceli, C., Sohlberg, R., and Kelly, M. (2016). Quantifying surface water dynamics at 30 meter spatial resolution in the north American high northern latitudes 1991-2011. Remote Sens. 8, 622. doi:10.3390/rs8080622
Chen, F., Zhang, M., Tian, B., and Li, Z. (2017). Extraction of glacial lake outlines in Tibet Plateau using Landsat 8 imagery and Google Earth engine. IEEE J. Sel. Top. Appl. Earth Observations Remote Sens. 10, 4002–4009. doi:10.1109/JSTARS.2017.2705718
Congalton, R. G. (1991). A review of assessing the accuracy of classifications of remotely sensed data. Remote Sens. Environ. 37, 35–46. doi:10.1016/0034-4257(91)90048-B
Corbane, C., Politis, P., Kempeneers, P., Simonetti, D., Soille, P., Burger, A., et al. (2020). A global cloud free pixel-based image composite from Sentinel-2 data. Data brief 31, 105737. doi:10.1016/j.dib.2020.105737
Deng, Y., Jiang, W., Tang, Z., Ling, Z., and Wu, Z. (2019). Long-term changes of open-surface water bodies in the Yangtze River basin based on the Google Earth engine cloud platform. Remote Sens. 11, 2213. doi:10.3390/rs11192213
Donchyts, G., Baart, F., Winsemius, H., Gorelick, N., Kwadijk, J., and van de Giesen, N. (2016). Earth's surface water change over the past 30 years. Nat. Clim. Change 6, 810–813. doi:10.1038/nclimate3111
Farr, T. G., Rosen, P. A., Caro, E., Crippen, R., Duren, R., Hensley, S., et al. (2007). The shuttle radar topography mission. Rev. Geophys. 45, 183. doi:10.1029/2005RG000183
Feng, M., Sexton, J. O., Channan, S., and Townshend, J. R. (2016). A global, high-resolution (30-m) inland water body dataset for 2000: First results of a topographic-spectral classification algorithm. Int. J. Digital Earth 9, 113–133. doi:10.1080/17538947.2015.1026420
Feyisa, G. L., Meilby, H., Fensholt, R., and Proud, S. R. (2014). Automated water extraction index: A new technique for surface water mapping using Landsat imagery. Remote Sens. Environ. 140, 23–35. doi:10.1016/j.rse.2013.08.029
Ghorbanzadeh, O., Blaschke, T., Gholamnia, K., Meena, S. R., Tiede, D., and Aryal, J. (2019). Evaluation of different machine learning methods and deep-learning convolutional neural networks for landslide detection. Remote Sens. 11, 196. doi:10.3390/rs11020196
Gorelick, N., Hancher, M., Dixon, M., Ilyushchenko, S., Thau, D., and Moore, R. (2017). Google Earth engine: Planetary-scale geospatial analysis for everyone. Remote Sens. Environ. 202, 18–27. doi:10.1016/j.rse.2017.06.031
Immerzeel, W. W., van Beek, L. P. H., and Bierkens, M. F. P. (2010). Climate change will affect the asian water towers. Science 328, 1382–1385. doi:10.1126/science.1183188
Loosvelt, L., Peters, J., Skriver, H., Lievens, H., Van Coillie, F. M. B., De Baets, B., et al. (2012). Random Forests as a tool for estimating uncertainty at pixel-level in SAR image classification. Int. J. Appl. Earth Observation Geoinformation 19, 173–184. doi:10.1016/j.jag.2012.05.011
Lu, P., Han, J., Li, Z., Xu, R., Li, R., Hao, T., et al. (2020). Lake outburst accelerated permafrost degradation on Qinghai-Tibet Plateau. Remote Sens. Environ. 249, 112011. doi:10.1016/j.rse.2020.112011
Mao, D., Wang, Z., Du, B., Li, L., Tian, Y., Jia, M., et al. (2020). National wetland mapping in China: A new product resulting from object-based and hierarchical classification of Landsat 8 OLI images. Isprs J. Photogrammetry Remote Sens. 164, 11–25. doi:10.1016/j.isprsjprs.2020.03.020
McFeeters, S. K. (1996). The use of the normalized difference water index (NDWI) in the delineation of open water features. Int. J. Remote Sens. 17, 1425–1432. doi:10.1080/01431169608948714
Otsu, , N. (1979). A threshold selection method from gray-level histograms. IEEE Trans. Syst. Man, Cybern.9, 62–66. doi:10.1109/TSMC.1979.4310076
Pekel, J., Cottam, A., Gorelick, N., and Belward, A. S. (2016). High-resolution mapping of global surface water and its long-term changes. Nature 540, 418–422. doi:10.1038/nature20584
Pritchard, H. D. (2019). Asia's shrinking glaciers protect large populations from drought stress. Nature 569, 649–654. doi:10.1038/s41586-019-1240-1
Qiao, B., Zhu, L., and Yang, R. (2019). Temporal-spatial differences in lake water storage changes and their links to climate change throughout the Tibetan Plateau. Remote Sens. Environ. 222, 232–243. doi:10.1016/j.rse.2018.12.037
Qin, M., Hu, L., Du, Z., Gao, Y., Qin, L., Zhang, F., et al. (2020). Achieving higher resolution lake area from remote sensing images through an unsupervised deep learning super-resolution method. Remote Sens. 12, 1937. doi:10.3390/rs12121937
Song, C., Huang, B., and Ke, L. (2013). Modeling and analysis of lake water storage changes on the Tibetan Plateau using multi-mission satellite data. Remote Sens. Environ. 135, 25–35. doi:10.1016/j.rse.2013.03.013
Wan, W., Xiao, P., Feng, X., Li, H., Ma, R., Duan, H., et al. (2014). Monitoring lake changes of Qinghai-Tibetan Plateau over the past 30 years using satellite remote sensing data. Chin. Sci. Bull. 59, 1021–1035. doi:10.1007/s11434-014-0128-6
Wang, C., Jia, M., Chen, N., and Wang, W. (2018). Long-term surface water dynamics analysis based on Landsat imagery and the Google Earth engine platform: A case study in the middle Yangtze River basin. Remote Sens. 10, 1635. doi:10.3390/rs10101635
Wang, Y., Li, Z., Zeng, C., Xia, G., and Shen, H. (2020). An urban water extraction method combining deep learning and Google Earth engine. IEEE J. Sel. Top. Appl. Earth Observations Remote Sens. 13, 769–782. doi:10.1109/JSTARS.2020.2971783
Wu, R., Liu, G., Zhang, R., Wang, X., Li, Y., Zhang, B., et al. (2020). A deep learning method for mapping glacial lakes from the combined use of synthetic-aperture radar and optical satellite images. Remote Sens. 12, 4020. doi:10.3390/rs12244020
Xu, H. (2006). Modification of normalised difference water index (NDWI) to enhance open water features in remotely sensed imagery. Int. J. Remote Sens. 27, 3025–3033. doi:10.1080/01431160600589179
Yamazaki, D., and Trigg, M. A. (2016). The dynamics of Earth's surface water. Nature 540, 348–349. doi:10.1038/nature21100
Zhang, G., Yao, T., Piao, S., Bolch, T., Xie, H., Chen, D., et al. (2017). Extensive and drastically different alpine lake changes on Asia's high plateaus during the past four decades. Geophys. Res. Lett. 44, 252–260. doi:10.1002/2016GL072033
Keywords: remote sensing, water classification, Qinghai-Tibet Plateau, random forest, google earth engine
Citation: Sui T, Ye C, Tang R and Wei R (2023) Spatio-temporal change monitoring for surface water on the Qinghai-Tibet Plateau from 1990 to 2020 using remote sensing. Front. Earth Sci. 11:1124425. doi: 10.3389/feart.2023.1124425
Received: 15 December 2022; Accepted: 27 February 2023;
Published: 10 March 2023.
Edited by:
Tianjie Zhao, Aerospace Information Research Institute (CAS), ChinaReviewed by:
Luyan Ji, Aerospace Information Research Institute (CAS), ChinaCopyright © 2023 Sui, Ye, Tang and Wei. This is an open-access article distributed under the terms of the Creative Commons Attribution License (CC BY). The use, distribution or reproduction in other forums is permitted, provided the original author(s) and the copyright owner(s) are credited and that the original publication in this journal is cited, in accordance with accepted academic practice. No use, distribution or reproduction is permitted which does not comply with these terms.
*Correspondence: Chengming Ye, cnNnaXNAc2luYS5jb20=
Disclaimer: All claims expressed in this article are solely those of the authors and do not necessarily represent those of their affiliated organizations, or those of the publisher, the editors and the reviewers. Any product that may be evaluated in this article or claim that may be made by its manufacturer is not guaranteed or endorsed by the publisher.
Research integrity at Frontiers
Learn more about the work of our research integrity team to safeguard the quality of each article we publish.