
95% of researchers rate our articles as excellent or good
Learn more about the work of our research integrity team to safeguard the quality of each article we publish.
Find out more
ORIGINAL RESEARCH article
Front. Earth Sci. , 19 January 2023
Sec. Hydrosphere
Volume 11 - 2023 | https://doi.org/10.3389/feart.2023.1122937
This article is part of the Research Topic Risk Assessment and Management of Water Conservancy Projects View all 16 articles
 Peng He1∗
 Wenjing Wu2
Considering the strong non-linear time-varying behavior of dam deformation, a novel prediction model, called Levy flight-based grey wolf optimizer optimized support vector regression (LGWO-SVR), is proposed to forecast the displacements of hydropower dams. In the proposed model, the support vector regression is used to create the prediction model, whereas the Levy flight-based grey wolf optimizer algorithm is employed to search the penalty and kernel parameters for SVR. In this work, a multiple-arch dam was selected as a case study. To validate the proposed model, the predicted results of the model are compared with those derived from Grid Search algorithm, Particle Swarm Optimization, Grey Wolf Optimizer algorithm, and Genetic algorithm. The results indicate that the LGWO-SVR model performs well in the accuracy, stability, and rate of prediction. Therefore, LGWO-SVR model is suitable for dam engineering application.
The safety of hyperpower dams has always been a widely-concerned issue of every country. To ensure the security of dam, dam safety monitoring model is built for monitoring the actual operation state of the dams (Li et al., 2021; Ge et al., 2020) . The deformation of a dam is commonly used to reflect the working condition during the operation period (Bui et al., 2016). Considering the non-linear and complex process of the deformation, it is difficult to forecast the dam behavior with high accuracy (Chen et al., 2018).
In recent years, various machine learning methods, such as artificial neural network, support vector machine, and random forest method, have been applied to establish the prediction models of dam deformation (Salazar F et al., 2017). The most widely used method is artificial neural networks (ANNs). However, an artificial neural network is more likely to fall into the situation that the trained ANN over-fits training samples, which reduces the accuracy of predicted dam deformation.
Support vector regression (SVR) has always been a hotspot in civil engineering to solve regression prediction (Su et al., 2015). SVR has distinctive superiority in solving non-linear problems with few samples and high dimensions. The prediction accuracy of SVR is influenced by the values of the penalty and kernel parameters in SVR. Therefore, a number of swarm intelligence algorithms were presented to optimize the parameters, including the Grid Search algorithm (GS), Particle Swarm Optimization algorithm (PSO), Cuckoo Search algorithm (CS), Genetic Algorithm (GA), etc. Su et al. (2018) employed the Particle Optimization algorithm (PSO) to seek the best parameter set for SVR in predicting dam deformation. Ranković et al. (2014) proposed an SVR-based model for forecasting the dam deformation. In Rankovic’s model, the parameters of SVR are specified with the trial-and-error method. Shu et al (2021) proposed a variational autoencoder-based model for dam displacement prediction. Li et al (2019) proposed a novel distributed time series evolution model for predicting the dam deformation. Meng et al. (2018) combined the Ant Colony Optimization algorithm (ACO) with SVR to forecast the price of stock. Kaltich et al. (2015) presented a wavelet genetic algorithm-support vector regression (GA-SVR) to forecast monthly river flows. Xue et al. (2018) proposed the Artificial Bee Colony algorithm (ABC) for global optimization to obtain the optimal solutions of several benchmark functions. In conclusion, the possible optimal solution can be obtained through these algorithms, but these algorithms are more likely to fall into the local optimal solutions and their convergence rates are very slow. Considering the lower speed and precision of these algorithms, a novel type of swarm intelligence algorithm called the Grey Wolf Optimizer (GWO) algorithm is introduced in this paper.
The Grey Wolf Optimizer algorithm has received much attention and been widely used in many fields such as optimal reactive power scheduling, multiple input and output problems, and truss structures with motive power restrict (Faris H et al., 2017). The GWO algorithm is easy to implement and has fewer control parameters. Numerical comparisons showed that the GWO algorithm could present a higher performance than other swarm intelligence algorithms (Zhang and Zhou, 2015). The search scope become more and more smaller with the increase of iterations in the GWO algorithm, which increase the possibility of falling into a local optimum. To expand the scope of the search, the Levy flight is combined with the GWO algorithm to optimize the parameters. The Levy flight is a random process that is inspired by the Levy distribution (Viswanathan et al., 1996). Application of the Levy flight can result in a more effective search because of the use of the long jumps. The Levy flight can reduce the possibility of falling into a local optimum, taking into account the short-range exploratory hopping and occasional long-distance walking simultaneously.
In this paper, the Levy flight-based Grey Wolf Optimizer (LGWO) algorithm is presented to optimize support vector regression model for forecasting dam deformation. Historical data of the water pressure, temperature, and time-varying effect values of a dam are taken as input variables and the model is constructed to forecast the deformation. To validate the performance of the LGWO algorithm, a comprehensive comparison is carried out among the prediction capability of some other swarm intelligence algorithms.
The rest of the paper is organized as follows: Section 2 presents a brief introduction to the Levy flight-based Grey Wolf Optimizer algorithm and the Support Vector Regression model, describes the framework of the LGWO-SVR model, and presents the criteria of prediction performance. Section 3 presents a description of a case study, the calculation of the input effects, and the initial parameters of each algorithm. The comprehensive comparison among those swarm intelligence algorithms and the prediction results of the LGWO-SVR model are also showed in Section 3. Finally, the conclusion for the current work is given in Section 4.
There are many factors affecting dam deformation, such as water pressure, seepage coupling, joint fissure, concrete temperature, etc (Wei et al., 2019). Limited by current monitoring technology and analysis theory, the prediction for dam deformation is complex. It is generally accepted that the displacements are composed of water pressure component, temperature component, and time-varying component. The relationships between these components and their relevant factors are non-linear. For example, water pressure component is the polynomials of the water depth. The prediction of dam deformation is a non-linear problem with high dimensions. As mentioned above, the SVR has distinctive superiority in solving non-linear problems with few samples and high dimensions. Therefore, it is suitable for the SVR to construct a prediction model.
The support vector regression (SVR) is data-based prediction model improved by the support vector classification. The basic idea of SVR is to find an optimal classification surface to minimize the error of all training samples from the optimal classification surface (Li et al., 2018). Suppose that there is a training sample set {(
The goal of SVR is to find a function relationship
where
Based on the principle of structural risk minimization, the function
where
The convex optimization problem can be converted to solving the extremum of Lagrangian function L through the Lagrange multiplier method.
where
According to the Karush-Kuhn-Tucher (KKT) condition which describes the necessary and sufficient conditions to meet the optimal solution, the derivatives of L about the original variable must be 0 to obtain optimal results (Smola and Scholkopf, 2004).
According to Eq. 5, the regression function of the SVR model can be transformed as follows.
where
When the SVR is used to solve the non-linear regression problem in practice, the non-linear problem is mapped to a high-dimensional space and the linear function is constructed in this space by selecting an appropriate kernel function. The selection of kernel function has a significant influence on the performance of the SVR because different kernel function is suitable for different data types (Huang et al., 2012). A radial basis kernel function is more favored than other kernel functions due to its facilitating implementation and strong mapping performance (Rasmussen, 2003). The expression of a radial basis kernel function is shown in Eq. 8.
where
Using the Lagrangian multiplier method, duality principle, and the kernel function, the problem is transformed into a quadratic programming optimization one.
Obtaining the Lagrange multiplier
where
There are two essential parameters (the penalty parameter C and kernel parameter
As mentioned above, the penalty parameter C and the kernel parameter
GWO is a swarm intelligence meta-heuristic algorithm given by Mirjalili et al. (2014). The inspiration of the GWO algorithm is based on the social hierarchy and hunting strategy of grey wolves in nature (Searemi et al., 2014). In each group of grey wolves, there is a very strict social dominant hierarchy shown in Figure 1.
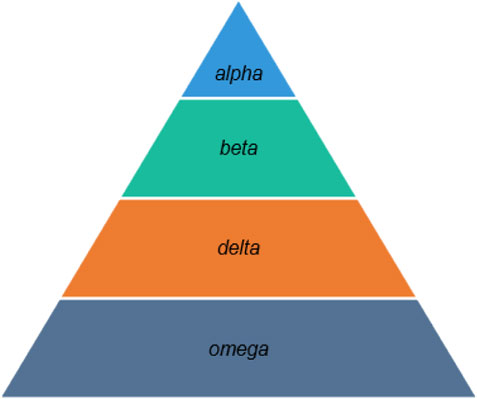
FIGURE 1. Social hierarchy of grey wolves (dominance decreases from top to bottom).
To simulate the social hierarchy of grey wolves, four categories of wolves are defined--alpha (
where
The random vectors
where
Different mathematical operators are defined in Eqs 11–13, which can be summarized as follows:
where
Figure 2 shows how a grey wolf updates its position

FIGURE 2. Position vectors and the possible next locations of a grey wolf.
To simulate the hunting behavior of the grey wolves, the alpha, beta, and delta wolves in the GWO algorithm are three best solutions obtained so far. The omega wolves are obliged to update their positions according to the positions of the above best wolves. The hunting process can be mathematically described (Song et al., 2015):
where
As showed in Figure 3, a grey wolf can update its position according to the positions of alpha, beta, and delta wolves in a 2D search space. The final possible position of the prey is distributed in a circle determined by the positions of alpha, beta, and delta in the search space. The hunting process can be summarized that the position of the prey is estimated by the best three wolves, whereas the other wolves update their positions randomly around the prey.

FIGURE 3. Location updating process of grey wolves in 2D space.
When the grey wolves start to attack the prey, the encirclement of wolves became smaller and smaller. The GWO algorithm are more likely to fall into local optimum solutions under the small search encirclement (Mirjalili et al., 2015). Considering the small encirclement, the Levy flight is introduced to increase the ability of global and local search simultaneously.
The Levy flight is a category of random search process (Amirsadri et al., 2017). In this method, the short-range exploratory hopping and occasional long-distance walking are combined to result in a more effective search. The hopping behavior ensures that the search agents can search the small areas carefully, whereas the long-distance walking behavior ensures that the search agents can enter into another areas and search a wider range. The jump size in the Levy flight follows the Levy probability distribution function (Yang and Deb, 2009). Considering the difficulty of calculating the search path, a simple mathematical definition of the Levy distribution is described:
where
with
where
In this study, a hybrid optimization algorithm which combines the GWO algorithm with the Levy flight is presented. In the proposed algorithm, all the wolves except the three leading wolves update their positions through the Levy flight. Therefore, the following equations can be used to update the position.
where
As mentioned above, the penalty parameter
Figure 4 shows the overall process of training the SVR using the LGWO algorithm at each iteration. At the beginning, the positions of wolves are obtained from the last iteration and served as the parameters of SVR. After giving the position of each wolf in SVR successively and training SVR, the predicted values of the testing sample are generated in SVR. Then the root mean squared error (RMSE) as the fitness of each wolf is given to the LGWO algorithm from SVR. The positions of the wolves are updated in the LGWO algorithm according to the fitness given by SVR. Finally, the best parameter pair
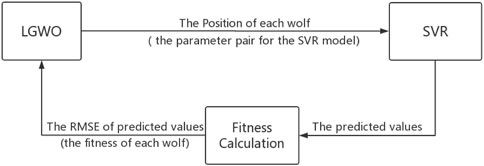
FIGURE 4. The process of training SVR using LGWO.
In this paper, a novel hybrid model composed of the Levy flight-based grey wolf optimizer (LGWO) and support vector regression (SVR) was proposed and applied to make prediction for dam deformation. The structure of the proposed hybrid method for dam deformation prediction is shown in Figure 5. To avoid calculation error caused by numerical differences, the data is normalized and all the samples are divided into the training and testing samples. Main steps are as followed.
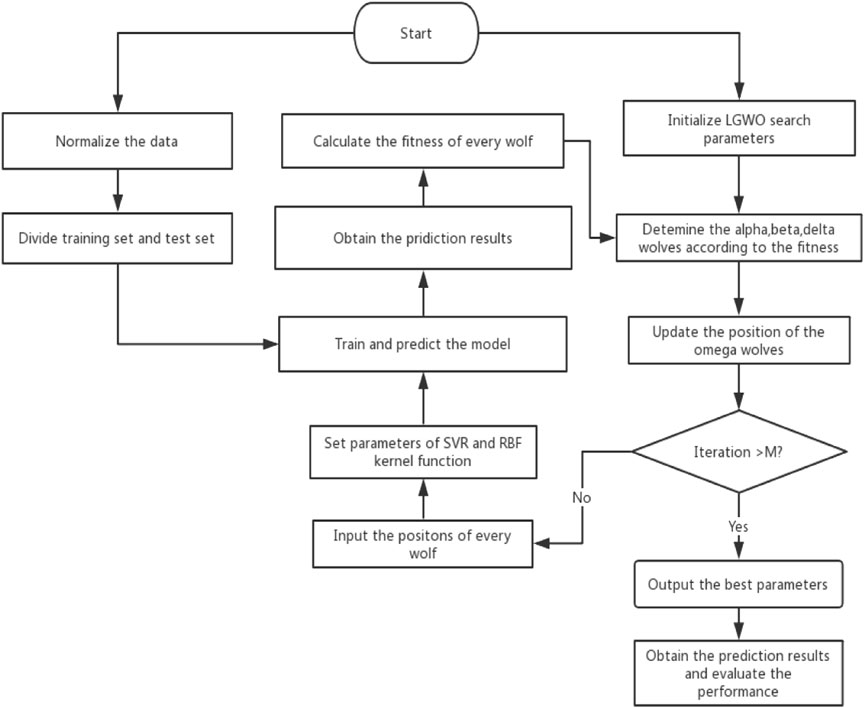
FIGURE 5. Structure of the proposed LGWO-SVR model.
Step 1:. Normalize the parameters of the LGWO-SVR model.
Step 2:. Initialize the population of the wolf pack.
Step 3:. Enter the position of each wolf to the SVR model and obtain the fitness of each wolf.
Step 4:. Select the alpha, beta, and delta wolves in the wolf pack.
Step 5:. Update the positions of the omega wolves.
Step 6:. If the maximum iteration number reaches, the iteration is terminated and the position of the alpha wolf is outputted. Otherwise, repeat steps 3–6;
Step 7:. Train the SVR model according to the outputted parameters and obtain the prediction values.
To evaluate the performance of the proposed model, three widely used quantitative evaluation indicators are introduced. The specific expression of these indicators is shown as follows:
Squared correlation coefficient (
Mean absolute error (MAE)
Root mean squared error (RMSE)
where
The project used in this paper is situated on the Luo River (a tributary of the Huaihe River) in Anhui province, China. It is a multiple-arch dam consisting of 20 sections and 21 arches showed in Figure 6. The total height of the dam is 75.9 m, and the total length of the dam is 510 m. To understand the real-time working status of the dam during operation, the dam is installed with pendulum monitoring system. The aim is to monitor and assess the horizontal displacements of the dam. A total of 21 pendulum systems are installed in the arches. The pendulum monitoring system consists of 20 pendulum lines (PL) and three inverted pendulum lines (IP). The distribution of the pendulums is showed in Figure 7. The raw data was recorded by manual and automated equipment every day.
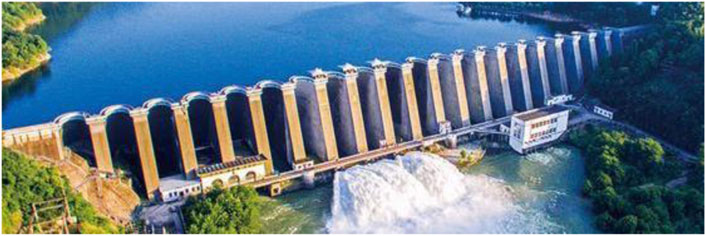
FIGURE 6. Layout of the multiple-arch dam.
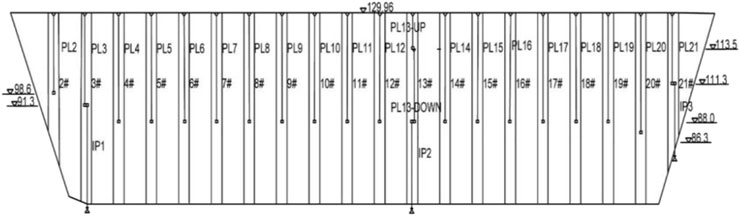
FIGURE 7. Pendulum systems for monitoring horizontal displacement.
At the same time, some environmental data are also monitored, such as reservoir level, air temperature, water temperature. There are 57 thermometers embedded in the dam body, which are used to measure air, water, and concrete temperatures. In this study, the dam section 13 is selected for testing the model. The thermometer distribution of the dam section 13 is showed in Figure 8.
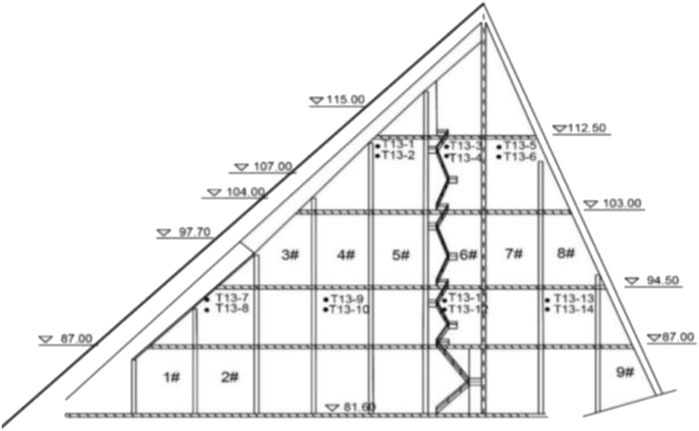
FIGURE 8. Thermometers installed in the dam section 13.
In this study, the environmental monitoring data and displacements of the dam section 13 are used. Time series with 1700 data points from January 2009 to September 2013 are selected. The time series are divided into training and testing samples. The training time series are from January 2009 to June 2013. The testing time series are from June 2013 to September 2013. The amounts of training and testing samples are 1,000 and 260. The time series of air temperature, reservoir level, and displacements are presented in Figure 9.
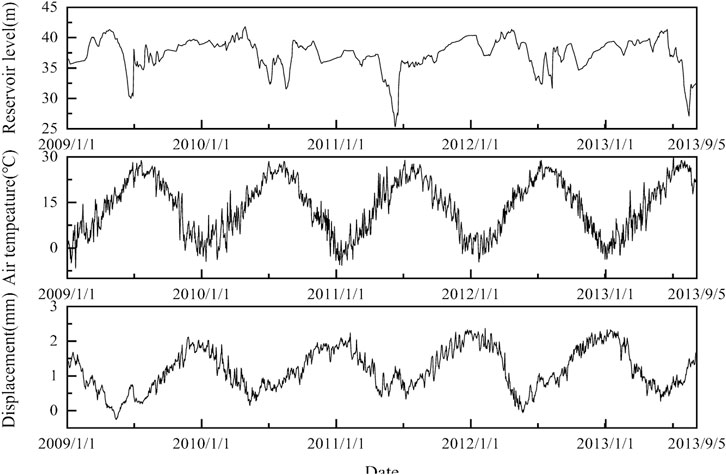
FIGURE 9. Reservoir level, air temperature, and displacements recorded in the dam section 13.
Dam deformation is mainly influenced by hydraulic effect, thermal effect, and time-varying effect (Wei et al., 2019). For the hydraulic effect, it is usually considered as a reversible effect and can be represented by the polynomials(
As mentioned above, there are two parameters (the penalty parameter
To describe the prediction performance of the LGWO-SVR model, four other algorithms are combined with SVR to predict the displacements: GS, PSO, GWO, and GA. Table 1 shows the initial parameters of these algorithms. To test the stability for each algorithm, 20 independent runs are carried out.
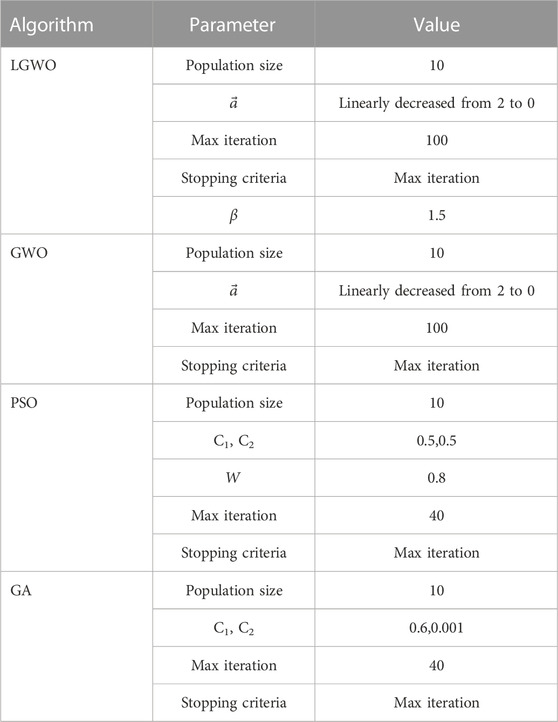
TABLE 1. Initial parameters.
The results from all the algorithms are presented in Table 2. The results are averaged over 20 independent runs. The Averaged and Std dev represent the mean evaluation indicators and standard deviation, respectively. As showed in Table 2, the squared correlation coefficients of the LGWO algorithm are 0.9594, which are higher than other four algorithms. In addition, the MAE and RMSE of the LGWO algorithm are lower than the other four algorithms. It indicates that the LGWO algorithm performs better in the prediction accuracy.
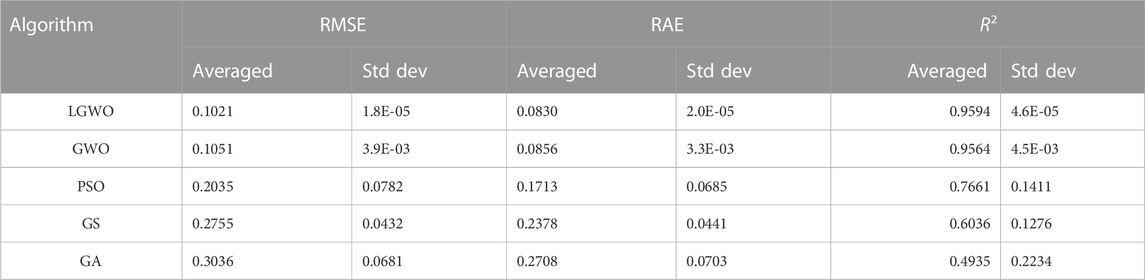
TABLE 2. Experimental results of every algorithm.
To assess the solution stability of the LGWO algorithm, the distributions of evaluation indicators for the LGWO algorithm ais drew in Figures 10–12 with those for four other algorithms. It can be seen that the RMSE, MAE, R2 of the LGWO algorithm are concentrated near 0.1, 0.8, and 0.96, respectively. However, the evaluation indicators of the other four algorithms are decentralized. The LGWO algorithm can obtain the parameter pair with the higher accuracy at each run. However, only one series of parameters is obtained in the GA and GS algorithm and eight series of parameters are obtained in the PSO algorithm at each independent 20 runs. It indicates that the LGWO algorithms perform well in the prediction stability.
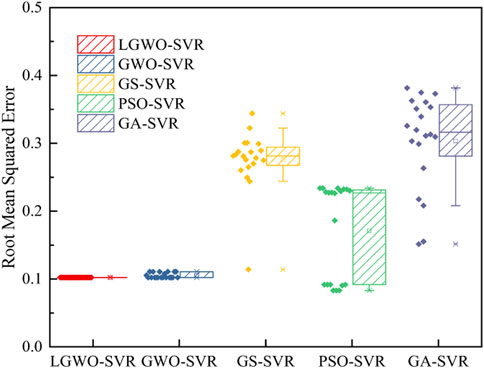
FIGURE 10. The distribution of RMSE at each run of each algorithm.
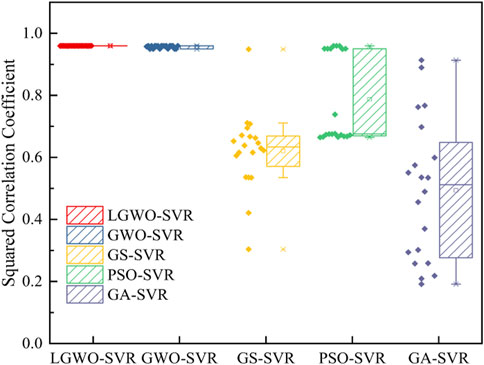
FIGURE 11. The distribution of R2 at each run of each algorithm.
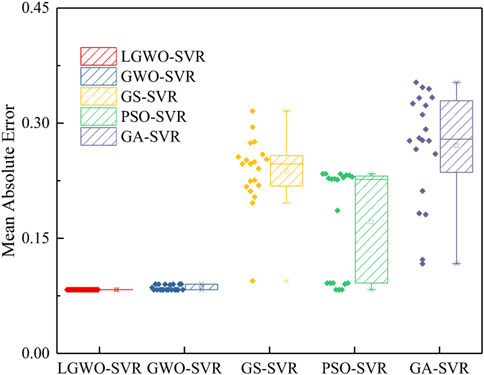
FIGURE 12. The distribution of MAE at each run of each algorithm.
Figure 13 shows the convergence curves of the five algorithms. The LGWO algorithm can reach the best solution at the third iteration although the initial fitness of the LGWO algorithm is much higher than the other algorithms, which indicates that the LGWO algorithm performs well in solution rate.
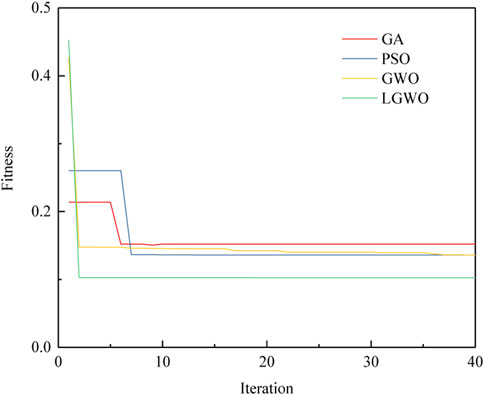
FIGURE 13. Convergence curves of the five algorithms over 20 independent runs.
The above evaluations show that the LGWO algorithm performs better than the other algorithm in prediction accuracy, solution stability, and solution rate.
Considering the similar performance of the LGWO and GWO algorithms, the results of the 20 independent runs are presented in Figures 14, 15. The best series of the parameters is concentrated near (2.00,0.01) in the LGWO algorithm and the fitness of the result is all near 0.9595. However, the series of the parameter obtained from the GWO algorithm is decentralized and the fitness of six runs in 20 independent ones is about 0.9495. From this aspect, the GWO algorithm is more likely to fall into a local optimum and the LGWO algorithm can reduce the possibility of falling into a local optimum.
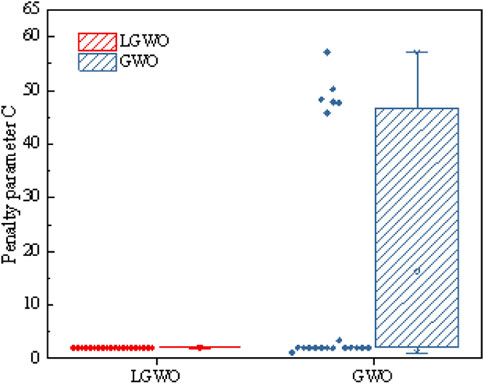
FIGURE 14. The distribution of parameter C for 20 independent runs of the LGWO and GWO algorithms.
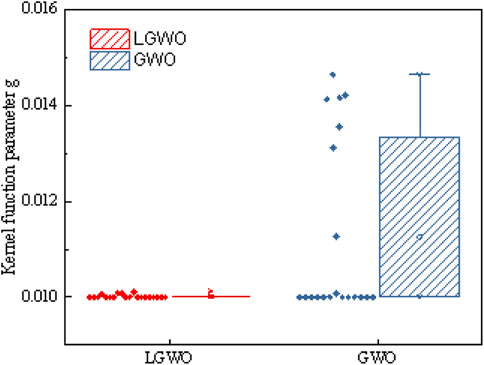
FIGURE 15. The distribution of parameter
To further validate the performances of the LGWO-SVR model, the predicted displacements of the LGWO-SVR model and the measured displacements are shown in Figure 16. The best series of the parameters (
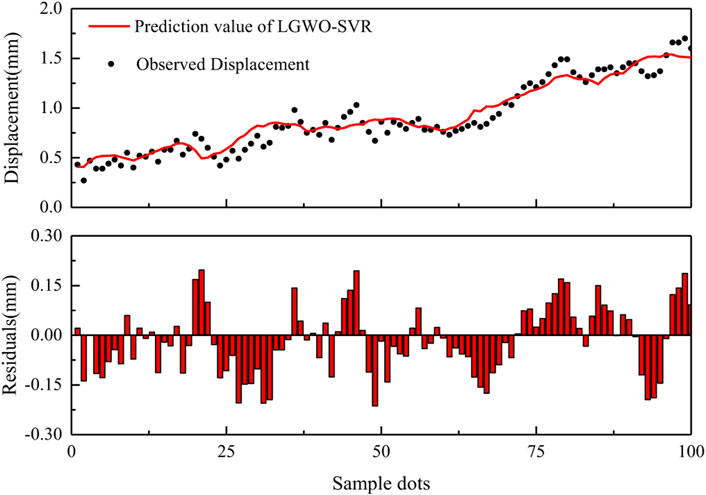
FIGURE 16. Measured and predicted displacements from the LGWO-SVR model.
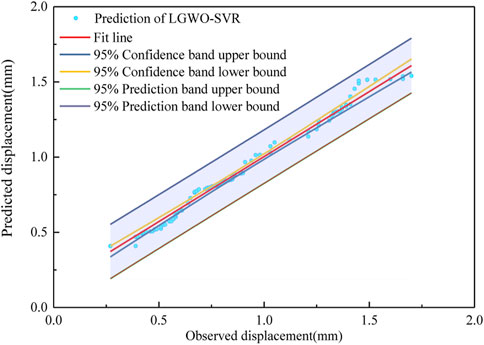
FIGURE 17. Linear regression analysis between the measured and the predicted values.
In this paper, a Levy flight-based grey wolf optimizer algorithm is applied into support vector regression for predicting dam deformation. In the proposed approach, the recently popular GWO algorithm was employed as the swarm intelligence algorithm to obtain the best parameters of the SVR model. Considering the possibility of falling into the local optimum, the Levy flight-based grey wolf optimizer was proposed to increase the chance of searching the potential global optimal solution. For verification, the results of the LGWO-SVR model were compared with four other swarm intelligence algorithms (PSO, GA, GS, and GWO). The prediction accuracy of the model is accessed by using MAE, RMSE, and R2. The stability of the model can be seen from the distribution of the MAE, RMSE, and R2 for 20 independent runs. The results showed that the LGWO-SVR model have higher prediction accuracy, stability, and solution rate than the other swarm intelligence algorithms, and the LGWO algorithm can obtain the global optimum of the SVR model for each run. This indicates that the LGWO algorithm is a good swarm intelligence algorithm to obtain the optimal parameter of SVR. Generally, the major contribution of this study of the dam deformation prediction are highlighted as follows:
(1) The LGWO algorithm was used to obtain the best series of the parameter in the SVR model and the results showed that the LGWO algorithm have the capability to obtain the global optimum accurately and swiftly.
(2) The dam deformation predicted by the LGWO-SVR model were compared with other swarm intelligence algorithms and the result showed that the LGWO-SVR model could reach better fitting accuracy and have lower residuals.
(3) The good performance of the LGWO-SVR model indicates that the Levy flight can reduce the possibility of falling into the local optimum.
The original contributions presented in the study are included in the article/Supplementary Material, further inquiries can be directed to the corresponding author.
Conceptualization: PH; methodology: PH; validation: PH and WW; formal analysis: PH and WW; data curation: PH; writing—original draft preparation, PH; writing—review and editing, PH and WW; funding acquisition, PH.
This work was supported by the High-level Talent Start-up Research Foundation of North China University of Water Resources and Electric Power (201810001).
The authors declare that the research was conducted in the absence of any commercial or financial relationships that could be construed as a potential conflict of interest.
All claims expressed in this article are solely those of the authors and do not necessarily represent those of their affiliated organizations, or those of the publisher, the editors and the reviewers. Any product that may be evaluated in this article, or claim that may be made by its manufacturer, is not guaranteed or endorsed by the publisher.
Amirsadri, S., Mousavirad, S. J., and Ebrahimpour-Komleh, H. (2017). A Levy flight-based grey wolf optimizer combined with back-propagation algorithm for neural network training. Neural Comput. Appl. 30 (12), 3707–3720. doi:10.1007/s00521-017-2952-5
Bui, K-T. T., Tien Bui, D., Zou, J., Van Doan, C., and Revhaug, I. (2016). A novel hybrid artificial intelligent approach based on neural fuzzy inference model and particle swarm optimization for horizontal displacement modeling of hydropower dam. Neural Comput. Appl. 29 (12), 1495–1506. doi:10.1007/s00521-016-2666-0
Chen, B., Hu, T., Huang, Z., and Fang, C. (2018). A spatio-temporal clustering and diagnosis method for concrete arch dams using deformation monitoring data. Struct. Health Monit. 18, 1355–1371. doi:10.1177/1475921718797949
Faris, H., Aljarah, I., Al-Betar, M. A., and Mirjalili, S. (2017). Grey wolf optimizer: A review of recent variants and applications. Neural Comput. Appl. 30 (2), 413–435. doi:10.1007/s00521-017-3272-5
Ge, W., Li, Z., Li, W., Wu, M., Li, J., and Pan, Y. (2020). Risk evaluation of dam-break environmental impacts based on the set pair analysis and cloud model [J]. Nat. Hazards 104, 1641–1653. doi:10.1007/s11069-020-04237-9
Huang, G., Zhou, H., Ding, X., and Zhang, R. (2012). Extreme learning machine for regression and multiclass classification. IEEE Trans. Syst. Man, Cybern. Part B Cybern. 42 (2), 513–529. doi:10.1109/tsmcb.2011.2168604
Kaltich, A. M. (2015). Wavelet genetic algorithm-support vector regression (wavelet GA-SVR) for monthly flow forecasting. Water Resour. Manag. 29 (4), 1283–1293. doi:10.1007/s11269-014-0873-y
Li, M., Shen, Y., Ren, Q., and Li, H. (2019). A new distributed time series evolution prediction model for dam deformation based on constituent elements. Adv. Eng. Inf. 39, 41–52. doi:10.1016/j.aei.2018.11.006
Li, S., Fang, H., and Liu, X. (2018). Parameter optimization of support vector regression based on sine cosine algorithm. Expert Syst. Appl. 91, 63–77. doi:10.1016/j.eswa.2017.08.038
Li, Z., Zhang, Y., Wang, J., Ge, W., Li, W., Song, H., et al. (2021). Impact evaluation of geomorphic changes caused by extreme floods on inundation area considering geomorphic variations and land use types [J]. Sci. Total Environ. 754, 142424. doi:10.1016/j.scitotenv.2020.142424
Meng, Q. N., and Xu, X. (2018). Price forecasting using an ACO-based support vector regression ensemble in cloud manufacturing. Comput. Industrial Eng. 125, 171–177. doi:10.1016/j.cie.2018.08.026
Mirjalili, S. (2015). How effective is the Grey Wolf optimizer in training multi-layer perceptrons. Appl. Intell. 43 (1), 150–161. doi:10.1007/s10489-014-0645-7
Mirjalili, S., Mirjalili, S. M., and Lewis, A. (2014). Grey wolf optimizer. Adv. Eng. Softw. 69, 46–61. doi:10.1016/j.advengsoft.2013.12.007
Ranković, V., Grujović, N., Divac, D., and Milivojević, N. (2014). Development of support vector regression identification model for prediction of dam structural behaviour. Struct. Saf. 48, 33–39. doi:10.1016/j.strusafe.2014.02.004
Rasmussen, C. E. (2003). “Gaussian processes in machine learning,” in Lecture notes in computer science, 63–71.
Salazar, F., Moran, R., Toledo, M. A., and Onate, E. (2017). Data-based models for the prediction of dam behaviour: A review and some methodological considerations. Archives Comput. Methods Eng. 24 (1), 1–21. doi:10.1007/s11831-015-9157-9
Searemi, S., Mirjalili, S. Z., and Mirjalili, S. M. (2014). Evolutionary population dynamics and grey wolf optimizer. Neural Comput. Appl. 26 (5), 1257–1263. doi:10.1007/s00521-014-1806-7
Shu, X., Bao, T., Li, Y., Gong, J., and Zhang, K. (2021). VAE-TALSTM: A temporal attention and variational autoencoder-based long short-term memory framework for dam displacement prediction. Eng. Comput. 38, 3497–3512. doi:10.1007/s00366-021-01362-2
Smola, A. J., and Scholkopf, B. (2004). A tutorial on support vector regression. Statistics Comput. 14 (3), 199–222. doi:10.1023/b:stco.0000035301.49549.88
Song, X., Tang, L., Zhao, S., Zhang, X., Li, L., Huang, J., et al. (2015). Grey Wolf Optimizer for parameter estimation in surface waves. Soil Dyn. Earthq. Eng. 75, 147–157. doi:10.1016/j.soildyn.2015.04.004
Su, H., Li, X., Yang, B., and Wen, Z. (2018). Wavelet support vector machine-based prediction model of dam deformation. Mech. Syst. Signal Process. 110, 412–427. doi:10.1016/j.ymssp.2018.03.022
Su, H., Wen, Z., Sun, X., and Yang, M. (2015). Time-varying identification model for dam behavior considering structural reinforcement. Struct. Saf. 57, 1–7. doi:10.1016/j.strusafe.2015.07.002
Viswanathan, G. M., Afanasyev, V., Buldyrev, S. V., Murphy, E. J., Prince, P. A., and Stanley, H. E. (1996). Lévy flight search patterns of wandering albatrosses. Nature 381 (6581), 413–415. doi:10.1038/381413a0
Wei, B., Yuan, D., Li, H., and Xu, Z. (2019). Combination forecast model for concrete dam displacement considering residual correction. Struct. Health Monitoring-an Int. J. 18 (1), 232–244. doi:10.1177/1475921717748608
Xue, Y., Jiang, J., Zhao, B., and Ma, T. (2018). A self-adaptive artificial bee colony algorithm based on global best for global optimization. Soft Comput. 22 (9), 2935–2952. doi:10.1007/s00500-017-2547-1
Yang, X., and Deb, S. (2009). “Cuckoo search via lévy flights,” in 2009 World Congress on Nature & Biologically Inspired Computing (NaBIC), Coimbatore, India, 09-11 December 2009 (IEEE), 210–214.
Keywords: dam deformation, support vector regression, grey wolf optimizer algorithm, levy flight, machine learning
Citation: He P and Wu W (2023) Levy flight-improved grey wolf optimizer algorithm-based support vector regression model for dam deformation prediction. Front. Earth Sci. 11:1122937. doi: 10.3389/feart.2023.1122937
Received: 13 December 2022; Accepted: 03 January 2023;
Published: 19 January 2023.
Edited by:
Wei Ge, Zhengzhou University, ChinaReviewed by:
Zhen Wang, Nanjing University of Science and Technology, ChinaCopyright © 2023 He and Wu. This is an open-access article distributed under the terms of the Creative Commons Attribution License (CC BY). The use, distribution or reproduction in other forums is permitted, provided the original author(s) and the copyright owner(s) are credited and that the original publication in this journal is cited, in accordance with accepted academic practice. No use, distribution or reproduction is permitted which does not comply with these terms.
*Correspondence: Peng He, aGVwZW5nQG5jd3UuZWR1LmNu
Disclaimer: All claims expressed in this article are solely those of the authors and do not necessarily represent those of their affiliated organizations, or those of the publisher, the editors and the reviewers. Any product that may be evaluated in this article or claim that may be made by its manufacturer is not guaranteed or endorsed by the publisher.
Research integrity at Frontiers
Learn more about the work of our research integrity team to safeguard the quality of each article we publish.