 Jiaming Ni1,2
 Xiu Luo
95% of researchers rate our articles as excellent or good
Learn more about the work of our research integrity team to safeguard the quality of each article we publish.
Find out more
ORIGINAL RESEARCH article
Front. Earth Sci. , 27 December 2023
Sec. Environmental Informatics and Remote Sensing
Volume 11 - 2023 | https://doi.org/10.3389/feart.2023.1121345
This article is part of the Research Topic Management and Monitoring of Natural Disasters Using Remote Sensing and Ground-Based Data View all 5 articles
Sichuan-Tibet Railway spans several watersheds such as Jinsha River and Yalong River, and Potential landslides are frequent along the route, which poses serious hazards to the normal construction and operation of the railroad. The traditional time-series InSAR technology is limited by the number of images and other restrictions, and has a long solution time, making it difficult to obtain information on short-term occurrence of deformation and unable to perform wide-area potential landslides monitor quickly. In this paper, taking a geological hazard-prone area in the Jinsha River basin (or a section of the Sichuan-Tibet line) as an example, based on the Sentinel-1 satellite SAR data provided by the Copernicus program of ESA, the model corrects the interferometric superposition deformation results obtained from a small number of SAR images (less than 7), decodes the corrected rate results, and identifies a total of 13 areas where deformation obviously occurs A total of 13 typical areas with significant deformation were identified. The identified typical areas were time-series solved and their deformation was traced. The method provides a new idea for identification and monitor of Potential landslides in a wide area and further promotes the development of disaster prevention and mitigation.
The Sichuan-Tibet Railway is of great strategic significance for the development of western China and the economic and social development of Tibet, with a total length of 1,543 km, starting from the Chengdu junction in the east, passing through Kangding, Changdu, Linzhi, and finally reaching Lhasa in the west, which is in the terrain spanning the transition from the Sichuan basin to the Qinghai-Tibet Plateau, spanning several basins such as the Jinsha and Yalong rivers, with strong tectonic activity and adverse geological effects along the route (Peng et al., 2020; Wang et al., 2020; Bai et al., 2021; Gao et al., 2021). Among them, the Jinsha River basin is mostly an alpine valley area with complex topography, great altitude drop and frequent high landslide hazards, which is a potential threat to the route selection, construction and future operation of the Sichuan-Tibet Railway. Therefore, it is necessary to carry out wide-area geological hazard identification and monitor along the Sichuan-Tibet Railway to achieve early detection and prevention of Potential landslides and to guarantee the normal operation of major projects such as the Sichuan-Tibet Railway.
The Jinsha River basin, which runs through it, is a typical high mountain valley landscape with complex topography and large elevation differences, and coupled with the influence of groundwater and other factors, high landslide hazards are particularly frequent. Therefore, this paper selects the geological disaster-prone area in the Jinsha River basin for experimental analysis (Figure 1).
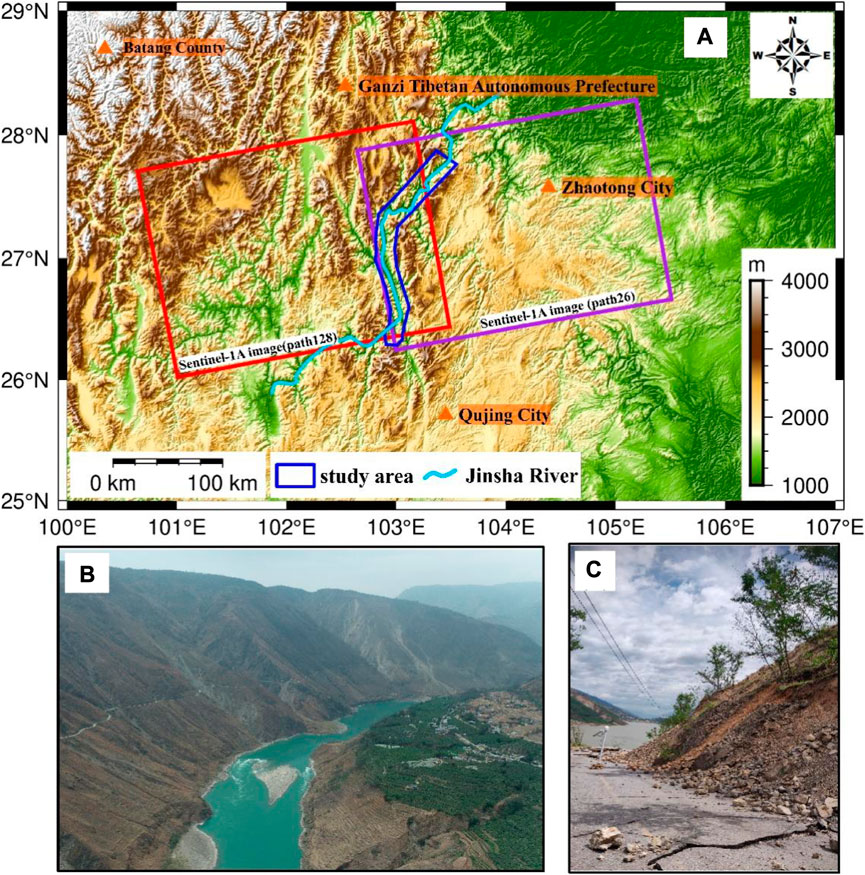
FIGURE 1. (A) Study area and data coverage; (B, C) Selected landforms in the region.
The Jinsha River basin section of Sichuan-Tibet Railway has a large relative height difference and steep terrain, which is a typical alpine valley terrain, and its Potential landslides are often characterized by wide distribution, inconvenient traffic and difficult to reach by people in the slip source area (Ge et al., 2019; Zhu et al., 2021; Yang et al., 2022), and the task of geological hazard prevention and control is arduous. In recent years, InSAR technology has been widely used in geological hazard monitor because of its advantages of wide monitor range, all-day, all-weather, and high monitor accuracy (Xie et al., 2020; Zhang et al., 2020; Li et al., 2021), and certain research results have been achieved (Zhang, 2018; Dong et al., 2019; Li et al., 2019; Dai et al., 2020; DAI et al., 2021). Xiang et al. (2023) used Stacking-DInSAR method to accurately detect the existence of a large landslide cluster consisting of 10 landslides with the largest landslide body area of 5 million square meters between Shama scheme and South Line scheme of Sichuan-Tibet Railway. Zhang et al. (2021a) performed early identification of landslide hazards in the Lancangjiang section of the Sichuan-Tibet Railway by combining Sentinel-1 (elevated track) and RADARSAT-2 (lowered track) data in a complementary manner. The interpretation results showed that 113 landslide hazards in the Lancang River section of the Sichuan-Tibet Railway were identified from August 2018 to February 2020, among which 4 landslide hazards intensive areas and 13 typical landslide hazards existed. Guo et al. (2021) used the small baseline subset (SBAS) technique to process L-band and C-band SAR data and identified 13 landslides in the reservoir area of Gushui hydropower station in the upper Lancang River. Landslides, 10 of which were new landslides, and refined deformation analysis of the Zhenggang landslide, which revealed that the local instability of the leading edge of the landslide may weaken the support of the trailing edge, leading to the gradual backward and upward development of the landslide, which eventually becomes a large landslide. Zhang et al. (2021b) used a total of 40 Sentinel SAR images from November 2017 to March 2019, and used the superimposed InSAR method for qualitative identification of potential landslides, and 72 active slopes were successfully detected as potential landslides.
Although the time-series InSAR technology has matured, the monitor accuracy of this technology is highly dependent on the number of images, and the long data processing time and high hardware equipment requirements make it impossible to quickly identify the potential hidden hazard points, especially in the wide area of high mountain and valley regions where its drawbacks are more prominent. Based on this, in order to meet the identification and analysis of potential landslides in a wide area, this paper proposes a method for identification and refined analysis of Potential landslides in a wide area. Firstly, a small amount of Sentinel-1 SLC data is used for interferometric pair superposition analysis to quickly identify the wide area geohazards in the study area. Due to the small amount of data used, there are certain errors in the deformation rate results, so this paper combines the characteristics of deformation rate data and selects a linear function model to correct the results, and then identifies the areas where deformation has obviously occurred. Finally, the time-series InSAR (SBAS-InSAR) technique combined with multi-order SAR images is used to refine the analysis of the areas with obvious deformation, so as to achieve the purpose of identification of wide area geohazards and fine analysis of deformation patterns, which provides a new idea for and efficient identification of wide area geohazards.
The Sichuan-Tibet Railway spans the Qinghai-Tibet Plateau, Yunnan-Guizhou Plateau and its surrounding areas, which are the most intense neotectonic movements in the world. It is characterized by large topographic elevation difference, complex geological conditions, intense tectonic activity and extreme climatic conditions. It breeds typical and special adverse geological phenomena such as high and steep dangerous rock mass, plateau debris slope and high-speed remote landslide. The Jinsha River basin, which runs through it, is a typical high mountain valley landscape with complex topography and large elevation differences, and coupled with the influence of groundwater and other factors, high landslide hazards are particularly frequent (Figures 1B, C). Therefore, this paper selects the geological disaster-prone area in the Jinsha River basin for experimental study (Figure 1A).
The Sentinel-1 satellite SAR data provided by the Copernicus program of ESA was selected for experimental processing. The data are in C-band, with short re-entry cycle time and large coverage area, and have wide application in geohazard monitor (Bai, 2020). In this paper, a total of 61 views of Sentinel-1 ascending single look complex (SLC) images were acquired from two orbits (path128, path26) in the study area (Figure 1A). The image was acquired with a single polarization mode (VV) and an Interferometric Wide swath (IW) observation mode, which enables the acquisition of 250 km of data at a spatial resolution of 5 m × 20 m (single-look). The 61-view data were collected for the period from July 2020 to July 2022. Among them, the 6–7 view SAR images from April to June of 2021 were used for processing in the process of wide-area geohazard identification after model correction. The deformation from July 2020 to July 2022 was retroactively used in the single refinement deformation analysis after the wide area geohazard screening.
In order to achieve the purpose of fast identification and refinement analysis of wide area geohazards, it is mainly divided into two modules for analysis based on linear model correction for fast acquisition of typical deformation area in wide area and refinement analysis of deformation in typical area (Figure 2).
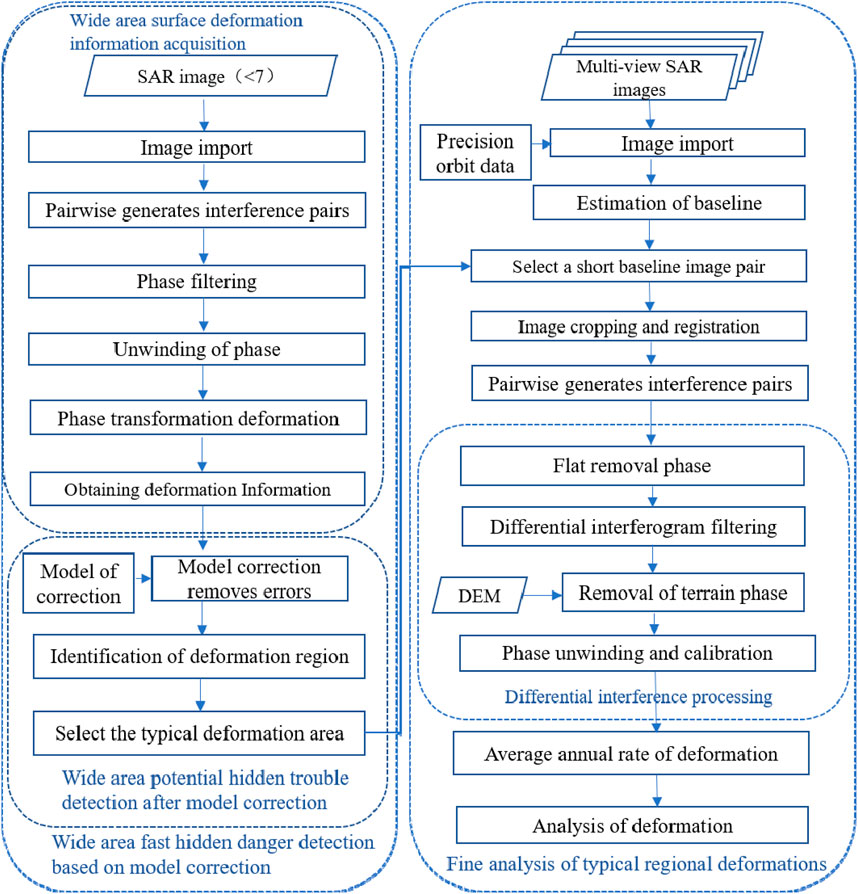
FIGURE 2. Technology roadmap.
The SAR images from April 2021 to June 2021 were collected, and certain time baselines and spatial baselines were set, and the images were interfered with two by two to form interferometric pairs. Due to the inherent errors of speckle noise, temporal decoherence and geometric decorrelation in the imaging and interferometric processing of SAR system, the differential interferometric phase after interference is filtered to remove the influence of isolated random noise to some extent; secondly, the filtered interferometric phase is phase unwound to recover the blurred out whole-perimeter phase in the main value of the phase and calculate the correct elevation or deformation information.
Through the visualization analysis of the final speed result in the early stage, it is found that it presents an obvious linear relationship with the elevation information. Therefore, a linear model is used to eliminate the linear relationship between elevation and atmospheric data. The complete linear model structure is V'=V-(a*h+b). The fitting model of the error term is fixed as a linear function ∆V=a*h+b, and the correlation coefficients a and b are calculated by using the auxiliary elevation data. Finally, the corrected speed value V′ is obtained by subtracting the fitting error term ∆V from the original speed data. The unfolded phase information after recovering the whole-period blurred degree is transformed into deformation information, and then the average deformation rate in the study time range is obtained (Figure 2 part of wide area surface deformation information acquisition).
Due to the small number of interference pairs involved in the processing of superposition, it is impossible to finely remove the influence of random errors such as the atmosphere, and the coastal mountains such as the Jinsha River are seriously affected by the atmosphere, etc., so that the monitor of disasters cannot be carried out accurately. In this paper, the correlation between the obtained deformation rate results and the elevation is used to obtain the fitted linear function by combining the elevation data with the deformation rate results, and then the fitted linear function linear model is used to correct the deformation rate results to remove the linear correlation between the deformation rate and the elevation. Based on the corrected rate values, the potential hazard points are identified (Figure 2: Wide area potential hazard identification after linear model correction).
The time series InSAR technique is used to refine the analysis of the identified typical potential landslides. The SAR images in N-sub SLC format are used to form an interference pair network based on certain spatio-temporal baseline thresholds. The phase ramp that still exists after differential interference, de-leveling, filtering, phase untwisting, and control point (Geodetic Control Point, GCP) points are used to estimate and remove the residual constant phase and untwisting, and the single point phase time series equation is solved to obtain the linear deformation rate and elevation residual error (Bai, 2020; Yuan, 2020). For the residual phase, the Singular Value Decomposition (SVD) decomposition and filtering techniques are used to separate the nonlinear deformation and atmospheric delay phase to obtain the complete annual average deformation information (Figure 2 Typical regional deformation refinement analysis section). Finally, it can achieve the purpose of identification of wide area Potential landslides and refinement of deformation analysis in key areas.
The visual analysis of the velocity value and the elevation information shows that the value of the deformation velocity is positively correlated with the elevation to some extent. The fitting linear model of the fixed error term is a linear function ∆v = a*h+b, and the correlation coefficients a and b are obtained by using the auxiliary elevation data. Finally, the corrected rate value V′ is obtained by subtracting the fitted error term ∆V from the original rate data, namely V’ = V-(a*h+b). Figures 3(A1–E1). The function simulation is carried out on the corrected speed result, and a certain linear function is selected to fit the elevation value (h) and the speed value (V’) of the 5 regions. It is found that the degree of fitting is good, eliminating the linear relationship between ∆V and the elevation, and correcting the error term. In section III, the linear relationship is most obvious as V =0.103h-160.2 (Figure 3C1). After using the linear model to correct, the function fitting of elevation value and rate value was conducted again, and it was found that the linear positive correlation presented by the obvious correction effect had been effectively removed Figures 3(A2–E2), and the fitting effect of V' =0 was achieved in some areas (Figure 3C2).
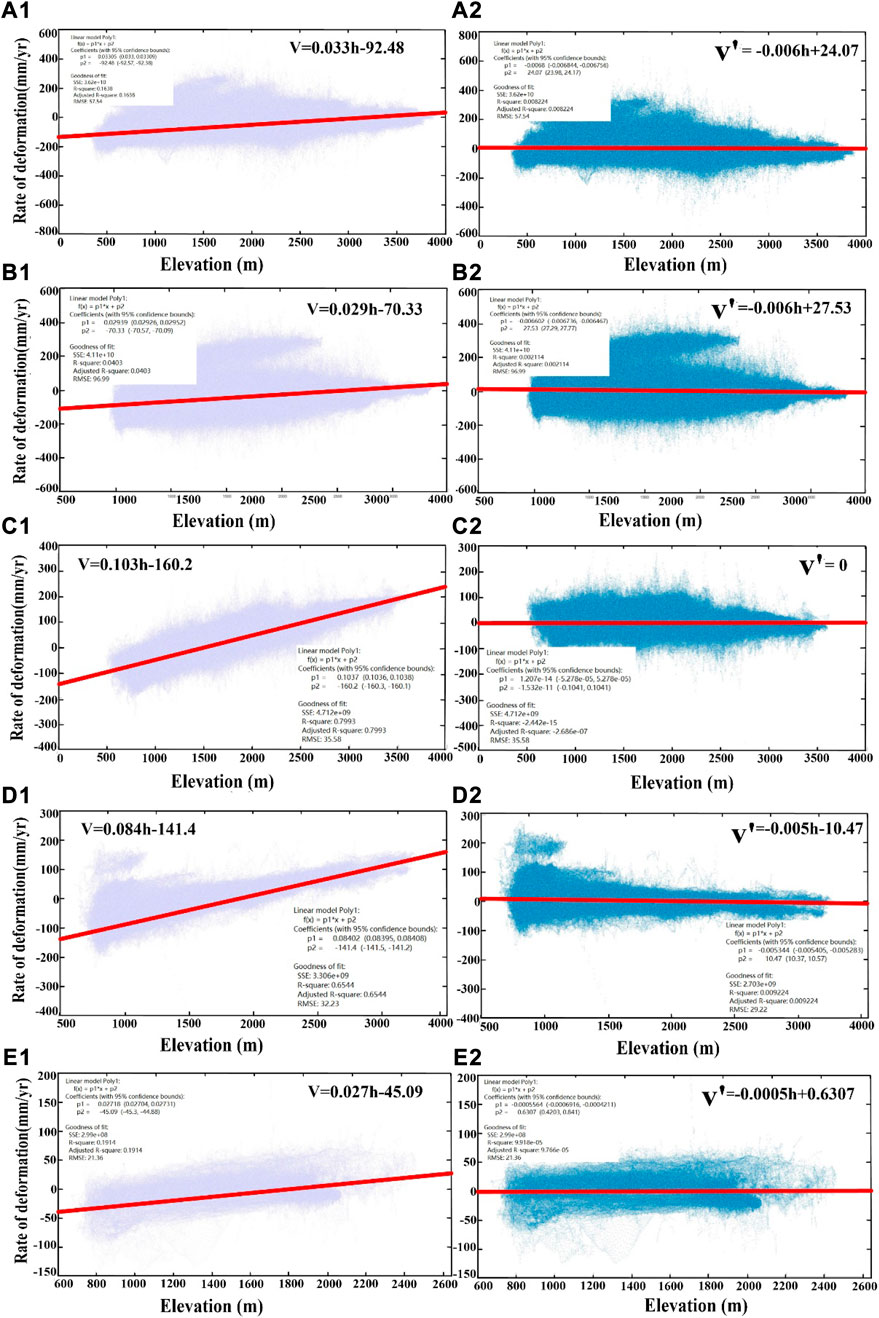
FIGURE 3. (A1–E1) model fitted functions before correction; (A2–E2) model fitted functions after correction.
To further verify the effect of linear model optimization, the data and models before and after optimization were compared and analyzed (Table 1).
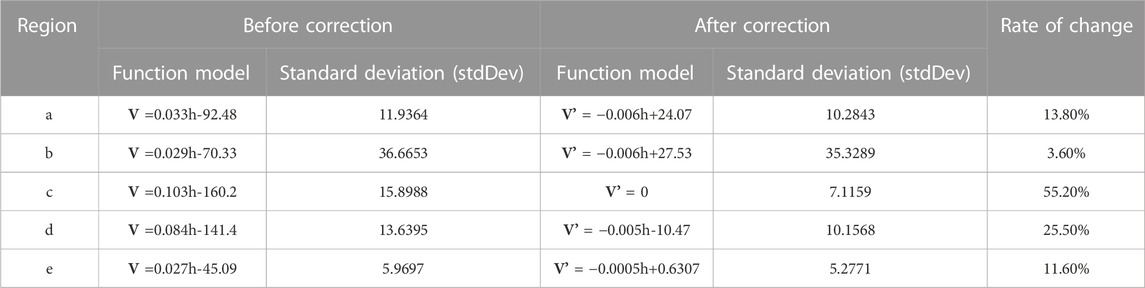
TABLE 1. Comparison before and after model correction.
In this paper, two indicators, standard deviation and rate of change of standard deviation, are used to evaluate the effect of model correction. The smaller the standard deviation, the smaller the dispersion of the data and the less affected by random noise; on the premise that the standard deviation is reduced, the greater the rate of change before and after the improvement, the better the improvement effect. The rate before optimization is modeled with the elevation data as a function of the corresponding model, and the overall positive correlation is shown. The maximum slope reached 0.1, the maximum “0”value point threshold reached −160, and the standard deviation was calculated to be between 5 and 36. After the linear model correction, the linear positive correlation trend was removed, and the best area of the corrected linear model reached V’=0 with standard deviations between 5 and 35, which were reduced compared with the pre-correction period. Comparing the results before and after correction, the maximum rate of change reaches 55%. Therefore, the linear model is significantly corrected to effectively remove this linear relationship.
A wide-area geohazard deformation solution was performed for the study area using 6–7 view SAR images from April to June 2021. The study area was divided into five sections (I-V) from north to south for processing, as detailed in Figure 4. Information on the slope deformation characteristics of each section was extracted separately, and the obtained annual average deformation rates in the radar line of sight direction are shown in Figure 4. As can be seen from the figure, the obtained deformation rate values range from −611 to 567 (mm/year); before the linear model correction, the rate values increase with the increase of elevation (Figure 4A); after the linear model correction, the linear relationship between the rate values and the elevation is effectively removed (Figure 4B).
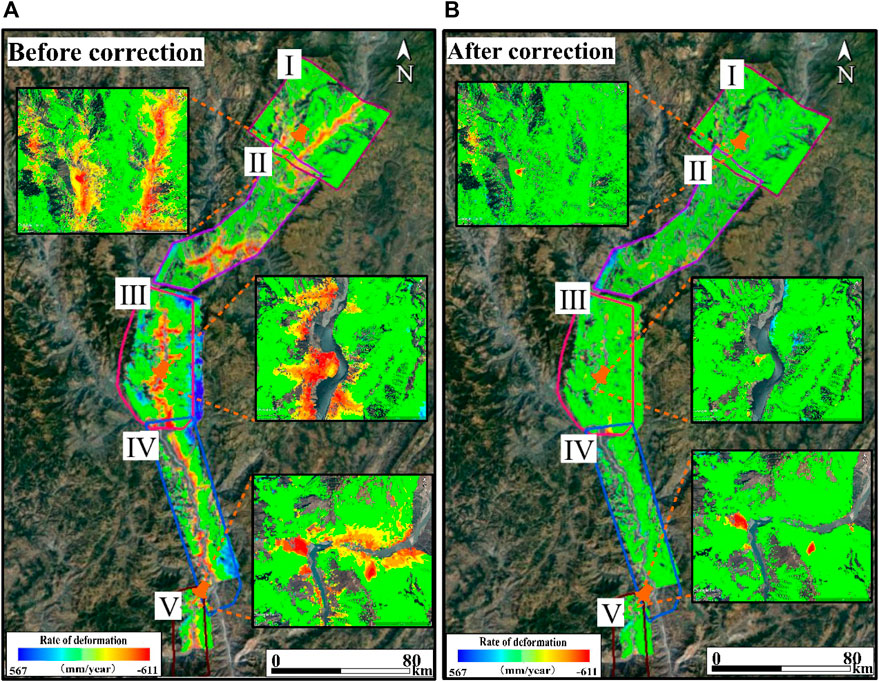
FIGURE 4. Overall overview of the study area (negative red values represent the displacement of the target feature away from the satellite direction; positive blue values represent the displacement of the target feature close to the satellite direction).
Three sections 01, 03 and 05 were selected for detailed analysis in the study area (Figure 5). The analysis of the rate results containing the effect of errors reveals that the rate results are generally negative (red) in the low elevation region and show positive values (blue) in the high elevation region, and the rate values increase with elevation Figures 5(A1–C1). This pattern masks the original deformation information of the slope where deformation occurs, and the deformation area cannot be effectively monitored. The results are corrected by using a certain linear model to remove the linear correlation between the rate and elevation. From the corrected results, it can be seen that the correction effect is obvious and the linear correlation is effectively removed Figures 5(A2–C2), and the deformation area can be effectively highlighted.
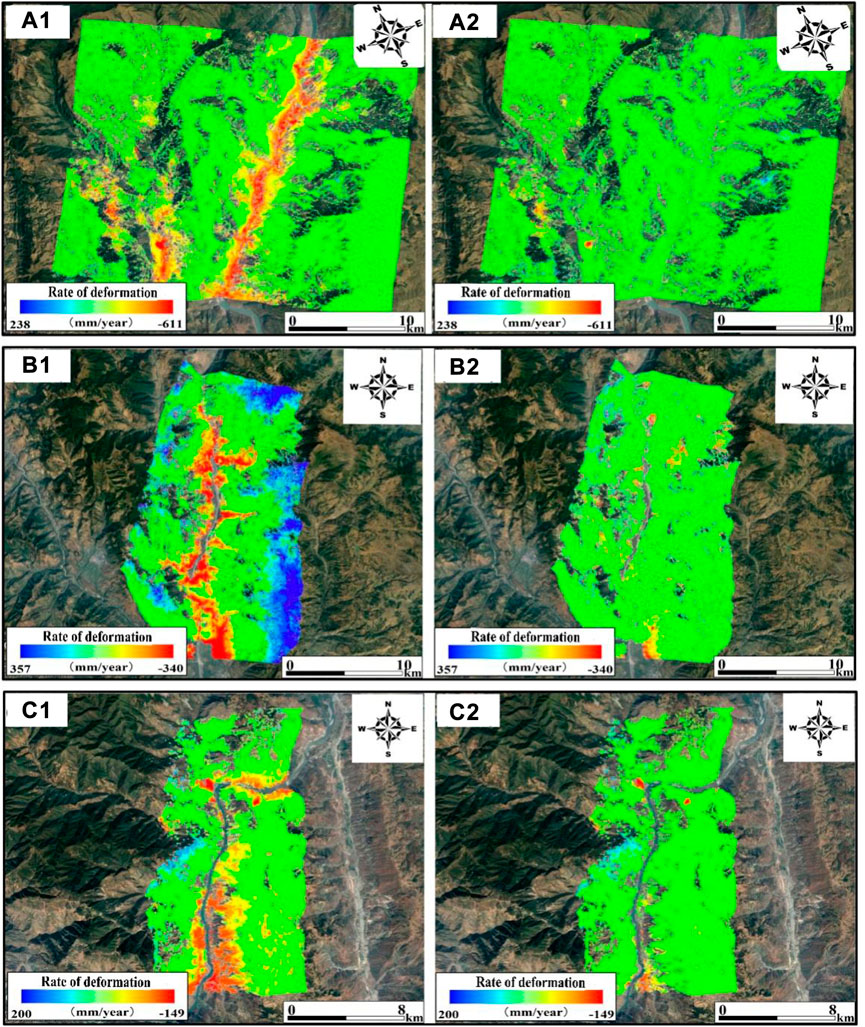
FIGURE 5. (A1–C1) results of deformation rate before model correction; (A2–C2) results of deformation rate after model correction.
By interpreting the corrected rate results, 13 slopes with obvious deformation were identified (Figure 6). The deformation range of these slopes is more obvious, and the deformation magnitude and deformation area are larger, and they are all distributed along both sides of the river, which deserve key attention.
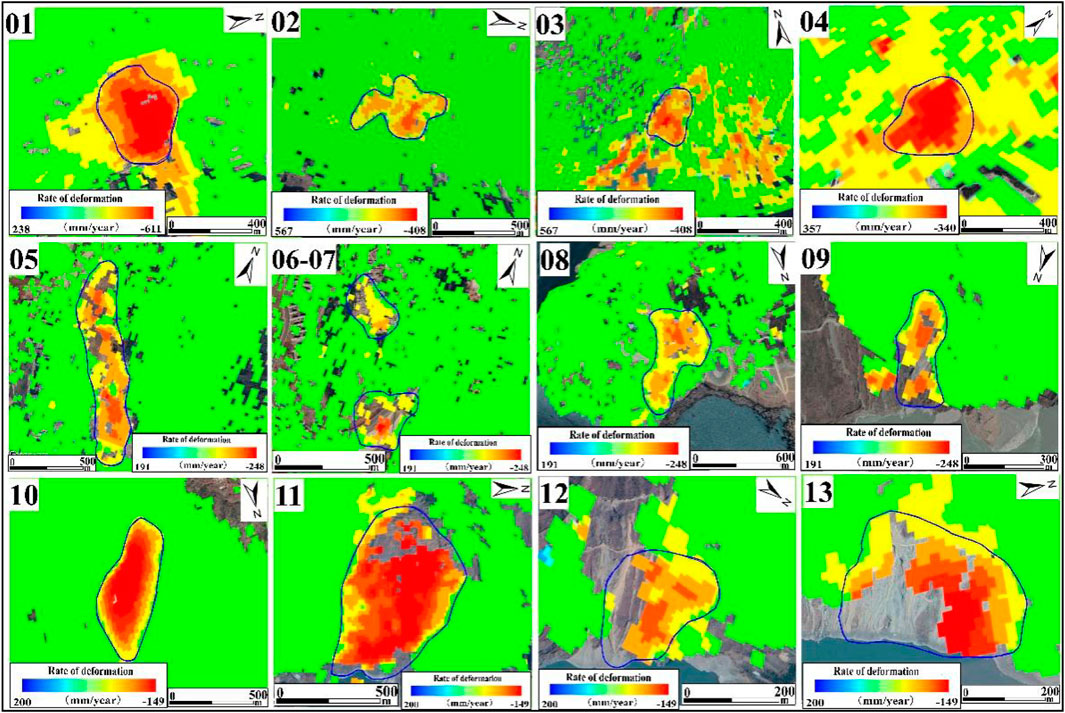
FIGURE 6. Identification of 13 deformed slopes based on corrected deformation information.
In this paper, two typical regions of 10 and 11 with obvious deformation, large magnitude and large deformation area are selected from the 13 obvious deformation regions identified by the corrected rate results, and their detailed deformation information is obtained by refining the analysis using the time series from July 2020 to July 2022.
Slope 10 is distributed along the Jinsha River, with sparse vegetation cover and good coherence, and can be effectively monitored by InSAR technology. The area of strong deformation is large, about 916 m × 364 m. The height difference spans from 836 m to 1,467 m. There is an obvious funnel-type deformation, and the deformation magnitude gradually decreases from the middle to the sides, in which the center of the strong deformation area, due to the large deformation magnitude, appears out of coherence and cannot be effectively monitored (Figure 7A1). The deformation at the center of the slope, which can be effectively monitored, is the largest, with the maximum radar line-of-sight annual average deformation rate of 115 mm/year and the maximum cumulative deformation of 200 mm. 10 characteristic points in the slope were selected for deformation tracing (Figure 7A2). From the deformation time series curves, it can be seen that the overall deformation shows a continuous slow deformation with accumulating deformation magnitude. The deformation displacement at point P1 is the largest, reaching about 200 mm, and the accumulated deformation at point P10 is the smallest, about 40 mm, while the accumulated deformation at the rest of the monitor points is between 40 and 200 mm.
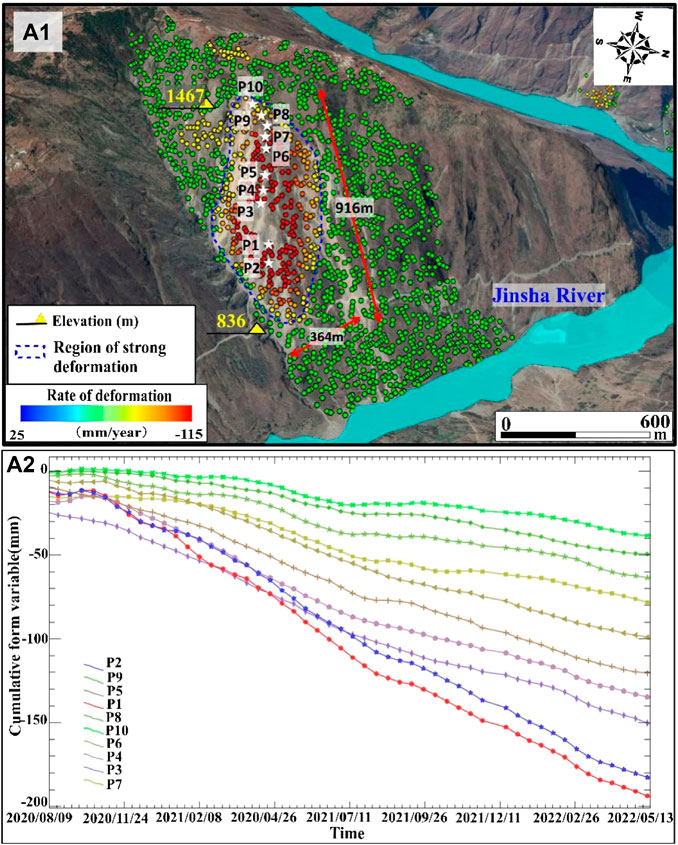
FIGURE 7. (A1) 01 slope deformation rate case; (A2) 01 slope time series curve.
The overall stability of this slope is poor and shows a state of instability. Under the action of rainfall and earthquake, large-scale crumbling and sliding may occur. Due to the proximity of Jinsha River, the destabilization and damage of the slope will affect the normal passage of the highway along the river and threaten the safety of shipping.
Slope No. 11 is distributed on the left bank of Jinsha River, and the slope is inhabited with sparse vegetation cover and good coherence. The monitor by InSAR technology has high reliability. There are signs of deformation in this area, and the area of strong deformation is about 1,153 m × 686 m, with the elevation span between 716 m and 1,610 m. The maximum radar line-of-sight annual average deformation rate can reach 115 mm/year, and the maximum cumulative deformation volume reaches 130 mm The center area of the strong deformation, due to the excessive deformation magnitude, appears out of coherence (between P1-P2 of Figure 8A), and cannot be monitored effectively (Figures 8A1). Seven characteristic points (Figures 8A2) were selected in the slope for deformation tracing. From the deformation time series curves, it can be seen that the slope body was basically in a stable state in August 2021, with only slight deformation. After August 2021, the deformation intensified and showed an accelerated state, and the overall deformation magnitude kept accumulating, in which the deformation displacement at point P1 was the largest, reaching about 130 mm, the deformation accumulation at point P10 was the smallest, at about 35 mm, and the accumulated deformation at the rest of the monitor points ranged from 35 to 140 mm.
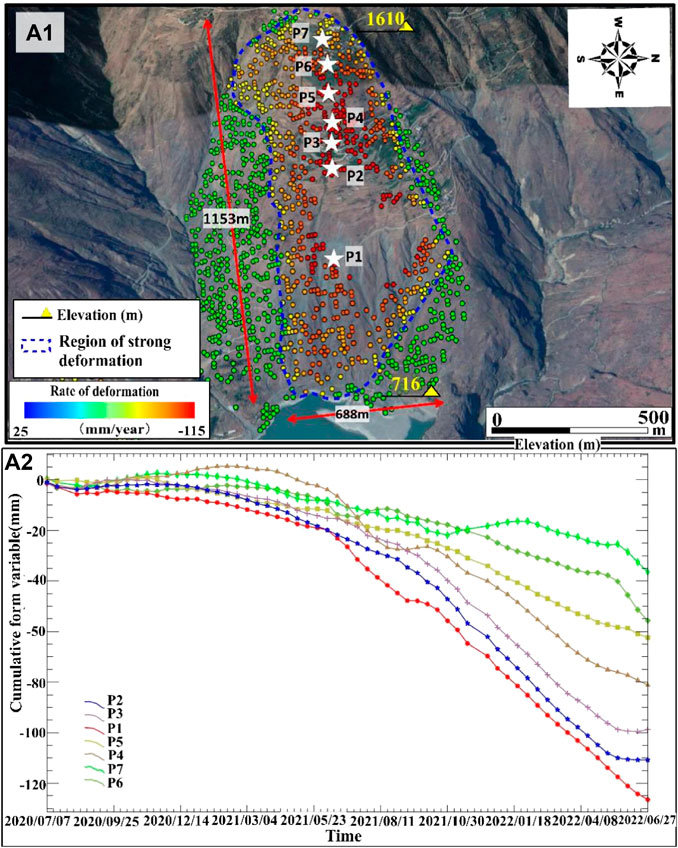
FIGURE 8. (A1) 02 slope deformation rate situation; (A2) 02 slope time series curve No. Slope deformation analysis.
Based on the analysis of the collected historical data, it is found that the slope modification body is greatly affected by water level and so on because it is near the river. In August, the water level remains at 775 m for a long time, and the water level rises at an accelerated rate (as shown in Figure 9). In short term, the stability of the slope rock and soil is damaged, the deformation rate increases, and the deformation intensifies after August 2021. It is in an accelerated state. The overall stability of the slope is poor, showing a state of instability. Under the action of rainfall and earthquake, large-scale caving and sliding may occur, threatening the life and property safety of residents, which is worthy of special attention.
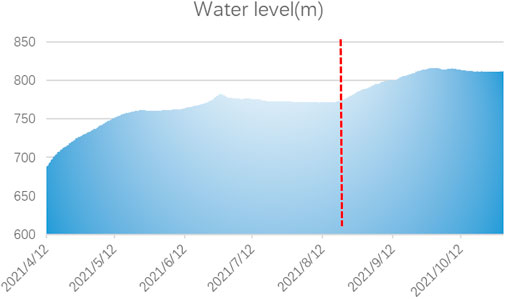
FIGURE 9. Curve of water level change.
From the above identification and refinement analysis, it can be seen that the time-series InSAR technology is not restricted by environment and terrain, and has the capability of all-day and all-weather wide-area image acquisition and monitor, high measurement accuracy, and traceable historical deformation, but as the demand for ground monitor gradually increases, the traditional time-series InSAR technology also suffers from many limitations. Through the validation and comparison of the above experiments, the method system proposed in this paper only requires less than 7 scenes of SAR for wide-area solution, which reduces the limitation of the traditional time-series InSAR technique by the amount of image data (Table 2); meanwhile, a small amount of data for wide-area monitor and tracing of historical deformation of deformation monoliths reduces the pressure of hardware memory and GPU operation, and lowers the demand of hardware equipment (Table 2); joining the computational With the small amount of data, the weight of the single image is increased when solving the average deformation rate, which facilitates the solving of new deformations and improves the deficiency of the traditional time-series InSAR technology which is insensitive to new deformations (Table 2); only a small amount of data is needed for the solving, which further accelerates the effort of wide-area geohazard monitor and achieves the effect of wide-area fast and dynamic geohazard monitor. Therefore, the method proposed in this paper solves the shortcomings of the traditional time sequence which is limited by the number of images and requires high hardware equipment, and cannot be used to monitor Potential landslides in a wide area dynamically and quickly, and can analyze the deformation of the slope with precision and cope with the suddenness of the deformation (Table 2).
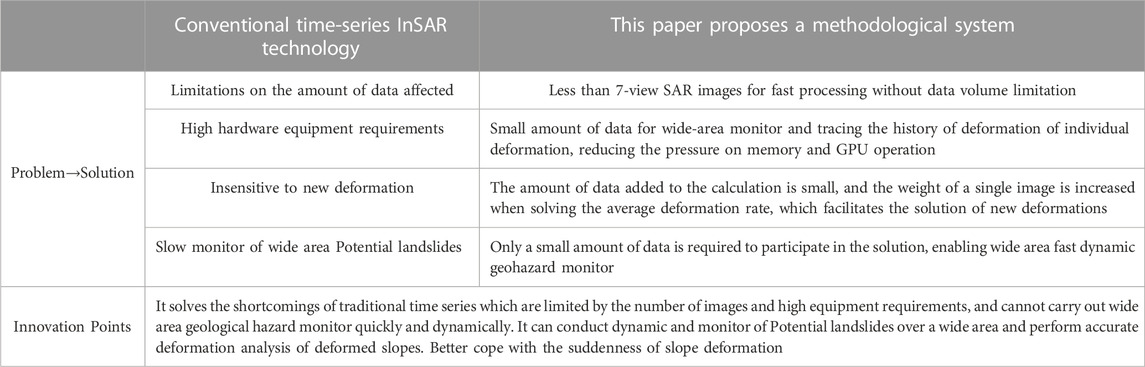
TABLE 2. Comparative analysis of the advantages and disadvantages of the methods in this paper.
In the case where the monitoring of potential geohazards over a wide area is required and the amount of data is limited, the method proposed in this paper can be used to complete the monitoring of ground deformation in a shorter working time and with higher efficiency. In addition, dynamic monitoring can be performed, and an effective monitoring scheme is proposed for strong sudden Potential landslides.
In this paper, in order to achieve the purpose of detecting Potential landslides in a wide area and refining the analysis of typical slope bodies, InSAR technology is used to carry out early identification of Potential landslides potential in a wide area and refining the analysis of typical slope bodies in the high mountain valley area of Jinsha River basin.
1. Firstly, the Sentinel-1 satellite SAR data provided by the Copernicus program of ESA are used for superposition analysis based on a small number of interferometric pairs (less than 7 views) to quickly find out the deformation in a short time range. Due to the small number of superimposed interferometric pairs, the errors caused by random noise such as the atmosphere cannot be effectively removed. In this paper, a suitable linear model is selected to correct the rate results and remove the correlation between the rate values and the elevation information, and it is proved that the accuracy is optimized after the linear model correction.
2. Secondly, the corrected rate results were interpreted to identify 13 typical regional slopes where deformation was evident.
3. Two typical slopes with large deformation magnitude and deformation area, i.e., No. 10 and No. 11, were selected for the time series solution and their deformation was traced. It is found that the maximum radar line-of-sight annual average deformation rate can reach 115 mm/year between July 2020 and July 2022, and the overall stability is poor. If landslides occur in these areas, there is a serious threat to the safety of life and property of local residents, and there is also a risk of blocking the Jinsha River and affecting the passage of the highway along the river. Through the refined analysis of typical slopes, the feasibility of geohazard monitor based on linear model-corrected short time series results is verified, and it also proves that the proposed method has certain application potential in the identification and monitor of wide area geohazard potential.
This paper takes the background that the Sichuan-Tibet Railway spans several watersheds such as Jinsha River and Yalong River, and the frequent occurrence of Potential landslides in the past has caused serious harm to the normal construction and operation of the railroad. In order to achieve early detection and prevention of Potential landslides and guarantee the normal operation of major projects such as the Sichuan-Tibet Railway, this paper proposes a solution to the traditional time-series InSAR method for geohazard identification, which is limited by the number of images, processing time, hardware conditions, etc. This paper proposes a method to solve the problem that the traditional time-series InSAR method for geohazard identification is insensitive to the information of short-term deformation occurring and cannot quickly identify and monitor wide area geohazards, which improves the efficiency of geohazard monitor and is of great significance in the identification and monitor of wide area geohazard potential. The new solution idea of this paper can warn the possible Potential landslides of major projects, which is of great significance to further promote the development of disaster prevention and mitigation.
The original contributions presented in the study are included in the article/Supplementary Material, further inquiries can be directed to the corresponding author.
JN and JP were responsible for collecting test data, XL was responsible for model calculation, WZ was responsible for modeling method guidance, PL and JL were responsible for data analysis and collation. All authors contributed to the article and approved the submitted version.
The authors declare that the research was conducted in the absence of any commercial or financial relationships that could be construed as a potential conflict of interest.
All claims expressed in this article are solely those of the authors and do not necessarily represent those of their affiliated organizations, or those of the publisher, the editors and the reviewers. Any product that may be evaluated in this article, or claim that may be made by its manufacturer, is not guaranteed or endorsed by the publisher.
Bai, Y. (2020). Characterization of surface deformation and early identification of potential landslides in the middle reaches of the Bailong River based on SBAS-InSAR technology[D]. Lanzhou University. doi:10.27204/d.cnki.glzhu.2020.000212
Bai, Y. J., Xiong, S. H., and Tie, Y. B. (2021). Study on early identification of landslide in Yalong River deep canyon area of Sichuan-Tibet Railway. Disaster Sci. 36 (03), 109–114.
Dai, C., Li, W., Lu, H., Fan, Y., Xu, Q., and Jian, J. (2021). InSAR detection of active landslides around Zhouqu County, Gansu Province. J. Wuhan Univ. Inf. Sci. Ed. 46 (07), 994–1002. doi:10.13203/j.whugis20190457
Dai, K., Yongbo, T., Xu, Q., Ye, F., Guanchen, Z., and Shi, X. (2020). Early identification of landslide hazard potential InSAR in alpine canyon area-a case study of the middle section of Yalong River. J. Radar 9 (03), 554–568.
Dong, J., Zhang, L., Liao, M., and Gong, J. (2019). Improved correction of seasonal tropospheric delay in InSAR observations for landslide deformation monitoring. Remote Sens. Environ. 233, 111370. doi:10.1016/j.rse.2019.111370
Gao, Z., Ding, M., Yang, G., Huang, T., Zhang, X., Zhou, Y., et al. (2021). Evaluation of mudslide hazard of zigzhe-bomi section of sichuan-tibet railway. J. Eng. Geol. 29 (02), 478–485. doi:10.13544/j.cnki.jeg.2021-0160
Ge, D. Q., Dai, K. R., Guo, Z. C., and Li, Z. H. (2019). Reflections and suggestions on the application of integrated remote sensing in the early identification of major Potential landslides [J]. J. Wuhan Univ. Technol. Mater. Sci. Ed. 44 (7), 949–956.
Guo, R., Li, S., Chen, Y., Li, X., and Yuan, L. (2021). Identification and monitoring landslides in Longitudinal Range-Gorge Region with InSAR fusion integrated visibility analysis. Landslides 18 (2), 551–568. doi:10.1007/s10346-020-01475-7
Li, X. E., Zhou, L., Su, F. Z., and Wu, W. Z. (2021). Application of InSAR technology in landslide hazard:progress and prospects. J. Remote Sens. 25 (02), 614–629. doi:10.11834/jrs.20209297
Li, Z., Cao, Y., Wei, J., Duan, M., Wu, L., Hou, J., et al. (2019). Time-series InSAR ground deformation monitoring: atmospheric delay modeling and estimating. Earth-Science Rev. 192, 258–284. doi:10.1016/j.earscirev.2019.03.008
Peng, J., Cui, P., and Zhuang, J. (2020). Challenges posed by Sichuan-Tibet Railway to engineering geology. J. Rock Mech. Eng. 39 (12), 2377–2389. doi:10.13722/j.cnki.jrme.2020.0446
Wang, W. D., Li, J., and Han, Z. (2020). Comprehensive assessment of geological hazard safety along railway engineering using a novel method: a case study of the sichuan- Tibet railway, China. Geomatics, Nat. Hazards Risk 11 (1), 1–21. doi:10.1080/19475705.2019.1699606
Xiang, W., Liu, G., Zhang, R., Cai, J., Zhang, B., Mao, W., et al. (2023). Analysis of time-series InSAR detection and evolution characteristics of Jinsha River landslide complex [J/OL]. Journal of Southwest Jiaotong University, 1–8.
Xie, M., Zhao, W., Ju, N., He, C., Huang, H., and Cui, Q. (2020). Landslide evolution assessment based on InSAR and real-time monitoring of a large reactivated landslide, Wenchuan, China. Eng. Geol. 277, 105781. doi:10.1016/j.enggeo.2020.105781
Yang, C., Zhang, T., Gao, G., Bu, C., and Wu, H. (2022). Application of SBAS-InSAR technology in monitoring deformation of typical giant landslides in Jinsha River basin, Jiangda County, Tibet. Chin. J. Potential landslides Prev. 33 (03), 94–105. doi:10.16031/j.cnki.issn.1003-8035.2022.03-11
Yuan, Y. (2020). Ground subsidence monitoring and mechanism analysis in Haikou area based on SBAS-InSAR technology [D]. Beijing): China University of Geosciences. doi:10.27493/d.cnki.gzdzy.2020.000958
Zhang, J., Gao, B., Liu, J., Chen, L., Huang, H., and Li, J. (2021a). Early identification of landslide hazards in Lancangjiang section of Sichuan-Tibet Railway based on SBAS-InSAR technology. Mod. Geol. 35 (01), 64–73. doi:10.19657/j.geoscience.1000-8527.2021.005
Zhang, L., Dai, K., Deng, J., Ge, D., Liang, R., Li, W., et al. (2021b). Identifying potential landslides by stacking-InSAR in southwestern China and its performance comparison with SBAS- InSAR. Remote Sens. 13 (18), 3662. doi:10.3390/rs13183662
Zhang, Y., Meng, X. M., Dijkstra, T. A., Jordan, C., Chen, G., Zeng, R., et al. (2020). Forecasting the magnitude of potential landslides based on InSAR techniques. Remote Sens. Environ. 241, 111738. doi:10.1016/j.rse.2020.111738
Zhang, Y. (2018). Research on surface deformation monitoring and early identification of landslides based on InSAR technology [D]. Lanzhou University.
Zhu, S-N., Yin, Y-P., Wang, M., Zhu, M., Chen-Hui, W., Wang, W-P., et al. (2021). Research on the destabilization mechanism and disaster mitigation measures of high remote landslides in the Jinsha River combined zone - taking the Jinsha River Sera landslide as an example. J. Geotechnical Eng. 43 (04), 688–697.
Keywords: Sichuan-Tibet Railway, model correction, potential landslides, wide area identification, refinement analysis
Citation: Ni J, Luo X, Zhu W, Pan J, Li P and Xiong L (2023) Identification and refinement of wide area potential landslides based on model correction. Front. Earth Sci. 11:1121345. doi: 10.3389/feart.2023.1121345
Received: 11 December 2022; Accepted: 30 August 2023;
Published: 27 December 2023.
Edited by:
Massimo Fabris, University of Padua, ItalyReviewed by:
Jian Chen, Chinese Academy of Sciences (CAS), ChinaCopyright © 2023 Ni, Luo, Zhu, Pan, Li and Xiong. This is an open-access article distributed under the terms of the Creative Commons Attribution License (CC BY). The use, distribution or reproduction in other forums is permitted, provided the original author(s) and the copyright owner(s) are credited and that the original publication in this journal is cited, in accordance with accepted academic practice. No use, distribution or reproduction is permitted which does not comply with these terms.
*Correspondence: Wu Zhu, c2hpcmxleWx1bzIwQDE2My5jb20=
Disclaimer: All claims expressed in this article are solely those of the authors and do not necessarily represent those of their affiliated organizations, or those of the publisher, the editors and the reviewers. Any product that may be evaluated in this article or claim that may be made by its manufacturer is not guaranteed or endorsed by the publisher.
Research integrity at Frontiers
Learn more about the work of our research integrity team to safeguard the quality of each article we publish.