 Xiuquan Hu
 Wanli Yu3*
 Jianghan Li
94% of researchers rate our articles as excellent or good
Learn more about the work of our research integrity team to safeguard the quality of each article we publish.
Find out more
ORIGINAL RESEARCH article
Front. Earth Sci., 28 March 2023
Sec. Structural Geology and Tectonics
Volume 11 - 2023 | https://doi.org/10.3389/feart.2023.1119600
This article is part of the Research TopicQuantitative Characterization and Engineering Application of Pores and Fractures of Different Scales in Unconventional Reservoirs, volume IIIView all 15 articles
Shale is a crucial natural gas resource, attracting global exploration and development interest. China has abundant shale gas resources that will drive future oil and gas exploration advances by increasing reserves and production. The WY shale gas field is the most productive and has the greatest potential for exploration and development. This study analyzed high-quality shale logging response characteristics and drilling logging, seismic, and analytical test data in the WY area to establish a rock physical model of seismic attribute parameters and shale reservoir quality parameters. Seismic elastic parameters were converted into indicators that directly reflect shale reservoir quality, such as total organic carbon (TOC), high-quality reservoir thickness, porosity, brittleness index, and crack development strength. Corresponding regression equations were established to predict quality parameters.The results showed that shale reservoir quality parameters have a good correlation with seismic parameters. The TOC distribution ranged from 2% to 5% in the study area and was generally high in the north but low in the south. The high-quality shale reserve had a thickness of over 40 meters, and except for the northwest region, the porosity was nearly over 4%. The overall brittleness of the study area was favorable, and the brittleness index was over 35%, which is suitable for network fractures formation in subsequent fracturing operations. The anisotropy of shale in S1l1I was small, and the overall fractures were underdeveloped in the study area. Drilling verifications showed that the prediction results of the quality parameters of high-quality shale reservoirs were consistent with actual drilling test results with high reliability. This study provides guidance for comprehensive prediction of sweet spots and subsequent fracturing and well location deployment.In summary, this study provides valuable insights into shale gas exploration and development in the WY area by establishing a rock physical model, predicting quality parameters, and offering guidance for fracturing and well location deployment.
As today’s society and economy grow rapidly, the current exploitation of conventional oil and gas reservoirs has become insufficient in meeting the demand for oil and gas resources. Thus, the development and utilization of non-fossil and non-conventional oil and gas energy have been a new approach considering the rapid consumption and shortage of fossil energy. Natural gas resources are a type of clean energy with low carbon emission, high calorific value, large reserves, and wide distribution. The energy type is environmentally friendly, has a wide range of uses, and has good stability. These attributes play a unique role in energy conservation and emission reduction, coping with global climate change, and avoiding smog. For example, shale gas is an important natural gas resource that emits lower greenhouse gases than fossil fuels such as oil and coal; the emission levels are consistent with the general trend of low-carbon sustainable development in various countries. Recently, many countries have shown a keen interest in the exploration and development of shale gas. This follows the success of shale oil and gas development in North America, which not only helped the United States to realize the reversal of natural gas imports and exports, but also provided the country with a sustainable green development path while boosting shale gas development in other countries (Jiang et al., 2012; Teng and Liu 2013; Sarkar et al., 2018; Zou et al., 2021). Access to mature technology and massive output has helped the United States and Canada to achieve large-scale commercial exploitation of shale gas (Liss, 2014; Selçuk and İkbal 2016; Jasmin et al., 2016; Soeder 2017; Ladevèze et al., 2019; Fahad et al., 2021). Although the exploration and development of shale gas in China started late, it has developed rapidly, especially in the upper Yangtze region of south Sichuan, east Sichuan, southeast Chongqing, north Guizhou, and west Hubei, which is the main prospect area of shale gas in China (Jia et al., 2016; He et al., 2017; Ma and Xie., 2018). Considering the Sichuan Basin as an example, the shale gas reserve in the two shale sets in the Cambrian and Silurian systems are equivalent to 1.5–2.5 times the conventional natural gas resources in the basin. Therefore, a strong prospect exists for the exploration and development of shale gas resources in China, and a substantial resource base is available for expediting the exploration and development. The Changning–Weiyuan National Shale Gas Demonstration Zone and the Fuling National Shale Gas Demonstration Zone are China’s largest shale gas production bases, with a daily output of 2.011 × 10⁷ m3. As the earliest shale gas discovery area in China, WY has developed an excellent shale gas production capacity after more than 10 years of exploration and development research, and its development prospects are relatively good (Wang et al., 2018; Zeng et al., 2018; Fan et al., 2020; Li et al., 2022). To promote the large-scale production construction in this area and the increase in shale gas production in Southwest China, it remains crucial to evaluate the favorable exploration spots in this area.
As an important unconventional oil and gas reservoir, shale has geological characteristics, such as self-generation, self-storage, adsorption accumulation, and hidden accumulation. Its reservoir evaluation and exploitation are significantly different from those of conventional natural gas (Zhang et al., 2021; Wang et al., 2016; Yang et al., 2016). Practical shale gas exploration and development have shown that this type of reservoir lacks natural productivity and requires reservoir stimulation through horizontal drilling, hydraulic fracturing, and other stimulants to achieve high production. The quality parameters of shale gas reservoirs are the key factors for shale gas drilling and fracturing selection evaluation and can indicate the shale gas resource potential. These parameters include organic carbon content, reservoir effective thickness, porosity, and brittleness index. For shale reservoirs with self-generation and self-storage properties, the development and distribution of fractures play a crucial role in the storage and migration of the shale gas, and a certain degree of the micro-fracture development zone is crucial to the construction of fracture networks in later fracturing construction (Wu, 2017; Li J. et al., 2022). Consequently, fracture prediction is also a major issue in shale gas exploration.
Previous studies have shown that through the abundance of organic matter and the effective thickness of the reservoir, the distribution and potential of the shale reservoir can be determined. Determine the oil and gas enrichment area through factors such as lithology and physical properties (porosity); And, determine the reservoir engineering quality through brittleness and fracture prediction, and select the appropriate fracturing section (Zheng et al., 2021; Li, 2022; Li et al., 2022). Therefore, research on the quality parameters of shale reservoirs is vital for predicting favorable zones, subsequent fracturing, and well site deployment. Previous studies on shale gas in the WY area have mainly focused on examining shale reservoir characteristics, while only a few have investigated the quality parameters of shale reservoirs. Moreover, only a few researchers have comprehensively predicted sweet spots through the seismic prediction of shale reservoir quality parameters while restricting further developments to subsequent exploration and development work. To estimate shale reservoir quality parameters accurately, we selected the Longmaxi–Wufeng Formation shale in the W204 well area as the research object in this study. The relationship between seismic elastic parameters and reservoir quality parameters was established by analyzing the shale reservoir’s petrophysical properties in the work area through the analysis of high-quality shale logging response characteristics. The seismic data were converted into shale gas reservoir quality data. Meanwhile, pre-stack fracture prediction was performed, providing a basis for evaluating shale gas area selection in the work area and guiding the subsequent fracturing construction and well site deployment.
The Sichuan Basin is located on the northwestern margin of the upper Yangtze platform and has experienced multiple periods of tectonic movement since the Sinian period. The Late Ordovician Five Peaks–Early Silurian Longmaxi period was a period of intense extension in southern China (Zhao et al., 2016; Niu et al., 2021; Li et al., 2023). The Longmaxi–Wufeng Formation in the Sichuan Basin is mainly exposed in southeastern Sichuan, Daba Mountain, Micang Mountain, Longmen Mountain, and the eastern side of the Kangdian ancient land on the basin’s edge, where only the Huaying Mountain is exposed. The stratum is mainly buried at a depth of 2,000–4,000 m. The WY shale gas field is located in the low-fold structural belt in southwestern Sichuan (Figure 1), adjacent to the Weiyuan structure in the north and the Ziliujing anticline in the southeast; moreover, it is generally controlled by the large-scale dome anticline in Weiyuan (Dai et al., 2020). Several wells were drilled through the Silurian strata in Weiyuan, Luzhou, and eastern Sichuan, and the drilling shows that the Upper Ordovician Wufeng Formation–Lower Silurian Longmaxi Formation is in conformity contact; the lithological boundary is the Guanyinqiao section shell limestone at the top of the Wufeng Formation limestone. Organic-rich mud shale is 30−120 m thick and is the main target formation for exploration in the WY shale gas field (Figure 1).
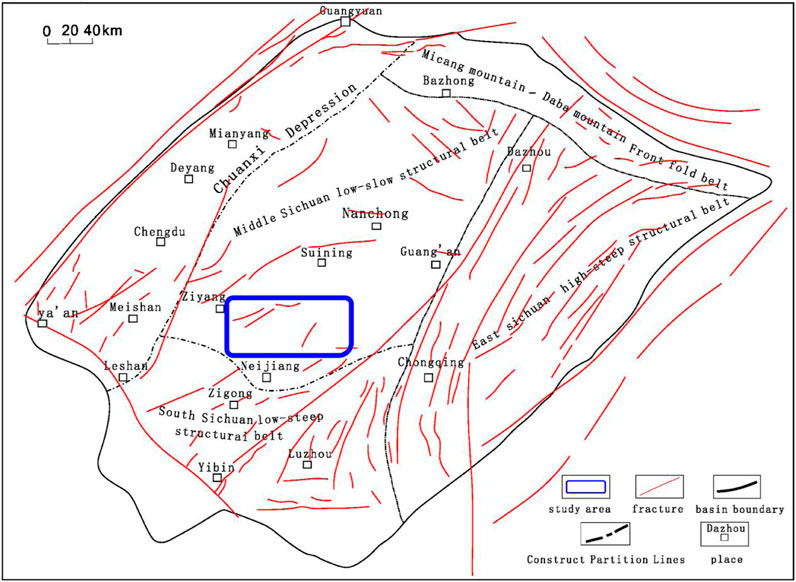
FIGURE 1. Structure location map of WY shale gas field.
The Longmaxi-Wufeng Formation in the study area is controlled by three paleo-uplifts affected by the Caledonian movement, namely the Central Sichuan paleo-uplift, the Central Guizhou paleo-uplift and the Kangdian ancient land. It is mainly a set of deep-water shelf facies deposits. The lithology is carbonaceous shale and argillaceous siltstone, which are widely distributed and relatively stable (Mou et al., 2016; Yang et al., 2019). The organic type is a sapropel-type organic formed by lower aquatic plankton and algae, mainly type I kerogen, with a kerogen index of more than 90%, mainly amorphous sapropel and algae. The sapropel group accounts for more than 95%.The Wufeng Formation in the study area can be divided into two members according to lithology and biological assemblage from bottom to top: the first and second members of the Wufeng Formation (Hu, 2021). The first member of the Wufeng Formation is black carbonaceous shale, which is rich in graptolite, slightly sandy, and siliceous, and it contains three graptolite belts. The depositional time limit was 2.46 Ma, with little lateral change. The second member of the Wufeng Formation is the original Guanyinqiao Formation. The main lithology is gray, gray-black, and medium-thick marl or argillaceous limestone. The deposition time limit was 0.73 Ma, and the lateral distribution was uneven. The Longmaxi Formation in the study area can be divided into two members according to lithology and biological assemblages (Shi et al., 2022). The first member is mainly black carbonaceous shale at the bottom, gray-black-dark gray shale and sandy shale in the middle, and dark gray-yellow-green calcareous shale in the upper part, including eight graptolite belts with a depositional time limit of 5.94 Ma. The second member of the Longmaxi Formation is a dark gray calcareous shale or gray-green sandy shale, and graptolites are rare here. The first Long segment is subdivided into subsegments Longyi 1 (S1l1I) and Longyi 2 (S1l1II). By comprehensively utilizing petrology, sedimentary structure, paleontology, and electrical properties, the Longyi 1 sub-member was subdivided into the Longyi 11 sub-member (S1l1I−1), Longyi 12 sub-member (S1l1I−2), Longyi 13 sub-member (S1l1I−3), and Longyi 14 sub-member (S1l1I−4). The Longyi 11 sub-member was in the most favorable microphase, with high organic matter abundance, well-developed organic pores, and high gas content while being the main sub-member for development (Table 1).
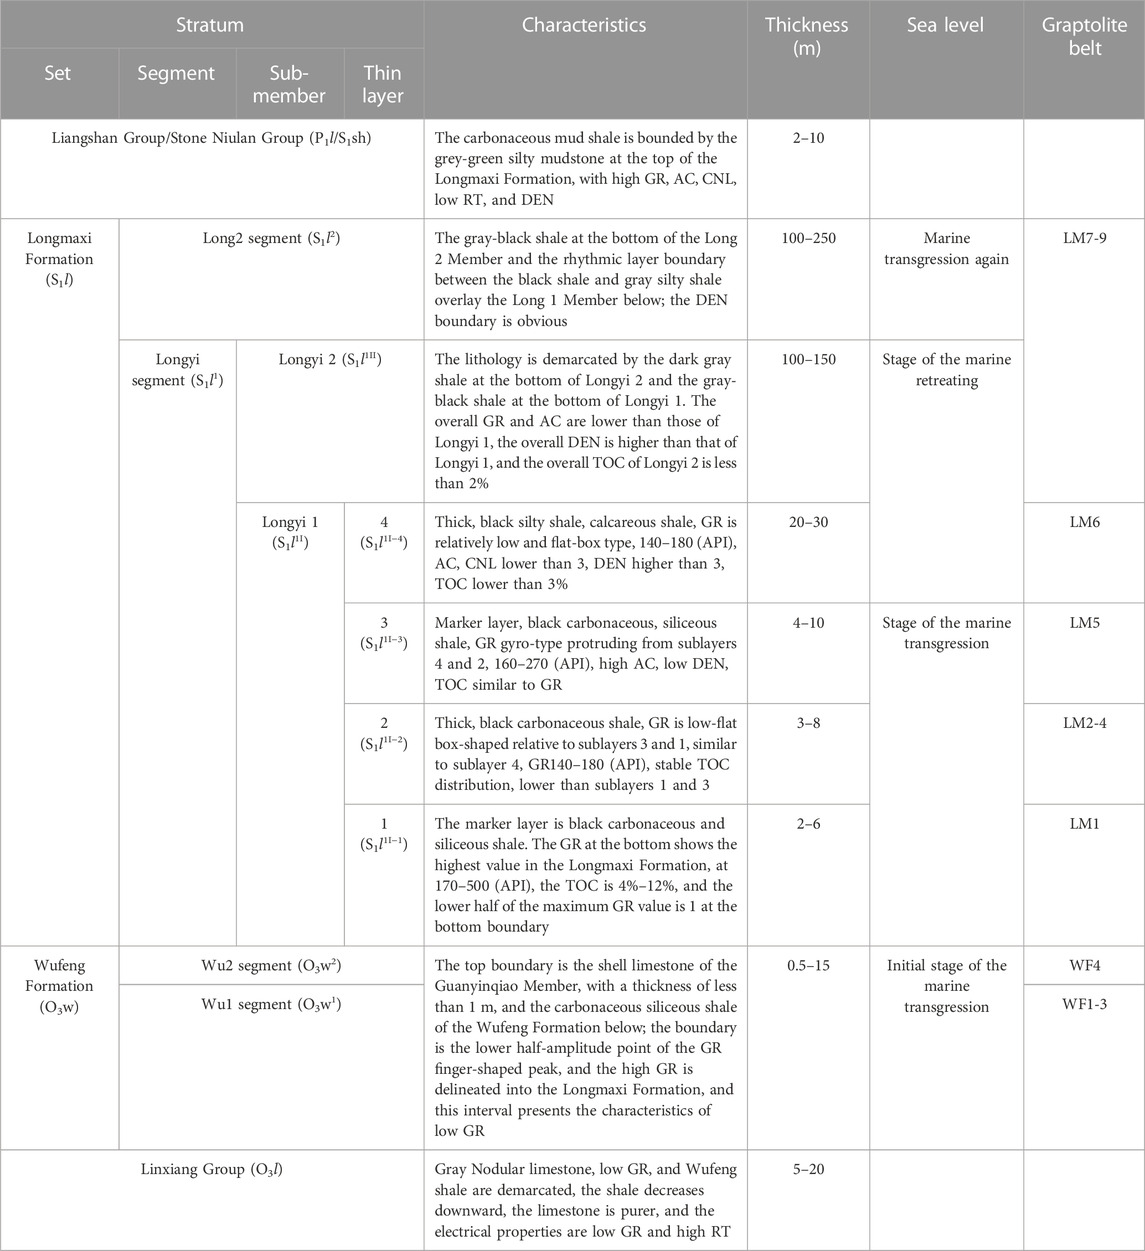
TABLE 1. Comprehensive stratigraphic division table of WY area.
According to the collected drilling logging data and the test analysis of core samples, we analyzed the high-quality shale logging response characteristics and conducted the rock physics analysis of organic carbon content, porosity, brittleness index, and other rock physics analyses of shale reservoirs. The relationship between seismic elastic parameters and reservoir quality parameters was established from the analysis of shale reservoir geological and logging response characteristics, combined with the rock physics analysis results. The post-stack inversion and pre-stack simultaneous inversion technology of constrained sparse pulse were used to convert the seismic data into shale gas reservoir quality parameters, including organic carbon content, high-quality shale reservoir thickness, porosity, and brittleness content. Error statistics were then performed to illustrate the reliability of the method. Pre-stack anisotropic fracture prediction based on seismic data in the Offset-vector tiles (OVT) domain provides a basis for shale gas selection evaluation in the work area and guides subsequent well placement and fracturing operations. W204 is used as a drilling well for seismic inversion. W211 and W213 are used as wells for verification of seismic prediction results.
The Longmaxi Formation–Wufeng Formation shale reservoir in the WY area was systematically studied, three wells (W204, W211, and W213) were considered, and one well core (W204) was observed in detail. We selected 69 core samples from the Longmaxi–Wufeng Formation shale section in the W204 well area for testing and analysis of total organic carbon (TOC), six samples for testing and analysis of total gas content, 75 samples for porosity testing, and 62 samples for brittleness index testing. The collected three-dimensional work area was approximately 383.72 km2. Shale reservoir prediction was performed synthetically using the test, logging, and seismic data.
Models of rock physics link logging and seismic waves. The models provide basic data for rock physics sensitive parameter analysis and pre-stack inversion; they also transform seismic information into reservoir description parameters such as lithology, physical properties, and oil and gas properties to describe oil and gas reservoirs quantitatively and reduce reservoir prediction risks in rock physics research (Wang, 2015; Liu et al., 2017; Zhou et al., 2021; Miele et al., 2022). Through the intersection analysis of the quality and seismic parameters of the drilling shale reservoir in the W204 well area, we established various rock physical editions, such as the rock physical edition of the ratio of compressional and shear wave velocity and TOC, density and TOC, compressional wave impedance and porosity, density and porosity, brittleness index and density, the ratio of brittleness index to compression and shear wave velocity. These rock physical editions provides a basis for subsequent predictions of reservoir quality parameters.
Seismic inversion is a core technology for reservoir prediction (Zhou, 2015). We established the relationship between the seismic and evaluation parameters and proposed using Jason’s constrained sparse pulse post-stack inversion and pre-stack simultaneous inversion to predict the quality parameters of shale gas reservoirs. These were based on the analysis of the geological characteristics and logging response characteristics of the Longmaxi–Wufeng Formation shale in the WY area, combined with the analysis results of the rock physical characteristics of the reservoir. The thickness and porosity of shale reservoirs can be predicted through post-stack impedance inversion. Similarly, pre-stack impedance inversion can be performed to obtain density, Young’s modulus, Poisson’s ratio, and brittleness index for TOC and brittleness prediction.
Because there are only three wells in the study area, post-stack inversion mainly adopts the constrained sparse pulse inversion method based on Jason. Constrained sparse pulse inversion is not based on the initial model but simply determines the reflection coefficient value according to the waveform relationship of the seismic waveform trace. It uses the well control interpolation model to control the low-frequency impedance trend and finally obtains the wave impedance inversion results (Helgesen et al., 2000; Taylor et al., 2015; Zhang and Yin, 2015; Yuan et al., 2016). Although a low wave impedance resolution is obtained by this inversion type because it does not depend on the number of wells and the initial model, the inversion error caused by the deviation of the initial model is avoided due to the small number of wells. The impedance difference depends more on the seismic reflection energy difference; therefore, it can depict the formation’s horizontal and vertical variations more accurately. Compared with post-stack inversion, simultaneous pre-stack inversion can obtain not only the P-wave impedance, but also the shear-wave impedance, density, and a series of elastic parameters derived accordingly (Figure 2). Therefore, pre-stack inversion can yield rich seismic elastic properties, which considerably increases the amount of information and number of methods for comprehensive geological and seismic interpretation.
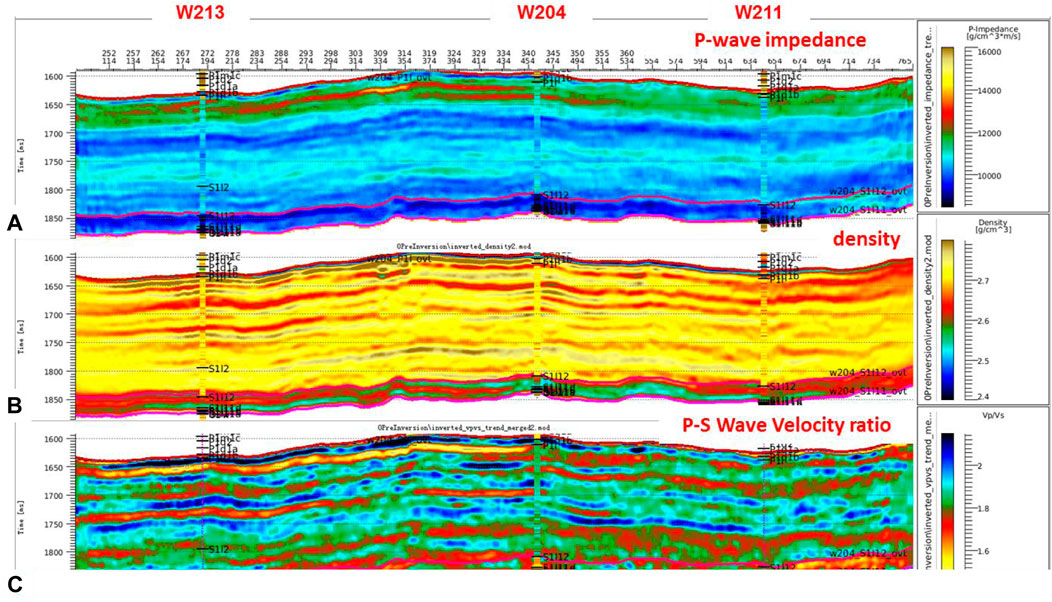
FIGURE 2. Seismic inversion section [(A) P-wave impedance inversion section, (B) density inversion section, (C) P-S Wave Velocity ratio inversion section].
Currently, seismic data are commonly used for fracture prediction, which can be roughly divided into three categories: multi-component converted wave fracture detection, post-stack seismic attribute analysis, and pre-stack anisotropic fracture detection (Dang et al., 2016; Bhattacharya and Mishra, 2018; Ge et al., 2021; Li H. et al., 2022; Ma et al., 2018; Zahm and Hennings, 2009; Zhang, 2010). However, multi-wave and multi-component data are rarely collected, and the resolution of the horizontal component data is typically lower than that of the vertical component. Hence, the horizontal component data cannot meet the general needs of fracture exploration. The post-stack seismic attribute detection fracture method is more suitable for inferring the general appearance of the fracture development area, and the calculated fracture accuracy is low. The use of pre-stack fracture prediction based on the OVT domain can improve the reliability and accuracy of the prediction results while addressing the problems of fracture orientation and fracture density or strength (Wu, 2017).
In this study, we used the pre-stack anisotropy of the amplitude variation with azimuth angle (AVAZ) based on OVT domain seismic data to perform fracture prediction investigations. Seismic waves produce certain anisotropic characteristics when passing through a fracture development zone (Ajaz et al., 2021), including AVAZ, apparent velocity variation with azimuth angle (VVAZ), wavelet frequency variation with azimuth angle (FVAZ), and frequency attenuation changes with azimuth angle (QVAZ) (Han et al., 2020). Monitoring these changes can help detect the orientation and development density of fractures (especially high-angle, high-density fractures). The azimuth variation characteristics of the bottom interface travel time and top interface amplitude of the fracture-developed layer and isotropic formation are simulated under a fixed offset. The simulation shows that in the presence of fracture-induced azimuthal anisotropy, the P-wave travel time and amplitude undergo approximately elliptical changes. In the direction of the fracture strike, the amplitude is large, whereas the travel time is short; in the vertical fracture direction, the travel time is large, whereas the amplitude value is small. Traditional common shot offset technology can be used to address the problem of VTI anisotropy. However, because the azimuth information cannot be saved by the common shot domain, the subsequent azimuthal anisotropy analysis is not feasible (Wu, 2017). OVT gather is a data domain method, which is a subdivision and reintegration form of cross-arranged subsets (Starr, 2000) that can be regarded as a single coverage of the entire work area. In the data volume, all seismic traces in the gather have roughly the same offset and azimuth (Cai, 2021), meaning OVT can be directly used for azimuth analysis after migration. This attribute is a major advantage of OVT technology (Dang et al., 2016; Wu, 2017). In addition, the number of gathers after OVT migration is large; the overall energy is more balanced; and the energy of near, medium, and far tracks tends to be consistent. OVT gathers can suppress multiple waves, highlight the energy of significant waves, and satisfy the impact of fracture prediction on the quality of seismic data requirements (Dang et al., 2016). Therefore, the pre-stack anisotropic fracture prediction based on the AVAZ was performed in the W204 well area using OVT gathers. The relevant data obtained can directly reflect vital information, such as reservoir fracture direction and density, which is helpful for drilling and developing oil wells.
We conducted a comprehensive logging evaluation, including physical property calculation, organic carbon content evaluation, gas content analysis, and brittleness coefficient evaluation. It was found that the high-quality shale in the WY area had the characteristics of “four highs”: high organic matter, porosity, air content, and brittleness index. The logging response characteristics are low density and low P-wave velocity ratio. The specific high-quality shale logging response range is: density <2.66 g/cm3, P-S wave velocity ratio <1.70, S-wave impedance <9500 m/s * g/cm3. Well W204 was sampled to determine the log response characteristics of the high-quality shale member of Longyi 1 sub-members and Wufeng Group (Table 2; Figure 3).
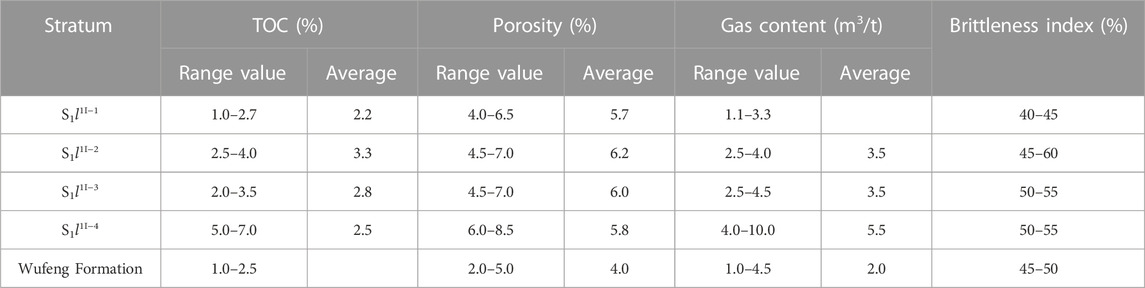
TABLE 2. Statistical table of logging response characteristics of well W204.
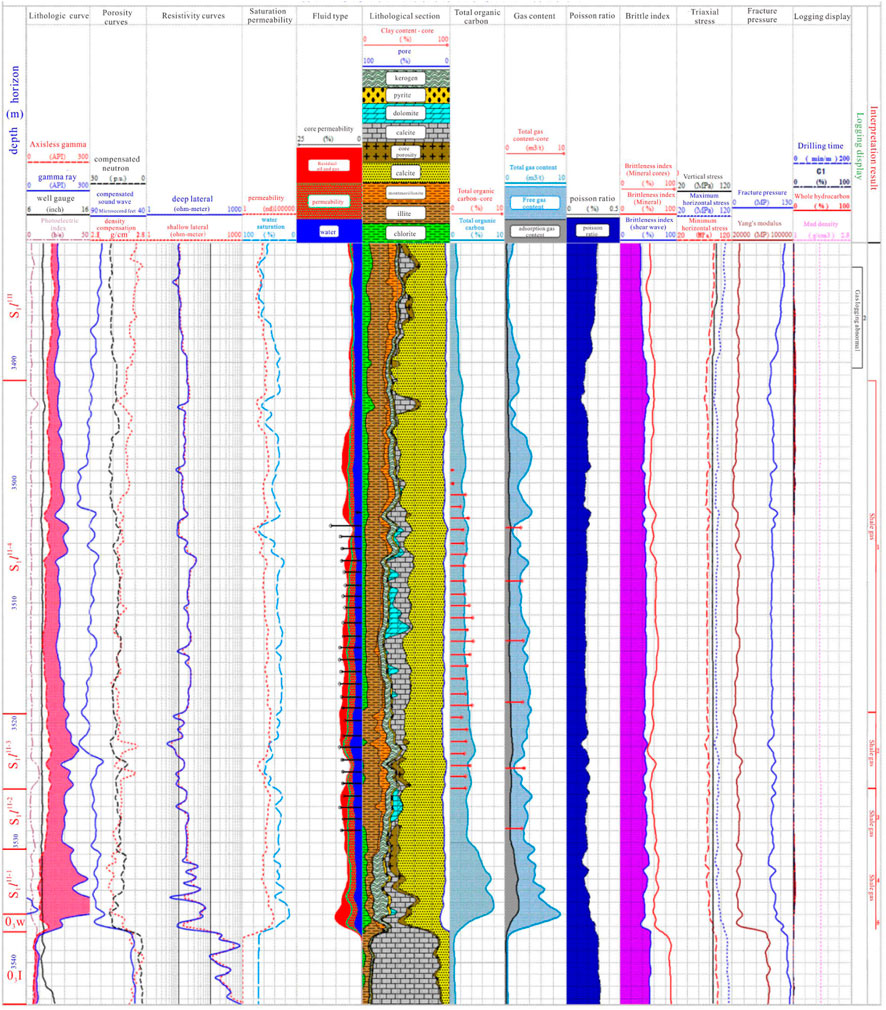
FIGURE 3. Logging curve characteristics and results of well W204.
The organic carbon content is between 1.0% and 2.7%, with an average of 2.2%; the porosity is between 4.0% and 6.5%, with an average of 5.7%; the gas content varies greatly and is within 1.1–3.3 m3/t; the brittleness index is between 40% and 45%, and the overall fracturing ability is relatively general.
The organic carbon content is between 2.5% and 4.0%, with an average of 3.3%; the porosity is between 4.5% and 7.0%, with an average of 6.2%; the gas content is 2.5–4.0 m3/t, with an average of 3.5 m3/t; the brittleness index is between 45% and 60%, with an average of 50%, and the overall fracturing ability is excellent.
The organic carbon content is between 2.0% and 3.5%, and the distribution is stable, with an average of 2.8%; the porosity is between 4.5% and 7.0%, with an average of 6.0%; the gas content is 2.5–4.5 m3/t, with an average of 3.5 m3/t; the brittleness index is between 50% and 55%, and the overall fracturing ability is good.
The organic carbon content is between 5.0% and 7.0%, with an average of 5.5%; the porosity is between 6.0% and 8.5%, with an average of 5.8%; the gas content is 4–10 m3/t, with an average of 5.5 m3/t; the brittleness index is between 50% and 55%, and the overall fracturing ability is outstanding.
The organic carbon content is between 1.0% and 2.5%; the porosity is between 2.0% and 5.0%, with an average of 4.0%; the gas content is 1.0–4.5 m3/t, with an average of 2.0 m3/t; the brittleness index is generally between 45% and 50%, and the overall fracturing ability is relatively general.
The rock organic matter forms the material basis for the oil and gas formation. The amount of organic matter in the rock (i.e., the abundance of organic matter) mainly determines the hydrocarbon-generation capacity of the source rocks, and the TOC is often used to measure the abundance of organic matter. The TOC (%) in the rock refers to the ratio of the residual organic carbon content to the unit rock mass after a series of geological historical events in the rock (Xu et al., 2012). Therefore, the quality of shale gas reservoirs can be determined according to the TOC. The cross-analysis of TOC, gamma, density, neutron porosity, and acoustic time difference of the Longmaxi–Wufeng Formation shale reservoir in the W204 well block showed a good linear positive correlation between TOC and density in the target interval of this study. Moreover, the correlation coefficient reached 0.80 (Figure 4). Meanwhile, the TOC of the target interval in the study area has a good (correlation coefficient = 0.71) exponential relationship with the ratio of the compressional and shear wave velocity (Figure 5). According to the above analysis results, we developed a multiple regression model for organic matter, density, and velocity ratio of the longitudinal and shear waves, with a correlation coefficient of 0.84. The model is expressed as follows:
where DEN is density [g/cm3], and Vp/Vs is the ratio of longitudinal to shear wave velocity [non-dimensional].
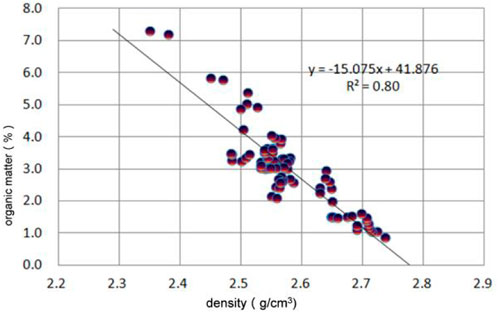
FIGURE 4. Cross plot of density and TOC.
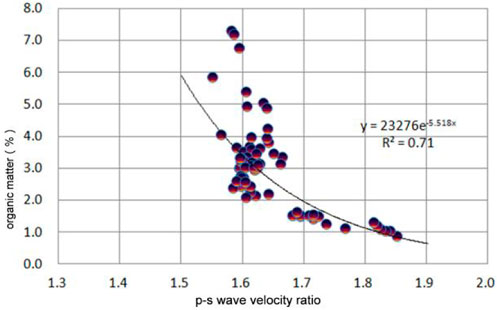
FIGURE 5. Cross plot of P-S wave velocity ratio and TOC.
The TOC is an index of the abundance of organic matter; it refers to the carbon content of the remaining organic matter in the rock after the oil and gas in the source rock escape. The TOC can adequately represent the gas production potential of the shale gas reservoir and is a key parameter for predicting the spatial and planar distributions of shale gas reservoirs by the seismic method. The test results of drilling samples show that the TOC content of shale reservoir in the study area is relatively high, ranging from 0.17% to 5.52%, with an average of 2.28%, which is medium-high organic carbon content. The samples with TOC greater than 1% account for 92.52% of the total. According to the previous rock physics analysis, the TOC and density have a good linear positive correlation (correlation coefficient = 0.71) in the WY area. Additionally, it has a good exponential correspondence with the ratio of compression and shear wave velocity. Therefore, as expressed above, we established a multivariate linear relationship between TOC, density, and the ratio of compression to shear wave velocity to predict the TOC (Figure 6A): TOC=35.44–12.08×DEN–0.2587×eVp/Vs, R2=0.84. The TOC distribution map of the Longmaxi–Wufeng Formation shale in the W204 well area (Figure 7) shows that the TOC distribution ranges from 2.0% to 5.0%, and the average TOC is above 2.5%. The TOC was highest in the north and lowest in the south, with the characteristics in the part of southeast region being high TOC values. The actual TOC test and predicted data of the three wells in the study area were compared for error analysis (Table 3). The absolute and relative errors of wells W204, W211, and W213 were 0.3, 0.27, and 0.31, as well as 8.3%, 8.2%, and 9.4%, respectively. The overall relative error did not exceed 10%. Thus, the prediction results are credible.
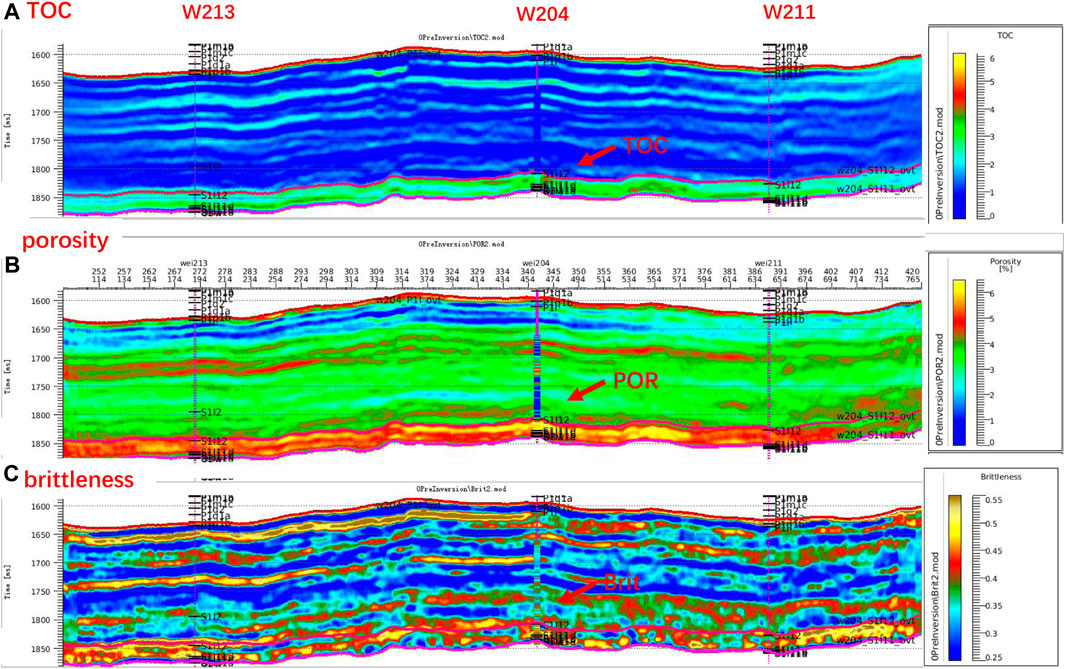
FIGURE 6. Shale reservoir quality parameters section [(A) TOC prediction section, (B) porosity prediction section, (C) brittleness index prediction section].
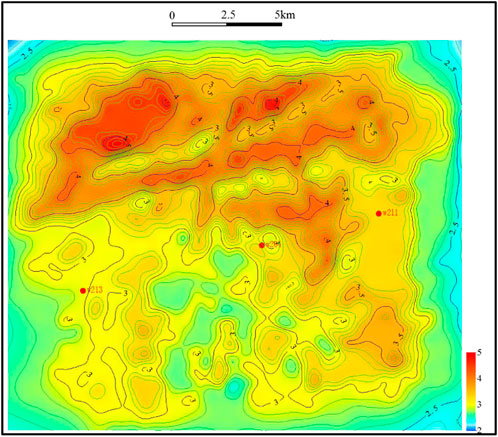
FIGURE 7. Planar distribution map of shale TOC in the W204 well area (%).
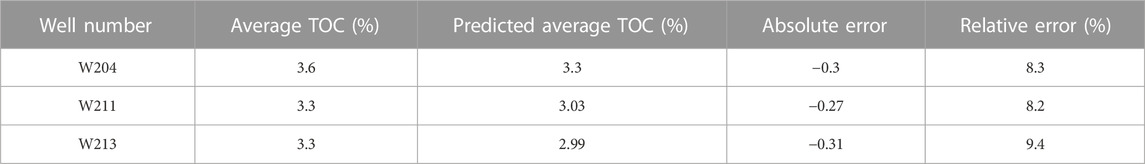
TABLE 3. Statistical table of average TOC seismic prediction errors of shale in the W204 well area.
The thickness of the shale gas reservoir determines the gas content potential of the shale gas reservoir. High-quality shale reservoirs were classified according to the evaluation standard of organic matter in the key geological parameters of the shale gas (Poor: TOC <1%; Average: TOC 1%–2%; Good: TOC >2%) (Dong et al., 2016). The thickness distribution range of high-quality shale reservoirs in the Longmaxi–Wufeng Formation was obtained using the threshold value TOC ≥2% (Figure 8). According to the analysis, the high-quality shale reservoirs in the Longmaxi–Wufeng Formation in the W204 well area are laterally stable, with an overall thickness of more than 40 m and local thicknesses ranging from 30 to 40 m and rarely thinner than 30 m. These values are consistent with the regional geological sedimentary law. For the error analysis, the thicknesses of the high-quality shale reservoirs in the three wells in the study area were compared with the predicted data (Table 4). The absolute and relative errors of wells W204, W211, and W213 were 2, 3.7, and 4.4 m, as well as < 4%, 6.6%, and slightly >8.3%. The relative error of the three wells was less than 9%, indicating that the prediction results are reliable.
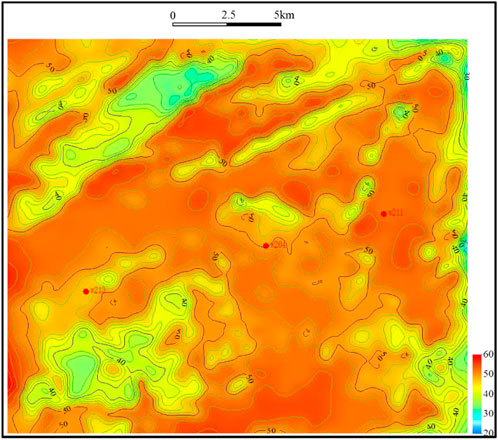
FIGURE 8. Planar distribution map of high-quality shale thickness in the W204 well area (m).
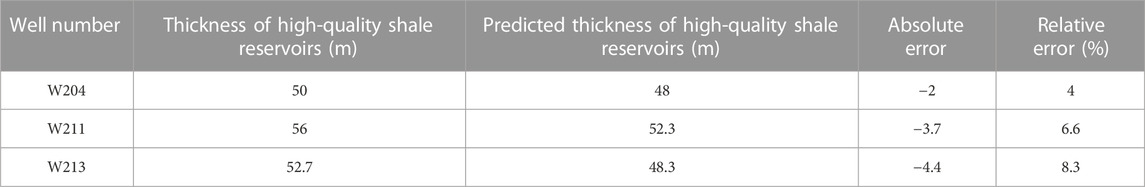
TABLE 4. Statistical table of the prediction error of high-quality shale reservoir thickness.
The porosity of a rock refers to the ratio of the rock pore volume to rock volume (φ, %) (Xu et al., 2012). From the seismic perspective, porosity prediction primarily uses seismic technology to establish a correlation between porosity and rock physics characteristics to explain the reservoir’s physical properties indirectly. Our intersection analysis showed that porosity had a good linear correlation with the density and P-wave impedance (Figures 9, 10), and the correlation with other parameters is average. Porosity can be predicted by the P-wave impedance data volume and density velocity volume obtained by seismic inversion. According to the above intersection relationship, we developed the following multiple regression model of porosity, density, and P-wave impedance:
where DEN is density [g/cm3], and ZVP is longitudinal wave impedance [m/s · g/cm3].

FIGURE 9. Cross plot of P-wave impedance and porosity.
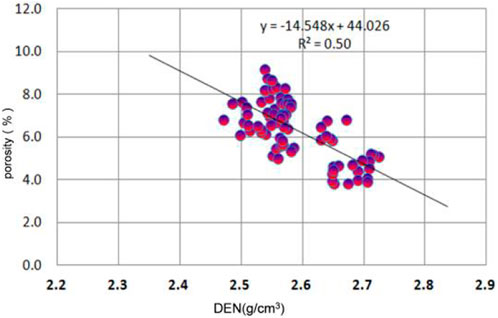
FIGURE 10. Cross plot of density and porosity.
Organic pores are important storage spaces for shale gas. The development degree of organic pores is proportional to the gas content of shale gas and the gas production of a single well. The sample test in the study area shows that the physical properties of the shale layer are good. The porosity is between 2.02% and 10.05%, with an average of 5.75%. The pore types include organic pores, inorganic pores and microcracks. Thus, the accurate prediction of the porosity distribution can help understand the possible enrichment areas of shale gas. According to our rock physics analysis, porosity had the good positive correlation with P-wave impedance and density to predict the Porosity (Figure 6B). We established a multivariate linear relationship between porosity, P-wave impedance, and density: φ = 37.80–8.22 × DEN—0.00114 × ZVP; R2 = 0.61. From the porosity plane distribution map of the high-quality shale reservoirs in the Longmaxi–Wufeng Formation in the W204 well block (Figure 11), it can be concluded that the overall porosity of the high-quality shale in the Longmaxi–Wufeng Formation changes slightly; the distribution range is 3%–7%, and the porosity of the rest of the region is almost greater than 4%, except for the northwest region, where the porosity is less than 4%. The high-quality shale porosity test data of the three wells in the study area were compared with seismic predictions (Table 5). The absolute and relative errors of wells W204, W211, and W213 were 0.61, 0.43, and 0.62, as well as 7.2%, 11.1%, and 10%, respectively. Thus, the porosity prediction results are more reliable.
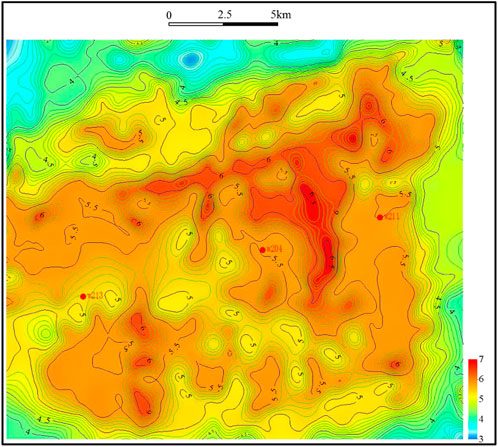
FIGURE 11. Planar distribution of porosity in W204 well area.
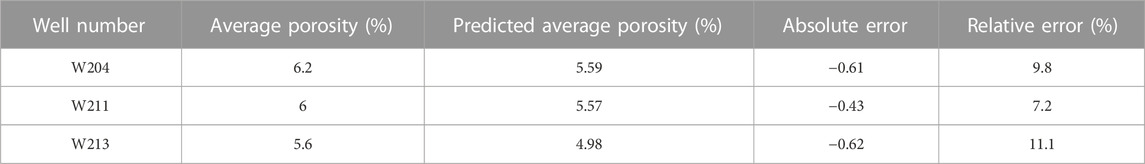
TABLE 5. Statistical table of porosity prediction error of high-quality shale.
The brittleness index of shale reservoirs is a reliable basis for selecting well sections for horizontal fracturing. The Poisson’s ratio and Young’s modulus are important parameters of brittle minerals in shale reservoirs but do not directly reflect rock brittleness. The reservoir brittleness is expressed by normalizing both parameters; the larger Young’s modulus, the smaller the Poisson’s ratio, and the greater the reservoir brittleness. After the rock density, shear wave transit time, and longitudinal wave transit time are determined, both parameters are calculated, and the brittleness index of the reservoir is obtained (Qin and Yang, 2019). We determined the intersection of the brittleness index and parameters such as the ratio of longitudinal to shear wave velocities, wave impedance, and density; the parameters related to the brittleness index were optimized. The results show that the shale brittleness index in this area has a good correlation with the ratio of compression to shear wave velocity and density (Figures 12, 13); that is, a low ratio of compression to shear wave velocity and low density corresponds to a high brittleness index. Hence, we established a multiple regression model of the brittleness index, density, and ratio of longitudinal to shear wave velocities. The model is expressed as follows:
where DEN is density [g/cm3], and Vp/Vs is the ratio of longitudinal to shear wave velocities [non-dimensional].

FIGURE 12. Cross plot of brittleness index and P-S wave velocity ratio.

FIGURE 13. Cross plot of brittleness index and density.
The shale gas in a shale gas reservoir is trapped in mudstone and shale formations with hydrocarbon-generating ability in the adsorption or free states. The gas flow resistance in the reservoir is larger than that of conventional natural gas. Thus, fracturing technology is key for the commercial exploitation of shale gas, in which the brittleness of shale reservoirs has a significant influence on the effect of shale gas fracturing (Shi et al., 2015; Yan et al., 2021), and high brittle mineral content is the basis for natural fractures and fracturing in later developments. A rock structure with highly brittle minerals results in shale rock with a high Young’s modulus and low Poisson’s ratio. Moreover, it is easy to form natural fractures and artificially induced fractures, which is advantageous for the migration and enrichment space of shale gas. Therefore, it is important to estimate the brittleness index of shale gas reservoirs, which is crucial to subsequent fracturing.
The measured brittle mineral content of the samples in the study area is between 66.2% and 92.3%, with slight differences in each small layer. The brittle mineral content is generally stable on the plane, and the average value of each well area is generally greater than 60%. The reservoir compressibility is generally good. According to previous rock physics analysis results, the shale brittleness index in this area has a good correlation with the ratio of compression and shear wave velocity and density. Hence, a multiple regression model of the brittleness index, density, and ratio of compression to shear wave velocity was established to predict the Brittleness (Figure 6C): Brittleness index = 1.996–0.81 × (Vp/Vs)—0.061 × DEN; R2 = 0.73. Through pre-stack simultaneous inversion, data volumes such as the ratio of P-to-shear wave velocity and density were obtained, and the brittleness index could be calculated by introducing it into the multivariate regression model of the brittleness index. The planar distribution of the brittleness index (Figure 14) revealed the following conclusions: The overall brittleness of the Longmaxi–Wufeng Formation shale in the study area was good. The brittleness index in most areas was greater than 35%, while it reached 65% in some areas. The overall compressibility was good, which was suitable for subsequent fracturing operations. The error analysis of the high-quality shale brittleness index and the predicted data of the three wells in the study area (Table 6) showed that the absolute error of the brittleness index of well W204 was small at 0.8, and the relative error was 1.5%; the absolute error of the brittleness indexes of wells W211 and W213 were highly similar, at 4.4 and 4, respectively, and the relative errors were 8.8% and 7.8%, respectively. The relative errors of the three wells were less than 10%, indicating that the porosity prediction results were reliable.
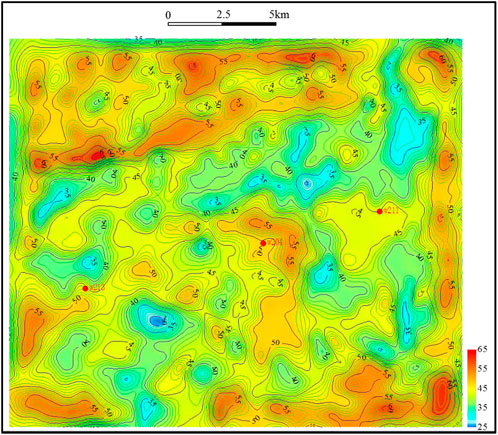
FIGURE 14. Planar distribution map of brittleness index in W204 well area.
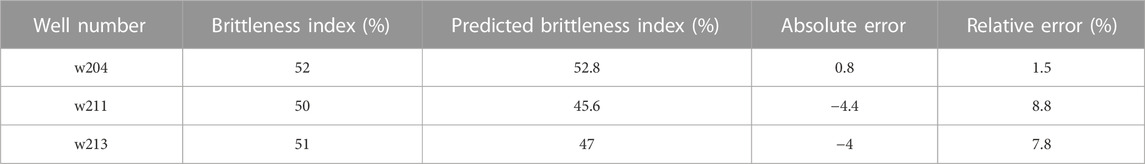
TABLE 6. Statistical table of the prediction error of high-quality shale brittleness index.
The hydrocarbon-generation potential of shale is the basis for shale gas production, and fracture development is the key to shale gas production. In low-permeability reservoirs, fracture development can improve reservoir performance and infiltration capacity, provide good channels for oil and gas migration, and control the distribution of oil and gas reservoirs. These factors are vital for studying formation pressure distribution and oil and gas development (Starr, 2000; Cai, 2021). The large-scale faults in the study area are not developed, but through the observation of the surrounding well rock cores, the fractures are developed (Figure 15). There are mainly two or more groups of cracks, among which the cracks in the near NS and near EW directions are the main ones. We performed the pre-stack anisotropic fracture prediction based on OVT data in the W204 well area.
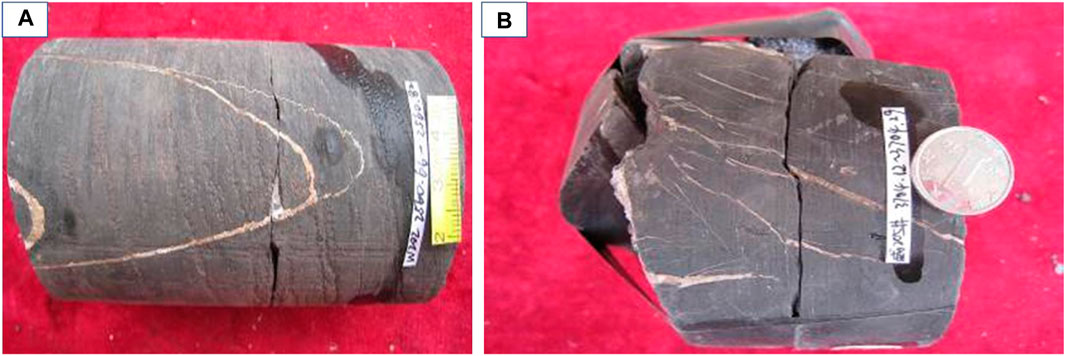
FIGURE 15. Rock core photos [(A) calcite full-filled high-angle fractures, W202 well, 2560 m (B) calcite full-filled multiple high-angle fractures, oblique fractures, W205 well, 3704 m].
First, we analyzed the OVT gathers, coverage time, and offset distance–azimuth angle of the 204 well in the W204 well area. In the 30 m × 30 m area, the maximum coverage time in the central area was 256 times, and the coverage time at the edge of the work area was short. The minimum and maximum offset distances were 1.414 m and 4476.45 m, respectively. The coverage time for each azimuth angle at medium and small offset distances was relatively uniform. In general, the gathers met the azimuth anisotropy analysis. Finally, the OVT data is used for superposition. The maximum incident angle of the target layer of the OVT gather reaches 30°, and five partial superpositions are determined, which are 1–9°, 6–14°, 11–19°, 16–24°, 21–29°, respectively. The wavelet morphology of the superimposed data at different angles is consistent. Finally, we used OVT data to perform pre-stack fracture inversion based on the AVAZ to obtain the density and orientation of the fracture development (Figure 16). The analysis showed that the anisotropy in the study area was generally weak, and the fractures in the shale section of the Longyi 1 sub-member (S1l1I) were underdeveloped as a whole. Fractures were mainly developed in the EW and NS directions, and some were developed in the NW direction. Three groups of fractures were in the W204 well area, two in the W211 well area, and one in the EW direction in the W213 well area.
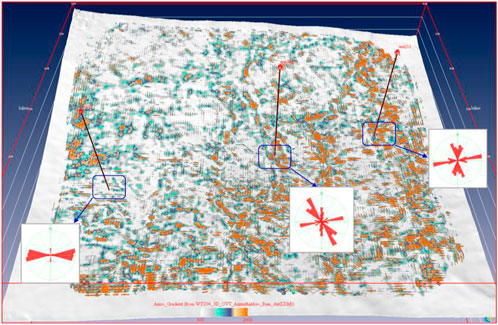
FIGURE 16. Three drilling locations of S1l1I fracture direction statistics in the W204 well area.
(1) The TOC distribution range of the Longmaxi–Wufeng Formation shale in the WY area was between 2% and 5%, with high TOC in the north and southeastern parts while low TOC is in the south. With 2% as the threshold value, the overall thickness of high-quality reservoirs was more than 40 m, and the thickness distribution in local areas was between 30 m and 40 m, extending in the direction of the NE–SW banding.
(2) The porosity of the Longmaxi–Wufeng Formation shale in the WY area changed slightly with a distribution range of 3%–7%. Except for the northwest region, almost all other areas had a porosity greater than 4%. The overall brittleness of the study area was relatively good. The brittleness index in most areas was greater than 35%, and the local brittleness index reached 65%, which is suitable for the formation of network fractures in subsequent fracturing operations. A comparison of the prediction results of this time with the drilling test data showed that the relative error was almost less than 10%, and the reliability was high.
(3) The pre-stack anisotropic fracture prediction of AVAZ based on OVT data was performed in the WY area. The anisotropy in the study area was generally weak. The fractures in the shale of the Longyi 1 sub-member were underdeveloped as a whole, and the fracture development orientations were mainly east-west and north-south, followed by some fractures in the NW direction. Three groups, two groups, and one group of fractures were developed in the W204, W211, and W213 well areas, respectively.
(4) This study comprehensively studied quality parameters sensitive to shale reservoir productivity, such as TOC, reservoir thickness, porosity, brittleness index, and fracture development strength. Seismic prediction of quality parameters was performed to provide a comprehensive prediction for sweet spots and subsequent wells. This work provides an important basis for bit deployment and fracturing. Compared with the uncertainty of previous single method or single reservoir quality parameter prediction, this study uses a variety of methods including pre-stack and post-stack to carry out comprehensive prediction of various reservoir quality parameters, which is more reliable and worthy of promotion.
The original contributions presented in the study are included in the article/supplementary material, further inquiries can be directed to the corresponding author.
XH and WY contributed to the conception and design of the study. XH and WY wrote the first draft of this manuscript. CX and CY conducted the investigations and data collation. JL and BW reviewed and edited the manuscript. All authors contributed to the revision of the manuscript and read and approved the version submitted.
This study was supported financially by the National Natural Science Foundation of China (Grant No. 42172175).
We would like to thank Chuanqing Drilling Engineering Co., Ltd. for providing data and allowing the publication of this article.
Author WY was employed by the company CNPC Chuanqing Drilling Engineering Company Limited. Author CX was employed by the company Sinopec Northwest Oilfield Branch.
The remaining authors declare that the research was conducted in the absence of any commercial or financial relationships that could be construed as a potential conflict of interest.
All claims expressed in this article are solely those of the authors and do not necessarily represent those of their affiliated organizations, or those of the publisher, the editors and the reviewers. Any product that may be evaluated in this article, or claim that may be made by its manufacturer, is not guaranteed or endorsed by the publisher.
Ajaz, M., Ouyang, F., Wang, G. H., Liu, S. L., Wang, L. X., and Zhao, G. (2021). Fluid identification and effective fracture prediction based on frequency-dependent AVOAz inversion for fractured reservoirs. Petroleum Sci. 18 (4), 1069–1085. doi:10.1016/j.petsci.2021.07.011
Bhattacharya, S., and Mishra, S. (2018). Applications of machine learning for facies and fracture prediction using Bayesian Network Theory and Random Forest: Case studies from the Appalachian basin, USA. J. Petroleum Sci. Eng. 170, 1005–1017. doi:10.1016/j.petrol.2018.06.075
Cai, W. R. (2021). Application of five-dimensional regularization in OVT domain in high-density data processing of coal fields. Coal Technol. 40 (12), 86–90. doi:10.13301/j.cnki.ct.2021.12.021
Dai, X., Dong, D. Z., and Ni, Y. Y. (2020). Some essential geological and geochemical issues about shale gas research in China. Nat. Gas. Geosci. 31 (6), 745–760. doi:10.11764/j.issn.1672-1926.2020.05.016
Dang, Q. N., Cui, Y. F., Chen, M., Zhao, R. R., Liu, W. M., and Li, Y. (2016). Fracture detection with prestack seismic data in OVT domain: A case study of the ordovician carbonate reservoir in zg area of tazhong district in tarim basin. Geophys. Geochem. Explor. 40 (2), 398–404. doi:10.11720/wtyht.2016.2.27
Dong, D. Z., Wang, Y. M., and Huang, X. N. (2016). Discusion about geological characteristics, resource evaluation methods and its key parameters of shale gas in China. Nat. Gas. Geosci. 27 (9), 1583–1601. doi:10.11764/j.isn.1672-1926.2016.09.1583
Fahad, I. S., Salem, A., Temoor, M., Amirmasoud, K. D., and Shahin, N. (2021). Smart shale gas production performance analysis using machine learning applications. Petroleum Res. 7 (1), 21–31. doi:10.1016/j.ptlrs.2021.06.003
Fan, C. H., Li, H., Qin, Q. R., He, S., and Zhong, C. (2020). Geological conditions and exploration potential of shale gas reservoir in Wufeng and Longmaxi Formation of southeastern Sichuan Basin, China. Petrol. Sci. Eng. 191, 107138. doi:10.1016/j.petrol.2020.107138
Ge, X. Y., Mou, C. L., Yu, Q., Liu, W., Men, X., He, L., et al. (2021). A study on the enrichment of organic materials in black shales of the Wufeng to Longmaxi Formations in eastern Sichuan Basin. Sediment. Tethys Geol. 41 (03), 418–435. doi:10.19826/j.cnki.1009-3850.2020.12001
Han, Y., Zhao, Z., Wang, S. X., Qi, K. B., and Zhou, B. D. (2020). “Shale oil fracture prediction technology and application based on OVT seismic data,” in SPG/SEG Nanjing 2020 International Geophysical Conference Papers, 1314–1317. doi:10.26914/c.cnkihy.2020.015057
He, L., Liu, W., Yang, P., Yu, Q., Wang, J., Wang, Z. J., et al. (2017). Genetic conditions of the shale gas and delineation of the favourable areas in the Wufeng Formation-Longmaxi Formation on the southwestern margin of the Sichuan Basin. Sediment. Tethys Geol. 37 (03), 50–58. Available at: https://kns.cnki.net/kcms/detail/detail.aspx?FileName=TTSD201703006&DbName=CJFQ2017.
Helgesen, J., Magnus, I., Prosser, S., Saigal, G., Aamodt, G., Dolberg, D., et al. (2000). Comparison of constrained sparse spike and stochastic inversion for porosity prediction at Kristin Field. Soc. Explor. Geophys. 19 (4), 400–407. doi:10.1190/1.1438620
Hu, K. (2021). Reservoir and sweet pot distribution characteristics of shale gas in Wufeng-Longmaxi Formation,southwest of Sichuan Basin. Nconcentional oil&Gas 8 (05), 34–44. doi:10.9901/j.fcgyq.2021.05.05
Jasmin, C., Dr, L. S., and Prof, A. A. (2016). Shale gas: A review of the economic, environmental, and social sustainability. Energy Technol. 4 (7), 772–792. doi:10.1002/ente.201500464
Jia, A. L., Wei, Y. S., and Jin, Y. Q. (2016). Progress in key technologies for evaluating marine shale gas development in China. Petroleum Explor. Dev. 43 (06), 1035–1042. doi:10.1016/s1876-3804(16)30120-3
Jiang, F. J., Pang, X. Q., and Ouyang, X. C. (2012). The main progress and problems of shale gas study and the potential prediction of shale gas exploration. Earth Sci. Front. 19 (02), 198–211. Available at: https://kns.cnki.net/kcms/detail/detail.aspx?FileName=DXQY201202030&DbName=CJFQ2012.
Ladevèze, P., Rivard, C., Lavoie, D., Séjourné, S., Lefebvre, R., and Bordeleau, G. (2019). Fault and natural fracture control on upward fluid migration: Insights from a shale gas play in the st. Lawrence platform, Canada. Hydrogeology J. 27, 121–143. doi:10.1007/s10040-018-1856-5
Li, H. (2022). Research progress on evaluation methods and factors influencing shale brittleness: A review. Energy Rep. 8, 4344–4358. doi:10.1016/j.egyr.2022.03.120
Li, H., Zhou, J. L., Mou, X. Y., Guo, H. X., Wang, X. X., An, H. Y., et al. (2022). Pore structure and fractal characteristics of the marine shale of the Longmaxi Formation in the changning area, southern Sichuan Basin, China. Front. Earth Sci. 10, 1018274. doi:10.3389/feart.2022.1018274
Li, J., Li, H., Xu, J. L., Wu, Y. J., and Gao, Z. (2022). Effects of fracture formation stage on shale gas preservation conditions and enrichment in complex structural areas in the southern Sichuan Basin, China. Front. Earth Sci. 9, 823855. doi:10.3389/feart.2022.921988
Li, J., Li, H., Yang, C., Ren, X. H., and Li, Y. D. (2023). Geological characteristics of deep shale gas and their effects on shale fracability in the Wufeng–Longmaxi Formations of the southern Sichuan Basin, China. Lithosphere 2023 (1), 4936993. doi:10.2113/1970/4936993
Li, J., Li, H., Yang, C., Wu, Y. J., Gao, Z., and Jiang, S. L. (2022). Geological characteristics and controlling factors of deep shale gas enrichment of the Wufeng-Longmaxi Formation in the southern Sichuan Basin, China. Lithosphere 2022, 4737801. doi:10.2113/2022/4737801
Liss, W. E. (2014). Impacts of shale gas advancements on natural gas utilization in the United States. Energy Technol. 2 (12), 953–967. doi:10.1002/ente.201402061
Liu, X. X., Guo, Z. Q., Liu, C., and Liu, Y. W. (2017). Anisotropy rock physics model for the Longmaxi shale gas reservoir, Sichuan Basin,China. AppliedGeophysics 14 (01), 21–30. doi:10.1007/s11770-017-0609-x
Ma, X. H., and Xie, . (2018). The progress and prospects of shale gas exploration and exploitation in southern Sichuan Basin, NW China. Petroleum Explor. Dev. 45 (01), 161–169. doi:10.11698/PED.2018.01.18
Ma, Y. S., Cai, X. Y., and Zhao, P. R. (2018). China’s shale gas exploration and development: Understanding and practice. Petroleum Explor. Dev. 45 (04), 589–603. doi:10.1016/s1876-3804(18)30065-x
Miele, R., Barreto, B. V., Yamada, P., Varell, L. E. S., Pimentel, A. L., Costa, J. F., et al. (2022). Geostatistical seismic rock physics AVA inversion with data-driven elastic properties update. IEEE Trans. Geoscience Remote Sens. 60, 1–15. doi:10.1109/TGRS.2021.3135718
Mou, C. L., Wang, X. P., and Wang, Q. Y. (2016). Relationship between sedimentary facies and shale gas geological conditions of the Lower Silurian Longmaxi Formation in southern Sichuan Basin and its adjacent areas. J. Palaeogeogr. 18 (3), 457–472. doi:10.7605/gdlxb.2016.03.032
Niu, W. T., Zhu, D. X., and Jiang, L. W. (2021). Sweet spot”comprehensive evaluation technology of complex mountain shale gas reservoir: Taking the Zhaotong National Shale Gas Demonstration Zone as an example. Nat. Gas. Geosci. 32 (10), 1546–1558. doi:10.11764/j.issn.1672-1926.2021.07.0012021
Qin, H., and Yang, X. L. (2019). Long interpretation methods for measuring the brittleness of tight reservoir. Well logging Technol. 43 (05), 509–513+530. doi:10.16489/j.issn.1004-1338.2019.05.013
Sarkar, P., Singh, K. H., Ghosh, R., and Singh, T. N. (2018). Estimation of elastic parameters, mineralogy and pore characteristics of Gondwana shale in Eastern India for evaluation of shale gas potential. Curr. Sci. 115 (4), 710–720. https://www.jstor.org/stable/26978280. doi:10.18520/cs/v115/i4/710-720
Selçuk, B., and İkbal, S. (2016). New horizon in energy: Shale gas. J. Nat. Gas Sci. Eng. 35, 637–645. doi:10.1016/j.jngse.2016.09.014
Shi, X. S., Liu, D. A., and Cui, Z. D. (2015). Analysis and thinking on fracturing technology of shale gas exploitation. Nat. gas Explor. Dev. 38 (03), 62–65+69+12-13. Available at: https://kns.cnki.net/kcms/detail/detail.aspx?FileName=TRKT201503014&DbName=CJFQ2015.
Shi, Z. S., Zhou, T. Q., Guo, W., Liang, P. P., and Cheng, F. (2022). Quantitative paleogeographic mapping and sedimentary microfacies division in a deep-water marine shale shelf: Case study of wufeng-longmaxi shale, southern Sichuan Basin, China. Acta Sedimentol. Sin. 2023, 1–22. doi:10.14027/j.issn.1000-0550.2021.162
Soeder, D. (2017). The successful development of gas and oil resources from shales in North America. J. PetroleumScience Eng. 163, 399–420. doi:10.1016/j.petrol.2017.12.084
Starr, J. (2000). Method of creationg common-offset/common azimuthe gathers in 3D seismic Survey and method of conducting Re⁃flection attribute variation analysis. U S Patent:6026059,2000, American patent.
Taylor, J. C., Bill Richards, F. W., Ricardo, L. S., Grant, W., and Leslie, E. (2015). Interpretation of the Penobscot 3D seismic volume using constrained sparse spike inversion, Sable sub-Basin, offshore Nova Scotia. Mar. Petroleum Geol. 68, 73–93. doi:10.1016/j.marpetgeo.2015.08.009
Teng, W., and Liu, Y. S. (2013). Analysis of distribution,storage potential land prospect for shale oil and gas in China. Prog. Geophys. 28 (03), 1083–1108. doi:10.6038/pg20130301
Wang, J., Luo, H. S., Liu, H. Q., Lin, J., Li, L., and Lin, W. (2016). Influences of adsorption/desorption of shale gas on the apparent properties of matrix pores. Petroleum Explor. Dev. 43 (01), 158–165. doi:10.1016/s1876-3804(16)30019-2
Wang, Y. G. (2015). Integrating the latest achievements of scientific research and production, founding the first class platform of Petroleum geophysical exploration——review of ' Petroleum geophysical exploration ' in 2014. Geophys. Pet. Explor. 50 (04), 776–808+8. doi:10.13810/j.cnki.issn.1000-7210.2015.04.027
Wang, Z. J., Yu, Q., Yang, P., Liu, W., Yang, F., Liu, J, H., et al. (2018). The main controlling factors of shale gas enrichment and exploration prospect areas in the Sichuan-Yunnan-Guizhou border areas, southwestern China. Sediment. Geol. Tethyan Geol. 38 (03), 1–15. Available at: https://kns.cnki.net/kcms/detail/detail.aspx?FileName=TTSD201803001&DbName=CJFQ2018.
Wu, T. (2017). Analysis on application effect of pre-stack fracture prediction using offset vector slice (OVT) technology in shale gas area. West-china Explor. Eng. 29 (08), 69–72.
Xu, G. S., Li, Z. D., and Luo, X. P. (2012). Petroleum geology. Beijing: Geological Publishing House, 88–91.
Yan, Y. Q., Li, Y., Guo, S. H., Yang, X. X., and Hao, H. Y. (2021). Study and application of rock brittleness evaluation method based on compressive deformation characteristics. Xinjiang Oil Gas 17 (04), 21–27. Available at: https://kns.cnki.net/kcms/detail/detail.aspx?FileName=XJSY202104005&DbName=CJFQ2021.
Yang, Y. N., Wang, J., and Xiong, G. Q. (2016). Controls of sedimentary environments on shale gas reservoirs: A case study of the Wufeng and longmaxi formations in northeastern chongqing. Sediment. Geol. Tethyan Geol. 36 (03), 91–97. Available at: https://kns.cnki.net/kcms/detail/detail.aspx?FileName=TTSD201603012&DbName=CJFQ2016.
Yang, Z. H., Han, Z. Y., and Teng, G. E. (2019). Characteristics of Wufeng-Longmaxi For-mations shale sweet layer:Case study of Weiyuan-Rongchang block of SINOPEC. Nat. Gas. Geosci. 30 (7), 1037–1044. doi:10.11764/j.issn.1672—1926.2019.04.006
Yuan, H. J., Meng, E., Li, D. P., and Leng, C. (2016). Application of constrained sparse pulse inversion technology in reservoir prediction of Xinmin Oilfield. Inn. Mong. Petrochem. Ind. 42 (04), 82–84.
Zahm, C. K., and Hennings, P. H. (2009). Complex fracture development related to stratigraphic architecture: Challenges for structural deformation prediction, Tensleep Sandstone at the Alcova anticline, Wyoming. AAPG Bull. 93 (11), 1427–1446. doi:10.1306/08040909110
Zeng, Q,C., Chen, S., and He, P. (2018). Quantitative seismic prediction of shale gas sweet spots in lower silurian Longmaxi Formation, weiyuan area, Sichuan Basin, SW China. Petroleum Explor. Dev. 45 (03), 406–414. doi:10.11698/PED.2018.03.05
Zhang, D. W. (2010). Strategic concepts of accelerating the survey “exploration and exploitation of shale gas resources in China”. Oil Gas Geol. 31 (02), 135–139+150. Available at: https://kns.cnki.net/kcms/detail/detail.aspx?FileName=SYYT201002004&DbName=CJFQ2010.
Zhang, L. H., Hu, Y., and Li, X. G. (2021). History and key technological progress of natural gas development in the Sichuan Basin. Nat. Gas. Ind. 41 (12), 60–72. doi:10.3787/j.issn.1000-0976.2021.12.007
Zhang, Y., and Yin, Y. S. (2015). Application of constrained sparse spike inversion in the third member of Hetaoyuan Formation in Dupo Oilfield. Lithol. Reserv. 27 (03), 103–107.
Zhao, S. X., Yang, Y. M., and Zhang, . (2016). Micro-layers division and fine reservoirs contrast of Lower silurian longmaxi formation shale,Sichuan Basin,SW China. Nat. Gas. Ind. 27 (03), 470–487. doi:10.11764/j.issn.1672-1926.2016.03.0470
Zheng, D., Wang, C. Y., Zhang, H. B., Wang, X. L., and Zhu, H. (2021). Logging evaluating methods of seven property parameters and enriched layers for Gulong shale oil reservoir in Songliao Basin. Petroleum Geol. Oilfield Dev. Daqing 40 (05), 87–97. doi:10.19597/J.ISSN.1000-3754.202107003
Zhou, H. (2015). The application of reservoir prediction technique in Fuyu reservoir of the central depression in Jilin oil field. Northeast petroleum university, Daqing city, Heilongjiang Province.
Zhou, Y. X., Zhao, A. K., Yu, Q., Zhang, D., Zhang, Q., and Lei, Z. H. (2021). A new method for evaluating favorable shale gas exploration areas based on multi-linear regression analysis: A case study of marine shales of wufeng-longmaxi formations, upper Yangtze region. Sediment. Geol. Tethyan Geol. 41 (03), 387–397. doi:10.19826/j.cnki.1009-3850.2021.05001
Keywords: seismic inversion, shale gas, Longmaxi-Wufeng formation, brittleness index, OVT gather, prestack-anisotropy
Citation: Hu X, Yu W, Yi C, Xiao C, Li J and Wang B (2023) Seismic prediction of shale reservoir quality parameters: A case study of the Longmaxi–Wufeng formation in the WY area. Front. Earth Sci. 11:1119600. doi: 10.3389/feart.2023.1119600
Received: 09 December 2022; Accepted: 28 February 2023;
Published: 28 March 2023.
Edited by:
Hu Li, Southwest Petroleum University, ChinaReviewed by:
Guodong Yang, Wuhan University of Science and Technology, ChinaCopyright © 2023 Hu, Yu, Yi, Xiao, Li and Wang. This is an open-access article distributed under the terms of the Creative Commons Attribution License (CC BY). The use, distribution or reproduction in other forums is permitted, provided the original author(s) and the copyright owner(s) are credited and that the original publication in this journal is cited, in accordance with accepted academic practice. No use, distribution or reproduction is permitted which does not comply with these terms.
*Correspondence: Wanli Yu, eXV3SV9zY0BjbnBjLmNvbS5jbg==
Disclaimer: All claims expressed in this article are solely those of the authors and do not necessarily represent those of their affiliated organizations, or those of the publisher, the editors and the reviewers. Any product that may be evaluated in this article or claim that may be made by its manufacturer is not guaranteed or endorsed by the publisher.
Research integrity at Frontiers
Learn more about the work of our research integrity team to safeguard the quality of each article we publish.