 Qiguang An
 Chengwei Lin
 Lin Zheng
- School of Statistics and Mathematics, Shandong University of Finance and Economics, Jinan, China
China has accelerated its energy transition to help achieve carbon peaking and neutrality. This resulted in significant investment and financial demand, and green finance has developed into a potent tool to support energy transition. This study used Chinese provincial panel data from 2007 to 2019 and investigated the effects of green finance development on energy intensity based on the mediating effect model, threshold model, and spatial Durbin model. The findings indicate that green finance development significantly lowers energy intensity, in which industrial structure upgrading plays a mediating role. Based on the threshold effect, when the green finance index rises above 0.199, the effect of reducing energy intensity becomes significant and exhibits a nonlinear feature of diminishing marginal effect. By examining the spatial spillover effect, the analysis shows that the development of green finance not only reduces the energy intensity of the region but also reduces the energy intensity of neighboring regions. Based on these findings, we proposed regionally targeted and differentiated green finance development policies to reduce energy intensity as soon as possible and assist in reaching carbon neutrality.
1 Introduction
At the 75th General Debate of the UN General Assembly, China announced that it will strive to reach peak carbon emissions by 2030 and work toward carbon neutrality by 2060. This is a solemn commitment by China to address climate change. Reducing energy intensity is an effective way to control carbon emissions (Zeinab et al., 2022). Energy intensity is the energy consumption ratio to output, reflecting the combined energy-use efficiency of different regions and industries. China, a major energy consumer, has been controlling energy consumption and reducing energy intensity as crucial measures to combat climate change and guarantee energy security (Shen et al., 2021). The National Bureau of Statistics released that China’s energy consumption per unit of GDP in 2021 was 26.4% lower than that in 2012, an average annual decrease of 3.3%, equivalent to energy savings of approximately 1.40 billion tons of standard coal.1 China has achieved significant strides toward energy conservation and consumption reduction. However, in terms of international comparison, China’s energy consumption per unit of GDP is 1.5 times the world average and 3 times that of developed countries; there is much room for reduction. To achieve carbon peaking and carbon neutrality goals, China must control its energy consumption and reduce its energy intensity based on stable economic development (Zhang and Tu, 2022).
China’s economic development has transformed from high-speed growth to high-quality growth in recent years, and energy has accelerated its transformation across the board. During “the 13th Five-Year Plan” period, China’s non-fossil energy consumption reached 15.9%, and the proportion of coal consumption dropped to 56.8%, with the energy structure being continuously optimized and the low-carbon transition becoming effective.2 Resolving the conflict between economic development and environmental protection requires strong end-of-pipe governance measures and financial means to change resource allocation. Green finance is a crucial way to accomplish a green allocation of capital factors and promote the economy toward green, low-carbon, and high-quality development. Compared to other financing projects, clean energy projects have a greater risk of uncertainty and require adequate financial backing. Green finance provides funding support for the clean energy projects industries and diversified financial tools for enterprises to spread out the risk associated with innovation (Chen, 2020). Financial institutions that engage in green finance activities take into full account the environmental effects of their investment and financing decisions, allocate more funds to environmental protection and energy conservation industries, and reduce their investments in polluting and highly energy-intensive businesses and projects (Ma, 2016).
At present, multi-level green financial products and market systems, including green loans, green bonds, green insurance, and carbon financial products, were initially formed in China. At the end of 2021, the balance of China’s domestic and foreign currency green loans had increased by 33% year over year to 15.9 trillion yuan, ranking first in the world in terms of stock size. The domestic green bond issuance exceeded 600 billion yuan in 2021, up 180% yearly, with a balance of 1.1 trillion yuan.3 It should be noted, however, that for private capital, the limited investment channels and high entry barriers in the green finance market have to some extent, dampened the enthusiasm of private capital to take part in green finance projects and limited the supply of green finance (Zhan, 2018). Meanwhile, there are variances in environmental legislation and economic structures among regions; regional green finance has developed unevenly (Gao and Zhang, 2021), and its effects on energy intensity may be asymmetric.
An increasing level of green finance development can successfully reduce energy intensity (Shen and Cao, 2020). First, green finance can effectively increase energy-use efficiency (Liu et al., 2021). Green finance has an obvious financing penalty effect and investment disincentive effect on heavy polluters (Su and Lian, 2018), can improve energy efficiency through reasonable credit resource allocation (Song et al., 2021), and can improve energy efficiency by promoting green innovation in the new energy industry (Peng and Zheng, 2021). Second, green finance growth can contribute to restructuring energy consumption (Liu and Tang, 2022; Sun and Chen, 2022). According to an analysis of the Association of Southeast Asian Nations (ASEAN) green bond issuance and policies by Dina et al. (2020), two-thirds of ASEAN green bonds are used to fund renewable energy and energy-efficiency projects.
Clarifying the impact channels of green finance on energy intensity is crucial for green finance to help achieve carbon peaking and carbon neutrality goals. However, the discussion on how green finance affects energy intensity is still relatively limited. There has been no comprehensive discussion from the standpoint of the industrial structure upgrading drive, and there is no clear consensus on the path of action. This study uses Chinese provincial panel data from 2007 to 2019 to thoroughly explore the mechanism and traits of green finance affecting energy intensity at the theoretical and empirical levels in light of the need for further research. The marginal contributions are as follows. First, based on the perspective of industrial structure upgrading, this study systematically sorts out the theoretical mechanism of green finance affecting energy intensity and provides a unified analytical framework. Second, China’s green finance evaluation index is built around the four dimensions: green credit, green investment, green insurance, and carbon finance. This index is used to assess the state of the development of green finance objectively. Third, we empirically study the threshold effect and spatial spillover effect of green finance on energy intensity, which has theoretical and practical value for improving the supporting policies of green finance, adjusting the energy structure, promoting industrial structure upgrading, and helping to achieve carbon peaking and carbon neutrality goals as scheduled.
2 Theoretical analysis and research hypothesis
2.1 Green financial development and energy intensity
Green finance is a concept derived from integrated considerations of the coordinated development of resources, environment, and finance. According to An (2008), green finance is a macroeconomic control policy that promotes energy saving, emissions reduction, and the coordinated development of economic resources and the environment. The “On Building a Green Financial System Guiding Opinions,” released by seven Chinese ministries and commissions on 31 August 2016, clearly states that “green finance” is the economic activity to support environmental enhancement, climate change response, and efficient utilization of resources. According to Zhang et al. (2016), in developing nations such as China, all green investment that can reduce the use of fossil fuels and lower energy consumption per unit is considered green finance. Thus, it may be considered that the development of green finance is vital for advancing green transformation and lowering energy intensity.
The theory of externalities is important in understanding green finance (An and Zi, 2020). Externality refers to the non-market impact of an economic agent conducting market activities on another economic agent. In the early stages of economic development, China’s rapid economic growth brought about excessive consumption of resources and environmental damage (Wang et al., 2020b). Economic actors produced goods and services to benefit themselves while seriously polluting the environment, but they did not pay the corresponding price, leading to negative externalities of environmental pollution. Externalities can result in market failures and inefficient resource allocation. By raising the investment and financing costs of traditional energy-consuming and high-polluting enterprises, green finance incorporates the negative externalities of corporate behavior into production costs, effectively helping to internalize the negative externality costs of environmental pollution. This influences corporate production decisions and development planning, reduces production energy consumption to some extent, and stimulates the development of green environmental projects and enterprises.
As the largest energy user and importer in the world, China is highly dependent on other nations for its energy needs, which in some ways restrains the country’s ability to expand economically. In terms of energy consumption, China is still mainly using fossil fuels. As a non-renewable and competitive commodity, an increase in the production and consumption of fossil fuels leads to a decrease in quantity. The vigorous development of green finance may successfully respond to the competitive challenges brought about by the decreasing supply of fossil fuels (Shu and Gu, 2020). On the one hand, green finance guides the flow of capital to renewable energy, energy conservation, and emission reduction through financial means and promotes the development and utilization of non-fossil energy. As a replacement for fossil fuels, the development of non-fossil fuels can effectively change the energy consumption structure and reduce the consumption of fossil fuels. On the other hand, green finance can force the reduction of investment and financing of high-energy-consuming and heavy-pollution projects and enterprises, reduce the consumption of fossil fuels, including coal, oil, and natural gas, and promote the green and low-carbon transformation of energy (Zhang and Wang, 2019).
Based on the analysis of green finance and energy intensity, hypothesis H1 is proposed.
H1:. The development of green finance can effectively reduce energy intensity.
2.2 The transmission mechanism of green finance development impact energy intensity
In this study, we construct the transmission mechanism of green finance development impact energy intensity (see Figure 1). Green finance may guide enterprises to choose energy-saving industries and adjust the conventional industrial structure to make it “green.” Xu et al., 2018 found a correlation between the development of green credit and the upgrading of industrial structures through a gray correlation analysis. Furthermore, they analyzed the differences in the effects of green credit on industrial restructuring in each region. From the perspective of new institutional economics, Shao and Fang (2021) pointed out that regional green finance development and industrial structure have a coupled and coordinated relationship. Huang (2022) argued that green finance helps Vietnam change its industrial structure, which can lower its energy intensity by raising the share of the tertiary sector in the national economy.
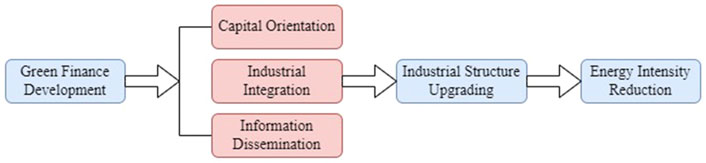
FIGURE 1. The transmission mechanism of green finance development impact energy intensity.
The path of green finance to promoting industrial restructuring includes three main aspects: capital orientation, industrial integration, and information dissemination. First, by controlling the credit cost, financing efficiency, and return on investment of different projects, green finance directs the flow of funds from high-energy-consuming and high-polluting industries to energy-saving and environmental protection industries. It encourages the growth of environmental protection industries and facilitates the transformation of the industrial structure to green and rationalization. Second, green finance promotes the flow of resources to green industries, realizes the reallocation of production factors between industries, forms a new capital system, and promotes industrial structure integration and optimization (Feng et al., 2022). Third, producers and investors can adjust their respective production plans and investment strategies based on market prices for green products and enterprise disclosure of environmental information, thereby accelerating the growth of green industries and optimizing industrial structures.
Industrial upgrading is critical in addressing climate change (Wang et al., 2022). Luan et al. (2021) pointed out that upgrading the industrial structure can validly reduce energy intensity. Given the differences in each industry’s nature, there are remarkable differences in the energy intensity of various sectors. The secondary industry, primarily industrial, has the highest energy intensity. If the share of industries with higher energy intensity is greater and rises faster, then the overall energy intensity increases. Li and Lin (2014) analyzed the non-linear effect of industrial structure on energy intensity in China and found that when the share of secondary industry in GDP is less than 40.435%, industrial structure upgrading leads to a decrease in energy intensity. Guo (2016) examined the effect of industrial structure on the convergence of energy intensity in China and discovered that improving the industrial structure dramatically accelerates the rate of energy intensity decline and accelerates the convergence process of energy intensity between regions. Adjusting the industrial structure is the way to achieve stable economic growth and effectively reduce energy intensity (Wang S. et al., 2021).
Based on the analysis of the transmission mechanism of green finance impact energy intensity, hypothesis H2 is proposed.
H2:. Industrial structure upgrading plays a mediating role in reducing energy intensity with green finance.
2.3 The threshold effect of green finance development on energy intensity
A combination of changes in GDP and energy consumption influences the changes in energy intensity. A certain amount of energy that produces more economic benefits or a certain amount of GDP using less energy can reduce energy intensity (Lin and Sun, 2011). Similar to traditional finance, the development of green finance can contribute significantly to economic growth (Zhou et al., 2020). Green finance has the power to increase energy efficiency and reduce energy consumption (Hong et al., 2022). Green finance can directly reduce energy intensity by promoting economic growth and reducing energy consumption. However, there is a scale effect on the impact of green finance on energy intensity. Green finance promotes economic growth, and the expansion of economic output forces enterprises to increase their energy demand and consumption. Green finance may lessen the inhibitory effect on energy intensity through the scale effect. Therefore, the influence of green finance on energy intensity is not always fixed under the combined effects of changes in GDP and energy consumption.
Simultaneously, there are variations in the effects at each stage of the green finance development process. At the early stage of green finance development, pertinent policies are not yet perfect, and only a limited amount of financial resources can be mobilized. Additionally, the green industry’s investment cycle is lengthy, expensive, and slow, and the time lag of the policy prevents green finance from playing its role in time (Shi and Shi, 2022). With the gradually increasing level of green finance development and the accumulation of financial resources, green finance can strongly encourage the green upgrading and transformation of traditional industries and the sprouting and growth of green environmental industries. When the degree of green finance development is too high, the regional disparity in green finance development expands, and the implementation of green finance policies by local governments may be highly divergent, which can reduce the effectiveness of green finance (Huang and Chen, 2022).
Based on the above analysis, we propose hypothesis H3.
H3:. There is a threshold effect for green finance development to affect energy intensity.
2.4 The spatial spillover effects of green finance development on energy intensity
Green finance is an essential innovation of conventional environmental regulation; ignoring its spillover effects would underestimate its impact effects (Ouyang et al., 2022). Scholars have gradually focused on the spatial spillover effects of green finance with the rise of the spatial economics theory. Dong and Fu (2018) examined the characteristics of the geographical distribution of green finance development and focused on the spatial spillover impact of green finance concentration areas. Wang et al. (2021b) also pointed out that the development of green finance fueled the growth of local clean energy and encouraged the production and utilization of clean energy in the surrounding provinces. The spatial spillover effect of green finance is mainly reflected in two aspects: industrial agglomeration and demonstration effect.
On the one hand, in green finance development, regions with location and policy advantages can draw green financial resources, including capital, market, technology, and labor, forming the agglomeration effect of green industries. The agglomeration of green industries can drive the development of the upstream and downstream sectors, promote the integration of the green finance industry chain, improve the production efficiency of the entire industry, and promote energy conservation. On the other hand, through experience exchange, information sharing, and resource interchange, regions with a high level of green finance development can play a good demonstration role and promote green finance development in neighboring regions. Therefore, green finance has an apparent positive externality, which drives the development of local energy-saving and environmentally friendly industries, and also has a radiation diffusion effect on the surrounding areas and promotes interregional synergistic emission reduction.
Based on the analysis of the spatial spillover effects of green finance, hypothesis H4 is proposed.
H4:. There is a spatial spillover effect of green finance development on energy intensity.
3 Data and methods
3.1 Variable description
3.1.1 Energy intensity
As a crucial step in promoting the construction of ecological civilization, the reduction of energy intensity can decrease pollutants and greenhouse gas emissions at the source and effectively respond to climate change. Energy intensity is a crucial metric for gauging the effectiveness of energy usage and, to a certain extent, reflects the connection between energy consumption and economic output. The ratio of energy consumption to energy output is often employed internationally to indicate energy intensity, and this study used the ratio of energy consumption to GDP to measure energy intensity (Hajko, 2014).
3.1.2 Green finance
There is no consensus on green finance metrics. Some scholars have chosen green credit (Tan et al., 2022) or green investment (Sun and Chen, 2022) as alternative indicators to assess the development of green finance. Wang F. et al. (2021) measured the level of green finance in China’s Yangtze River Economic Zone using green investment and carbon finance data. Ren et al. (2020) built a composite indicator around four dimensions: green loan, green security, green insurance, and green investment to evaluate green finance development. With reference to the index selection made by the scholars as mentioned above, based on the strategic background of green finance to help achieve the carbon neutrality goal, and combined with a profound understanding of green finance, we constructed China’s green finance index from four dimensions: green credit, green investment, green insurance, and carbon finance. The specific indicators are as follows:
(1) The main measures of green credit are the proportion of green credit, percentage of loans for energy conservation and environmental protection projects, and proportion of interest expenditure in the six industrial industries with the highest energy consumption. Considering the continuity of data and the consistency of statistical standards, this study adopted the ratio of interest expenditure of six high-energy-consuming industries4 to total industrial interest expenditure to measure the level of green credit (Xie and Liu, 2019).
(2) Green investment is represented by the ratio of fiscal expenditure on environmental protection to the total fiscal expenditure. As the Chinese government is the principal investor in environmental protection, fiscal expenditures on environmental protection can represent the level of green investment to a certain extent.
(3) Environmental pollution liability insurance is a major component of green insurance; however, it is currently in the primary development stage in China, and there is a dearth of pertinent data. Agriculture is the industry most affected by the environment, and agricultural insurance can represent the development of green insurance to a certain extent; therefore, the ratio of agricultural insurance income to total agricultural output value is used to measure the level of green insurance (Ren et al., 2020).
(4) Financial institutions play diverse and vital roles in the carbon finance market. Therefore, this study adopted the ratio of regional carbon emissions to the loan balance of financial institutions to measure the level of carbon finance (Yin et al., 2021).
After standardizing the indicator data, we employed a combination of subjective and objective methods to determine the weights. The subjective weights refer to the report of Li and Xia (2014) and are combined with the actual research in this study. Meanwhile, the subjective weights of 70%, 10%, 10%, and 10% are attached to the four indicators. The objective weights use the entropy weight method, and the more scattered the indicator’s data and the more information it contains, the greater the weight of that indicator. Finally, the subjective and objective weights were weighted and averaged to calculate the total weights, and the total score was calculated to obtain the green finance index.
3.1.3 Industry structure
In this study, the industrial structure was selected as a mediating variable to explore the transmission path of green finance that impacts energy intensity. Industrial structure enhancements include rationalization and advancement. The former reflects the improvement of the association level and coordination ability among industries, and the latter reflects a change in the proportional relationship and an increase in the degree of industrial structure. In this study, from the perspective of industrial structure advancement, the ratio of the value added by the tertiary industry to the value added by the secondary industry was used to measure the industrial structure index of each province (Yuan and Xie, 2014).
3.1.4 Control variables
(1) The energy price index is represented by the fuel price index in the retail price index of goods by region (Shen et al., 2021). Energy prices validly impact energy intensity (Pach-Gurgul et al., 2021). With a guaranteed constant output, an increase in energy prices may cause economic agents to reduce energy consumption to ensure cost minimization. Thus higher energy prices lead to lower energy intensity.
(2) R&D intensity is expressed in terms of regional R&D investment intensity. Technical advancement is a key driver of energy efficiency improvement and results from conscious R&D investment. An increase in R&D investment intensity may decrease energy intensity (Wang et al., 2021c).
(3) Foreign trade intensity is represented by the ratio of total regional imports and exports to GDP (Xu et al., 2016). Trade openness can effectively lower energy intensity (Chen et al., 2022). Through international trade communication, advanced technology and management from developed nations can enter developing countries and regions. This has resulted in technical innovation and equipment upgrading in developing countries, improving production methods, and lowering energy intensity.
(4) Foreign direct investment (FDI) intensity is represented by the ratio of actual FDI utilized in the region to GDP (Liu and Hu, 2016). On the one hand, the introduction of FDI generates technological spillover effects in which the host nation can use learned production technologies to improve production methods and reduce energy intensity (Predrag and Mikhail, 2022). On the other hand, the “pollution sanctuary” hypothesis contends that developed nations will relocate highly polluting and energy-consuming enterprises to developing nations to reduce costs. In contrast, developing nations will relax environmental standards for economic development, resulting in greater energy usage and higher energy intensity in developing nations.
3.2 Data sources
This study selected panel data from 30 provinces (excluding Tibet, Hong Kong, Macao, and Taiwan) in China from 2007 to 2019 as the research sample, using data mainly from Wind, CEADs, the National Bureau of Statistics, and provincial statistical yearbooks, with individual missing data supplemented by interpolation.
3.3 Descriptive statistics
The descriptive statistics for each variable are shown in Table 1. The mean energy intensity (EI) value is 0.981, indicating that energy intensity is still high in China and that most provinces have more room for reduction. The energy intensity ranges from 0.208 to 3.507 and varies greatly among Chinese provinces. The average green finance index (GF) is only 0.350, and overall, the level of green finance development in China is low. Meanwhile, the green finance index of different regions ranged from 0.168 to 0.943, indicating the uneven development of green finance in China. Table 1 also shows significant differences in industrial structure (IS), energy price index (P), R&D intensity (RD), foreign trade intensity (Trade), and FDI intensity (FDI) in different provinces.
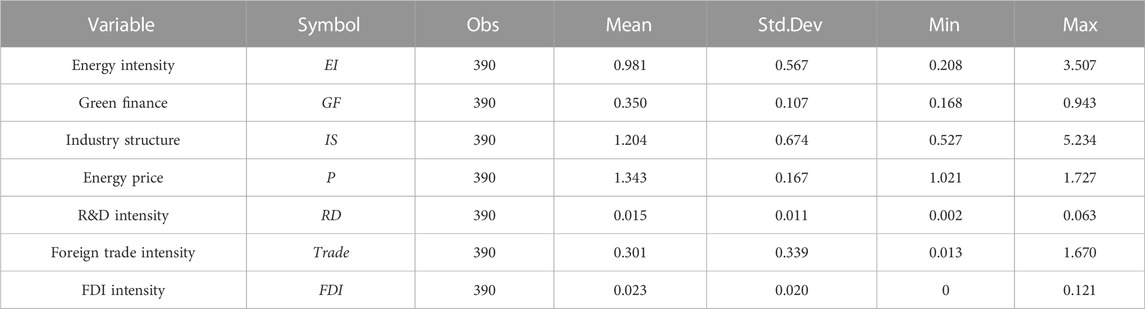
TABLE 1. Descriptive statistics of variables.
3.4 Methods
Based on H1, to verify the impact of green finance on energy intensity, the following baseline model was constructed:
where i represents province, t represents the year,
Based on H2, we verified whether industrial structure upgrading is a mediating variable for green finance that affects energy intensity. This study drew on Wen and Ye (2014) to conduct a mediating effect test. First, we tested whether the effect of green finance on the industrial structure is remarkable according to Eq. 2. The industrial structure index is introduced in Eq. 3 to test the effects of green finance and industrial structure on energy intensity. Finally, the validity of the mediation effect of the industrial structure was judged based on the regression coefficients of Eqs 2, 3, respectively. The specific form of the mediating effect model was set as follows:
where
Based on H3, we chose the panel threshold model to explore the non-linear effects of different stages of green finance development on energy intensity. The threshold model is expressed as follows:
where green finance (GF) is both a threshold variable and a threshold effect variable,
Based on H4, the spatial spillover effect of green finance is further discussed. Before conducting spatial econometric analysis, it is necessary to determine whether the explained variables are spatially correlated. In this study, we used the global Moran’s I index to test the spatial autocorrelation of energy intensity, and the Moran’s I index is defined as follows:
where
To explore the spatial spillover effect of green finance on energy intensity, the spatial interaction terms of green finance, energy intensity, and control variables are introduced in Eq. 1, which is further extended into a spatial Durbin model as follows:
where
Considering that the distance between two regions may impact the spatial spillover effect of green finance, we used a geographic distance matrix as the spatial weight matrix in this study. The specific form is as follows:
where
4 Empirical results
4.1 Baseline model estimation results
We first used the Hausman test to select fixed and random effects, and the test result is p = 0.0002; therefore, we used the fixed effects model in this study. The effect of green finance on energy intensity was examined using the baseline model. As shown in Columns (1) and (2) of Table 2, the regression coefficients for green finance are all remarkably negative at the 1% level. When control variables are added, the energy intensity decreases by an average of 1.030 units for every 1 unit increase in the green finance index, demonstrating that green finance development validly reduces energy intensity and supports H1.
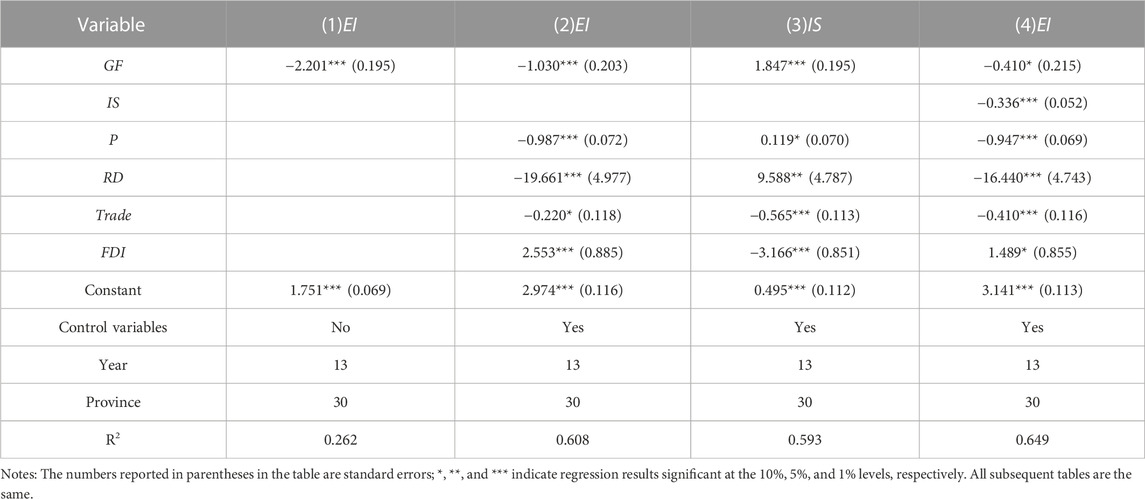
TABLE 2. Results of baseline regression and mechanism of action tests for the impact of green finance on energy intensity.
Additionally, the regression coefficients of the control variables in Column (2) are all statistically significant at the 10% level, demonstrating that various factors influence changes in energy intensity. The coefficients of the control variables are generally consistent with those expected. The regression coefficients of both energy price and R&D intensity are remarkably negative, indicating that energy intensity decreases as energy price and R&D intensity increase. Additionally, the coefficient of foreign trade intensity is remarkably negative, demonstrating that regions with a higher degree of openness to the outside world can reduce energy intensity by introducing green production technologies. The coefficient of FDI is remarkably positive, indicating that the introduction of FDI increases China’s energy intensity, supporting the “pollution refuge” hypothesis.
4.2 Intermediate effect model regression results
As shown in Table 2, based on the verification in Column (2) that green finance can reduce energy intensity, Column (3) shows the link between green finance and industrial structure, where the regression coefficient of green finance is obviously positive, suggesting that the development of green finance validly promotes the industrial structure upgrading. Column (4) shows the effects of green finance and industrial structure on energy intensity, where the coefficient of industrial structure is obviously negative at the 1% level, revealing that upgrading industrial structure can reduce energy intensity. Meanwhile, the regression coefficient of green finance is still remarkably negative in Column (4), but the absolute value is small compared to Column (2). According to the test mechanism of the mediating effect, it can be seen that industrial structure upgrading plays a part of mediating role in the process of reducing energy intensity by green finance development, and the mediating effect accounts for 60.25% of the total effect, confirming H2.
4.3 Threshold model regression results
The existence of the threshold effect was first tested and passed the double threshold test. Therefore, the model was set as a double-threshold model. The results of the double-threshold regressions in Table 3 show that the impact of green finance on energy intensity can be divided into three stages: when the green finance index is less than 0.199, green finance development has no statistically significant on energy intensity. When the green finance index is greater than 0.199 and less than 0.512, the green finance regression coefficient is significant, and the effect of green finance suppressing energy intensity is strong, and when the green finance index is greater than 0.512, the coefficient of green finance is also significant, but the effect of green finance on suppressing energy intensity decreases.

TABLE 3. Regression results of the threshold model for the impact of green finance on energy intensity.
Overall, when the green finance index exceeds 0.199, the role of green finance in affecting energy intensity begins to emerge and shows the non-linear characteristic of the diminishing marginal effect, confirming H3. This may be because green finance is still immature at the early stage of development, and the mobilization effect on social capital is much lower than that of traditional finance, preventing it from fully fulfilling its function in resource allocation. When the green finance development index is too high, it occupies other advantageous resources and has a crowding-out effect on other industries’ technological upgrading and product development; thus, the impact on energy intensity decreases.
4.4 Spatial durbin model regression results
First, a spatial autocorrelation test of energy intensity was conducted to calculate Moran’s I index of energy intensity from 2007 to 2019, and the results are presented in Table 4. The results show that Moran’s I indices of energy intensity from 2007 to 2019 are all significantly greater than 0 at the 1% level, suggesting a significant positive spatial correlation between energy intensities among provinces. To better understand the spatial clustering characteristics of energy intensity, we drew the scatter plots of Moran’s I index of energy intensity in 2007, 2011, 2015, and 2019 (see Figure 2). It can be seen that most provinces fell in the first and third quadrants in 2007, 2011, 2015, and 2019, indicating that the spatial distribution of energy intensity has remarkable spatial clustering characteristics (i.e., high values clustered with high values and low values clustered with low-value clustering).
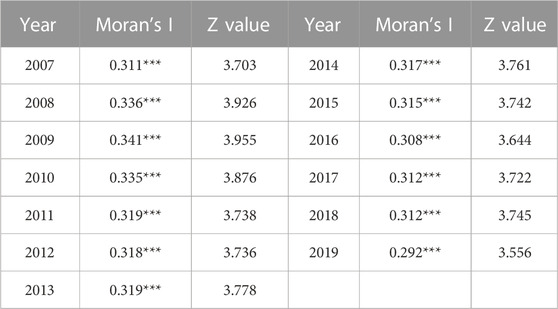
TABLE 4. Moran’s I index of energy intensity for 2007–2019.
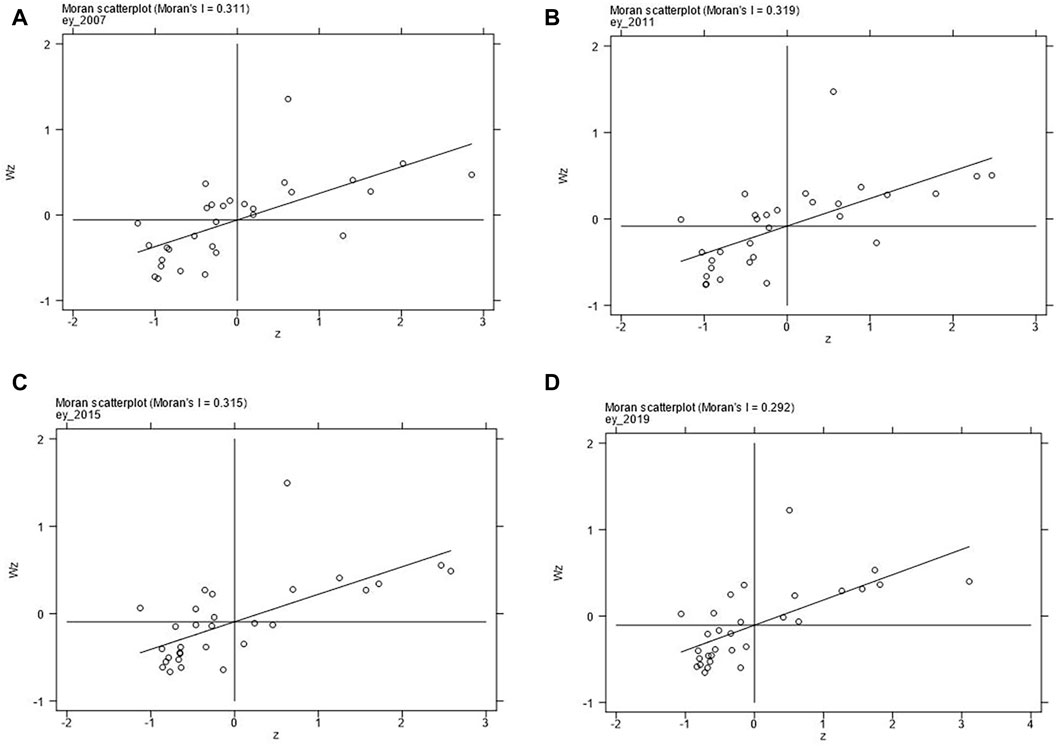
FIGURE 2. The scatter plots of Moran’s I index of energy intensity.
Spatial autocorrelation tests indicate the existence of spatial autocorrelation of regional energy intensity; therefore, a spatial econometric model can be used. The LM, Wald, and LR tests were first performed to analyze whether the spatial Durbin model could degenerate into a spatial error model or a spatial lag model. All the results passed the 10% significance test, so it was concluded that the fixed-effect spatial Durbin model should be selected. As there is a lot of interaction information in adjacent regions, the interpretation of the results based on regression coefficients alone would be biased; therefore, we decomposed the effect of green finance on energy intensity into direct, indirect, and total effects (Chen et al., 2016). Specifically, the effect of green finance in the region on the energy intensity of the region is a direct effect, the effect of green finance in neighboring regions on the energy intensity of the region is an indirect effect or spatial spillover effect, and the sum of the direct and indirect effects is the total effect.
Table 5 presents the direct, indirect, and total effects estimated using the spatial Durbin model. As shown in Table 5, the regression coefficients of the direct, indirect, and total effects of green finance are all significantly negative at the 5% level. This indicates that not only will the development of green finance in the region reduce the region’s energy intensity, but also the development of green finance in the neighboring regions will reduce the region’s energy intensity. In other words, the development of green finance reduces the local energy intensity and aids in lowering energy intensity in other areas; that is, green finance has a spatial spillover effect, confirming H4.
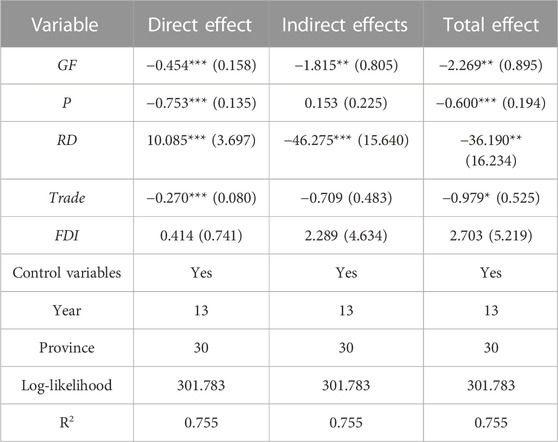
TABLE 5. Direct, indirect, and total effects of green finance impact on energy intensity.
4.5 Regional heterogeneity analysis
There are significant regional variances in the degree of green finance development among provinces owing to factors such as geographic location, level of economic development, and degree of openness to the outside world (Zheng et al., 2020). Meanwhile, the energy structure is directly impacted by the resource endowment of various provinces, leading to differences in the energy intensity in each province (Wang et al., 2020a). In this study, based on economic development level and geographical location, the sample data were divided into three parts: eastern, central, and western for regional heterogeneity testing. The regression results are presented in Table 6.

TABLE 6. Regional heterogeneity test for the impact of green finance on energy intensity.
The regression results in Table 6 show that the regression coefficients of green finance in the east, central, and west are all remarkably negative at the 5% level, which shows that green finance in all three regions can effectively reduce energy intensity. However, the effect of green finance is more pronounced in the central and western regions compared to the eastern regions. That is, there is regional heterogeneity in the effect of green finance on energy intensity. This may be because the eastern region is at the stage of green transformation and industrial upgrading, and various environmental regulation tools are relatively complete, so green finance cannot validly enhance the effectiveness of existing environmental policies. The central region is under the double pressure of economic development and green transformation, and the traditional environmental regulation policy has an issue of one-size-fits-all. Green finance can offer financial support for enterprise technological innovation to promote green transformation, which can supplement strict environmental regulation policies to a certain extent. The development of green finance in the western region is concentrated in a few cities, which works in harmony with and complements existing environmental regulation policies. It has a greater influence on energy intensity (Zhu et al., 2021).
4.6 Robustness tests
To ensure the robustness of the baseline model regression results, we performed robustness tests, such as excluding singular values, replacing core explanatory variables, and using the instrumental variables method.
(1) Exclusion of singular values. The variables were subjected to a tail reduction below 1% and above 99% to eliminate the interference of outliers, and then the baseline model was regressed. The regression results are shown in Column (1) of Table 7. After excluding outliers, the effect of green finance on energy intensity is still remarkably negative at the 1% level, proving that the regression results of the baseline model are robust.
(2) Substitution of core explanatory variables. This study used composite indicators to measure each province’s green finance development level. The use of subjective weights and entropy weighting method may cause biased estimation results. Referring to Wang et al.’s (2021e) method of constructing comprehensive green finance indicators, the weights were calculated using principal component analysis to construct a new green finance index. The green finance index obtained from the principal component analysis was used to perform a regression analysis on the baseline model. The results are shown in Column (2) of Table 7. For each unit increase in the green finance index from the principal component analysis, the energy intensity decreases by an average of 1.726 units. This further confirms that green finance development is beneficial for reducing energy intensity and indicates that the regression results of the baseline model are robust.
(3) Instrumental variable method. Endogeneity may occur due to omitted variables or mutual causality, leading to biased estimation results. This study used the instrumental variable method to handle the endogeneity problem. Referring to Shi and Shi (2022), we chose the one-period lagged green finance index to be the instrument variable, as well as regressed the baseline model using 2SLS. On the one hand, the lagged one-period green finance index is highly correlated with the current period’s green finance index and uncorrelated with the error term. On the other hand, the lagged period of green finance cannot directly affect the energy intensity and satisfies the exogenous requirement. The regression results are listed in Columns (3) and (4) of Table 7. In the first stage, the coefficient of the instrumental variable is significantly positive. In contrast, in the second stage of estimation, the coefficient of the fitted green finance index is significantly negative, indicating that the development of green finance effectively reduces energy intensity. This is consistent with the previous results and indicates that the baseline regression results are valid and reliable.
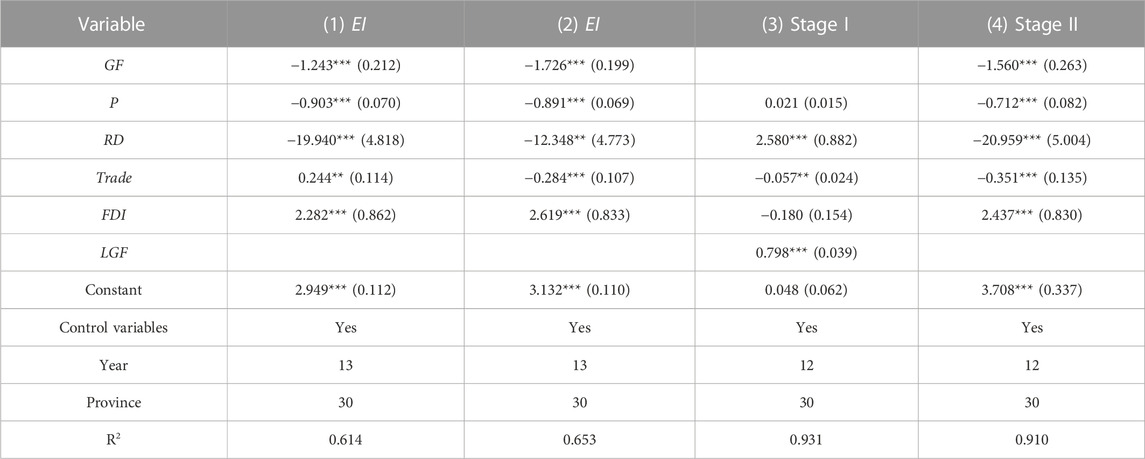
TABLE 7. Robustness tests for the impact of green finance on energy intensity.
5 Conclusion and recommendations
5.1 Conclusion
Based on the fact that green finance can validly reduce energy intensity, this study empirically analyzed the influence mechanism of green finance on energy intensity by using the mediating effect model, threshold model, and spatial Durbin model based on province-level data of China from 2007 to 2019, from the perspective of industrial structure upgrading as the entry point, and on the basis of constructing a green finance index. The main conclusions are as follows: First, the development of green finance validly reduces energy intensity, in which industrial structure upgrading plays a mediating role in the influence of green finance on energy intensity. The energy price index, R&D intensity, and foreign trade intensity reduce energy intensity, whereas FDI intensity positively affects energy intensity. Second, green finance has a non-linear effect on energy intensity. The energy intensity can be effectively suppressed only when the green finance index is greater than 0.199, while the suppression effect decreases when the green finance index exceeds 0.512. Third, green finance has a remarkable spatial spillover effect on energy intensity, and the development of green finance helps form a pattern of synergistic promotion of emission reduction among regions. Fourth, in the regional heterogeneity analysis, the inhibitory effect of green finance on energy intensity is more substantial in the central and western regions, which may be due to the different endowment advantages in the eastern, central, and western regions.
5.2 Recommendations
Based on theoretical and empirical analysis, we make the following recommendations.
First, the guidance role of green finance should be utilized. The government should accelerate the formulation of green finance development policies, complete incentive mechanisms and regulatory mechanisms, and address the problem of environmental externalities. Through the establishment of special funds for green development, financial subsidies, tax incentives, and other measures to guide more capital to flow into green industries, fully utilize the fiscal policy’s capacity to leverage capital. Differential credit policies should be strictly implemented to raise polluting enterprises’ financing costs and promote industries’ green transformation. Financial institutions should improve the green financial risk management system, provide more green financial products and services, and address the problems of asymmetric information and maturity mismatch of green investment and financing.
Second, green finance should be developed according to local conditions. The eastern region should further develop and improve the green finance system by upholding the existing green finance policies. It should take advantage of the developed financial system and a high degree of openness to the outside world; new green financial products should be created, and more advanced green financial development models should be aggressively explored. For the central and western regions, government subsidies, tax concessions, credit incentives, and other policies should be increased, and the entry threshold for green credit should be suitably lowered. Green financial resources such as capital, talent, and technology should be introduced to encourage the development of green finance. Green development evaluation and assessment should be conducted to enhance enterprises’ green awareness and mobilize local governments’ enthusiasm to develop local green finance.
Third, build a regional coordinated development mechanism. Given the spatial spillover effect of green finance, the demonstration and radiation role of green financial center cities should be considered. Coordination and cooperation among regions should be strengthened, and advanced achievements and experiences in green finance should be promoted and borrowed to drive the development of green finance in the region. With the help of modern network technology, specialized green finance platforms should be built to integrate and share resources. The interconnection of policies, technologies, and markets among regions should be promoted to facilitate the coordinated development of green finance and fully release the spatial contribution of green finance in reducing energy intensity.
Data availability statement
The datasets presented in this study can be found in online repositories. The names of the repository/repositories and accession number(s) can be found in the article/Supplementary Material.
Author contributions
QA was responsible for formal analysis, writing-original draft preparation, review, and editing. CL was responsible for conceptualization, methodology, software, validation, writing-original draft preparation, and editing. QL was responsible for methodology and software. LZ was responsible for conceptualization and data curation.
Funding
This research was funded by the National Social Science Fund of China Program (General Project 21BTJ072) and was funded by the Shandong Soft Science Research Program (Major Project 2019RZB14008).
Acknowledgments
This study was sponsored by the National Social Science Fund of China Program (General Project 21BTJ072) and the Shandong Soft Science Research Program (Major Project 2019RZB14008), to which we are highly acknowledged.
Conflict of interest
The authors declare that the research was conducted in the absence of any commercial or financial relationships that could be construed as a potential conflict of interest.
Publisher’s note
All claims expressed in this article are solely those of the authors and do not necessarily represent those of their affiliated organizations, or those of the publisher, the editors and the reviewers. Any product that may be evaluated in this article, or claim that may be made by its manufacturer, is not guaranteed or endorsed by the publisher.
Supplementary material
The Supplementary Material for this article can be found online at: https://www.frontiersin.org/articles/10.3389/feart.2023.1118939/full#supplementary-material
Footnotes
1Energy transformation continues to promote energy saving and consumption reduction is effective—the party’s economic and social development achievements since the 18th report of the series of 14, http://www.stats.gov.cn/xxgk/jd/sjjd2020/202210/t20221008_1888971.html.
2“Fourteen Five” modern energy system planning, http://www.gov.cn/zhengce/zhengceku/2022-03/23/5680759/files/ccc7dffca8f24880a80af12755558f4a.pdf.
3The data comes from the Green Finance for Carbon Peaking and Carbon Neutrality compiled by the People’s Bank of China.
4Six high-energy-consuming industries, including chemical materials and chemical products manufacturing, ferrous metal smelting and rolling processing industry, non-ferrous metal smelting and rolling processing industry, non-metallic mineral products industry, petroleum processing, coking and nuclear fuel processing industry, electricity and heat production and supply industry.
References
An, G., and Zi, W. (2020). Research on green finance in the aspect of promoting the sustainable development of the free trade zone. Public Finance Res. (05), 117–129. doi:10.19477/j.cnki.11-1077/f.2020.05.009
An, W. (2008). A probe into the connotation, mechanism and practice of green finance. Econ. Surv. (05), 156–158. doi:10.15931/j.cnki.1006-1096.2008.05.039
Chen, S., Zhang, H., and Wang, S. (2022). Trade openness, economic growth, and energy intensity in China. Technol. Forecast Soc. Change 179, 121608. doi:10.1016/j.techfore.2022.121608
Chen, X. (2020). Financial structure, technological innovation and carbon emissions: With additional studies on the development of green financial system. Soc. Sci. Guangdong 37 (04), 41–50.
Chen, X., Shao, S., Tian, Z., Xie, Z., and Yin, P. (2016). Impacts of air pollution and its spatial spillover effect on public health based on China’s big data sample. J. Clean. Prod. 142, 915–925. doi:10.1016/j.jclepro.2016.02.119
Dina, A., Anant, K., and Liu, Y. (2020). Green bonds for financing renewable energy and energy efficiency in south-east asia: A review of policies. J. Sustain Financ. Inv 10 (2), 113–140. doi:10.1080/20430795.2019.1704160
Dong, X., and Fu, Y. (2018). Time-space dimension analysis of green finance development and influencing factors. Statistics Decis. 34 (20), 94–98. doi:10.13546/j.cnki.tjyjc.2018.20.022
Feng, L., Yang, W., Zhao, Q., and Shang, S. (2022). A statistical test of the effect of green finance on industrial pollution. Statistics Decis. 38 (06), 144–149. doi:10.13546/j.cnki.tjyjc.2022.06.029
Gao, J., and Zhang, W. (2021). Research on the impact of green finance on the ecologicalization of China’s industry structure - empirical test based on system GMM model. Econ. Rev. J. 37 (02), 105–115. doi:10.16528/j.cnki.22-1054/f.202102105
Guo, X. (2016). Regional convergence of energy intensity in China based on spatial panel data model. J. Residuals Sci. Technol. 13 (6).
Hajko, V. (2014). The energy intensity convergence in the transport sector. Procedia Econ. Finance 12, 199–205. doi:10.1016/S2212-5671(14)00336-0
Hong, W., Zeeshan, F., Elżbieta, W., Dominik, R., and Marzena, H. S. (2022). Role of green financing and eco-innovation for energy efficiency in developed countries: Contextual evidence for pre- and post-COVID-19 Era. Front. Energy Res. 10. doi:10.3389/FENRG.2022.947901
Huang, S. (2022). Do green financing and industrial structure matter for green economic recovery? Fresh empirical insights from Vietnam. Econ. Anal. Policy 75, 61–73. doi:10.1016/J.EAP.2022.04.010
Huang, Y., and Chen, C. (2022). The spatial spillover and threshold effect of green finance on environmental quality: Evidence from China. Environ. Sci. Pollut. Res. Int. 29 (12), 17487–17498. doi:10.1007/s11356-021-16892-x
Li, K., and Lin, B. (2014). The nonlinear impacts of industrial structure on China’s energy intensity. Energy 69, 258–265. doi:10.1016/j.energy.2014.02.106
Li, X., and Xia, G. (2014). China green finance report 2014. Beijing: China Financial Publishing House.
Lin, B., and Sun, C. (2011). How can China achieve its carbon emission reduction target while sustaining economic growth? Soc. Sci. China (01), 64–76+221.
Liu, C., and Hu, W. (2016). FDI enhances carbon productivity in China?: Empirical analysis of spatial Durbin model. World Econ. Stud. 32 (01), 99–109+137. doi:10.13516/j.cnki.wes.2016.01.010
Liu, H., Yao, P., Shahid, L., Sumaira, A., and Nadeem, I. (2021). Impact of green financing, fintech, and financial inclusion on energy efficiency. Environ. Sci. Pollut. Res. 29 (13), 18955–18966. doi:10.1007/S11356-021-16949-X
Liu, Q., and Tang, L. (2022). Research on the accelerating effect of green finance on the transformation of energy consumption in China. Res. Int. Bus. Finance 63, 101771. doi:10.1016/J.RIBAF.2022.101771
Luan, B., Zou, H., Chen, S., and Huang, J. (2021). The effect of industrial structure adjustment on China’s energy intensity: Evidence from linear and nonlinear analysis. Energy 218, 119517. doi:10.1016/j.energy.2020.119517
Ouyang, X., Zhang, J., and Du, G. (2022). Environmental regulation and green technological innovation: Impact mechanism analysis and spatial spillover effects. Chin. J. Manag. Sci. 39, 1–12. doi:10.16381/j.cnki.issn1003-207x.2022.0642
Pach-Gurgul, A., Śmiech, S., and Ulbrych, M. (2021). The effect of energy prices on energy intensity improvement – The case of the chemical industry in the V4 countries. Post-Communist Econ. 33 (5), 566–580. doi:10.1080/14631377.2020.1793605
Peng, J., and Zheng, Y. (2021). Does environmental policy promote energy efficiency? Evidence from China in the context of developing green finance. Front. Environ. Sci. 9. doi:10.3389/FENVS.2021.733349
Predrag, P., and Mikhail, L. M. (2022). Energy intensity and foreign direct investment nexus: Advanced panel data analysis. Appl. Energy 311, 118669. doi:10.1016/j.apenergy.2022.118669
Ren, X., Shao, Q., and Zhong, R. (2020). Nexus between green finance, non-fossil energy use, and carbon intensity: Empirical evidence from China based on a vector error correction model. J. Clean. Prod. 277, 122844. doi:10.1016/j.jclepro.2020.122844
Shao, X., and Fang, T. (2021). Analysis on the coupling effect between regional green finance and industrial structure-Based on new institutional economics. J. Industrial Technol. Econ. 40 (01), 120–127.
Shen, T., and Cao, M. (2020). Does the green finance pilot reduce the energy intensity? J. Financial Dev. Res. 39 (02), 3–10. doi:10.19647/j.cnki.37-1462/f.2020.02.001
Shen, X., Chen, Y., and Lin, B. (2021). The impacts of technological progress and industrial structure distortion on China’s energy intensity. Econ. Res. J. 56 (02), 157–173.
Shi, D., and Shi, X. (2022). Green finance and high-quality economic development: Mechanism, characteristics and empirical study. Stat. Res. 39 (01), 31–48. doi:10.19343/j.cnki.11-1302/c.2022.01.003
Song, M., Xie, Q., and Shen, Z. (2021). Impact of green credit on high-efficiency utilization of energy in China considering environmental constraints. Energy Policy 153, 112267. doi:10.1016/J.ENPOL.2021.112267
Su, D., and Lian, L. (2018). Does green credit policy affect corporate financing and investment? Evidence from publicly listed firms in pollution-intensive industries. J. Financial Res. (12), 123–137.
Sun, H., and Chen, F. (2022). The impact of green finance on China's regional energy consumption structure based on system GMM. GMM. Resour. Policy 76, 102588. doi:10.1016/J.RESOURPOL.2022.102588
Tan, X., Xiao, Z., Liu, Y., Taghizadeh-Hesary, F., Wang, B., and Dong, H. (2022). The effect of green credit policy on energy efficiency: Evidence from China. Technol. Forecast Soc. Change 183, 121924. doi:10.1016/j.techfore.2022.121924
Wang, F., Wang, R., and He, Z. (2021a). The impact of environmental pollution and green finance on the high-quality development of energy based on spatial Dubin model. Resour. Policy 74, 102451. doi:10.1016/j.resourpol.2021.102451
Wang, H., Jiang, L., Duan, H., Wang, Y., Jiang, Y., and Lin, X. (2021b). The impact of green finance development on China’s energy structure optimization. Discrete Dyn. Nat. Soc. 2021, 1–12. doi:10.1155/2021/2633021
Wang, H., Zhao, X., Ren, L., Fan, J., and Lu, F. (2021c). The impact of technological progress on energy intensity in China (2005–2016): Evidence from a geographically and temporally weighted regression model. Energy 226, 120362. doi:10.1016/j.energy.2021.120362
Wang, S., He, Y., and Song, M. (2021d). Global value chains, technological progress, and environmental pollution: Inequality towards developing countries. J. Environ. Manage. 277, 110999. doi:10.1016/j.jenvman.2020.110999
Wang, S., Liu, H., Pu, H., and Yang, H. (2020a). Spatial disparity and hierarchical cluster analysis of final energy consumption in China. Energy 197, 117195. (prepublish). doi:10.1016/j.energy.2020.117195
Wang, S., Wang, X., and Chen, S. (2022). Global value chains and carbon emission reduction in developing countries: Does industrial upgrading matter? Environ. Impact Assess. Rev. 97, 106895. doi:10.1016/J.EIAR.2022.106895
Wang, S., Zhao, D., and Chen, H. (2020b). Government corruption, resource misallocation, and ecological efficiency. Energy Econ. 85, 104573. doi:10.1016/j.eneco.2019.104573
Wang, X., Huang, J., Xiang, Z., and Huang, J. (2021e). Nexus between green finance, energy efficiency, and carbon emission: Covid-19 implications from BRICS countries. Front. Energy Res. 9. doi:10.3389/FENRG.2021.786659
Wen, Z., and Ye, B. (2014). Analyses of mediating effects: The development of methods and models. Adv. Psychol. Sci. 22 (05), 731–745. doi:10.3724/sp.j.1042.2014.00731
Xie, T., and Liu, J. (2019). How does green credit affect China’s green economy growth? China Popul. Resour. Environ. 29 (09), 83–90.
Xu, S., Zhao, X., and Yao, S. (2018). Analysis on the effect of green credit on the upgrading of industrial structure. J. Shanghai Univ. Finance Econ. 20 (02), 59–72. doi:10.16538/j.cnki.jsufe.2018.02.004
Xu, Y., Gu, H., and Zhu, X. (2016). An effect of foreign trade on the industrial CO2 emissions in China. Manag. Rev. 28 (03), 3–11. doi:10.14120/j.cnki.cn11-5057/f.2016.03.001
Yin, Z., Sun, X., and Xing, M. (2021). Research on the impact of green finance development on green total factor productivity. Statistics Decis. 37 (03), 139–144. doi:10.13546/j.cnki.tjyjc.2021.03.030
Yuan, Y., and Xie, R. (2014). A study on the industrial restructuring effect of environmental regulations - an empirical test based on inter-provincial panel data in China. China Ind. Econ. 32 (08), 57–69. doi:10.19581/j.cnki.ciejournal.2014.08.005
Zeinab, Z., Isabel, S., and Pedro, M. (2022). The nexus between CO2 emissions from electricity generation, GDP and energy intensity using a complete maximum entropy approach: The case of Iran. Energy Rep. 8 (S3), 319–324. doi:10.1016/J.EGYR.2022.01.058
Zhan, X. (2018). Practice and institutional innovation of green financial development in China. Macroecon. Manag. 34 (01), 41–48. doi:10.19709/j.cnki.11-3199/f.2018.01.010
Zhang, B., and Wang, Y. (2019). The effect of green finance on energy sustainable development: A case study in China. Emerg. Mark. Finance Trade 57 (12), 3435–3454. doi:10.1080/1540496x.2019.1695595
Zhang, C., Xie, M., Tian, H., and Wang, G. (2016). The developmental logic and framework of China’s green finance. Finance Forum 21 (02), 17–28. doi:10.16529/j.cnki.11-4613/f.2016.02.002
Zhang, P., and Tu, X. (2022). Manufacturing agglomeration, technological progress and enterprise total factor energy efficiency. China Ind. Econ. (07), 103–121. doi:10.19581/j.cnki.ciejournal.2022.07.010
Zheng, Y., Chen, S., and Wang, N. (2020). Does financial agglomeration enhance regional green economy development? Evidence from China. Green Finance 2 (2), 173–196. doi:10.3934/GF.2020010
Zhou, X., Tang, X., and Zhang, R. (2020). Impact of green finance on economic development and environmental quality: A study based on provincial panel data from China. Environ. Sci. Pollut. Res. 27, 19915–19932. (prepublish). doi:10.1007/s11356-020-08383-2
Keywords: green finance, energy intensity, industrial structure, threshold effect, spatial spillover effect
Citation: An Q, Lin C, Li Q and Zheng L (2023) Research on the impact of green finance development on energy intensity in China. Front. Earth Sci. 11:1118939. doi: 10.3389/feart.2023.1118939
Received: 08 December 2022; Accepted: 26 January 2023;
Published: 06 February 2023.
Edited by:
Chuanwang Sun, Xiamen University, ChinaReviewed by:
Xin Zhao, Anhui University of Finance and Economics, ChinaMing Zhang, China University of Mining and Technology, China
Copyright © 2023 An, Lin, Li and Zheng. This is an open-access article distributed under the terms of the Creative Commons Attribution License (CC BY). The use, distribution or reproduction in other forums is permitted, provided the original author(s) and the copyright owner(s) are credited and that the original publication in this journal is cited, in accordance with accepted academic practice. No use, distribution or reproduction is permitted which does not comply with these terms.
*Correspondence: Chengwei Lin, bGluY3dzZHVmZUAxMjYuY29t