 Jinghua Chao1,2
 Guangzhou Fan
 Quanjia Zhong
 Tao Wen
94% of researchers rate our articles as excellent or good
Learn more about the work of our research integrity team to safeguard the quality of each article we publish.
Find out more
ORIGINAL RESEARCH article
Front. Earth Sci., 02 February 2023
Sec. Atmospheric Science
Volume 11 - 2023 | https://doi.org/10.3389/feart.2023.1117030
Using the observational data, the Coupled Model Intercomparison Project phase 6 (CMIP6) models and the numerical experiment, this study examines the influence of the North American dipole (NAD) on the Atlantic warm pool (AWP). The results show that a strong positive (negative) phase of the winter NAD tends to inhibit (favor) the development of AWP in its area and depth in subsequent months. As opposed to the North Atlantic Oscillation (NAO), the NAD plays a more pivotal role in influencing the AWP due to its effectiveness in forcing the tropical North Atlantic (TNA) SST variability, which means that AWP variability may be more of a lagging response to NAD atmospheric forcing than a lagging response to NAO atmospheric forcing. Additional analysis indicates that the winter NAD-like atmospheric signal may be stored in the following AWP, thus markedly influencing the TNA precipitation and air temperature in summer. It is speculated that the AWP may act as a bridge linking winter NAD to the following summer precipitation and air temperature in the TNA region.
The Atlantic warm pool (AWP) of water warmer than 28.5°C comprises the western tropical North Atlantic (TNA), the Gulf of Mexico, and the Caribbean, which is located entirely north of the equator (Wang and Enfield 2001; Wang and Enfield 2003; Curtis 2013; Misra et al., 2016). The AWP appears in the boreal late spring and reaches its maximum size in late summer (Enfield and Lee 2005; Lee et al., 2007).
As a source of heat and moisture for global atmospheric circulation, the AWP exerts a notable influence on the regional and global climate (Wang et al., 2008a; Wang and Lee 2008; Durán-Quesada et al., 2010; Drumond et al., 2011; Liu et al., 2015). For instance, rainfall in eastern South America, Central America, and the Caribbean Sea from August-October are closely linked to the AWP size (Wang et al., 2006). Furthermore, many studies have also indicated that the AWP can affect the formation and development of Atlantic hurricanes by prompting vertical wind shear changes and moist static instability (Wang and Lee 2007; Lee et al., 2010; Wang et al., 2011).
The AWP exhibits an interannual variability in its area and intensity (Misra et al., 2013). Much of this variability is thought to be a consequence of remote forcing by climate variabilities outside the tropical Atlantic (Lee et al., 2008), such as the El Niño-Southern Oscillation (ENSO; Covey and Hastenrath 1978; Curtis and Hastenrath 1995; Enfield 1996; Nobre and Shukla 1996; Giannini et al., 2000) and the North Atlantic Oscillation (NAO; Giannini et al., 2001; Mo and Häkkinen 2001). Past studies have made mention that both the wintertime ENSO and NAO events can drive TNA SST anomalies during spring through their impact on latent heat exchange at the ocean surface and subsequently lead to fluctuations in the size of the AWP in the following summer (Enfield and Mayer 1997; Liu et al., 2012). Enfield et al. (2006) investigated that the El Niño event in the previous winter can result in an extraordinary summer AWP (about twice the climatological annual size) through an atmospheric bridge. Furthermore, they also emphasized that the interannual fluctuations of the NAO may encroach with the atmospheric bridge forcing from ENSO during the winter and, in turn, influence the formation of large AWP in the following summer and fall.
The TNA SST plays an essential role in developing subsequent AWP, and the positive SST anomalies in the TNA region are conducive to the generation of a large AWP (Wang and Enfield 2003; Wang et al., 2008b). Previous studies mainly focused on how remote forcing such as winter ENSO and NAO affects the AWP in the following summer through their impact on spring TNA SST anomalies. Recent findings suggested the existence of a meridional dipole of sea level pressure (SLP) anomalies over northeastern North America and the western tropical North Atlantic, which is known as the North American dipole (NAD; Ding et al., 2017; Ding et al., 2019). Although the winter NAD and NAO have similar dipole characteristics in terms of SLP anomalies in the North Atlantic, they have distinct differences. The NAD is prone to force the SST anomalies in the TNA region more effectively than the NAO, considering that the center of SLP anomalies related with the NAD is further west and south as opposed to the NAO (Zhou et al., 2019; see also Figure 1A). Owing to the closer link of the NAD with the TNA SST anomalies than the NAO, it is speculated that the winter NAD may also affect subsequent AWP development, which may be a precursor to the anomalous size of the AWP.
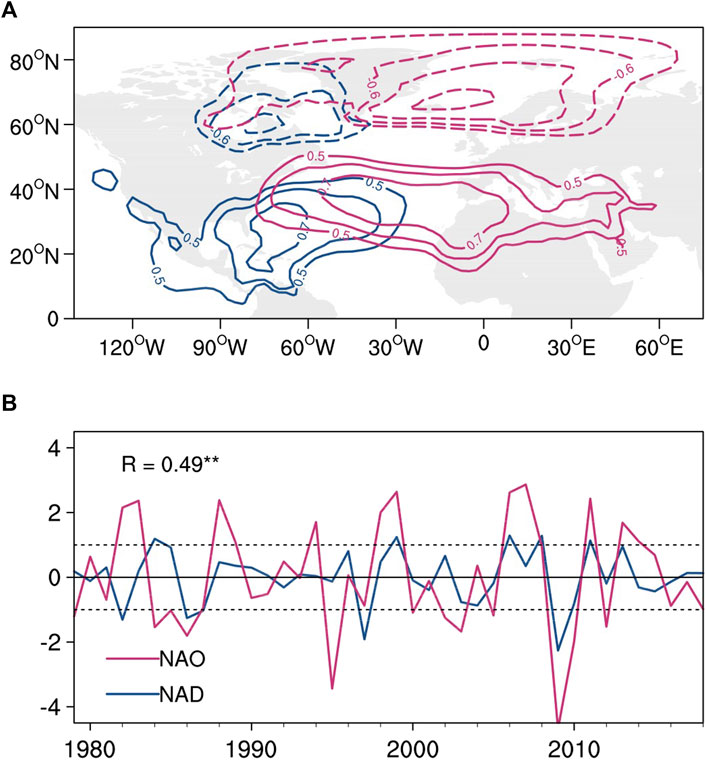
FIGURE 1. (A) Maps of correlation between the DJFM-averaged SLP anomalies and the simultaneous NADI (blue lines) and NAOI (red lines). The contour interval is 0.1. Only correlations greater than 0.5 are shown. (B) the interannual time series of the DJFM-averaged NADI (blue line) and NAOI (red line). The horizontal dashed lines indicate ±1 standard deviation. The correlation coefficient (R) between the NADI and NAOI is shown in the top left corner.
The influence of NAD-like atmospheric variability on the AWP size will be analyzed in this study. The remainder of this paper is arranged as follows: Section 2 introduces the datasets and analytical methods. The correlation between the NAD and the AWP variability in both observations and numerical simulations are presented in section 3. Section 4 consists of a summary of our main findings and provides a discussion.
The Hadley Centre SST data set version 1 (HadISST1) is employed for the SST analysis (Rayner et al., 2003). Subsurface ocean temperature data are taken from the Simple Ocean Data Assimilation (SODA) version 2.2.4 (Carton and Giese 2008). The precipitation field is extracted from the NOAA Climate Prediction Center (CPC) Merged Analysis of Precipitation (CMAP) dataset (Xie and Arkin 1997). Monthly atmospheric circulation data including winds, SLP, specific humidity, velocity potential, and air temperature employed in this study are procured from the National Centers for Environmental Prediction-National Center for Atmospheric Research (NCEP-NCAR) reanalysis version I (Kalnay et al., 1996). All datasets range from the years 1979–2019. We have also removed the long-term linear trend and seasonal cycle from all variables analyzed in this study.
To evaluate whether the effect of winter NAD on the following AWP can be reproduced in the current coupled model, the monthly outputs of 25 coupled atmosphere-ocean models participated in the Coupled Model Intercomparison Project, Phase 6 (CMIP6) from preindustrial control (pi-Control) experiments are used in this paper (Eyring et al., 2016). The variables analyze from the CMIP6 models included: SST, SLP, horizontal winds, precipitation, air temperature, and specific humidity. The SST variable output by the CMIP6 is converted to a horizontal resolution of 1° × 1°. In contrast, the other variables’ production is converted to a horizontal resolution of 2.5° × 2.5°, which concords with the resolution of the observed data and aids the calculation of the overall average. To circumvent the initial adjustment period caused by the model’s spin-up process, only the simulations run from the past century have been analyzed in this paper.
As per Ding et al. (2017), the NAD index (NADI) used here is defined as the difference of normalized (i.e., subtracting the mean and then dividing by the standard deviation) SLP anomalies between the southern (90°–60°W, 10°–30°N) and northern (75°–45°W, 55°–70°N) poles (southern minus northern pole) after linearly excluding the effect of the ENSO. The NAO index (NAOI) used in this study is defined as the difference in normalized SLP anomalies between the southern (80°W–30°E, 35°N) and northern (80°W–30°E, 65°N) poles over the North Atlantic sector (Li and Wang 2003). According to Zhou et al. (2019), the maximum seasonal variance of the NAD and NAO ranges from December to March (DJFM). Therefore, our research is based on the 4-month average DJFM NADI and NAOI. Figure 1B depicts the interannual time series of the DJFM-averaged NADI (blue line) and NAOI (red line) for 1979–2018, where their correlation was calculated at 0.49.
Following Wang and Enfield (2003), two types of AWP indices are employed in this study. One is the AWP area index (AWPAI), which is defined as the area within the 28.5°C isotherms at the AWP region’s sea surface. The other is the index of the depth enclosed by the 28.5°C isotherms in the AWP region (referred to as the AWP depth index, AWPDI).
The coupled model used in this study is the Flexible Global Ocean Atmosphere–Land System model grid-point version 2 (FGOALS-g2) developed at State Key Laboratory of Numerical Modeling for Atmospheric Sciences and Geophysical Fluid Dynamics (LASG), Institute of Atmospheric Physics (IAP), Chinese Academy of Sciences (Li et al., 2003). The FGOALS-g2 consist of the Grid-point Atmospheric Model of LASG/IAP version 2 (GAMIL2), the LASG/IAP Climate System Ocean Model version 2 (LICOM2), the Community Land Model version 3 (CLM3), and the improved version of Community Ice CodE version 4 by LASG (CICE4-LASG) connected with the coupler (CPL6).
To further interpret the NAD’s effect on the following AWP development, the control and assimilation experiments are conducted. The difference between the above two experiments is to assimilate the NAD-related winds (U, V) and air temperature (T) anomalies at 1000 hPa, 925 hPa, and 850 hPa in the western tropical North Atlantic and northeastern North America, which arises from regressions of the DJFM U, V and T anomalies onto the concurrent NADI (Figure 2). The control experiment is a historical run driven by external forcing observed from 1979 to 2018. Another experiment assimilated the NAD-related U, V, and T anomalies imposed on the climatological U, V, and T. The initialization is cycled at 40 years from 1979 to 2018 with a 1-month assimilation windows. The past 25 years’ output is applied to the composite analysis to minimize the possible internal impact.
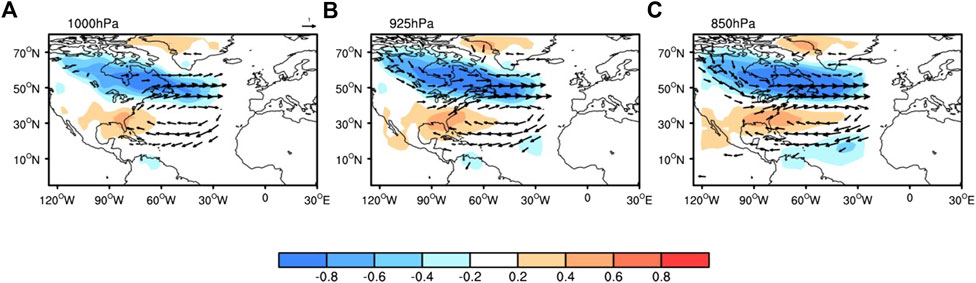
FIGURE 2. Correlation maps of the DJFM-averaged air temperature (shading, units: °C) and wind (vectors, units: m\s) anomalies with the simultaneous NADI at (A) 1000 hPa, (B) 925 hPa and (C) 850 hPa. Positive (red) and negative (blue) air temperature anomalies with correlations significant at or above the 90% confidence level are shaded. Only wind vectors significant at the 90% confidence level are shown.
Several statistical methods, including composite analysis, correlation analysis, and linear regression, are used in this study. The statistical significance is based on a two-tailed Student’s t-test, where the effective number (
where
To investigate the probable link between the NAD and AWP, the lead-lag correlation of the winter NADI (red line) with 3-month-averaged AWPAI and AWPDI for 1979–2018 is illustrated in Figure 3. The peak correlation between the NADI and AWPAI (R=−0.62; significant at the 99% confidence level) occurs during the months of May to July (MJJ), lagging the NAD’s peak during winter by about 5 months. For the AWP depth index, similar significant values (at the 99% confidence level) begin to appear during April–June (AMJ), peak (R=−0.60) during MJJ, and persist until the following fall. Moreover, we show the correlations of the AWPAI and AWPDI during MJJ with SLP anomalies in the previous winter (DJFM-averaged; Figure 4). It is observed that both the AWPAI and AWPDI are closely linked to the previous winter NAD-like dipole of SLP anomalies over the North Atlantic (Figure 1A).
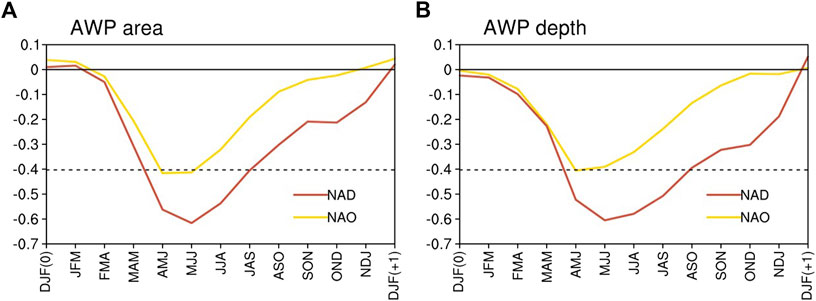
FIGURE 3. (A) Lead-lag correlations of the DJFM (0)-averaged NAD index (red line) and NAO index (yellow line) with 3-month-averaged AWP area index (red line). (B) As in (A), but with 3-month-averaged AWP depth index. The horizontal dashed line shows the 99% confidence level.
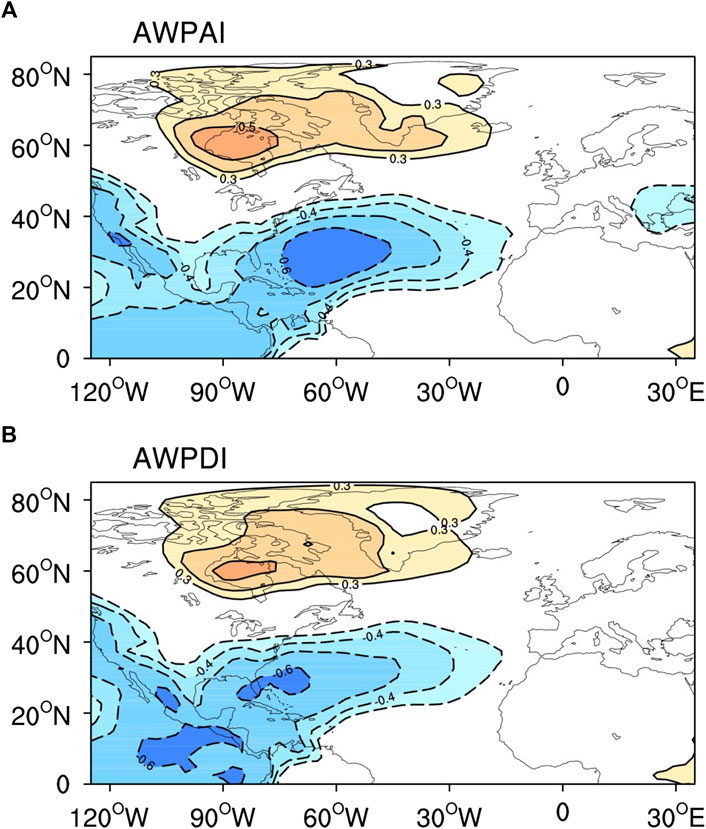
FIGURE 4. (A) Spatial pattern of DJFM-averaged sea level pressure anomalies correlated with the following MJJ AWPAI. (B) As in (A), but with the following MJJ AWPDI. Positive (yellow) and negative (blue) SLP anomalies with correlations significant at or above the 95% confidence level are shaded and the contour interval is 0.1.
We then perform a comprehensive analysis comparing the seasonal evolutions of the AWP area between positive and negative NAD events (Figure 5). It is defined as a positive (negative) NAD event when the winter NAD index is greater (less) than one positive (negative) standard deviation (Table 1). When the winter NAD is in its strong negative phase (blue line), the AWP develops in the Caribbean region during the months of April to June (AMJ) (Figure 5D). Thus, the eastern edge of the AWP extends eastward into the TNA region in the following MJJ and June–August (JJA) (Figures 5E, F), resulting in a twofold to threefold increase in area over the climatic state (Figures 5B, C). Contrarily, the positive phase of the winter NAD tends to inhibit the subsequent AWP development (see also Figures 5D–F; red line). The above results analyze changes in the area of the AWP, and a similar composite analysis regarding changes in the depth of the AWP is shown in Figure 6. A similar conclusion can be drawn that the strong positive (negative) phase of the winter NAD tends to inhibit (favor) the development of the AWP depth in subsequent months.
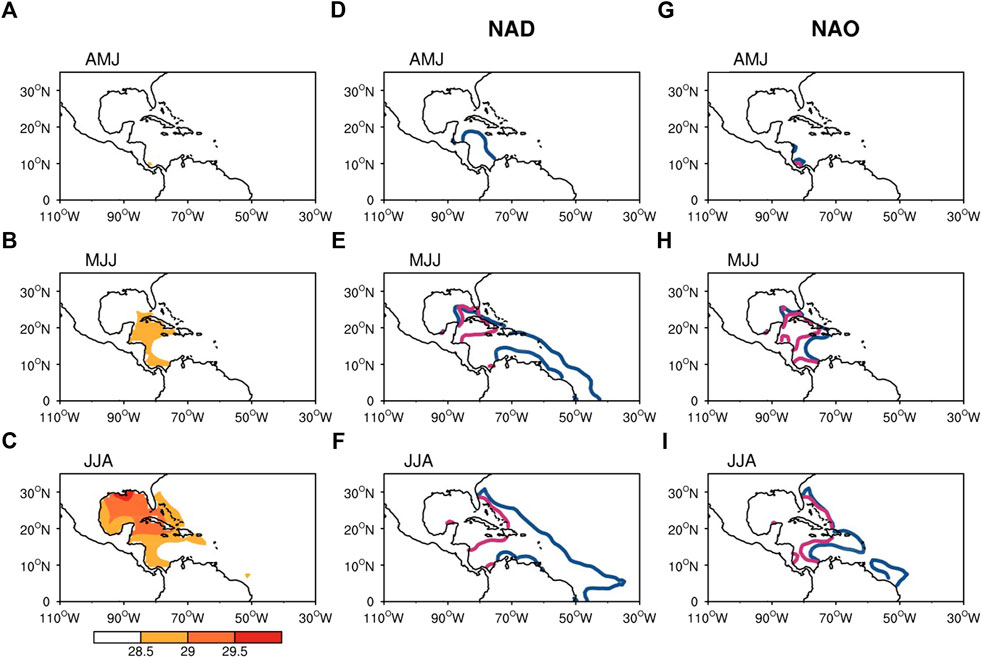
FIGURE 5. (A–C) Seasonal 3-month-averaged distributions of SST of the 28.5°C, 29.0°C, 29.5°C isotherm (the climatic state); (D–F) Composite of following 3-month-averaged SST of the 28.5°C isotherm from positive NAD cases (red line) and negative NAD cases (blue line); (G–I) as in (D–F) but from positive NAO cases (red line) and negative NAO cases (blue line).
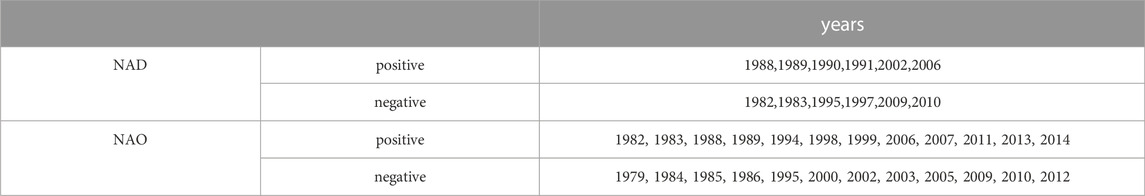
TABLE 1. Classification of years in which positive (negative) NAD and NAO events.
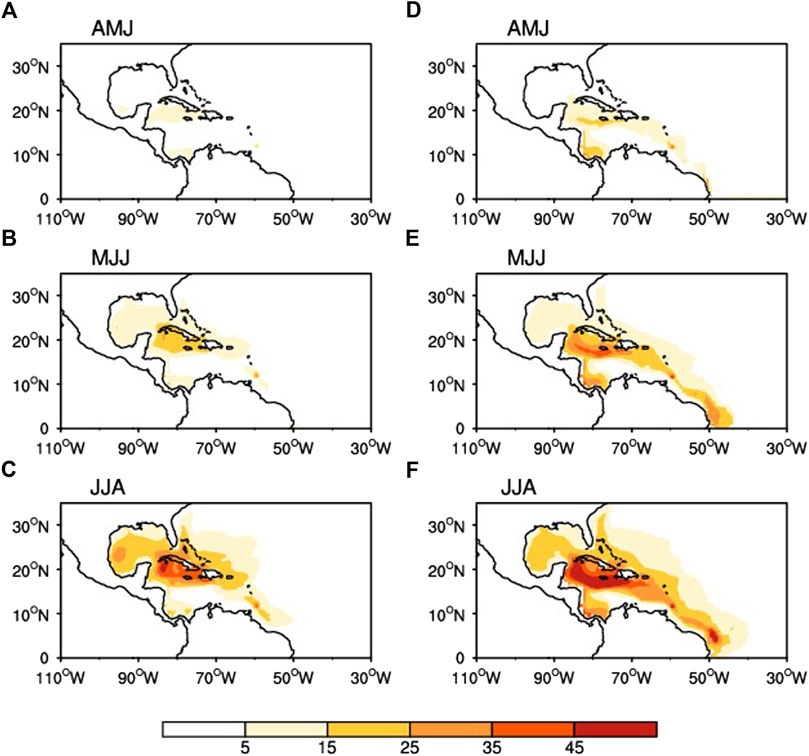
FIGURE 6. (A–C) Composite of following 3-month-averaged depth (m) of the 28.5°C isotherm from positive NAD cases; (D–F) as in (A–C) but from negative NAD cases.
A similar lead-lag correlation of the winter NAOI (yellow line) with 3-month-averaged AWPAI and AWPDI is also investigated in Figure 3B. In contrast to the NADI, the NAOI shows weaker correlations with the AWPAI and AWPDI during MJJ. The previous winter NAO has little effect on the following area (Figures 5G–I) and depth (not shown) of the AWP. These results indicate that the NAD may play a more pivotal role in influencing the AWP due to its efficiency at forcing the TNA SST variability in contrast with the NAO. This suggests that the AWP variability may be a lagged response to NAD atmospheric forcing, rather than a lagged response to NAO atmospheric forcing. Although the above observational analysis suggests a close connection between the NAD and AWP, it is limited by the relatively small number of the NAD events. Further investigations employing more extended datasets from the CMIP6 models are necessary to support the results of the observed data.
So far, the results have established a close relationship between variability of the NAD and AWP at seasonal time scales. To provide probable physical explanations for the connection between the NAD and AWP, the evolutions of SST and surface winds anomalies associated with the winter NAD were subsequently analyzed. Figure 7 illustrates the concurrent and lagged correlation maps of the DJFM-averaged NADI with the 3-month averaged SST and surface winds anomalies for December–February (DJF), March–May (MAM), May–July (MJJ), and July–September (JAS). The green box denotes the extent of the AWP.

FIGURE 7. Correlation maps of the DJFM–averaged NADI with the 3-month averages of SST (shading, units: °C), surface wind (vectors, units: m\s) anomalies for (A) DJF, (B) MAM, (C) MJJ and (D) JAS. Positive (red) and negative (blue) SST anomalies with correlations significant at or above the 90% confidence level are stippled. Only surface wind vectors significant at the 90% confidence level are shown. The green box area indicates the extent of the AWP.
During winter (the DJF season), a tripole-like SST anomaly pattern associated with the NAD is seen over the North Atlantic, characterized by significant positive SST anomalies in the Gulf of Mexico and western North Atlantic north of about 20°N and negative SST anomalies in the TNA (Figure 7A). The tripole-like SST anomaly pattern is induced by surface winds associated with the NAD through changes in the latent heat flux (Ding et al., 2017). Thus, the TNA SST cooling reaches its maximum during spring (the MAM season, Figure 7B) and persists into the following MJJ (Figure 7C) and JAS (Figure 7D) due to the wind–evaporation–SST (WES) feedback (Xie and Philander 1994), extending from the Caribbean to the Gulf of Mexico. Given that the AWP is adjacent to the TNA, the remote forcing of the NAD acts on the AWP in a similar way as on the TNA: changes in surface winds provoke changes of latent heat flux that subsequently generate AWP SST anomalies.
The above results indicate that the NAD-induced SST anomalies in the TNA region play a crucial role in developing succeeding anomalous AWP. The analyses further prove the impact of the TNA SST on the AWP development. In conclusion, the underlying physical process of the influence of NAD-induced TNA SST on the AWP is concordant with the mechanism proposed by Enfield et al. (2006) to explain manifestations of anomalous AWPs. However, the emphasis laid in this study is on the connection between the NAD and AWP. Our analysis shows that the NAD has a vital role in the development of a large AWP event.
To further interpret the NAD’s effect on the following AWP development, the control and assimilation experiments are conducted by the FGOALS-g2 model. The composite differences in the seasonal evolutions of SST and surface winds anomalies between the assimilation and control experiments are illustrated in Figure 8. The model results confirm that the NAD-related surface winds anomalies can force negative SST anomalies in the TNA during winter and spring (Figures 8A, B). However, we note that the NAD-forced negative TNA SST anomalies in the numerical experiments are weaker than in observations. Thereafter, the TNA SST cooling persists through the following MJJ and JAS (Figures 8C, D), which may inhibit the following AWP’s eastward expansion. These results from coupled model experiments are almost concordant with those described in the observational data (Figure 7) and further substantiate the winter NAD influences on the ensuing AWP development.
FIGURE 8. Composite differences in the seasonal evolution of SST (shading, units: °C) and surface wind (vectors, units: m\s) anomalies between the assimilation and control experiments for (A) DJF, (B) MAM, (C) MJJ and (D) JAS. Positive (red) and negative (blue) SST anomalies with significant at or above the 90% confidence level are stippled. Only surface wind vectors significant at the 90% confidence level are shown. The green box area indicates the extent of the AWP.
To evaluate whether the effect of winter NAD on subsequent AWP can be reproduced in the current coupled model, we analyzed the monthly outputs of 25 coupled atmosphere-ocean models participated in CMIP6 (Table 2).
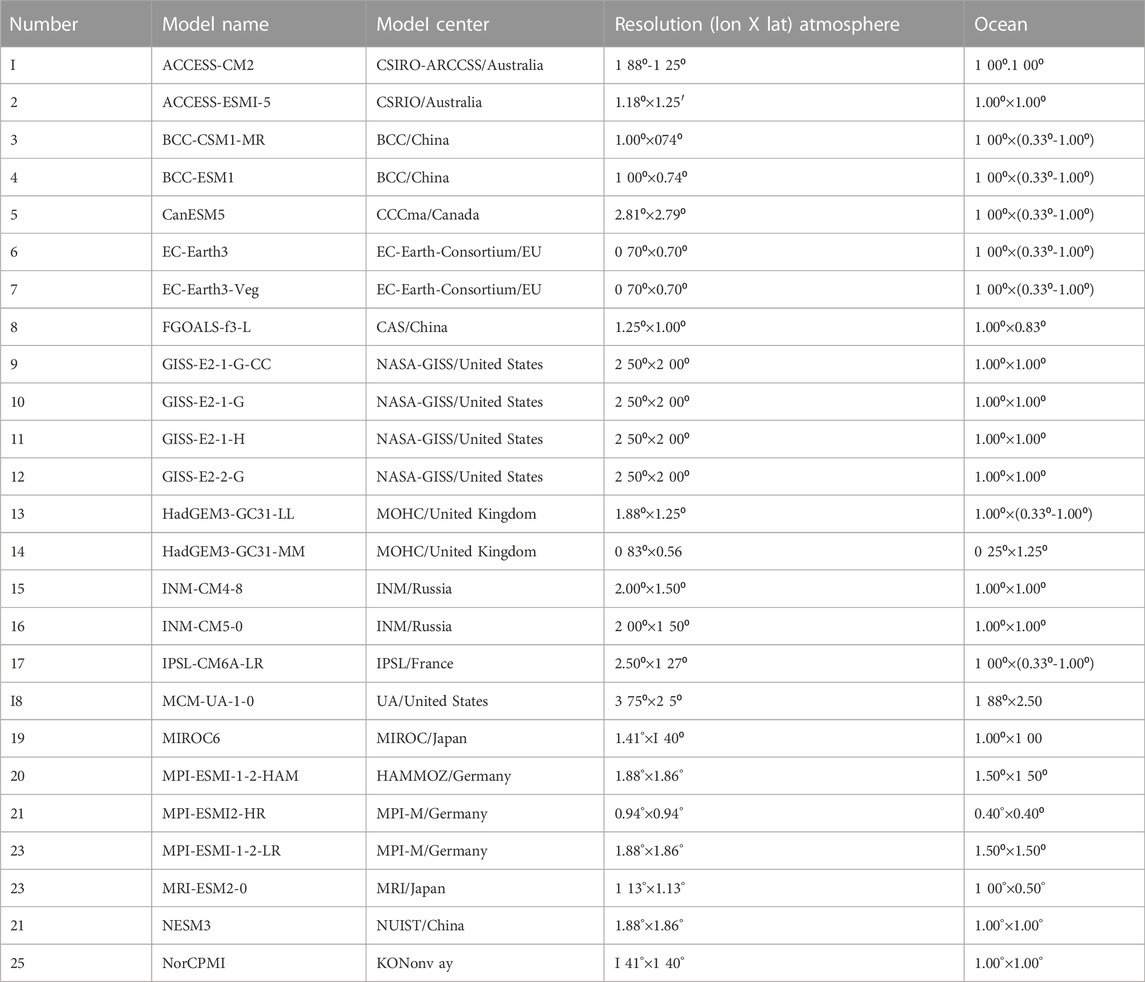
TABLE 2. Description of CMIP6 models used in the study.
The models’ abilities in simulating the NAD are first assessed. Figure 9 illustrates the spatial patterns of the correlation coefficient between the DJFM-averaged NADI and concurrent SLP anomalies derived from observations and 25 CMIP6 models’ simulations. All the models can reproduce a distinct SLP dipole comprising of a low over northeastern North America and a high over the western tropical North Atlantic, which is the signature feature of the NAD. For the location of the NAD center, there is a northward displacement of the negative center of the NAD in most of the models when compared to the observations. Furthermore, most models can give an accurate representation of the NAD’s positive center, although several models (EC-Earth3, MIROC6, MPI-ESM-1-2-HAM, MPI-ESM1-2-HR, and MRI-ESM2-0) simulate the NAD’s positive centers extending too far to the east. Henceforth, a Taylor diagram (Taylor, 2001) is employed to quantitatively measure the difference between model simulations and observations and make inherent comparisons among different models (Figure 10). Two-thirds of the pattern correlation coefficients between the modeled and observed NAD pattern are evaluated at more than 0.70, indicating that the CMIP6 models generally reproduce well the NAD pattern. More than half of the ratios of the standard deviations between modeled and observed NAD patterns are valued to be less than 1.0, which indicates that most CMIP6 models underestimate the NAD variability. In general, HadGEM3-GC31-LL and FOGOALS-f3-L perform best at simulating the interannual NAD pattern.
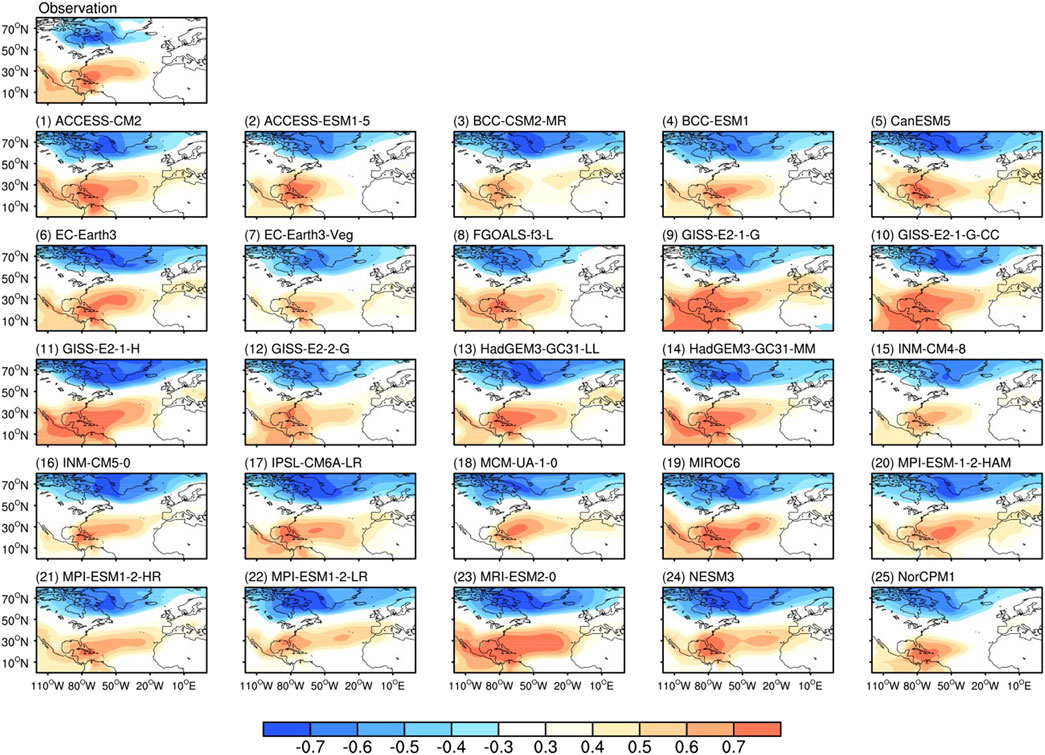
FIGURE 9. Spatial pattern of DJFM-averaged SLP anomalies correlated with the concurrent NADI derived from observation and the 25 CMIP6 model simulations.
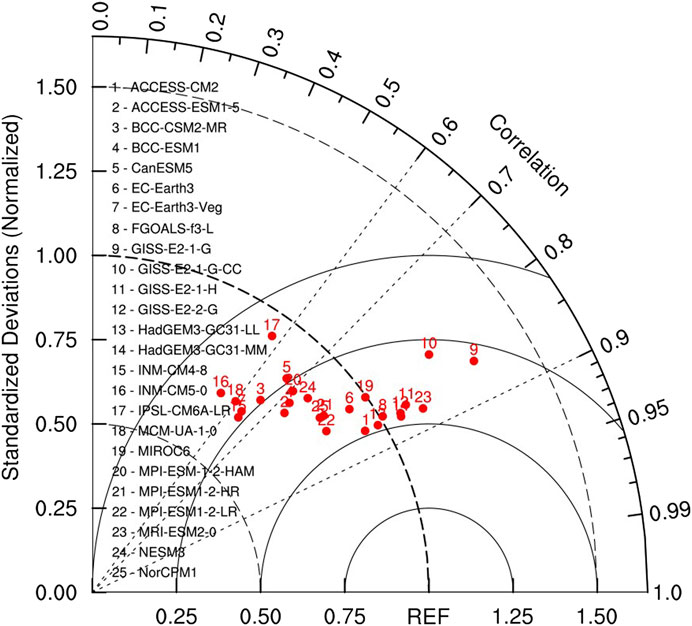
FIGURE 10. Taylor diagram of the NAD pattern. Each numbered dot in the diagram represents a single model. The term “REF” on the horizontal axis refers to the reference point. Black dashed lines and arcs indicate the correlation coefficient and the ratio of standard deviations between modeled and observed NAD patterns, respectively. Black solid arcs show the centered root mean square difference which is equal to the radical distance from the reference point.
The relationship between the NAD and AWP and the associated physical processes in model simulations are subsequently analyzed. Figure 11 shows simulated lead-lag correlations of the DJFM-averaged NADI with 3-month-averaged AWPAI. Most models (16 out of 25) reproduce a significant negative correlation occurring in spring or early summer. Also, as shown in Figure 12, more than half of the models simulate a negative correlation significant at the 90% confidence level between the previous winter NAD and the following MJJ AWP.
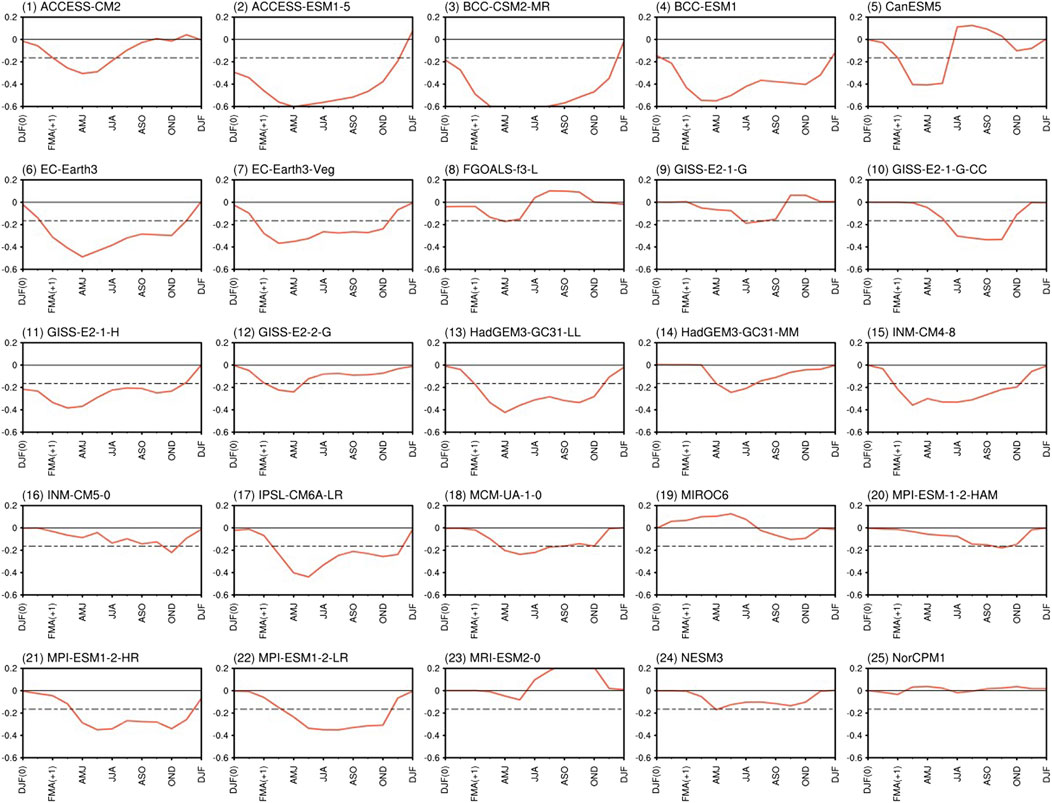
FIGURE 11. Lead-lag correlations of the DJFM (0)-averaged NADI with 3-month-averaged AWPAI derived from the CMIP6 model simulations. The horizontal dashed lines show the 90% confidence level.
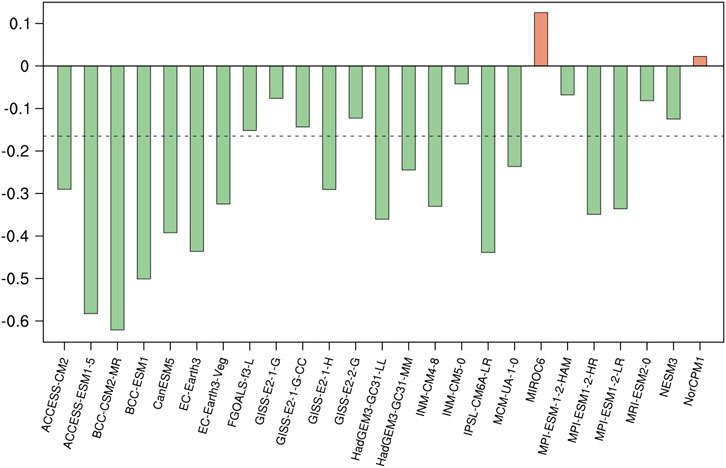
FIGURE 12. Correlations of the DJFM (0)-averaged NADI with following MJJ AWPI derived from the CMIP6 model simulations. The horizontal dashed lines show the 90% confidence levels.
The aforementioned results show that a significant negative correlation between the boreal winter NAD and the following spring or early summer AWP variability can be reproduced in most CMIP6 models. Figure 13 shows correlation maps of the 3-month averaged SST and surface wind anomalies with the NADI derived from the multi-model ensemble means (MME) of 25 CMIP6 models. A tripole-like SST pattern in the North Atlantic is discerned during DJF. Negative SST anomalies in the NTA region reach maximum intensity during MAM. The NAD-related TNA cooling persists until MJJ, extending from the Caribbean Sea to the Gulf of Mexico. However, it is noted that the center of negative SST anomalies in the TNA region in models is found to be further east than that in observations, and southwesterly anomalies are much weaker afterMAM.
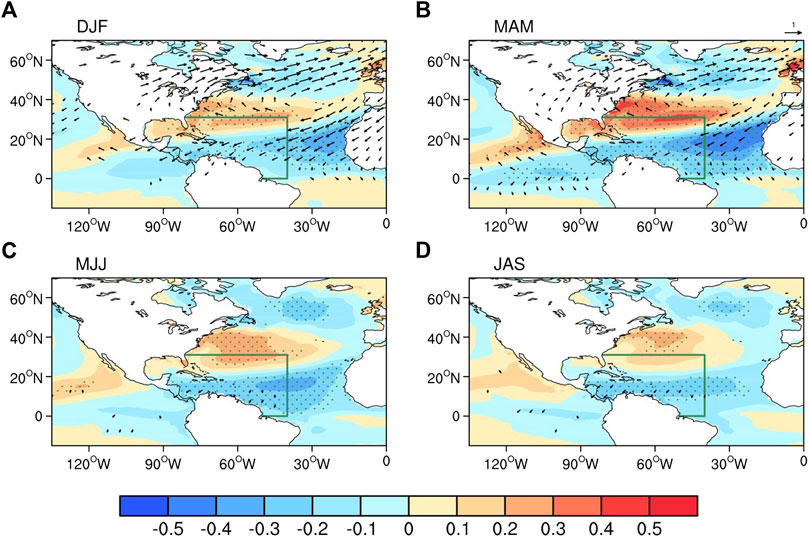
FIGURE 13. As in Figure 8 but for correlation maps of the 3-month averaged SST (shading, units: °C) and surface winds (vectors, units: m\s) anomalies with the NADI derived from the MME of 25 CMIP6 model simulations.
Numerous studies have yielded evidence of the importance of the AWP in modulating the climate system (Donders et al., 2011; Kim et al., 2020). For instance, the AWP may act as a source of moisture for precipitation in Central and North America (Donders et al., 2011). During the development and persistence of the large summer AWP, the North Atlantic brings record temperature rise to Florida (Drumond et al., 2011; Liu et al., 2015). Considering the close relationship between the NAD and the AWP, we speculate that the winter NAD may influence the North Atlantic region’s climate through its impact on the AWP in the following months.
To test this hypothesis, the correlations of DJFM-averaged NADI with precipitation, 700 hPa relative humidity, and surface air temperature anomalies in the following summer (the JJA season) have been calculated. As depicted in Figure 14A, the regions with significant negative precipitation anomalies associated with previous winter NAD cover the southern Gulf of Mexico, Caribbean Sea, and TNA during summer, consistent with recent studies (Zhou et al., 2019). The relative humidity field at 700 hPa exhibits zonal distribution characteristics (Figure 14B). Significant positive correlations are found in southwest North America, the Gulf of Mexico, and the southeastern Pacific Ocean. Meanwhile, significant negative correlations are found in the region between the north of the equator and south of 20°N.
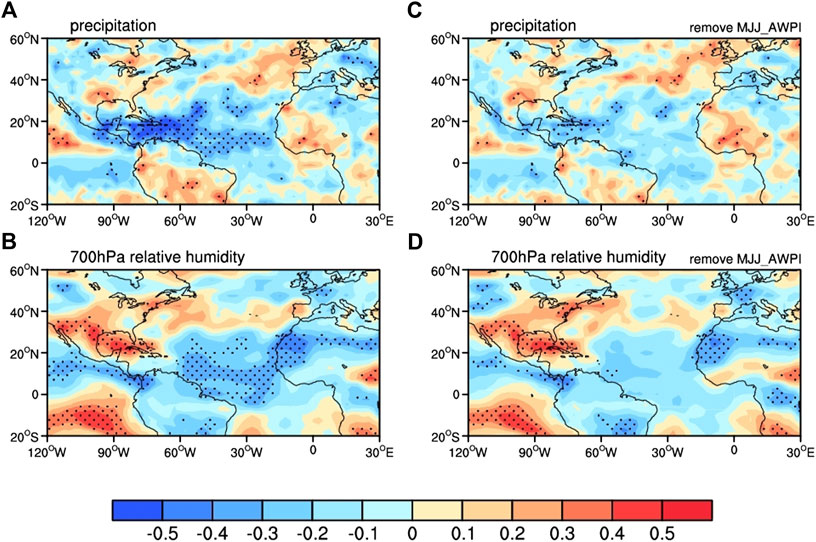
FIGURE 14. (A, B) Correlation map of the summer (the JJA season) precipitation (units: mm/d) and 700 hPa relative humidity anomalies with the DJFM-averaged NADI. (C, D) as in (A, B) but for the DJFM-averaged NADI linearly removing the following MJJ AWPI.
By linearly removing the following MJJ AWPI, the regions of significant negative precipitation anomalies associated with previous winter NAD are significantly smaller and restricted to within the Gulf of Mexico (Figure 14C). Similar results are observed for the relative humidity field (Figure 14D). Based on the above analysis, the NAD-like atmospheric signal in winter may be stored in the following AWP, thus significantly affecting the TNA precipitation in the following summer. Therefore, the AWP may act as a bridge connecting the winter NAD to the subsequent summer precipitation in the TNA region.
Given that the winter NAD has a major influence on the following summer precipitation over the western TNA (85°W–50°W, 10°–25°N) through its impact on the following AWP, the winter NAD and the following MJJ AWP can be exploited to forecast summer precipitation over this region. Therefore, a simple empirical prediction model was established to predict the summer [JJA (+1)] precipitation (referred to as the precipitation index, PI) over western TNA by using the DJFM (0) NADI and the MJJ (+1) AWPAI. The model is based on a linear regression method, and the DJFM (0) NADI and MJJ (+1) AWPAI are chosen as variables. The model is as follows:
where the parameters
To evaluate the prediction performance of this model, the fourfold cross-validation is conducted. Figure 15A shows correlations between the observed and hindcast JJA (+1) precipitation anomalies obtained from the empirical prediction model. There are significant positive correlations in the western TNA region. The correlations between the observed values and fourfold cross-validated hindcasts are slightly lower than those shown in Figure 15A. However, they remain statistically significant in key areas of the study. The time series of observed and cross-validated hindcasted JJA (+1) PI are displayed in Figure 15C. The high correlation (R=0.72) between the observations and the cross-validated hindcasts indicates the good practicability of our model. Thus, it is practical to utilize this model to predict the summer precipitation over the western TNA region.
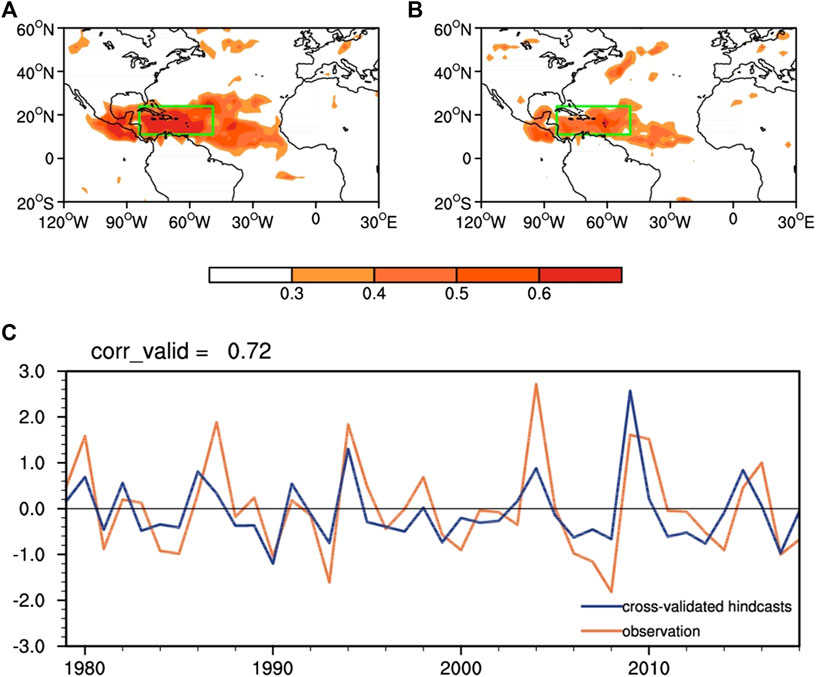
FIGURE 15. (A) Correlation between the observed and hindcast JJA (+1) precipitation anomalies obtained from the empirical prediction model. (B) Correlation between observations and fourfold cross-validated hindcasts of JJA (+1) precipitation anomalies. Only areas with correlations significant at the 90% level are shown. (C) Time series of observed and fourfold cross-validated hindcast JJA (+1) PI.
The focus of this study is to explore the link between the NAD and AWP. The maximum effects of winter NAD on the AWP are found to manifest in late spring or early summer (MJJ), as proved by significant correlations of the wintertime NAD index with the AWP indices (including the AWPAI and AWPDI). The strong positive (negative) phase of the winter NAD tends to inhibit (favor) the development of the AWP in its area and depth in the subsequent months. In contrast with the NAD, the previous winter NAO has weaker effect on the following size and depth of AWP, suggesting that AWP variability may be relatively more of a lagging response to NAD atmospheric forcing rather than a lagging response to NAO atmospheric forcing. A probable reason for this phenomenon is that the winter NAD may be more effective in inducing SST cooling over the TNA region during spring than the NAO.
Coupled model experiments confirm that the winter NAD can influence the subsequent AWP development. Significant negative correlations between the boreal winter NAD and following spring or early summer AWP variability can also be reproduced in most CMIP6 models. Furthermore, the MME of CMIP6 models confirms that the NAD-related TNA cooling lasts from the spring into the summer months of the following year.
Moreover, the winter NAD-like atmospheric signal may be stored in the following AWP, thus having a commanding influence on the TNA precipitation and in summer. It is hypothesized that the AWP may act as a bridge linking winter NAD to the following summer precipitation in the TNA region. It is deduced that DJFM NAD and MJJ AWP can be an effective forecaster of following summer precipitation over western TNA. However, further studies are needed to introduce more predictors of TNA summer precipitation.
The original contributions presented in the study are included in the article/supplementary material, further inquiries can be directed to the corresponding author.
All authors listed have made a substantial, direct, and intellectual contribution to the work and approved it for publication.
This work was jointly supported by the National Natural Science Foundation of China (grant number 42225501 and 41975070).
The authors declare that the research was conducted in the absence of any commercial or financial relationships that could be construed as a potential conflict of interest.
All claims expressed in this article are solely those of the authors and do not necessarily represent those of their affiliated organizations, or those of the publisher, the editors and the reviewers. Any product that may be evaluated in this article, or claim that may be made by its manufacturer, is not guaranteed or endorsed by the publisher.
Bretherton, C. S., Widmann, M., Dymnikov, V. P., Wallace, J. M., and Bladé, I. (1999). The effective number of spatial degrees of freedom of a time-varying field. J. Clim. 12 (7), 1990–2009. doi:10.1175/1520-0442(1999)012<1990:tenosd>2.0.co;2
Carton, J. A., and Giese, B. S. (2008). A reanalysis of ocean climate using Simple Ocean Data Assimilation (SODA). Mon. Wea. Rev. 136, 2999–3017. doi:10.1175/2007mwr1978.1
Covey, D. L., and Hastenrath, S. (1978). The pacific El nino phenomenon and the atlantic circulation. Mon. Weather Rev. 106 (9), 1280–1287. doi:10.1175/1520-0493(1978)106<1280:tpenpa>2.0.co;2
Curtis, S. (2013). Daily precipitation distributions over the intra-Americas sea and their interannual variability. Atmósfera 26 (2), 243–259. doi:10.1016/s0187-6236(13)71074-9
Curtis, S., and Hastenrath, S. (1995). Forcing of anomalous sea surface temperature evolution in the tropical Atlantic during Pacific warm events. J. Geophys. Res. Oceans 100 (C8), 15835–15847. doi:10.1029/95jc01502
Ding, R., Li, J., Tseng, Y. H., Sun, C., Li, Y., Xing, N., et al. (2019). Linking the North American dipole to the Pacific meridional mode. J. Geophys. Res. Atmos. 124 (6), 3020–3034. doi:10.1029/2018jd029692
Ding, R., Li, J., Tseng, Y. H., Sun, C., and Zheng, F. (2017). Linking a sea level pressure anomaly dipole over North America to the central Pacific El Niño. Clim. Dynam. 49 (4), 1321–1339. doi:10.1007/s00382-016-3389-8
Donders, T. H., de Boer, H. J., Finsinger, W., Grimm, E. C., Dekker, S. C., Reichart, G. J., et al. (2011). Impact of the atlantic warm pool on precipitation and temperature in Florida during North Atlantic cold spells. Clim. Dynam. 36 (1-2), 109–118. doi:10.1007/s00382-009-0702-9
Drumond, A., Nieto, R., and Gimeno, L. (2011). On the contribution of the tropical western hemisphere warm pool source of moisture to the northern hemisphere precipitation through a Lagrangian approach. J. Geophys. Res. Atmos. 116 (D21). doi:10.1029/2010jd015397
Durán-Quesada, A. M., Gimeno, L., Amador, J., and Nieto, R. (2010). Moisture sources for Central America: Identification of moisture sources using a Lagrangian analysis technique. J. Geophys. Res. Atmos. 115 (D5), D05103. doi:10.1029/2009jd012455
Enfield, D. B., and Lee, S. K. (2005). The heat balance of the Western Hemisphere warm pool. J. Clim. 18, 2662–2681. doi:10.1175/jcli3427.1
Enfield, D. B., Lee, S. K., and Wang, C. (2006). How are large Western hemisphere warm pools formed? Prog. Oceanogr. 70 (2-4), 346–365. doi:10.1016/j.pocean.2005.07.006
Enfield, D. B., and Mayer, D. A. (1997). Tropical atlantic sea surface temperature variability and its relation to El niño-southern oscillation. J. Geophys. Res. Oceans 102 (C1), 929–945. doi:10.1029/96jc03296
Enfield, D. B. (1996). Relationships of inter-American rainfall to tropical Atlantic and Pacific SST variability. Geophys. Res. Lett. 23 (23), 3305–3308. doi:10.1029/96gl03231
Eyring, V., Bony, S., Meehl, G. A., Senior, C. A., Stevens, B., Stouffer, R. J., et al. (2016). Overview of the coupled model Intercomparison project phase 6 (CMIP6) experimental design and organization. Geosci. Model Dev. 9 (5), 1937–1958. doi:10.5194/gmd-9-1937-2016
Giannini, A., Cane, M. A., and Kushnir, Y. (2001). Interdecadal changes in the ENSO teleconnection to the caribbean region and the North atlantic oscillation. J. Clim. 14 (13), 2867–2879. doi:10.1175/1520-0442(2001)014<2867:icitet>2.0.co;2
Giannini, A., Kushnir, Y., and Cane, M. A. (2000). Interannual variability of caribbean rainfall, ENSO, and the atlantic ocean. J. Clim. 13 (2), 297–311. doi:10.1175/1520-0442(2000)013<0297:ivocre>2.0.co;2
Kalnay, E., Kanamitsu, M., Kistler, R., Collins, W., Deaven, D., Gandin, L., et al. (1996). The NCEP/NCAR 40-year reanalysis project. Bull. Am. Meteorol. Soc. 77 (3), 437–471. doi:10.1175/1520-0477(1996)077<0437:tnyrp>2.0.co;2
Kim, D., Lee, S. K., Lopez, H., Foltz, G. R., Misra, V., and Kumar, A. (2020). On the role of Pacific-Atlantic SST contrast and associated Caribbean Sea convection in August–October U.S. regional rainfall variability. Geophys. Res. Lett. 47, e2020GL087736. doi:10.1029/2020gl087736
Lee, S. K., Enfield, D. B., and Wang, C. (2007). What drives seasonal onset and decay of the Western Hemisphere warm pool? J. Clim. 20, 2133–2146. doi:10.1175/jcli4113.1
Lee, S. K., Enfield, D. B., and Wang, C. (2008). Why do some El Ninos have no impact on tropical North Atlantic SST? Geophys. Res. Lett. 35, L16705. doi:10.1029/2008gl034734
Lee, S. K., Wang, C., and Enfield, D. B. (2010). On the impact of central Pacific warming events on Atlantic tropical storm activity. Geophys. Res. Lett. 37, L17702. doi:10.1029/2010gl044459
Li, J., and Wang, J. X. (2003). A new North Atlantic Oscillation index and its variability. Adv. Atmos. Sci. 20 (5), 661–676. doi:10.1007/bf02915394
Li, L., Lin, P., Yu, Y., Wang, B., Zhou, T., Liu, L., et al. (2003). The flexible Global Ocean-atmosphere-land system model, grid-point version 2: FGOALS-g2. Adv. Atmos. Sci. 30 (3), 543–560. doi:10.1007/s00376-012-2140-6
Liu, H., Wang, C., Lee, S. K., and Enfield, D. (2012). Atlantic warm pool variability in the IPCC AR4 CGCM simulations. J. Clim. 25 (16), 5612–5628. doi:10.1175/jcli-d-11-00376.1
Liu, H., Wang, C., Lee, S. K., and Enfield, D. (2015). Inhomogeneous influence of the Atlantic warm pool on United States precipitation. Atmos. Sci. Lett. 16 (1), 63–69. doi:10.1002/asl2.521
Misra, V., Groenen, D., Bhardwaj, A., and Mishra, A. (2016). The warm pool variability of the tropical northeast Pacific. Int. J. Climatol. 36 (14), 4625–4637. doi:10.1002/joc.4658
Misra, V., Stroman, A., and DiNapoli, S. (2013). The rendition of the atlantic warm pool in the reanalyses. Clim. Dynam. 41 (2), 517–532. doi:10.1007/s00382-012-1503-0
Mo, K. C., and Häkkinen, S. (2001). Interannual variability in the tropical Atlantic and linkages to the Pacific. J. Clim. 14 (12), 2740–2762. doi:10.1175/1520-0442(2001)014<2740:ivitta>2.0.co;2
Nobre, P., and Shukla, J. (1996). Variations of sea surface temperature, wind stress, and rainfall over the tropical Atlantic and South America. J. Clim. 9 (10), 2464–2479. doi:10.1175/1520-0442(1996)009<2464:vosstw>2.0.co;2
Rayner, N., Parker, D. E., Horton, E., Folland, C. K., Alexander, L. V., Rowell, D., et al. (2003). Global analyses of sea surface temperature, sea ice, and night marine air temperature since the late nineteenth century. J. Geophys. Res. Atmos. 108 (D14), 4407. doi:10.1029/2002jd002670
Taylor, K. E. (2001). Summarizing multiple aspects of model performance in a single diagram. J. Geophys. Res. Atmos. 106 (D7), 7183–7192. doi:10.1029/2000jd900719
Wang, C., and Enfield, D. B. (2003). A further study of the tropical Western Hemisphere warm pool. J. Clim. 16 (10), 1476–1493. doi:10.1175/1520-0442-16.10.1476
Wang, C., Enfield, D. B., Lee, S.-K., and Landsea, C. W. (2006). Influences of the Atlantic warm pool on Western Hemisphere summer rainfall and Atlantic hurricanes. J. Clim. 19 (12), 3011–3028. doi:10.1175/jcli3770.1
Wang, C., and Enfield, D. B. (2001). The tropical Western Hemisphere warm pool. Geophys. Res. Lett. 28 (8), 1635–1638. doi:10.1029/2000gl011763
Wang, C., and Lee, S.-K. (2007). Atlantic warm pool, Caribbean low-level jet, and their potential impact on Atlantic hurricanes. Geophys. Res. Lett. 34 (2), L02703. doi:10.1029/2006gl028579
Wang, C., Lee, S.-K., and Enfield, D. B. (2008a). Atlantic warm pool acting as a link between Atlantic multidecadal oscillation and Atlantic tropical cyclone activity. Geochem. Geophys. Geosystems 9 (5). doi:10.1029/2007gc001809
Wang, C., Lee, S.-K., and Enfield, D. B. (2008b). Climate response to anomalously large and small Atlantic warm pools during the summer. J. Clim. 21 (11), 2437–2450. doi:10.1175/2007jcli2029.1
Wang, C., and Lee, S.-K. (2008). Global warming and United States landfalling hurricanes. Geophys. Res. Lett. 35 (2), L02708. doi:10.1029/2007gl032396
Wang, C., Liu, H., Lee, S.-K., and Atlas, R. (2011). Impact of the Atlantic warm pool on United States landfalling hurricanes. Geophys. Res. Lett. 38 (19). doi:10.1029/2011gl049265
Xie, P., and Arkin, P. A. (1997). Global precipitation: A 17-year monthly analysis based on gauge observations, satellite estimates, and numerical model outputs. Bull. Am. Meteorol. Soc. 78 (11), 2539–2558. doi:10.1175/1520-0477(1997)078<2539:gpayma>2.0.co;2
Xie, S.-P., and Philander, S. G. H. (1994). A coupled ocean-atmosphere model of relevance to the ITCZ in the eastern Pacific. Tellus A 46 (4), 340–350. doi:10.3402/tellusa.v46i4.15484
Keywords: Atlantic warm pool, North American dipole, North Atlantic oscillation, air-sea interaction, climatology
Citation: Chao J, Fan G, Ding R, Zhong Q and Wen T (2023) Influence of the North American dipole on the Atlantic warm pool. Front. Earth Sci. 11:1117030. doi: 10.3389/feart.2023.1117030
Received: 06 December 2022; Accepted: 16 January 2023;
Published: 02 February 2023.
Edited by:
Jian Rao, Nanjing University of Information Science and Technology, ChinaReviewed by:
Leying Zhang, Nanjing Forestry University, ChinaCopyright © 2023 Chao, Fan, Ding, Zhong and Wen. This is an open-access article distributed under the terms of the Creative Commons Attribution License (CC BY). The use, distribution or reproduction in other forums is permitted, provided the original author(s) and the copyright owner(s) are credited and that the original publication in this journal is cited, in accordance with accepted academic practice. No use, distribution or reproduction is permitted which does not comply with these terms.
*Correspondence: Ruiqiang Ding, ZHJxQGJudS5lZHUuY24=
Disclaimer: All claims expressed in this article are solely those of the authors and do not necessarily represent those of their affiliated organizations, or those of the publisher, the editors and the reviewers. Any product that may be evaluated in this article or claim that may be made by its manufacturer is not guaranteed or endorsed by the publisher.
Research integrity at Frontiers
Learn more about the work of our research integrity team to safeguard the quality of each article we publish.