 Yuxi Huang1,2
 Gaojian Hu3*
- 1School of Mining, Liaoning Technical University, Fuxin, China
- 2School of Safety and Emergency Management Engineering, Taiyuan University of Technology, Taiyuan, China
- 3School of Civil Engineering, Shaoxing University, Shaoxing, China
The shear strength of a structural plane is a critical parameter in the analysis of engineering rock stability. Significant differences exist due to the various normal stresses in the structural plane. Therefore, evaluating the rock deformation to effectively determine the influence of normal stresses at different scales on the shear strength of structural planes is of great significance. This study discusses the effects of normal stress and structural plane size on shear strength through numerical simulations and regression analysis. The results showed that the shear strength of the structural plane increases linearly with increasing normal stress. The shear strength of the structural plane decreases with increasing size, and the corresponding curve is exponential. The characteristic size and shear strength increase linearly with increasing normal stress. This paper presents the concrete form of these relationships, which can be used to calculate and predict the shear strength, which has significance in guiding engineering.
1 Introduction
A structural plane is essential to rock mass and significantly affects rock mass stability. As shear strength is the critical parameter in the analysis of engineering rock stability, it is also a crucial parameter in the stability analysis of rock mass engineering.
Joints in rocks affect shear strength, including some sedimentary rocks, where they significantly affect shear strength. In addition, the normal stress of rock will cause different shear strengths of the structural plane (SSSP). Cheng (2019) investigated the effect of normal stress on the shear strength of coal bulk. Meng et al. (2022) analyzed the influence of particle size on shear behavior using PFC modeling. Xiao et al. (2021) developed four numerical models of various joint roughnesses using FLAC3D and examined the impact of joint roughness on shear mechanics. Zhou et al. (Zhou and Wang, 2016) (Zhou and Zhang, 2021) studied the effects of the specimen sizes and crack inclination angles on peak failure loads and evaluated the stress-induced damage progression in granite. The direct shear test was also used to study the influence of normal stress on shear strength. For example, Zhang et al. (2019) investigated the effects of initial normal stress bolt-grouting interface shear behavior using direct shear tests. Zhou et al. (2021a) assessed the strength characteristics of grouted joints of various thicknesses under different stress conditions by conducting shear tests on grouting rock samples. Niktabar et al. (2017) used a large direct shear testing machine to perform joint shear tests. Zhou et al. (2021b) discussed the development and contribution of experiments and numerical simulations in the compression-induced failure characteristics of flawed rock specimens. Accordingly, numerical simulations and on-site direct shear experiments were used to determine the effect of normal stress on the shear strength of the structural surface. Due to the size effect in rock, it is essential to determine the relationships of the size effect of the SSSP under normal stress. However, relatively few studies have reported on this topic.
Size effect exists in rocks, and SSSP is affected by rock size, such as in some joint-rich sedimentary rocks, in which the size changes affect the changes in the shear strength of rocks. Shao et al. (2018) investigated the intensity parameters of samples with different sizes. Islam et al. (2019) examined the effects of particle size on the shear strength of sand. Li (2020) analyzed the effect of maximum particle size on the SRM shear characteristics of the soil–rock mixture. Wang et al. (2018a) reported on the results of mechanical analysis and size effect. Li et al. (2018) explored the influence of crack size on the peak internal friction angle. Wang et al. studied the influence of flaw length (Wang et al., 2016) and flaw inclination angles (Wang et al., 2017) on crack propagation and proposed a novel 3D-conjugated bond-pair-based peridynamic model (Wang et al., 2018b). Collectively, these research findings demonstrated the presence of size effect in the SSSP. Therefore, the size effect of shear strength exists when normal stress is applied. Studying the size effect of SSSP and determining the relationship between SSSP and rock size under normal stress is of utmost importance. However, relatively few studies have addressed this topic.
The mineral composition and structure differ among various rocks. In addition, the solubility of different minerals varies. Therefore, different rock sizes are essential for rock weathering. Investigating the size effect of rocks is valuable for analyzing large blocks of terrain such as hills (Li et al., 2021). Scholars have examined the representative elementary volume (REV). Zertsalov et al. (2020) analyzed the deformation characteristics for different proportions of characteristic rock fragment sizes and their structural elements using numerical simulation. Ying et al. (2018) evaluated the REV of rock based on a statistical test. Zhang et al. (Zhang and Zhou, 2020a;Zhang and Zhou, 2020b) explored the fracture-related acoustic emission event rate characteristics at the unstable cracking phase in flawed rocks. Wu et al. (2014) studied the application effect of REV engineering based on the theory of equivalent continuous medium. Yang et al. (2017) reported that the characteristic shear strength size was not as sensitive as the permeability. Hu et al. (2022) determined the relationship between the number of joints and the SSSP. The aforementioned studies demonstrate the relatively limited research on the REV of the mechanical parameters of shear.
Therefore, the present study investigates the influence of i) normal stress and ii) size on the SSSP. These findings establish the relationship between i) SSSP and normal stress, ii) SSSP and size, iii) characteristic sizes of SSSP and normal stress, and (ⅳ) characteristic SSSP and normal stress.
2 Numerical simulations
The research was conducted from two perspectives: 1) the influence of normal stress on SSSP, comprising programs 1–5, with normal stress values of 1, 2, 3, 4, and 5 MPa; and 2) the impact of structural plane size on SSSP, comprising programs 6–10, with sizes of 100, 200, 300, 400, and 500 mm, respectively. Table 1 lists simulation programs.

TABLE 1. Normal stress and size combinations.
This established 25 numerical models. Figure 1 depicts the schematic diagram of the programs.
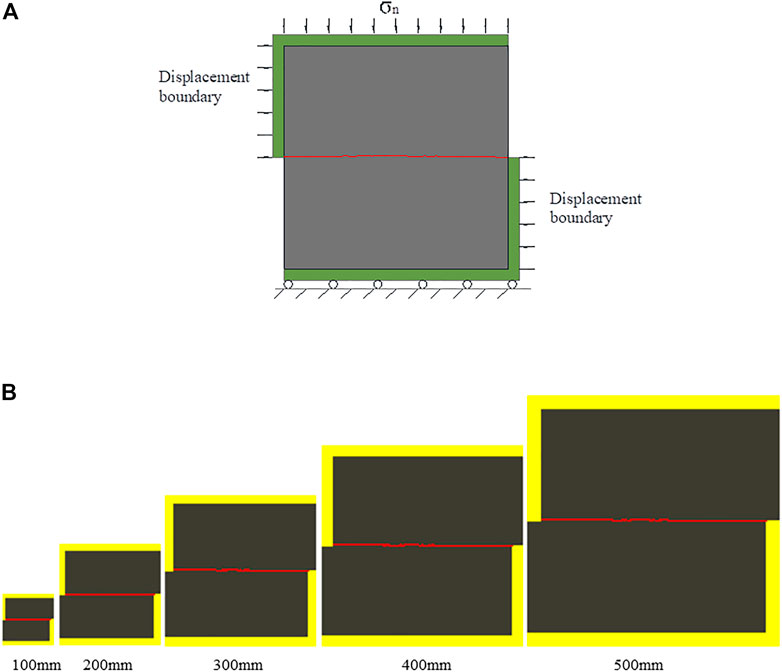
FIGURE 1. Rock models. (A) Mechanical model. (B) Size model.
This study investigated rocks with different normal stresses and penetrating joints. Therefore, various sizes and normal stresses of rock models were imported into RFPA software. The model was subjected to two side displacements, each of which was incremented by 0.01 mm. The model was divided into upper and bottom models. The upper model rate remained constant as it moved from left to right. However, the lower model remained stationary regardless of the movement of the upper model. The following parameters were set for the rocks and penetrating joints: a rock elastic modulus of 11,000 MPa, a Poisson ratio of 0.25, and a joint elastic modulus of 1.2 MPa. Regarding the strength parameters, the internal friction angle was 30°, as shown in Table 2.
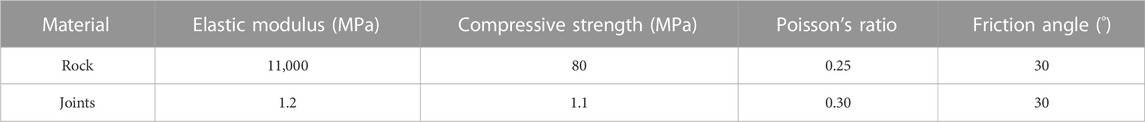
TABLE 2. Rock mechanical parameters.
3 Numerical simulation analysis
3.1 Influence of the normal stress on the SSSP
3.1.1 Stress–strain curve analysis
Stress–strain curves obtained from numerical simulations were drawn to analyze the influence of normal stress on SSSP, as shown in Figure 2.
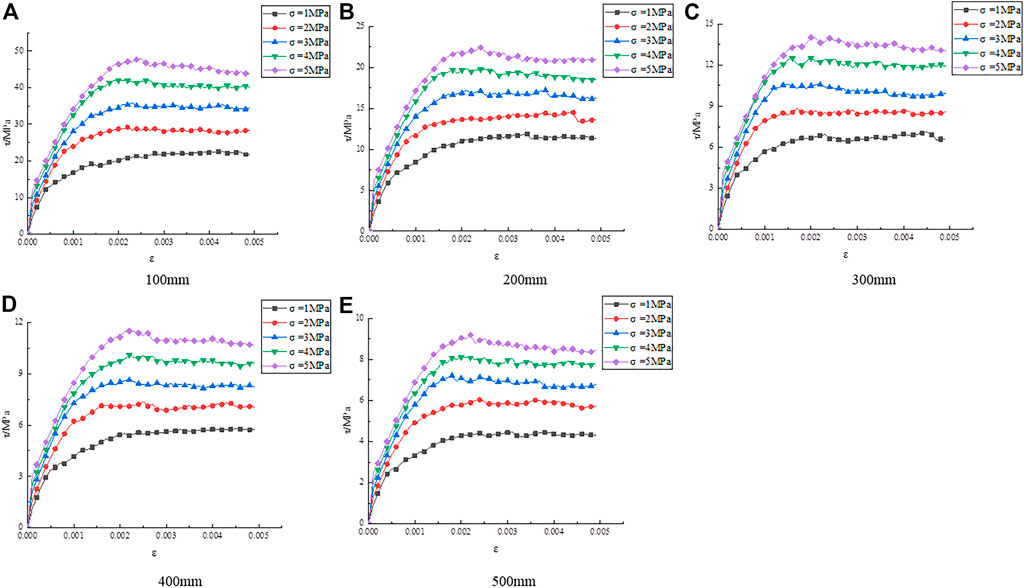
FIGURE 2. Stress–strain curves of different normal stresses.
Figure 2A through Figure 2E indicate that as normal stress increases, the curve contours and trends are similar and their development trends are comparable. Using the curve with a normal stress of 1 MPa in Figure 2A as an example, under the influence of different normal stresses on the structural surface, after the shear stress peaked, it gradually decreased and then stabilized as the horizontal shear displacement increased. The shear strength then no longer varied significantly, showing a nearly straight line.
The results of the analysis of the effect of normal stress on the SSSP are shown in Figure 2A. The relationship curves remained identical while the SSSP gradually increased when the normal stress increased from 1 to 5 MPa. Therefore, the shear strength was associated with the normal stress. Based on the curves in Figure 2, the SSSP was explored, as shown in Table 3.
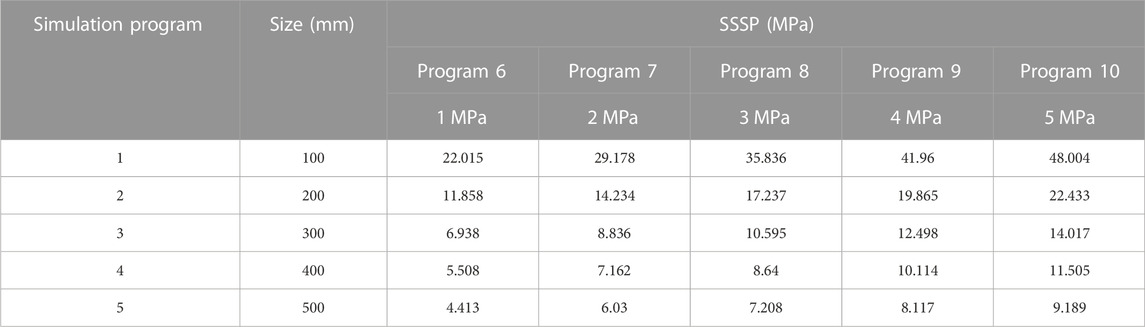
TABLE 3. Shear strengths.
3.1.2 Relationship between normal stress and shear strength
Figure 3 shows a scatter plot of the shear strength of the structural surface. Normal stress based on the data in Table 3 was drawn using OriginLab software. The appropriate fitting relationship was then selected and regressed.
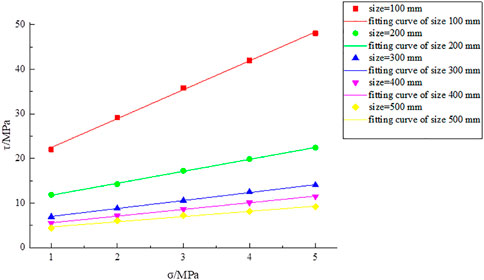
FIGURE 3. Fitting curves of SSSP.
Figure 3 also shows that when the normal stress was 1 MPa, the SSSP decreased from 22.015 to 4.413 MPa as the size varied between 100 and 500 mm, indicating that the shear strength was associated with the size. This regulation remained consistent even if the normal stress changes. As the normal stress increased from 1 to 5 MPa, the SSSP increased from 22.015 to 48.004 MPa at a size of 100 mm. Hence, the SSSP rose gradually as the normal stress increased. Therefore, the SSSP was affected by normal stress.
The preceding results showed that SSSP was related to normal stress. The expressions for the relationship between the two are listed in Table 4.
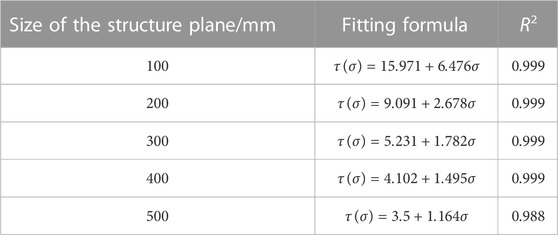
TABLE 4. Fitting relationships between SSSP and normal stress.
3.1.3 Relationship of shear strength and normal stress according to size change
From the results obtained in Table 4, which conform to the Coulomb criterion formula, the following relationship between SSSP and normal stress can be derived:
where σ is the normal stress, τ(σ) is the shear strength, c is the cohesion, and f is the friction angle coefficient.
Eq. 1 is the general formula for the relationship between the SSSP and normal stress considering the size effect, which applies to the rough undulating structural plane without filling. This formula contains parameters c and f related to rock size. Once the rock size is determined, the SSSP under various normal forces can be calculated using Eq. 1.
When the rock size changes, c and f can be determined based on the fitting formula in Table 4. The cohesion and friction angle coefficient are shown in Table 5 and are related to the size, as shown in Figure 4.
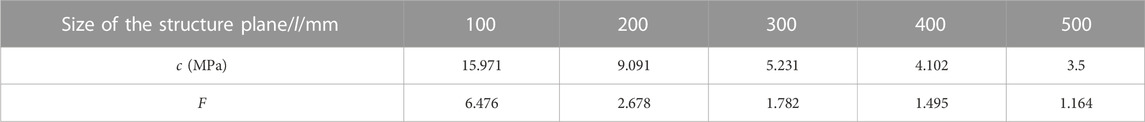
TABLE 5. Values of c and f.
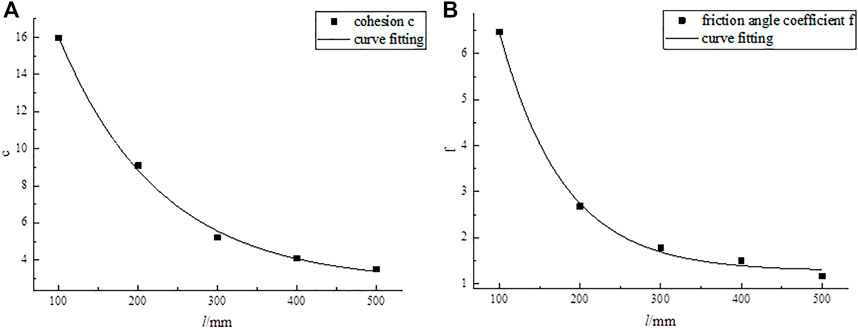
FIGURE 4. Fitting curves of the parameters. (A) Cohesion, c. (B) Friction angle coefficient, f.
The following relationship between the cohesion c and the friction angle coefficient f and size is derived from the curve in Figure 4:
The relationship between shear strength and normal stress can be obtained from Eq. 1 through Eq. 3 as follows:
where l is the size.
Eq. 4 is an engineering-relevant formula that can be used to calculate the corresponding SSSP when the normal stress changes. The corresponding SSSP value can be calculated using the normal stress and given size.
3.2 Size effect of SSSP
3.2.1 Stress–strain curve analysis
To analyze the influence of structural plane size on the SSSP, the stress–strain curves obtained from numerical simulation are depicted in Figure 5.
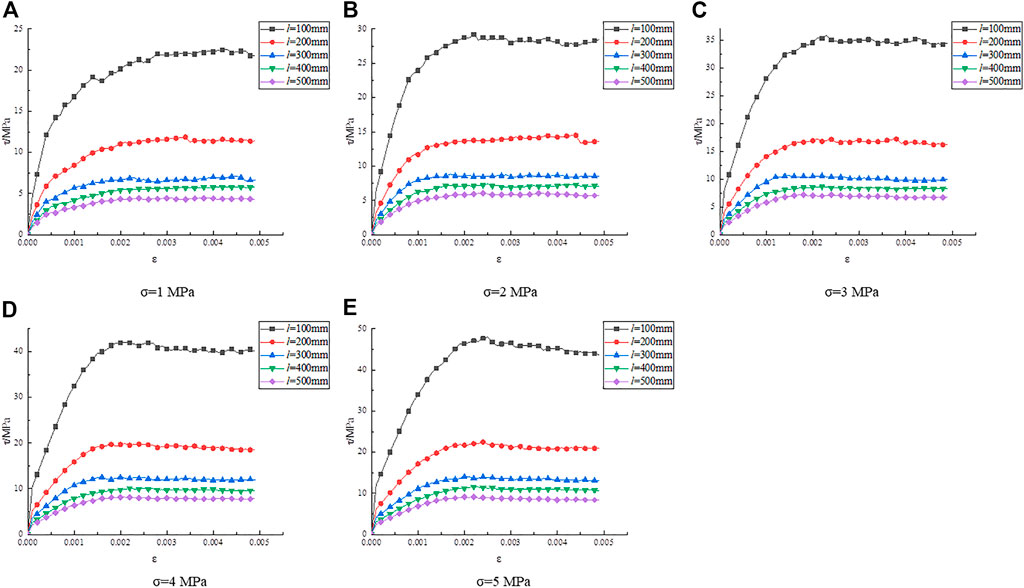
FIGURE 5. Stress–strain curves for different normal stress values.
Figure 5A through Figure 5E demonstrate the similar curve laws. A curve with a normal stress of 2 in Figure 5B was used to analyze the relationship between shear stress and shear displacement. Before reaching the peak shear strength, the shear stress initially increased as the shear displacement grew; afterward, the shear strength hardly changed, exhibiting a nearly straight-line state.
Figure 5B shows the results of the analysis of the impact of size on the SSSP. Similar relationships were observed between shear stress and shear displacement for sizes of 100, 200, 300, 400, and 500 mm, respectively. Figure 5B shows that at a normal stress of 1 MPa, the shear strength gradually decreased as the size increased from 100 to 500 mm. This demonstrated that the shear strength was affected by the size.
The shear strength is shown in Figure 5 and listed in Table 6.
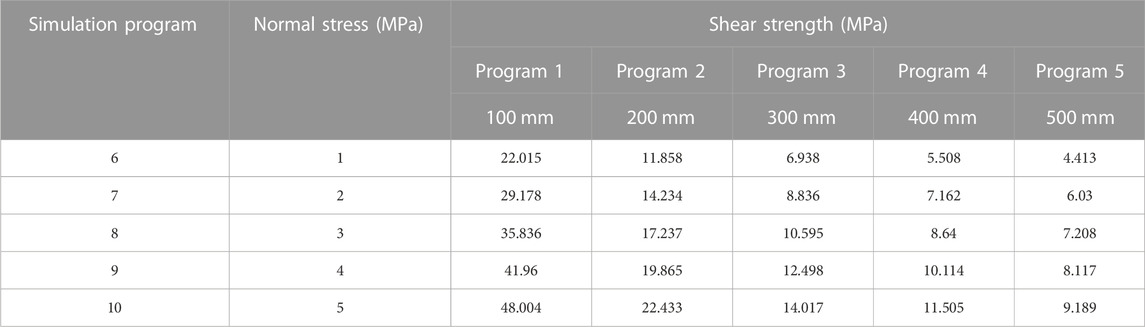
TABLE 6. Shear strengths.
3.2.2 Relationships between shear strength and size
The scatter plot of shear strength and size in Table 6 was drawn using OriginLab software. A suitable fitting relationship was selected, as shown in Figure 6.
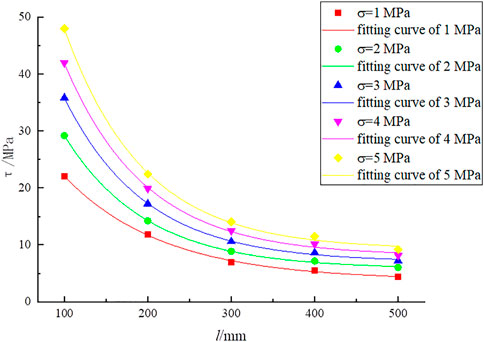
FIGURE 6. Fitting curves for shear strength.
Figure 6 shows that the SSSP decreased from 11.858 to 22.433 MPa as the normal stress rose from 1 to 5 MPa at a size of 200 mm, indicating that the SSSP is affected by the normal stress. When normal stress grows, SSSP improves. This regulation remains consistent even if the normal stress becomes different. The SSSP drops from 29.178 to 6.03 MPa as the size varies between 100 and 500 mm when the normal stress is 2 MPa. So the SSSP reduces gradually while size increases.
Figure 6 illustrates the relationship between the SSSP and size. Table 7 lists the expressions for the relationship between the two.
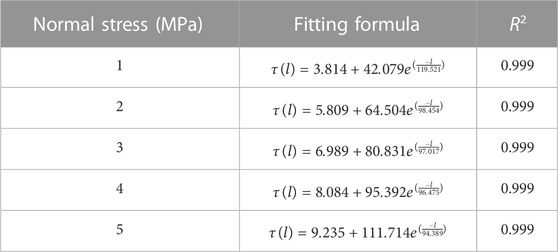
TABLE 7. Fitting model between SSSP and sizes.
3.2.3 Relationship between the SSSP and the size
From the results shown in Table 7, the relationship between SSSP and size can be obtained as follows:
where τ (l) is the SSSP; l is the size; and d, g, and h are parameters.
Table 8 displays parameters that can be extracted easily based on the results presented in Table 7. The fitting curves for parameters d, g, and h are well-fitted with normal stress, as shown in Figure 7.
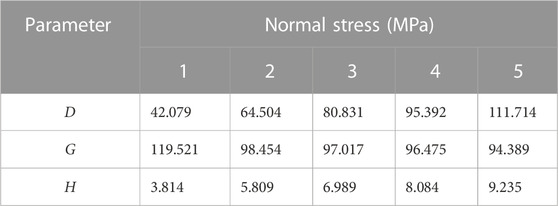
TABLE 8. Values of parameters d, g, and h.
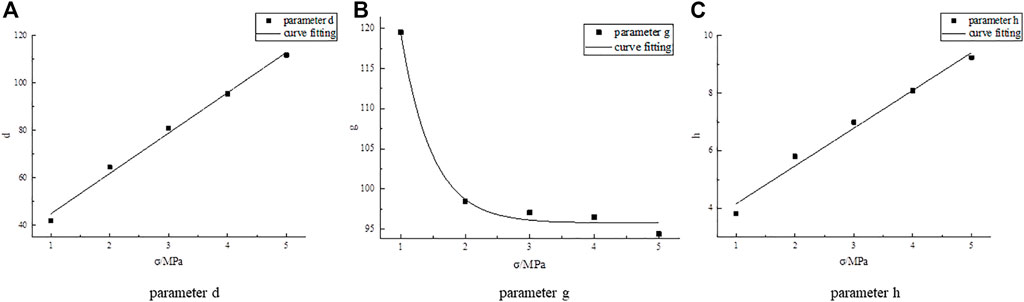
FIGURE 7. Fitting curve diagram of the parameters.
Based on the curve in Figure 7, the following relationship exists between each parameter and the normal stress:
The expression between SSSP and size be obtained by combining Eq. 5 through Eq. 8 as follows:
Eq. 9 is an engineering application formula that can be used to calculate the corresponding SSSP when the changes occur. When the normal stress for engineering sites is provided, the corresponding SSSP value can be determined based on the size.
3.3 Relationships of the CSSS, CSS, and normal stress
3.3.1 Derived formula for the CSSS of the structural plane
SSSP has a size effect. However, when the size reaches a specific critical value, the SSSP tends to remain constant. This critical size is the characteristic size of the shear strength (CSSS).
It is not easy to quantify the exact characteristic size. Liang et al. 2013) proposed one method to determine the characteristic size by calculating the derivative of Eq. 5. The CSSS is determined as follows:
where α is the acceptable absolute value of the slope.
3.3.2 Relationship between CSSS and normal stress
Eq. 12 can be regarded as the characteristic size, into which the fitting parameters are substituted to determine their values. Supposing that the CSSS can be obtained, Table 9 lists the relationships between the CSSS of the structural plane and the normal stress. The CSSS was solved when the normal stress increased from 1 to 5 MPa. The regression curve of the CSSS and normal stress is depicted in Figure 8.

TABLE 9. Relationships between CSSS and normal stress.
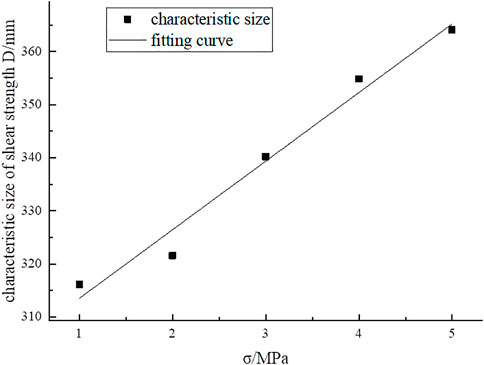
FIGURE 8. Fitting curve between the normal stress and characteristic size.
Figure 8 shows that as the normal stress increased, the CSSS increased gradually. The curve’s function is linear. Therefore, the following particular relationship is obtained:
where D(σ) is the CSSS and σ is the normal stress.
Eq. 13 is a formula with engineering application value, which can be used to calculate the corresponding CSSS when the normal stress changes. Given the normal stress, the corresponding CSSS can be calculated on the engineering site.
3.3.3 Relationship between CSS and normal stress
After substitution of the CSSS and normal stress values into Eq. 5, the characteristic shear strength (CSS) of the structural plane is solved and listed in Table 10. Based on the results obtained in Table 10, CSS and normal stress were regressed, as shown in Figure 9.

TABLE 10. Relationships between CSS and normal stress.
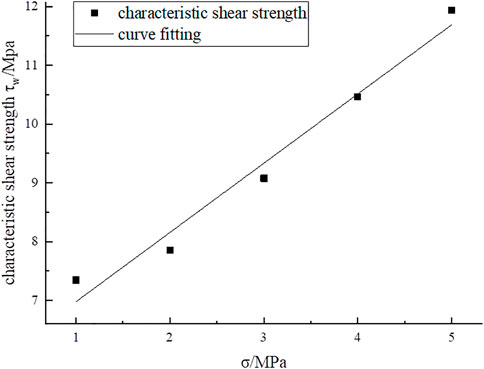
FIGURE 9. Fitting curve between CSS and normal stress.
Figure 9 indicates a linear relationship between the CSS and normal stress. As the normal stress improves, the CSS gradually increases. Consequently, the relationship is derived as follows:
where τw is the CSS.
Eq. 15 is a valuable engineering formula that can calculate the corresponding CSS when the normal stress varies. When the normal stress is provided, the CSS can be determined.
3.4 Experimental verification analysis
Experimental data from Chen et al. (2021) were used to verify and analyze the correctness of Eq. 1 and its applicability in engineering. Chen et al. (2021) also investigated the effect of various normal stresses on the SSSP for different sizes. As shown in Table 11, the normal stresses were 3, 4, 5, and 6 MPa, with sizes of 50 × 50 mm, 75 × 75 mm, 100 × 100 mm, 125 × 125 mm, and 150 × 150 mm.
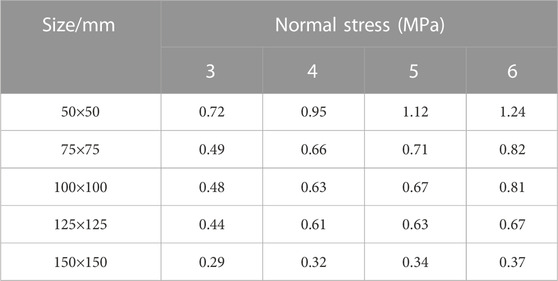
TABLE 11. SSSP (Chen et al., 2021).
The SSSP under different normal stresses was chosen for verification based on the data in Table 11 for the sizes 50 × 50 mm, 100 × 100 mm, and 150 × 150 mm. A scatter diagram of shear strength, normal stress, and their relationships, was plotted using OriginLab software, as shown in Figure 10A. Figure 10B shows a scatter diagram of the shear strength and size for the SSSP for normal stresses of 3 and 6 MPa.
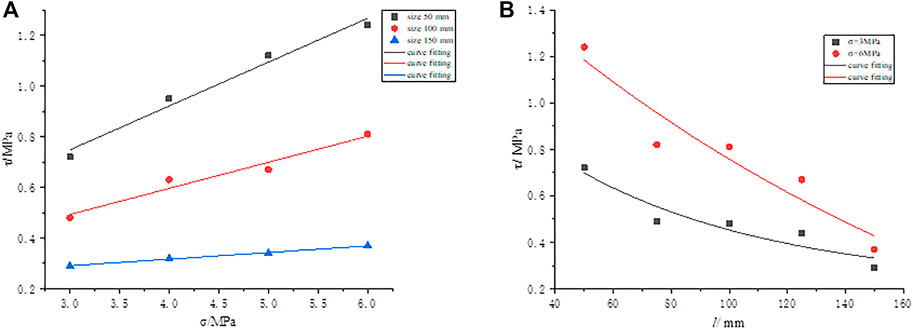
FIGURE 10. Fitting curves. (A) SSSP and normal stress. (B) SSSP and size.
Figure 10A demonstrates that the shear strength tended to rise as normal stress increased. Thus, the following relationship was obtained:
Gao (2020) (Page 28) addressed the changing trend of the shear strength of the structural plane in the normal stress range of 0.3–0.8 MPa by applying size effect analysis to different groups of test pieces. These relationships are shown in Table 12.
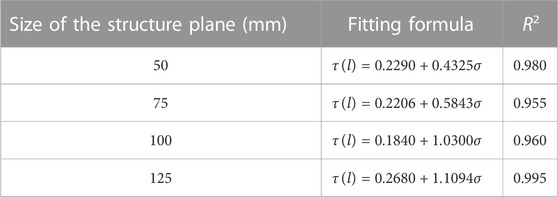
TABLE 12. Fitting model between shear strengths of structural planes and sizes (Gao, 2020).
The expressions in Eqs 15–17 and Table 12 are consistent with those proposed in Eq. 1. Hence, the findings of the numerical simulations and experimental results in the present study agree. The relationship expression proposed in Eq. 1 is suitable for calculating the SSSP when the normal stress changes.
Figure 10B demonstrates that the SSSP decreases gradually as the size increases. Consequently, the following relationship is established:
Comparing Eq. 18 and Eq. 19 obtained by verifying Eq. 5 shows that Eq. 16 corresponds to Eq. 5. Hence, the finding of the numerical simulations and experimental results in this study are consistent. The expressions proposed in Eq. 16 are suitable for calculating SSSP when the size changes.
4 Discussion
Under normal stress, SSSP exhibits a size effect. This study proposes a method to calculate the SSSP by combining numerical simulation and experimental verification. The conclusions are as follows:
1) The relationship between SSSP and normal stress is obtained by numerically simulating various normal stresses and analyzing the SSSP with normal stress. While previous studies have investigated the effect of normal stress on the SSSP using numerical simulations (Cheng, 2019) and field direct shear tests (Zhang et al., 2019), they did not consider the size. Eq. 4 quantifies and simplifies the solution of SSSP with normal stress and can calculate the corresponding SSSP when provided with the normal stresses.
2) The relationship between SSSP and size is derived utilizing the numerical simulation of different sizes by analyzing SSSP with size. While previous studies determined the regulation of the size impact of SSSP from the particle size (Islam et al., 2019) and cracks (Li et al., 2018), they did not consider normal stress. Eq. 9 quantifies the size effect of the SSSP and can compute the corresponding SSSP when provided with the sizes.
3) The relationship between CSSS, CSS, and normal stress is determined by analyzing the CSSS and CSS with normal stress change. While the REV of CSSS has been investigated (Hu et al., 2022), the exact CSSS formula for normal stress was not derived. Eqs 13 and 14 quantify and simplify the calculation of CSSS and CSS for rocks with normal stress. Hence, when the normal stress applied to the project is known, the CSSS and CSS can be computed.
5 Conclusion
This study investigated the impact of normal stress and size on the SSSP and analyzed the size effect of the SSSP for different sizes and normal stresses. The obtained formulas are as follows:
(1) The relationship between SSSP and normal stress is
The parameters c and f were determined, and the formula is
(2) The relationship between SSSP and size is
After calculating the parameters d, g, and h, the formula becomes
(3) The CSS is relevant to normal stress; thus, the simulation provides the following specific form:
(4) The CSSS is related to normal stress; thus, the simulation reveals the following specific form:
Data availability statement
The original contributions presented in the study are included in the article/Supplementary Material, Further inquiries can be directed to the corresponding author.
Author contributions
YH: data curation, investigation, methodology, and writing and preparing the original draft. GH: conceptualization, investigation, and funding acquisition.
Funding
This work was supported by a project from the Key Laboratory of Rock Mechanics and Geohazards of Zhejiang Province (ZGRMG-2019-07).
Conflict of interest
The authors declare that the research was conducted in the absence of any commercial or financial relationships that could be construed as a potential conflict of interest.
Publisher’s Note
All claims expressed in this article are solely those of the authors and do not necessarily represent those of their affiliated organizations, or those of the publisher, the editors and the reviewers. Any product that may be evaluated in this article, or claim that may be made by its manufacturer, is not guaranteed or endorsed by the publisher.
References
Chen, S., Gao, Z., Gu, Y., and Ji, C. (2021). Class of rock mass structural plane peak shear strength size effect analysis. J. Res. Dev. Min. 9 (4), 88–95.
Cheng, Q. (2019). Study on influence of shear rate and normal stress on shear strength of coal bulk. J. Saf. Sci. Technol. 15 (03), 81–85.
Gao, Z. (2020). Study on size effect of shear strength of rock like structural plane under low normal force. Inner Mongolia University of Science & Technology, Baotou, China.
Hu, G., Zhang, J., Liang, W., Huang, R., and Fu, W. (2022). The influence of the number of joints on the size effect of shear strength and characteristic strength. Math. Problems Eng. 2022, 1–14. doi:10.1155/2022/7669923
Islam, M. N., Siddika, A., Hossain, M. B., Rahman, A., Asad, M. A., et al. (2019). Effect of particle size on the shear strength behavior of sands, https://arxiv.org/ftp/arxiv/papers/1902/1902.09079.pdf.
Li, B. (2020). Study on shear properties of the soil-rock mixture. E3S Web Conf. 165 (7), 04079–4086. doi:10.1051/e3sconf/202016504079
Li, X., Qi, C., Shao, Z., and Qu, X. (2018). Static shear fracture influenced by historic stresses path and crack geometries in brittle solids. Theor. Appl. Fract. Mech. 96, 64–71. doi:10.1016/j.tafmec.2018.04.002
Li, X. S., Li, Q. H., Hu, Y. J., Teng, L., and Yang, S. (2021). Evolution characteristics of mining fissures in overlying strata of stope after converting from open-pit to underground. Arabian J. Geosciences 14 (24), 2795–2818. doi:10.1007/s12517-021-08978-0
Liang, Z. Z., Zhang, Y. B., Tang, S. B., Li, L. C., and Tang, C. N. (2013). Size effect of rock messes and associated representative element properties[J]. Chin. J. Rock Mech. Eng. 32 (06), 1157–1166.
Meng, F., Song, J., Yue, Z., Zhou, H., Wang, X., and Wang, Z. (2022). Failure mechanisms and damage evolution of hard rock joints under high stress: Insights from PFC2D modeling. Eng. Analysis Bound. Elem. 135, 394–411. doi:10.1016/j.enganabound.2021.12.007
Niktabar, S., Rao, K. S., and Shrivastava, A. K. (2017). Effect of rock joint roughness on its cyclic shear behavior. Chin. J. Rock Mech. Geotechnical Eng. Engl. 9 (6), 1071–1084. doi:10.1016/j.jrmge.2017.09.001
Shao, X. Q., Chi, S. C., and Tao, Y. (2018). Numerical simulation of size effect on shear strength and deformation behavior of rockfill materials. Chinese J. Geotechnical Eng 40 (10), 1766–1772.
Wang, P., Ren, F., and Cai, M. (2018a). Mechanical analysis and size effect of rough discrete fractures network model under direct shear tests based on particle flow code. J. China Coal Soc. 43 (4), 976–983.
Wang, Y., Zhou, X., and Shou, Y. (2017). The modeling of crack propagation and coalescence in rocks under uniaxial compression using the novel conjugated bond-based peridynamics. Int. J. Mech. Sci. 128-129, 614–643. doi:10.1016/j.ijmecsci.2017.05.019
Wang, Y., Zhou, X., Wang, Y., and Shou, Y. (2018b). A 3-D conjugated bond-pair-based peridynamic formulation for initiation and propagation of cracks in brittle solids. Int. J. Solids Struct. 134, 89–115. doi:10.1016/j.ijsolstr.2017.10.022
Wang, Y., Zhou, X., and Xu, X. (2016). Numerical simulation of propagation and coalescence of flaws in rock materials under compressive loads using the extended non-ordinary state-based peridynamics. Eng. Fract. Mech. 163, 248–273.
Wu, Q., Tang, H., Wang, L., Lei, G., and Fang, K. (2014). Three-dimensional distinct element simulation of size effect and spatial anisotropy of mechanical parameters of jointed rock mass. J. rock Mech. Eng. 33 (12), 2419–2432.
Xiao, S., Li, X., Zhou, Y., Dang, W., Wang, Y., and Li, D. (2021). Numerical investigations of joints with different surface roughness under shear and normal loads. IOP Conf. Ser. Earth Environ. Sci. 861 (03), 032025–032029. doi:10.1088/1755-1315/861/3/032025
Yang, T., Liu, H. Y., and Tang, C. A. (2017). Scale effect in macroscopic permeability of jointed rock mass using a coupled stress–damage–flow method. Eng. Geol. 228, 121–136. doi:10.1016/j.enggeo.2017.07.009
Ying, L., Wang, Q., Chen, J., Song, S., Zhan, J., Han, X., et al. (2018). Determination of geometrical REVs based on volumetric fracture intensity and statistical tests. Appl. Sci. 8 (5), 1–18.
Zertsalov, M., Vlasov, D., and Minin, K. (2020). To the problem of determining the deformation characteristics of jointed rock mass. IOP Conf. Ser. Mater. Sci. Eng. 869 (7), 072045–072048. doi:10.1088/1757-899x/869/7/072045
Zhang, C., Cui, G., Deng, L., Zhou, H., Lu, J., and Dai, F. (2019). Laboratory investigation on shear behaviors of bolt–grout interface subjected to constant normal stiffness. Rock Mech. Rock Eng. 53 (3), 1333–1347. doi:10.1007/s00603-019-01983-6
Zhang, J. Z., and Zhou, X. P. (2020). AE event rate characteristics of flawed granite: From damage stress to ultimate failure. Geophys. J. Int. 222 (2), 795–814. doi:10.1093/gji/ggaa207
Zhang, J. Z., and Zhou, X. P. (2020). Forecasting catastrophic rupture in brittle rocks using precursory AE time series. J. Geophys. Res. Solid Earth 125 (8), 1–20. doi:10.1029/2019jb019276
Zhou, D., Ding, W., Pan, Q., Liu, Z., and Zhang, Q. (2021). Experimental investigation on shear strength of grout infilled fractures with different thickness. IOP Conf. Ser. Earth Environ. Sci. 861 (7), 072113–072117. doi:10.1088/1755-1315/861/7/072113
Zhou, X., Zhang, J., Yang, S., and Berto, F. (2021). Compression-induced crack initiation and growth in flawed rocks: A review. Fatigue & Fract. Eng. Mater. Struct. 44 (7), 1681–1707. doi:10.1111/ffe.13477
Zhou, X. P., and Wang, Y. T. (2016). Numerical simulation of crack propagation and coalescence in pre-cracked rock-like Brazilian disks using the non-ordinary state-based peridynamics. Int. J. Rock Mech. Min. Sci. 89, 235–249. doi:10.1016/j.ijrmms.2016.09.010
Keywords: normal stress, characteristic shear strength, size effect, mathematical relationship, characteristic size
Citation: Huang Y and Hu G (2023) Influence of normal stress on the shear strength of the structural plane considering the size effect. Front. Earth Sci. 11:1116302. doi: 10.3389/feart.2023.1116302
Received: 05 December 2022; Accepted: 05 January 2023;
Published: 20 January 2023.
Edited by:
Xiaoping Zhou, Chongqing University, ChinaReviewed by:
Cao Rihong, Central South University, ChinaNan Xiao, Changsha University of Science and Technology, China
Copyright © 2023 Huang and Hu. This is an open-access article distributed under the terms of the Creative Commons Attribution License (CC BY). The use, distribution or reproduction in other forums is permitted, provided the original author(s) and the copyright owner(s) are credited and that the original publication in this journal is cited, in accordance with accepted academic practice. No use, distribution or reproduction is permitted which does not comply with these terms.
*Correspondence: Gaojian Hu, hugaojian8@163.com