 Hamza Amin1
 Beenish Jehan Khan1*
 Mahmood Ahmad2
 Ahmad Hakamy3
 Muhammad Ali Sikandar1
 Mohanad Muayad Sabri Sabri4
- 1Department of Civil Engineering, CECOS University of IT and Emerging Sciences, Peshawar, Pakistan
- 2Department of Civil Engineering, University of Engineering and Technology Peshawar (Bannu Campus), Bannu, Pakistan
- 3Department of Physics, Faculty of Applied Science, Umm Al-Qura University, Makkah, Saudi Arabia
- 4Peter the Great St. Petersburg Polytechnic University, St. Petersburg, Russia
The devastation caused by the illegal dumping and burning of tires has been staggering. In civil engineering, using tires engineering properties has become a major concern. For this investigation, the research used locally sourced tire chips and sand. Using tire chips sand as an alternative backfill material requires less pressure and has more improved properties than traditional backfill. Four specimens were utilized in this experiment: pure sand and sand mixtures containing 20%, 30%, and 40% tire chips, respectively. Both the Direct Shear and Triaxial Apparatus, two of the most important geotechnical tools, were used to compare and evaluate the shear properties of soil and sand tire chips. 50, 100, and 150 kPa Confining pressure and normal stress have been utilized to maintain a consistent stress level. Direct shear apparatus had a circular shape with an area of 16.62 cm2 and Triaxial shear apparatus had a height of 7.2 cm and a diameter of 3.2 cm. The stress-strain behavior of both apparatuses under ordinary loading and deviatoric stress was reported. The angles of internal friction (Φ′) and cohesion (c′) were measured for both equipment and specimens with and without tire chips, and the failure planes for direct shear and triaxial tests were reported. In both the direct and triaxial shear tests, 30% of the tire chips sand exhibit the best results, respectively. The addition of tire chips may significantly improve the toughness of the soil.
1 Introduction
Environmentally beneficial uses for discarded tires were first pioneered by Civil Engineering applications in the early 1990s. Scrap tire stocks have environmental repercussions in many nations (Ghazavi et al., 2011). Both legal and illegal tire disposal pose a huge threat to our environment. It is challenging for land reclamation efforts to find recyclable scrap tires since they tend to ascend to the top of landfills (Cabalar, 2011; Riahi et al., 2015). The rats and insects that thrive in discarded tires pose a health hazard. Tire chips are more dangerous, which are very combustible and may start a blaze at any moment (Ghazavi and Sakhi, 2005). A rise in the return rate of waste tires owing to the ban on recycling scrap tires in landfills in certain developing nations has occurred lately. Increases in vehicle traffic also mean a rise in the annual amount of garbage generated by used tires (Ghazavi and Sakhi, 2005). Despite their technological solid advantages, civil engineering only utilizes a small fraction of the waste tires created. Landfilled liners or covers; sub-grade fills and bottomed pads; retention walls and bridge abutments; leachate aggregate; asphalt additives for landfills; sound shield; bitumen-concrete combinations; and scrap tire pads are all examples of low-cost seismic foundation systems constructed from waste tires (STP) (Cabalar, 2011; Anvari et al., 2017).
Recycled tires have become a major environmental issue because of the explosive expansion of the automobile industry. If these pollutants are not properly disposed of, they may contaminate the atmosphere, start fires, and harm people’s health. In Stanislaus, California, in 1999, for example, millions of waste tires unexpectedly detonated (Zahran and Naggar, 2020). According to Cetin et al. (2006), tests on the use of tire chips-sand mixtures in civil engineering have just been completed. Tire chips and sand have many benefits over pure grit, including low bulk density; chemical and physical strength; high tensile; shear; and permeability; cheap cost of production (Anvari et al., 2017). It is common for highway embankments to be made of porous or compressible soil, and rubber sand mixtures have already been widely used as a lightweight filler to overcome friction and seismic dynamic impacts and energy dissipation, as stated by Anvari et al. (2017) (Cetin et al., 2006).
Rubber-sand mixes have been the subject of much research, which has yielded several significant discoveries and strongly supports their application in engineering. For direct shear experiments, most past studies used either dry or slightly moist rubber-sand combinations (Ghazavi, 2004). They really cannot agree on how much rubber and sand should weigh together. Rubber pellets or tire chips have increased the sand mixture’s shear strength. According to research, sand reduces rubber or tire chip shear strength (Hazarika et al., 2012). According to Gheni et al. (2018), the internal friction angle of the blends enhanced even though shear strength was unchanged by the 10%–20% granulated rubber combinations. Edeskär (2004) is considered to vary if the disparity between the internal friction angles changes Experiments using dry rubber and sediment mixtures indicated that when the volatility of waste tires grew, so did the volatility measure by direct shear (Foose et al., 1996).
As tire trash mounds have expanded, so has an interest in finding innovative methods to utilize or recycle tires. By combining tire waste with the Earth, it may be utilized as a fertilizer (Gheni et al., 2018). The paucity of natural resources and rising disposal prices have led to an increase in the amount of tire trash used in embankment construction. Because of the low unit weight, high strength, and wide availability of tire trash, embankment structures on weak compressible soils are using it as a lightweight fill (Edinçliler et al., 2010).
Particle form, particle size distribution, surface features, and mineralogy influence the stress-strain response to sand at varying strain levels. Extrinsic variables correspond to the composition and general character of the sand particles themselves (Fox et al., 2018). Every year, millions of worn tires accumulate due to population growth and an increase in the number of cars on the road. This issue necessitates a solution (Arulrajah et al., 2014). Due to the danger of fire and the expensive expense of sanitary disposal, storing worn tires is particularly unwanted. Because tires have a lengthy lifespan and are not biodegradable, avoiding them is challenging. It is possible to deal with unwanted tires in conventional ways like unlawful dumping or landfilling or storing them, but these approaches are just short-term solutions. In order to avoid storing an enormous volume of old tires globally, recycling used tires is a vital duty (Tabrizi et al., 2019).
Waste tire shreds and tire chips have been studied extensively for their effect on soil engineering parameters such shear strength, permeability, compressibility, compaction properties, and the poison’s ratio and modulus of elasticity in a variety of soil types (Rezazadeh Eidgahee et al., 2019). They say tire chips may be used as a lightweight backfill for retaining walls and embankments. There are others who think that the aforementioned factors have an enormous impact on the serviceability of structures under normal and dynamic loads, and that the high damping behavior of rubber may minimize vibrations in structures (Edinçliler et al., 2004). Triaxial testing was used by Ahmed and Lovell (1992) to evaluate the characteristics of sand-tire chips. As far as shear resistance factors are concerned, there is a significant influence on both tire chip % and confining pressure, according to his findings. Rao and Dutta (2006) examined sand’s shear strength characteristics using rectangular tire chips. They proposed that the highest shear strength of the sand-tire chips combination may be achieved if the length/width ratio of the tire chips is 2% and 20% tire chips are utilized by weight (Ghaaowd et al., 2017).
The leaching tests show that tire shreds leach small amounts of elements and compounds. Some of these compounds and elements are potentially hazardous to the environment, such as PAH-compounds, phenols and zinc. The monitoring data from the field tests show that zinc is the only element and compound that has the potential to reach ecological effect concentrations in recipients. In order to prevent the accumulation of released elements and compounds, the use of tire shreds is recommended to be limited above the groundwater table. Tire shreds have been used in civil engineering construction works for at least 20 years. During this period of time, no other environmental effects than the release of iron, manganese, zinc and minor release of organic compounds such as phenol and PAH compounds by leaching has been observed. This low release is due to the vulcanization process of the rubber material which-effectively binds the organic compounds and retards the release effectively. The low releasing velocity enables biological and chemical degradation to neutralize the ecological effect. Tire shred leachate is neutral to slightly alkali pH which contributes to stabilize metals, e.g., iron hydroxides, and reduces the metal release to a minimum.
In road constructions, the material is useful as lightweight embankment fill, frost insulation layer and drainage layer. The disadvantage of the material is the high compressibility. To compensate for the compressibility a thick superstructure is needed. Reinforcement, such as steel net, can reduce road surface deflections. In landfill design, tire shred material is well aimed as drainage material. In the final covers, the combination of the high drainage capability, low density and thermal insulation gives lighter covers. It will protect the liner from frost penetration and will reduce settlements. The high permeability, even at high load, and chemical resistance to municipal leachate make tire shreds suitable as bottom drainage material. In sports tracks, the elastic and stiffness properties are useful. Tire shreds have been successfully used in horse racetracks. The high elasticity and low stiffness are here utilized.
Researchers have focused on the dynamic characteristics of rubber-sand mixtures in the last several years. Furthermore, the study’s findings might be contested by other researchers. Rubber chips or particles have been demonstrated to increase sand liquefaction resistance in certain experiments, whereas the contrary has also been shown in others. Experiments by Perez et al. (2016) found that adding 10% tire chips to sand did not affect liquefaction resistance (Noorzad and Raveshi, 2017). Test results are inconclusive, according to the researchers. The liquefaction resistance of sand is significantly reduced when 30%–40% tire chips are added. At a rate of 10%–30%, tire chips may greatly increase the liquefaction resistance of a sand mixture. Senin (2017) performed extensive torsional experiments to investigate tire chip combinations. According to the results, tire chips may be put to the sand at 10%–25% to avoid liquefaction. Using direct shear and a triaxial apparatus, the shear strength of a sand mixture that contains tire chips will be studied.
A sand-tire chips combination reinforced with tire chips has an increased shear box () than unreinforced sand, according to Marto (2013). A 20% weight increase in rubber chips is recommended to increase the sand’s shear strength. There are a number of factors that affect the shear-resistance of sand and tire chips in combination, according to their research. Annadurai and Manoharan, Ravichandran (Manoharan, 2019) found that tire chips decreased the soil’s MDD in the standard Proctor test when their percentage was increased. Because the chips are so light, they might be to fault (Rezazadeh Eidgahee et al., 2019). The impact of tire chips on the shear strength properties of dune sand was studied by Yadav and Tiwari (2017) using a shear box test. In accordance with the weight of the sand, they used different quantities of tire chips at various points in the process. They determined that dune sand can be improved by adding tire parts (rd.) are linked by Anvari and others in their study of the sand-tire chips combination (El Naggar and Zahran, 2021). When tire chips content rose at high relative densities, a decrease in was observed. When tire chips content increases, it rises because of its low relative density. Grinded rubber was found to be the appropriate proportion at 5% (El Naggar and Zahran, 2021). Triaxial studies were carried out to assess the effect of tire chips content on and material stiffness, according to Feng et al. (2020). The results of the studies show that adding bigger tire shards to a mixture may increase the stiffness of a material. Researchers observed that as tire chips concentration increased to 20%, the cohesiveness intercept decreased and that at this density, tire chips combined with sand had better distortion and shear strength properties, as reported by Rouhanifar et al. (2021) in their work published in 2020. The shear strength of loose or thick dry soil has previously been studied about tire chips. However, soil often holds water, suggesting that it has not dried up entirely in most cases (Rouhanifar et al., 2021). It will be interesting to see how the shear strength properties of tire chips/sand mixes are affected by direct shear and triaxial equipment. Moreover, the study aims to determine the shear strength characteristics of the tire chips sand combination using direct shear methods and triaxial equipment (Vinod et al., 2015; Noorzad and Raveshi, 2017).
Sand-tire chip (STC) mixtures are examined in this article for their optimal void ratio and shear strength, as per Bali Reddy. Sand and tire chips of various sizes, readily accessible in the area, are used at a more modest scale (Akbarimehr et al., 2020). Tire chips (TC) comprise between 10% and 70% of soil-to-tire chip (STC) combinations, as well as sand with no TC and pure tire chips, are evaluated (100 percent TC). A variety of materials were tested for their specific gravity, mass, and shear strength. According to experimental data, the ideal percentages for tire chips of the required size are 30%–40% by volume or 50%–60% by weight. In geoengineering, the ideal ratio of STC mixes yields a lightweight material with a 20 percent reduction in unit weight, as well as increased strength and compressibility (Rezazadeh Eidgahee et al., 2019). In structural engineering, also including geotechnical systems, rubber shreds may be employed in a cost-effective and ecologically beneficial method to expedite the waste tire processing step. On the other hand, engineering systems need knowledge about rubber grain strength characteristics, which may be gained by testing (Araujo et al., 2021). To assess the shear intensity characteristics within five rubber grain groups that ranged in gradation and size, this study performed tiny and broad direct shear tests. Based on these findings, we’ve been able to construct artificial neural networks and custom networks that better depict shear stress vs. rubber strain in real life. A prediction model for shear energy and horizontal stress based on the multimodal algorithm is also included in the configuration of the Community data management system (Edincliler, 2007). A correlation coefficient (R) and the current mean square error were used to evaluate the output and accuracy of the suggested models (MSE). The ANN and GMDH models have R-values of 0.9977 or 0.9994, respectively, for ANN models and 0.9862 or 0.9990 for GMDH models. Mathematical formulae for implementing the GMDH models are considered relatively easy (El Naggar and Iranikhah, 2021).
In this case, Tatlisoz et al. (1997) Waste pipes explored by Tatlisoz may be employed in land work projects like road retaining embankments or backfills by mixing these into structural filling systems. Tire or soil-tire chips must have the right mechanical and physical qualities for various purposes. This study aimed to determine the mechanical characteristics of fine and ground-grained soils and waste tire chips. The investigation was carried out with the use of large-scale laboratory measurement equipment (Tanchaisawat et al., 2010). Deformation, shear force, and compressibility were all taken into consideration during testing. Sand, sandy silt, and clay backfill soils were tested. To a larger extent than soil, tire chips and soil-tire chip combinations act like soils, although they are more compressible and need more strain to attain their maximum shear force. Backfilling with tire chips will result in a less unit weight and a higher shear intensity (Tanchaisawat et al., 2010). As with clay, the combined power of tire chips and clay equals, if not exceeds, that of clay. The strength envelopes for sand-tire mixes could be non-linear, with little or no intercept for cohesiveness. Sandy salty chip combinations are comparable to sand tire chip mixes in many respects due to the sheer cohesiveness intercept in the shear intensity envelope (Gong et al., 2019). There is no difference in long-term compression behavior between sand-tire chips and sandy silt-tire chips. To test the shear strength of shredded rubber pneumatics, this research enlarges the pneumatics. The smooth, homogeneous sand was equally distributed and crushed at an angle of 2° of compaction. It was decided to make waste tire shreds with varied breadths: 2, 3, and 4 cm. Mixture included a 15%, 30%, and 50% shreds content by volume ratio. Two possible combinations of shear intensities were explored utilizing sand-shrinking samples weighing between 15.5 and 16.8 kN/m3 (Gong et al., 2019). The shear compressive strength of sand-shaken compressed mixes is affected by several variables, including the standard tension, sand weight, shred material, shred thickness, and tire shred aspect ratio. By modifying the aspect ratio, the starting friction angle (1 in degrees) is 1–67, with 113.5% of the desired shred width and compaction effort. In each experiment, increasing the friction angle by 25% resulted from altering the mixture’s aspect ratio (Bałachowski and Gotteland, 2007). The average sample value was 37.5% for more compact samples and 17.2 percent for less compact samples of all widths and aspect ratios. Tire rectangular shreds must have at least a specified width to enhance sand’s total friction angle. This is the article’s most significant contribution (Banzibaganye et al., 2019).
El Naggar and Zahran (2021) Recycled tires have become an increasingly prevalent issue in the United States and around the globe after academics studied their environmental impact. Reverse filling in engineering uses tire-related aggregates because of this (TDA). Before it can be used in construction, TDA’s strength and stiffness must first be tested (Chenari et al., 2017). By studying backfill, researchers found that its particle size may influence its stiffness and strength. This study examined the effects of particle size on the results of five TDA samples varying in particle size from 19.05 to 25.4, 38.1 to 50.8, and 76.2 mm. When paired with draining, pressures of 50, 100, and 200 kPa were employed in the testing. The TDA shear power rose whenever the maximum particle size was raised, but the cohesiveness remained the same. The particle’s elastic modulus grew in proportion to its size (Banzibaganye et al., 2019).
Yang et al. (2002) The use of scrap tires in structural engineering applications to recycle this hazardous waste is gaining popularity. This knowledge is necessary for designing waste tire buildings, but it is not sufficient on its own. Tire chips were subjected to limited compression, direct shear, and triaxial testing to determine their mechanical properties (Edincliler et al., 2012). Triaxial investigations were used to assess natural stress, direct shear power, and confining pressure or initial tangent modulus, which allowed for the development of analytical correlations between these variables. For stress levels of zero to 90 kPa, molecular weight does not affect shear strength, and the resistance envelope is a power property. Confining pressure influences the initial tangent modulus through a quadratic equation; however, the lateral strain ratio is irrespective of the confining pressure.
Neaz Sheikh et al. (2013) Scrap tire recycling is a major environmental issue in many places because of the massive rise in automobiles. Since scrap tire recycling or reusing has become a waste management strategy, researchers have made a lot of effort. Before tire sand doughnut (S-TC) mixes can be employed in civil engineering projects, their shear and squeezing qualities must be understood. When tire crumbs were employed, the S-TC combinations had less shear intensity than when tire chips or shreds were used. The maximum attainable deviator tension resulted from a considerable increase in axial strain. There is some evidence that the brittleness of mixes may be connected to their ductility. In the first unloading stage, plastic strain is decreased, and consolidation is reduced, both of which may be done by preloading (Tiwari and Mathur, 2016).
Weaver and Reddy (2015) examined 5 densities of 60, 102, 305 mm-long shear boxes, each with a different density. None of the five sands had a friction angle that matched the sample size. Different densities of shear boxes were determined to get the same friction angle in the Ottawa sand. According to the authors, Ottawa sand has the most significant box length to particle diameter ratio. L/D 50 may be used in direct shear testing, as per Jewell and Wroth (2013). Shear box boundaries had little effect on strength-deformation components during testing with L/D 50 to 50 because it had enough particles to allow local disruption and discontinuity to emerge (Hosseininia, 2017).
Chyan et al. (2013) conducted direct shear testing on Toyoura sand using square shear boxes of four different sizes. With equivalent densities, friction angles are similar in both large and medium direct shear boxes. In the smaller shear boxes, friction angles 28–38 times bigger led to a rise in mechanical boundary retention. As the size of the shear box grows, it is probable that a considerable number of shear bands might be shear zones, as stated by Shu and Huang (2014).
To analyze the hydraulic characteristics of fault rock in the 1-D radial three-phase seepage field, the seepage process of the three-phase flow is simplified into a cone seepage model The seepage zone is filled with broken rocks with different particle sizes. The radius of its upper boundary is denoted as r A, and that of the lower boundary is marked as rB. Under the effect of pore pressure difference (pA in the upper boundary, pB in the lower boundary, and pA > pB), the water–silt fluid flows radially from top to bottom. First, the model consists of the mass conservation equation, continuity equation, erosion constitutive equation, and momentum conservation equation. The effects of 1-D radial flow characteristics and particle erosion on the three-phase flow are considered in the proposed model. Second, the model is verified. A laboratory test, and the errors between numerical results and testing results are analyzed. Finally, the temporal–spatial distribution law of the 1-D radial three-phase seepage field is obtained. According to the comparison between laboratory test results and numerical results considering silt flow, for the fitting of the temporal evolution of the sample porosity during seepage, the accuracy of the proposed model decreases first and then increases and decreases again after 1,400 s. For the fitting of the distribution of porosity after seepage, the closer distance the fluid outlet, the higher the model accuracy. For fitting the evolution of the volume discharge rate in the fluid inlet, the model accuracy is high, around 200 and 1,600 s. The MAPEϕ, APEϕ, and MAPEq of the model are within 6%, indicating high precision of the three-phase flow model. In the three-phase seepage process, because of the growth of porosity, the silt concentration declines at the initial stage of seepage. It rises again with the supplement of silt from the upper boundary. Due to the non-uniform distribution of volume flow in 1-D radial flow, the non-uniform final spatial distribution of porosity and permeability is generated. In addition, pore pressure presents a non-linear spatial distribution due to the resistance of water to silt and fluidized rock grains Ma et al. (2022a).
When fault fracture zones are encountered in the mining tunnel excavation, the water-conducting pathway is easily formed by the granular structure of the broken surrounding rock, probably resulting in water inflow hazards. Therefore, the configuration and hydrological characteristics of existing faults are key factors for safe mining tunnel construction. In this paper, one-dimensional (1D) radial seepage experiments were carried out under variable grain size distribution (GSD) and water pressure (WP). Hydraulic properties were investigated, including porosity and permeability under the 1D radial grain migration. Experimental results show that the permeability and porosity increase with time, and the occurrence process of water inflow can divide into four stages, including rapid increase, decelerated increase, slow climbing, and stable period. After the seepage experiment, the porosity of the sample increases gradually from top to bottom and reaches the maximum at the lowermost part (outlet), indicating that the spatial distribution of the porosity exhibits a non-uniform property. Through comparisons of grain migration under different conditions, it is concluded that, with the decrease of GSD and the increase of WP, more severe fine grain migration can be occurred, leading to great changes in hydraulic properties. In addition, three prediction models were verified by the testing results, and Carman-Kozoeny model shows the highest accuracy. In the same predictive model, if a sample has a smaller grain migration capacity, then there is a higher prediction accuracy of the sample. By means of Carman-Kozoeny model, it is predicted that there is a higher final permeability in the position closer to the water outlet. Based on the research results, a series of strategies were proposed to prevent and control water inflow in fault rocks (Ma et al., 2022b).
Researchers have modified the classical fluid–structure coupling test device differently, and conducted sufficient studies on the stress-seepage characteristics of intact rocks, similar materials and broken rock masses. Various influencing factors of water inrush are analyzed and different evaluation methods of water inrush are put forward. A series of field tests have provided relevant parameters of seepage-stress characteristics and verification methods for laboratory tests and numerical simulation, providing an important reference for the prevention and control of water inrush. Studies on the flow regime transformation in the fractured rocks and broken rocks media have been extensively performed in recent years. However, limited by the test conditions, most studies only focus on the non-Darcy flow (transition flow) to obtain the precursory law of water inrush disasters. To ensure the stability and reliability of the results, most of the studies rely on self-designed systems. These studies consider the influence of medium properties (particle size, lithology, fracture morphology, etc.) and external conditions (stress state and water pressure, etc.), providing valuable experimental support for the study of flow regime transformation mechanisms in the process of water inrush. According to theoretical analysis and numerical simulation, the above research mainly expounds on the change of fluid characteristics and permeability and strength of water inrush media caused by rock erosion in the process of water inrush. Based on the force state of the particles, researchers considered various particle instability states, such as sliding and rolling, and studied the starting characteristics of solid particles from a numerical perspective. Considering the influence of rock erosion on the porosity of rock mass, a series of porosity–permeability relations are proposed. Then the evolution law of hydraulic characteristics in different media under different flow regimes is simulated. Based on the research results of erosion in soil mechanics, researchers established a model to describe the relation between rock mass damage and strain and rock erosion. The loss of fine particles caused a sudden change in the distribution of the internal stress field in the rock mass, which is considered the main cause of water inrush and rock mass instability (Ma et al., 2022c).
Research on the effects of shredding on soil properties might lead to new or further uses. Using a sand-tire shredded embankment, researchers found it performed effectively even under heavy loads. According to the researchers, a 1 m soil layer on top of sand–shred mixtures could prevent long-term settling. This cover’s purpose is to keep tire shreds against burning and to limit the amount of settling.
1.1 Significance of the research
It is a one-of-a-kind substance that can be compressed and molded. Several times, the mechanical properties of tire chip sand mixtures are more reliant on their content than their form. Using shear strength, engineers may design metrics and materials that can be utilized to manufacture or produce pieces (Noorzad and Raveshi, 2017). Materials are judged by how much they bend, break, or deform under their weight. To put it another way, the shear strength of a material tells us how long it can endure a shearing force before collapsing. Cuts or sliding failures are shown by the cuts concerning the force exerted on the aircraft. Manufacturing, vehicles, airplanes, and other technological fields may benefit from high shear strength materials (Edinçliler et al., 2004).
2 Materials and methods
2.1 Materials
2.1.1 Sand
Standard ASTM C136/136M sieve analytical procedure was employed. Data from this study is used to verify that accumulated products and accumulated mixtures meet the relevant specifications for particle size distribution compliance this information was used to determine the porosity and packaging connections of a material (Konert and Vandenberghe, 1997; Fernlund, 1998). The sieve analysis was done to determine the sand’s characteristics, and a calibration container was utilized to measure its volume. The Unit weight was calculated by conducting three trials of sand (Braithwaite, 1973; Hareland, 1994). It was critical to figure out the qualities of sand and classify it. Mechanical vibrators were employed instead of a sieve analysis shaker for sieve analysis. Following the ASTM standard, the sand particles utilized in the investigation were determined. Specific gravity which is within the specified range. Figure 1 explains graphical representation of the sieve analysis.
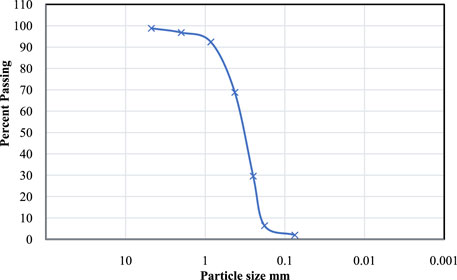
Figure 1. Particles size Distribution.
2.1.2 Tire chips
Tire chips were manufacture by Shallow Foundation Private Limited local rubber shredding company where it is used for synthetic purposes. The aspect ratio of tire chips was the same. Tire chips dimension were not greater than 0.05 mm. In addition, the shape of tire chips was triangular and trapezoidal. However, dimension was measured by regular measuring tape. Pictorial representation is given below Figures 2A, B of tires and sand tire chips. Tire chips are composite structures made up of elastomer, polyisoprene, polybutadiene and stirene-butadiene. Carbon black, zinc oxide, stearic acid and extender oil are also major components of tire crumbs. Steel is present in about 15% of tires. In this research work, steel was not considered as part of the scope. The optimal moisture content and the maximum density of the dry soil were then determined using a modified proctor test ASTM D1577. Measuring the dry density was essential for both direct shear and triaxial procedures since it aided in sample processing (Shaivan and Sridharan, 2020). Characteristics of materials adapted in this research are shown below in Table 1.
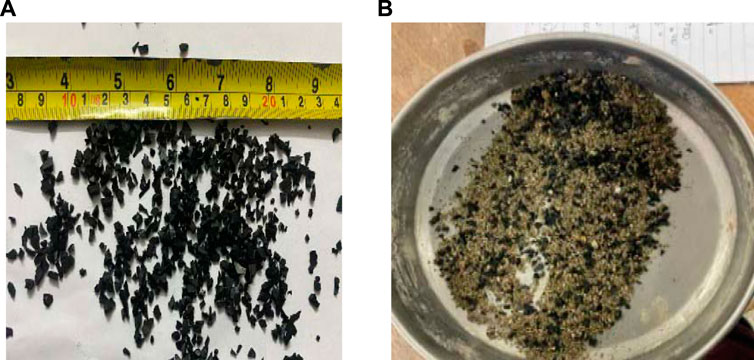
Figure 2. (A) Tires chip and (B) Sand-Tire chips mixtures.
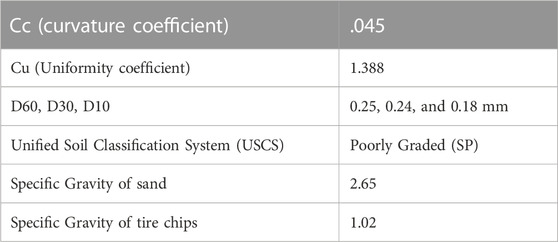
Table 1. Characteristics of materials.
2.2 Programming and sample preparation for the monotonic triaxial test
2.2.1 Triaxial apparatus
The triaxial instrument was manufactured by the MATEST Triaxial private corporation shown in Figure 3. During testing, the frame’s vertical load capacity ranges from 5 to 103 kg, however it never deforms. An axial compression or extension of 0.1–2.2 mm/min may be transmitted by the main hydraulic vertical press. A top plate with a metal frame split by a cylinder must be employed as a triaxial compaction chamber. When the piston fails while loading, it should not exceed 5% of the load owing to friction and side bending at the upper end of the piston and its screen. Except for draining material, a robust, non-corrosive substance is employed. Top pore disc: If it collapses, its mass might contribute to as much as 10% of axial stress. The specimen may be drained by inserting a stiff, porous disc into either end of it. Leak protection should be provided by the rubber membrane used in the specimen container. Membranes must be properly inspected before use, and any membranes found to have faults or pinholes must be disposed of. A leak-proof seal is required for every valve. Consolidation and shearing can only be done in conditions where the temperature does not rise or fall over 64°C, and there is no exposure to direct sunlight. Tools, including wire saws, steel linings, miter boxes, and vertical trim lathes, should be accessible upon request.
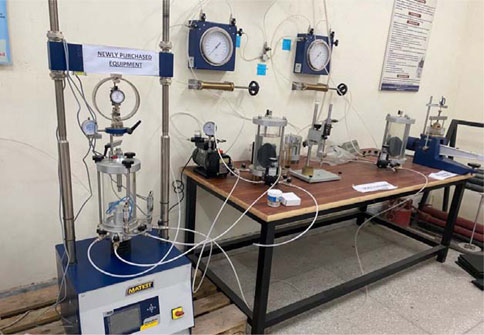
Figure 3. Triaxial apparatus by MATEST
2.2.2 Sample preparation
Before being put in the triaxial cell, the test specimen was first made from a soil sample. Trimming sand samples that had been extruded from Shelby tubes or block samples was part of this process. A membrane suction stretcher was brought into play when placing the rubber membrane on a pedestal. Keep in mind that the specimen should be disrupted as little as possible throughout the preparation process. Twelve specimens were also prepared for the triaxial test. Pure sand, 20%, 30%, and 40% by tire chips by weight of sand. The specimen size was in 38 mm in diameter and 76 mm in height. A Tamping rod was used for compacting specimens in spilt mold. Pictorial view is shown in Figures 4A–C.
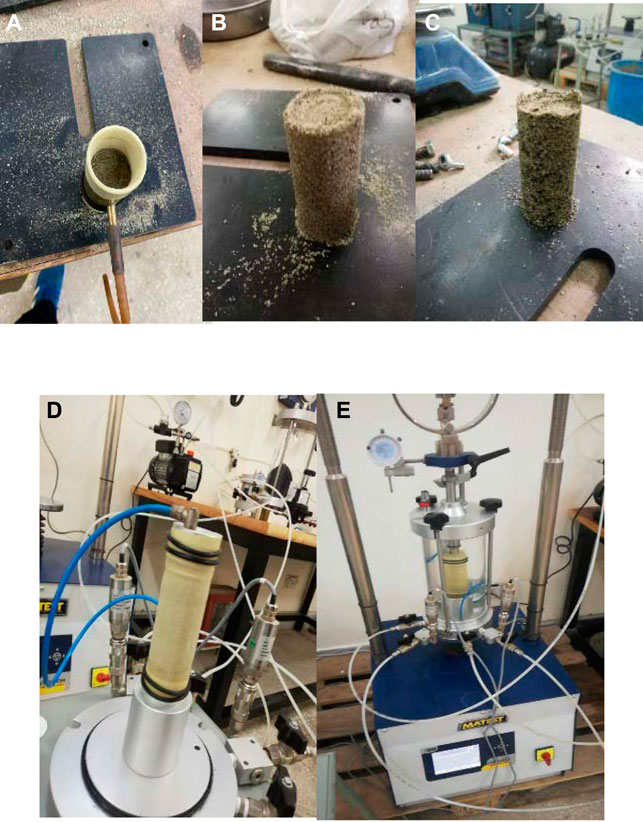
Figure 4. (A) Sample preparation (B) Sand and (C) Sand-Tire chips (D) on Pedestal and (E) Triaxial cell filled with water.
Assembly began once the specimen had been inserted into the triaxial cell. At this point, the cell had been filled with fluid, pressure/volume controls installed, and transducer readings set as appropriate. We wanted to ensure that water had been injected into every pore of the test specimen as a part of the saturation process to confirm that there were no remaining air pockets in the sample. When the transducer main drainage lines were partially vacuumed, a linear increase in cell pressure and back pressure was applied. The specimens were saturated to the proper degree. Skempton’s B-value was determined in a brief test before the consolidation process began. The saturation level is estimated using the pore pressure coefficient B using this method (Bishop and Henkel, 1962; Hambly, 1969).
When a material is pressured, as it would be if it were in situ, it tends to consolidate. When it does, consolidation is almost always isotropic. Effective stress conditions may be determined in samples after consolidation, since the pore pressure is at or near the back pressure. Assuming that the minimum dissipation is 95%, there is a limit to how much extra pore pressure may be dissipated even before consolidation process ends (Jardine et al., 1984; Guo, 2008).
During the shear section of the test, the volume change of both specimens is documented (Lings and Dietz, 2004; Edincliler et al., 2012). The deformation and shear load values were calculated, computed using Mohr’s circle and stress path plots, which may be obtained as a consequence of this test stage (Scarpelli and Wood, 1982; Lings and Dietz, 2004; Zhang and Thornton, 2007; Barla et al., 2010). The image representation is shown in Figures 4D, E.
3 Results and disscussion
3.1 Optimum mixing ratio of tire shred-sand mixture
The soil’s dry density and compaction parameters were assessed using a modified proctor test per ASTM D1577. Prior to being pounded into five layers, sand was passed through a sieve number No. 4. A total of 0.5 percent water of the soil mass was applied in increments, after each increment sample was oven-dried for 24 h and analyzed. The drying temperature was set up to 102o-104° degree Celsius. The purpose of adding 0.5 percent water by increment was to find the max dry density of the soil and also the sand particles did not liquefy by adding more percent of water abruptly addition, it also tells us how much soil sample should be used during sample preparation. The effect of pore pressure on shear tests cannot be ignored Terzaghi (1936) first recognized that pore-water pressure controls the frictional resistance of slopes, which has remained the most important concept in understanding landslide behavior. A founding principle of slope stability is that a rise in pore-water pressure reduces the shear strength of the soil. The greatest dry density was 1.75 gm/cm3 with a moisture content of 13%. Using dry density as a basis, mass was estimated in devices using direct shear and triaxial test as shown in Figure 5.

Figure 5. Optimum moisture content of sand.
3.2 Results fromTriaxial apparatus
In addition to the four samples of sand with no tire chips, the experiment includes samples containing 20%, 30%, and 40% tire chips by weight of sand. The control sample is plain sand. Stretching occurs at three distinct pressures for each sample (50, 100, and 150 kPa). These confining pressures were adopted by keeping consideration of existing site condition on the basis of soil at different depths. The minor and major primary stresses, σ3' and σ1', respectively, are used to analyses the Mohr’s circle, a depiction of the transformation equations for planar stress. Mohr’s circle for plain sand is calculated using three trials ranging from a minor primary stress to a considerable primary stress. The Mohr’s circle for plain sand has cohesiveness 15 kPa and angle of 39.51° when tangent line cross locations on drawn circles Figure 6A. In the second sample, which included 20 percent of tire chips from Mohr’s circles, the cohesiveness was 18 kPa, and the angle was 38.88° degrees, as previously reported in Figure 6B. An angle of 37.84° degrees and cohesiveness of 19 kPa were found in the third sample, which included 30 percent of tire chips. Representation is given below in Figure 6C. Ultimately, the Mohr’s circle assessment for the 40% tire chips sample reveals the same cohesiveness as for 30% tire chips, although the degree of angle differs by 36.98°. Figure 6D shows the graphical depiction of the findings.
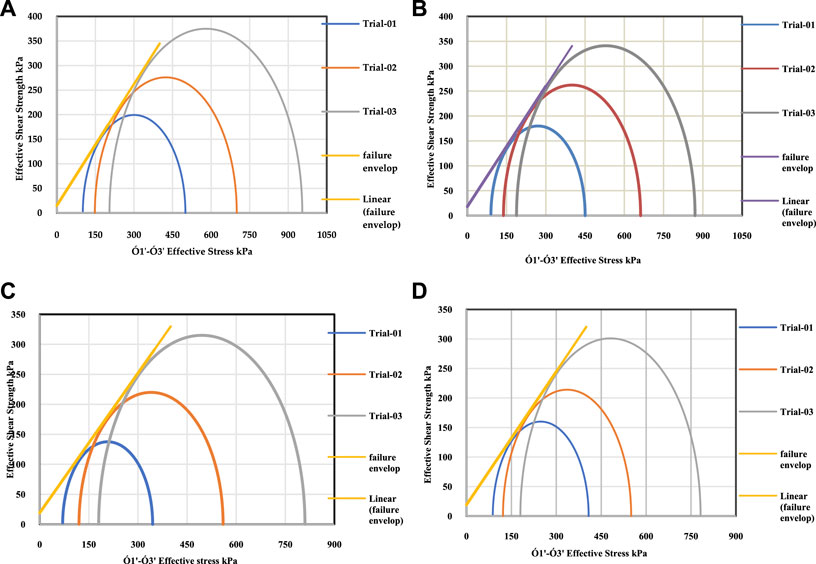
Figure 6. Mohr’s Circle (A) 0% TC Sand (B) 20% TC Sand (C) 30% TC Sand (D) 40% TC Sand.
3.2.1 Effect of normal stress on stress-strain behavior in triaxial test
Four samples are examined to assess the stress versus strain peaks at 50 kPa confining pressure. Pure sand samples exhibit a greater but diminishing peak, whereas 20% tire chips samples show a constant linear line indicating more potential for being strained. A straight line may also be drawn using samples containing 30 and 40 percent tire chips, respectively. The early start for all specimens is almost same, but when the de-viator stress increases, as seen in Figure 7A, Second, the relative shear strength of four samples is measured and compared using a 100 kPa confining pressure, as shown in Figure 7B below. The plain sand sample displays an obvious decline peak before the deformation reaches 15 mm, however the sample with 20% tire chips exhibits a straight linear line even after the deformation reaches its peak at 100 kPa loadings. 30 percent and 40 percent of the tire chips samples were linear, but not more than 20 percent of the tire chips samples were linear. A comparison of the shear strength of the four samples (sand, 20%, 30%, and 40% tire chips) with 150 kPa of confining pressure is shown in Figure 7C. The yellow line on the pure sand sample is weakening as the deformation approaches 15 mm. In contrast, the linear line on the 20% tire chips sample shows that the distortion has achieved its pinnacle in this graph yellow.
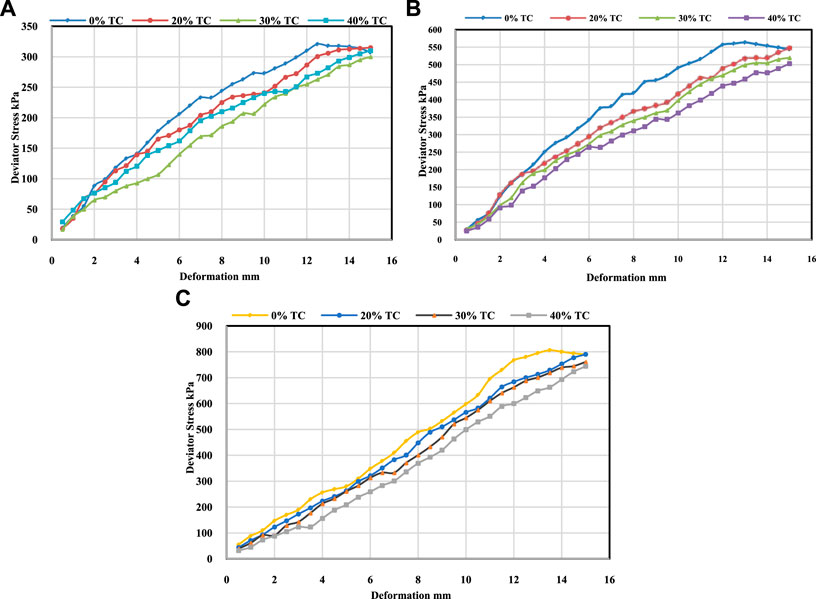
Figure 7. Comparison of stress-strain between the samples (A) 50 kPa (B) 100 kPa (C) 150 kPa.
3.2.2 Effect on shear strength parameters
The values of cohesiveness produced using Mohr’s Circle are shown graphically in the image below. An increase in cohesiveness may be seen with tire chips up to a certain percentage amount. Graphical representation is shown in Figure 8A. Mohr’s tangent-drawn circle shows that the angle of internal friction decreases from 39.5° to 36° when tire chips are added, as seen in Figure 8B. Compared to sand, tire chips were more effective in reducing unit weight in this experiment (Noorzad and Raveshi, 2017). For pure sand samples, the deviator stress axial strain graph shows the greatest peak shear stress values for all contained pressures. There was no peak deviator stress for the tire chips and the sand when they were mixed with 20 percent, 30 percent, and 40 percent by weight of sand. With more pneumatic chips in the sand mix, the maximum deviator stress is reduced. When the percentage of tire chips in the mixture increases, so does the strain that relates to the peak deviator stress. Increased chip content results in a reduction in shear stress, which in turn reduces the pressure exerted. With the addition of tire chips, the deformation increases with the increase of deviatoric stress. While in pure sand, we observe peak stress then decreases with the increase of strain. In other words, the sand chips, unlike tire chips and shreds, divide the sand particles, reducing the friction and strengthening the particles (Zormberg et al., 2004). Because chip concentrations around 20 and 30 percent have a larger mixing strength, the shear strength loss is less noticeable at these concentrations. As the number of chips grows, the cohesion value improves (Rao and Dutta, 2006). The mix of tire chips and sand is expected to gain in popularity. The sample’s ductility plays an important role in many civil engineering projects, which explains why axial stress rises. There is a significant reduction in volume when tire chips are included. There was no tendency for dilatation, although the tension was more than 15%, resulting in more compressible tire chips. There has been no dilatation seen at a distortive strain of roughly 20% for tire-chips in prior investigations, which also found them to be particularly compressible relative to sand (Ghazavi and Sakhi, 2005). As a result, the biggest percentage of sand was comprised of tires, which were separated from the other sand chips. The effect of tire chips on the stress-streaming behavior of sand tire blends has been studied in relation to tire percent on the shear strength properties of sand tire blends. Axial stress rises when residual strength decreases, and maximum stress (maximum differentiator stress) decreases. Sand-to-sand interaction is larger than sand-to-tire interaction or tire-to-tire contact because of this. The results of Zormberg as well as other researchers, who studied aspect ratios 1, 2, 4, and 8, show that increasing tire chips causes peak stresses to decrease (Riahi et al., 2015; Madhusudhan et al., 2019). Tire chips and pneumatic chips behave as though they are becoming stronger when the amount of aspect ratios that are more than one and the larger size of the pneumatic chips increase. On the other hand, this research used tire chips that were less than 5 mm in diameter and had an essentially same aspect ratio. In this case, the tire chips would not be able to act as a reinforced component in the sand combination. Increasing the amount of chips in the sand reduced its stiffness, making the specimen more ductile (Cabalar, 2011).
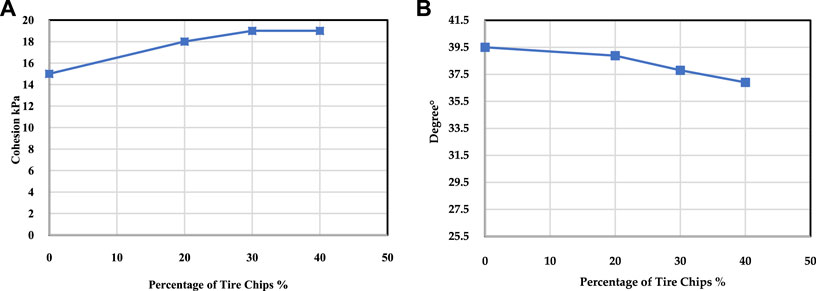
Figure 8. Shear strength properties of tire chips sand mixture (A) Analysis of Cohesion (B) Analysis Internal angle of friction.
3.3 Results from direct shear apparatus
Four samples of sand, 20%, 30%, and 40% tire chips by weight have been used in the direct shear apparatus to evaluate the direct shear strength of the sand and sand-tire chips. In this experiment, the impact of tire chips sand was clearly seen. Comparing findings from each equipment was the goal of the research, so that the shear strength of the study sample could be clearly shown. All the shear stresses for each sample are shown in Table 2, which is made up of three separate normal stresses, which are the same for all of the samples. The highest shear stress values for each specimen’s normal stresses are indicated in the table.
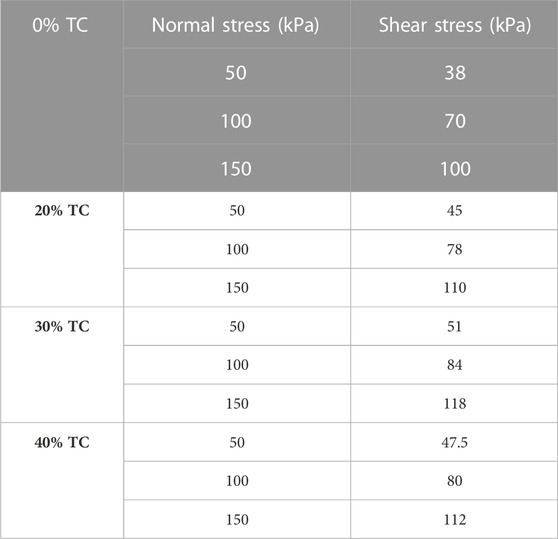
Table 2. Analysis of Normal Stress and shear stress investigated using direct shear.
3.3.1 Effect of normal stress on stress-strain behavior in direct shear test
Samples’ shear strengths are illustrated visually as stress versus strain graphs for three distinct loadings (normal stresses). According to this experiment, a sample with 30% tire chips has the maximum shear stress at 50 kPa loading, whereas samples with 40% and 20% tire chips have virtually identical strength, while the sample with 30% tire chips has the lowest strength. The difference in stress-strain between samples at 50 kPa loading is seen in Figure 9A. Figures 9B, C illustrate that the 30% tire chips have improved shear stress compared to the others. However, plain sand has very low shear stress, as can be observed for loading 100 and 150 kPa respectively.
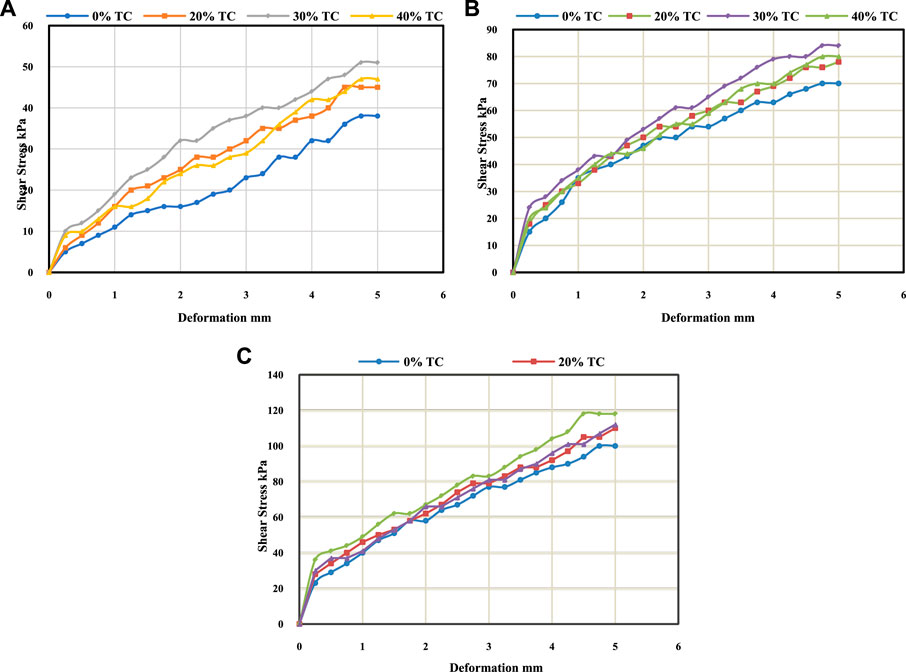
Figure 9. Comparison of stress-strain at Normal Stress (A) 50 kPa (B) 100 kPa (C) 150 kPa.
3.3.2 Effect on shear strength parameters
The direct stress values listed in the preceding table are used to determine shear strength, as shown in Figure 10. Compared to the 40 percent and 20 percent tire chips samples, the 30 percent tire chips sample had a higher shear strength. With the normal stress versus the maximum shear stress graph, we can easily see how much pressure is being exerted and how many tire chips are being generated. After 30 percent of the tire chips, the stress level drops. Angle of internal friction and cohesion observed from direct shear apparatus are shown below Table 3. The cohesion and angle of friction for tire chips rises as the percentage of tire chips increases, however plain sand exhibits very little cohesion of 8 kPa and the angle of friction as well. A graph depicting the angle of internal friction and cohesiveness for each sample is shown in Figures 11A,B.
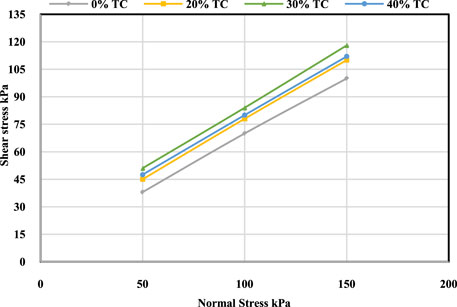
Figure 10. Shear Strength parameters obtained from DST.
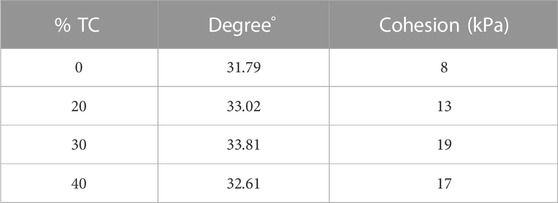
Table 3. Cohesion and angle of internal friction.
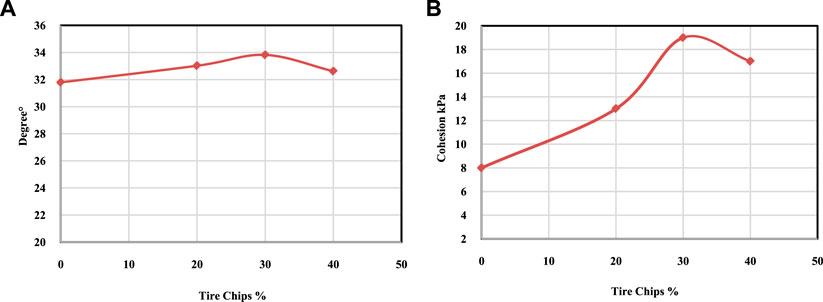
Figure 11. Shear strength parameters (A) Analysis of Angle of Internal Friction (B) Analysis of Cohesion.
When tire chips are included into a mixture, the weight of the mixture drops, which decreases lateral pressure on the retaining structures. An important factor in the calculation of the experimental results is separation. Rubber or tire chips have been used to separate the sand. This segregation and effort by sand to fill up the base box was noticed when the sand-to-tire chip ratio was low in the mixture (for example, less than 50% based on volume). Sand tire chips and their shredders were studied by Edil and Bosscher (1994), and Bosscher et al. (1992). Segregation is impossible when the amount of sand is significant. When Edil and Bosscher (1994) used volume and vibratory compaction to calculate the 50 percent mixing ratio, the sand and tire chip combination revealed segregation. Continuous mixing and monitoring of the mixture from the start of preparation until it is placed into the shear box is important to prevent segregation during sample preparation. As the chips are taken out, the mix sample’s internal friction angle increases, and as more tire chips are added, it decreases. The insertion of chips with angularity causes the initial increase in the angle of internal friction. A shaving zone failure increases the inner friction angle by interlocking the soil sand phenomenon, affecting tire chip cornering behavior. In the shearing zone, the tire chips are placed and distributed in a random fashion. Shredded rubber tires or pneumatic cups coupled with sand either glide or resist being shaken off as the shears begin to cut (Ghazavi, 2004). As the soil shear strength decreased, the soil’s thickness also decreased. To further improve shear strength, more tire chips or fibers were added to the mix. They have greater contact areas with the grains of sand. The tire chips in the shear region may be considered anchors to resist the shear force. Pull buffers or chips and sand may be used as soil reinforcement in constructing embankments, allowing the embankment to withstand larger static loads without collapse.
3.4 Comparison of direct shear and triaxial apparatus
The shear properties of sand were increased with the addition of tire chips, which might be due to the combined effect of tire length, aspect ratio (length/diameter), stiffness of tire, orientation of tire, sand friction angle, and normal stress the shear strength increases with increase in the percentage of tire in the mixture up to a certain value and thereafter decreases. Thus, there is an optimum ratio of tire to sand that results in the highest peak shear strength. This increase in strength with increase in size for corresponding percentage is due to the reinforcement effect of tire particles, which have a greater interlocking capacity Shear strength of sand tire chips is based on pressure imposed from sand grains to the tire due to application of normal stress and the friction mobilized between sand–tire, tire–tire and sand-sand. It can be observed from the general trend that the friction angle and cohesion increase with increase with addition tire size and then decreases. The initial increase in friction angle is due to the inclusion of tire, which is angular in nature. The angularity of tire contributes to increasing the friction angle by interlocking with sand particles. The increase in the angle of internal friction and cohesion is due to failure in the shearing zone. At higher tire percentages, the friction angle decreases as the quantity of rubber is more than sand in the shear zone, causing the sand–sand and sand–tire interface friction to reduce, resulting in the reduction of friction angle and hence reducing shear strength.
Triaxial shear testing, rather than direct shear, is more reliable and efficient in providing shear strength values for samples because it considers many dimensions, such as saturation, pore water pressure strain, and volumetric stain, which give a much better analysis as Table 4 shows shear strength parameters for plain sand with a 20%, 30%, and 40% tire chips, and for each sample with a 100% saturation in triaxial test. Comparative conduct is shown in Figures 12A, B.
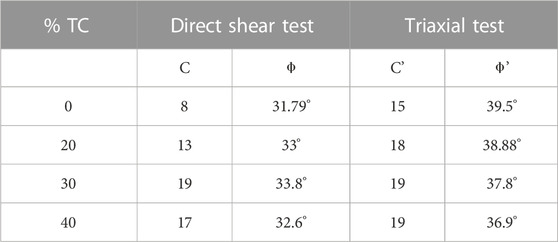
Table 4. Comparison of direct shear and Triaxial apparatus.
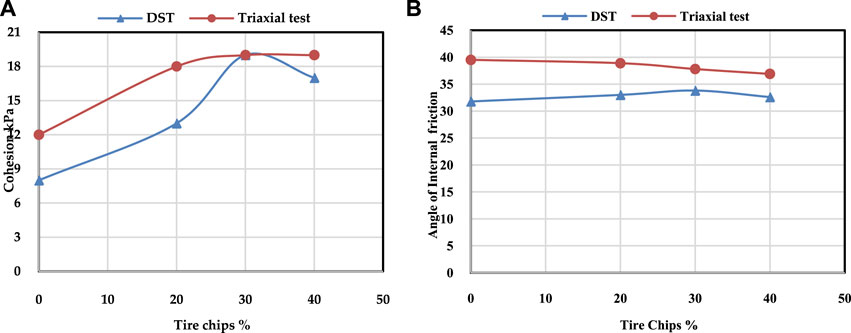
Figure 12. Comparative analysis of (A) Cohesion DST vs. Triaxial (B) Angle of Internal friction DST.
3.5 Failure pattern
Tests on triaxial apparatus found that samples with high deforestation failed along a shear plane at an angle greater than θ = 45+/2, but this was reduced when tire chips were added. Using sand and a tire as a composite shows that it is. As a result, failure takes on a life of its own. Tire chips-sand was more noticeable in images than the sand itself because of the cohesiveness of sand augmented by chips. The ductility of sand tire chips has been observed and found to be greater than that of sand. Sand tire chips are also less brittle than sand in terms of indices. Failure patterns of sand-tire chips and sand are show in Figures 13A, B.
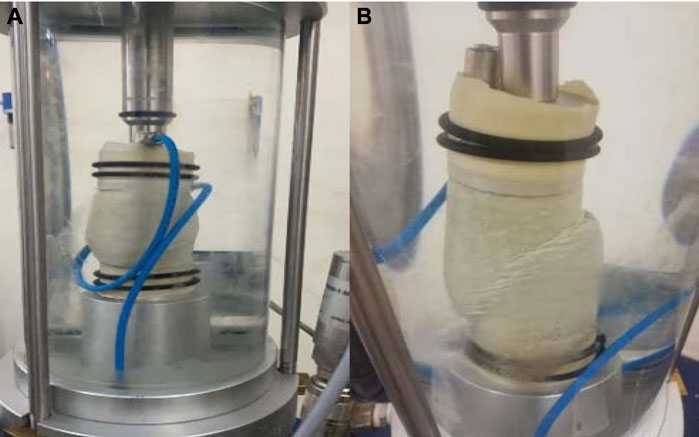
Figure 13. (A) Sand-Tire chips and (B) Sand failure in Triaxial apparatus.
Unlike the direct shear test, where the failure plane is known, and the kind of sample, we utilized is always horizontal, the failure plane in direct shear testing on sand and sand pneumatic chip combination by weight was the same, even for severe deformation materials. Direct shear devices are unable to collect a large number of critical parameters, preventing us from learning about several important characteristics. The representation of direct shear failure is shown pictorially in Figure 14.
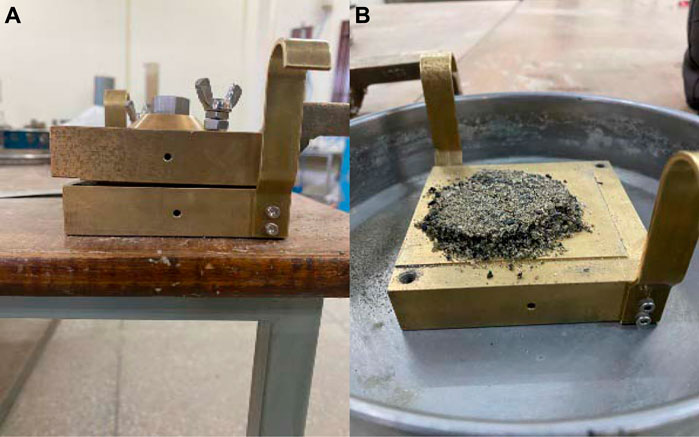
Figure 14. Sand-Tire chips failure in Direct Shear apparatus. (A) Sample in placed in direct shear apparatus (B) Sample after failure.
4 Conclusion
• The present study aimed to investigate the difference in the efficiency of the direct shear, and triaxial apparatus in finding the shear strength of tire chips mixed with the sand.
• The study results concluded that plain sand itself shows less strength than the mixed samples (20% tire chips).
• The study also concluded that the triaxial apparatus is more reliable to use, as compared to the direct shear apparatus, which only represents a few parameters, while triaxial apparatus gives more details about the samples as demonstrated by the study in the above sections.
• The results from the experiment on plan sand shows a c´ value of 8, and 15 kPa with direct shear strength and triaxial shear strength correspondingly, suggesting better results through triaxial apparatus.
• The angle of (Փ′) for the plan sand was 31.79° with direct shear strength while 39.5° with triaxial apparatus, concluding that triaxial test gives better in explaining angle of internal friction Փ´.
• The experiment on the 20%, 30%, and 40% tire chips also shows better results for c´ and Փ′ with triaxial apparatus than the direct shear methodology.
Data availability statement
The original contributions presented in the study are included in the article/Supplementary Material, further inquiries can be directed to the corresponding author.
Author contributions
Conceptualization, BK, MA, and HA; methodology, BK, MA, and MMSS; software, BK and AH; formal analysis, HA, BK, MA, and AH; resources, BK, MA, and HA; data curation, BK, MA, and MMSS; writing–original draft, BK, MA, AH, and HA; writing–review and editing, BK, and MMSS; supervision, HA; funding acquisition MMSS. All authors have read and agreed to the published version of the manuscript.
Funding
This research was supported by a grant from the Russian Science Foundation No. 22-79-10021, https://rscf.ru/project/22-79-10021/.
Acknowledgments
The authors would like to thank the Deanship of Scientific Research at Umm Al-Qura University for supporting this work by Grant Code: (23UQU4250045DSR001).
Conflict of interest
The authors declare that the research was conducted in the absence of any commercial or financial relationships that could be construed as a potential conflict of interest.
Publisher’s note
All claims expressed in this article are solely those of the authors and do not necessarily represent those of their affiliated organizations, or those of the publisher, the editors and the reviewers. Any product that may be evaluated in this article, or claim that may be made by its manufacturer, is not guaranteed or endorsed by the publisher.
References
Ahmed, I., and Lovell, C. W. (1992“Use of rubber tires in highway construction,” in Utilization of waste materials in civil engineering construction), 166–181. ASCE.
Akbarimehr, D., Eslami, A., and Aflaki, E. (2020). Geotechnical behaviour of clay soil mixed with rubber waste. J. Clean. Prod. 271, 122632. doi:10.1016/j.jclepro.2020.122632
Anvari, S. M., Shooshpasha, I., and Kutanaei, S. S. (2017). Effect of granulated rubber on shear strength of fine-grained sand. J. Rock Mech. Geotechnical Eng. 9 (5), 936–944. doi:10.1016/j.jrmge.2017.03.008
Araujo, G. L. S., Moreno, J. A. S., and Zornberg, J. G. (2021). Shear behavior of mixtures involving tropical soils and tire shreds. Constr. Build. Mater. 276, 122061. doi:10.1016/j.conbuildmat.2020.122061
Arulrajah, A., Rahman, M. A., Piratheepan, J., Bo, M. W., and Imteaz, M. A. (2014). Evaluation of interface shear strength properties of geogrid-reinforced construction and demolition materials using a modified large-scale direct shear testing apparatus. J. Mater. Civ. Eng. 26 (5), 974–982. doi:10.1061/(asce)mt.1943-5533.0000897
Bałachowski, L., and Gotteland, P. (2007). Characteristics of tyre chips-sand mixtures from triaxial tests. Archives Hydro-Engineering Environ. Mech. 54 (1), 25–36.
Banzibaganye, G., Becker, A., and Vrettos, C. (2019). “Static and cyclic triaxial tests on medium sand and tire chips mixtures,” in Proceedings of the 17th African Regional Conference on Soil Mechanics and Geotechnical Engineering, Cape Town.
Barla, G., Barla, M., and Martinotti, M. (2010). Development of a new direct shear testing apparatus. Rock Mech. Rock Eng. 43 (1), 117–122. doi:10.1007/s00603-009-0041-5
Bishop, A. W., and Henkel, D. J. (1962). The measurement of soil properties in the triaxial test. The National Academics of Engineering.
Bosscher, P. J., Edil, T. B., and Eldin, N. N. (1992). Construction and performance of a shredded waste tire test embankment. Transp. Res. Rec., 1345.
Braithwaite, C. (1973). Settling behaviour related to sieve analysis of skeletal sands. Sedimentology 20 (2), 251–262. doi:10.1111/j.1365-3091.1973.tb02048.x
Cabalar, A. F. (2011). Direct shear tests on waste tires–sand mixtures. Geotechnical Geol. Eng. 29 (4), 411–418. doi:10.1007/s10706-010-9386-5
Cetin, H., Fener, M., and Gunaydin, O. (2006). Geotechnical properties of tire-cohesive clayey soil mixtures as a fill material. Eng. Geol. 88 (1-2), 110–120. doi:10.1016/j.enggeo.2006.09.002
Chenari, R. J., Poursalimi, N., and Sosahab, J. S. (2017). Dynamic properties of sand-tire crumb mixtures with large cyclic direct shear apparatus. Electron. J. Geotechnical Eng. 22, 5085–5106.
Chyan, J.-M., Senoro, D. B., Lin, C. J., Chen, P. J., and Chen, I. M. (2013). A novel biofilm carrier for pollutant removal in a constructed wetland based on waste rubber tire chips. Int. Biodeterior. Biodegrad. 85, 638–645. doi:10.1016/j.ibiod.2013.04.010
Edeskär, T. (2004). Technical and environmental properties of tyre shreds focusing on ground engineering applications. Sweden: Luleå tekniska universitet.
Edil, T. B., and Bosscher, P. J. (1994). Engineering properties of tire chips and soil mixtures. Geotech. Test. J. 17, 453.
Edinçliler, A., Baykal, G., and Dengili, K. (2004). Determination of static and dynamic behavior of recycled materials for highways. Resour. conservation Recycl. 42 (3), 223–237. doi:10.1016/j.resconrec.2004.04.003
Edinçliler, A., Baykal, G., and Saygılı, A. (2010). Influence of different processing techniques on the mechanical properties of used tires in embankment construction. Waste Manag. 30 (6), 1073–1080. doi:10.1016/j.wasman.2009.09.031
Edincliler, A., Cabalar, A. F., Cagatay, A., and Cevik, A. (2012). Triaxial compression behavior of sand and tire wastes using neural networks. Neural Comput. Appl. 21 (3), 441–452. doi:10.1007/s00521-010-0430-4
Edincliler, A. (2007). “Using waste tire-soil mixtures for embankment construction,” in Scrap tire derived geomaterials-opportunities and challenges (Florida, America: CRC Press), 337–346.
El Naggar, H., and Iranikhah, A. (2021). Evaluation of the shear strength behavior of TDA mixed with fine and coarse aggregates for backfilling around buried structures. Sustainability 13 (9), 5087. doi:10.3390/su13095087
El Naggar, H., and Zahran, K. (2021). Effect of the particle size on TDA shear strength parameters in triaxial tests. Buildings 11 (2), 76. doi:10.3390/buildings11020076
Feng, X., Li, Q., and Wang, K. (2020). Waste plastic triboelectric nanogenerators using recycled plastic bags for power generation. ACS Appl. Mater. Interfaces 13 (1), 400–410. doi:10.1021/acsami.0c16489
Fernlund, J. M. (1998). The effect of particle form on sieve analysis: A test by image analysis. Eng. Geol. 50 (1-2), 111–124. doi:10.1016/s0013-7952(98)00004-0
Foose, G. J., Benson, C. H., and Bosscher, P. J. (1996). Sand reinforced with shredded waste tires. J. Geotechnical Eng. 122 (9), 760–767. doi:10.1061/(asce)0733-9410(1996)122:9(760)
Fox, P. J., Thielmann, S. S., Sanders, M. J., Latham, C., Ghaaowd, I., and McCartney, J. S. (2018). Large-scale combination direct shear/simple shear device for tire-derived aggregate. Geotechnical Test. J. 41 (2), 20160245–20160353. doi:10.1520/gtj20160245
Ghaaowd, I., McCartney, J. S., Thielmann, S. S., Sanders, M. J., and Fox, P. J. (2017). Shearing behavior of tire-derived aggregate with large particle size. I: Internal and concrete interface direct shear. J. Geotechnical Geoenvironmental Eng. 143 (10), 04017078. doi:10.1061/(asce)gt.1943-5606.0001775
Ghazavi, M., Ghaffari, J., and Farshadfar, A. (2011). “Experimental determination of waste tire chip-sand-geogrid interface parameters using large direct shear tests,” in 5th Symposium on Advances in Science and Technology.
Ghazavi, M., and Sakhi, M. A. (2005). Influence of optimized tire shreds on shear strength parameters of sand. Int. J. Geomechanics 5 (1), 58–65. doi:10.1061/(asce)1532-3641(2005)5:1(58)
Ghazavi, M. (2004). Shear strength characteristics of sand-mixed with granular rubber. Geotechnical Geol. Eng. 22 (3), 401–416. doi:10.1023/b:gege.0000025035.74092.6c
Gheni, A., Liu, X., ElGawady, M. A., Shi, H., and Wang, J. (2018). Leaching assessment of eco-friendly rubberized chip seal pavement. Transp. Res. Rec. 2672 (52), 67–77. doi:10.1177/0361198118758688
Gong, H., Song, W., Huang, B., Shu, X., Han, B., Wu, H., et al. (2019). Direct shear properties of railway ballast mixed with tire derived aggregates: Experimental and numerical investigations. Constr. Build. Mater. 200, 465–473. doi:10.1016/j.conbuildmat.2018.11.284
Guo, P. (2008). Modified direct shear test for anisotropic strength of sand. J. Geotechnical Geoenvironmental Eng. 134 (9), 1311–1318. doi:10.1061/(asce)1090-0241(2008)134:9(1311)
Hambly, E. (1969). A new true triaxial apparatus. Geotechnique 19 (2), 307–309. doi:10.1680/geot.1969.19.2.307
Hareland, G. (1994). Evaluation of flour particle size distribution by laser diffraction, sieve analysis and near-infrared reflectance spectroscopy. J. Cereal Sci. 20 (2), 183–190. doi:10.1006/jcrs.1994.1058
Hazarika, H., Otani, J., and Kikuchi, Y. (2012). Evaluation of tyre products as ground improving geomaterials. Proc. Institution Civ. Engineers-Ground Improv. 165 (4), 267–282. doi:10.1680/grim.11.00013
Hosseininia, A. R. E. S. (2017). A study of the effect of shredded tire size on the mechanical behavior of sand and shredded tire mixtures using direct shear test. J. Ferdowsi Civ. Eng. 29 (1).
Jardine, R., Symes, M., and Burland, J. (1984). The measurement of soil stiffness in the triaxial apparatus. Geotechnique 34 (3), 323–340. doi:10.1680/geot.1984.34.3.323
Konert, M., and Vandenberghe, J. (1997). Comparison of laser grain size analysis with pipette and sieve analysis: A solution for the underestimation of the clay fraction. Sedimentology 44 (3), 523–535. doi:10.1046/j.1365-3091.1997.d01-38.x
Lings, M., and Dietz, M. (2004). An improved direct shear apparatus for sand. Geotechnique 54 (4), 245–256. doi:10.1680/geot.2004.54.4.245
Ma, D., Duan, H., Zhang, J., Liu, X., and Li, Z. (2022a). Numerical simulation of water–silt inrush hazard of fault rock: A three-phase flow model. Rock Mech. Rock Eng. 55 (8), 5163–5182.
Ma, D., Duan, H., and Zhang, J. (2022b). Solid grain migration on hydraulic properties of fault rocks in underground mining tunnel: Radial seepage experiments and verification of permeability prediction. Tunn. Undergr. Space Technol. 126, 104525.
Ma, D., Duan, H., Zhang, J., and Bai, H. (2022c). A state-of-the-art review on rock seepage mechanism of water inrush disaster in coal mines. GInt. J. Coal Sci. Tech. 9 (1), 50.
Madhusudhan, B., Boominathan, A., and Banerjee, S. (2019). Factors affecting strength and stiffness of dry sand-rubber tire shred mixtures. Geotechnical Geol. Eng. 37 (4), 2763–2780. doi:10.1007/s10706-018-00792-y
Manoharan, P. (2019). “Studies on properties of concrete using crumb rubber as fine aggregate,” in International Conference on Intelligent Computing and Applications (Springer).
Marto, A., (2013). Shear properties of sand-tire chips mixtures. Electron. J. Geotechnical Eng. 18 (2), 325–334.
Neaz Sheikh, M., Mashiri, M. S., Vinod, J. S., and Tsang, H. H. (2013). Shear and compressibility behavior of sand–tire crumb mixtures. J. Mater. Civ. Eng. 25 (10), 1366–1374. doi:10.1061/(asce)mt.1943-5533.0000696
Noorzad, R., and Raveshi, M. (2017). Mechanical behavior of waste tire crumbs–sand mixtures determined by triaxial tests. Geotechnical Geol. Eng. 35 (4), 1793–1802. doi:10.1007/s10706-017-0209-9
Perez, J. L., Kwok, C., and Senetakis, K. (2016). Effect of rubber size on the behaviour of sand-rubber mixtures: A numerical investigation. Comput. Geotechnics 80, 199–214. doi:10.1016/j.compgeo.2016.07.005
Rao, G. V., and Dutta, R. (2006). Compressibility and strength behaviour of sand–tyre chip mixtures. Geotechnical Geol. Eng. 24 (3), 711–724. doi:10.1007/s10706-004-4006-x
Rezazadeh Eidgahee, D., Haddad, A., and Naderpour, H. (2019). Evaluation of shear strength parameters of granulated waste rubber using artificial neural networks and group method of data handling. Sci. Iran. 26 (6), 3233–3244.
Riahi, P., Chenari, R. J., and Karimpour-Fard, M. (2015). “Mechanical properties of sand-TDA mixtures in large scale direct shear test,” in Geotechnical Engineering for Infrastructure and Development.
Rouhanifar, S., Afrazi, M., Fakhimi, A., and Yazdani, M. (2021). Strength and deformation behaviour of sand-rubber mixture. Int. J. Geotechnical Eng. 15 (9), 1–15. doi:10.1080/19386362.2020.1812193
Scarpelli, G., and Wood, D. M. (1982). “Experimental observations of shear patterns in direct shear tests,” in IUTAM Deformation and Failure of Granular Materials Conference.
Senin, M., (2017), “The optimum content of rubber ash in concrete: Flexural strength,”in IOP Conference Series: Materials Science and Engineering (Bristol, United Kingdom: IOP Publishing).
Shaivan, H., and Sridharan, A. (2020). Comparison of reduced modified proctor vs modified proctor. Geotechnical Geol. Eng. 38 (6), 6891–6897. doi:10.1007/s10706-020-01405-3
Shu, X., and Huang, B. (2014). Recycling of waste tire rubber in asphalt and portland cement concrete: An overview. Constr. Build. Mater. 67, 217–224. doi:10.1016/j.conbuildmat.2013.11.027
Tabrizi, M. K., Abrishami, S., Hosseininia, E. S., Sharifi, S., and Ghorbani, S. (2019). Experimental investigation on the behavior of fine-grained soils containing waste rubber tires under repeated and static loading using direct shear apparatus. Constr. Build. Mater. 223, 106–119. doi:10.1016/j.conbuildmat.2019.06.159
Tanchaisawat, T., Bergado, D., Voottipruex, P., and Shehzad, K. (2010). Interaction between geogrid reinforcement and tire chip–sand lightweight backfill. Geotext. Geomembranes 28 (1), 119–127. doi:10.1016/j.geotexmem.2009.07.002
Tatlisoz, N., Benson, C. H., and Edil, T. B. (1997). Effect of fines on mechanical properties of soil-tire chip mixtures, 1275. Philadelphia, United States: ASTM Special Technical Publication, 93–124.
Tiwari, S., and Mathur, R. (2016). Engineering behavior of tire chips-sand mixture. INROADS-An Int. J. Jaipur Natl. Univ. 5 (1), 33–41. doi:10.5958/2277-4912.2016.00007.2
Vinod, J. S., Sheikh, N., Mastello, D., Indraratna, B., and Mashiri, M. S. (2015). The direct shear strength of sand-tyre shred mixtures.
Weaver, K., and Reddy, F. (2015), Goddard’s Astrophysics Science Division Annual Report 2014 (No. GSFC-E-DAA-TN25016).
Yadav, J., and Tiwari, S. (2017). Effect of waste rubber fibres on the geotechnical properties of clay stabilized with cement. Appl. Clay Sci. 149, 97–110. doi:10.1016/j.clay.2017.07.037
Yang, S., Lohnes, R. A., and Kjartanson, B. H. (2002). Mechanical properties of shredded tires. Geotechnical Test. J. 25 (1), 44–52.
Zahran, K., and Naggar, H. E. (2020). Effect of sample size on TDA shear strength parameters in direct shear tests. Transp. Res. Rec. 2674 (9), 1110–1119. doi:10.1177/0361198120934482
Keywords: Stress-strain, shear strength of sand-tire chips, direct shear apparatus, triaxial apparatus, failure
Citation: Amin H, Khan BJ, Ahmad M, Hakamy A, Sikandar MA and Sabri Sabri MM (2023) Evaluation of shear strength parameters of sustainable utilization of scrap tires derived geo-materials for civil engineering applications. Front. Earth Sci. 11:1116169. doi: 10.3389/feart.2023.1116169
Received: 05 December 2022; Accepted: 07 April 2023;
Published: 09 May 2023.
Edited by:
Maria Da Glória Garcia, University of São Paulo, BrazilReviewed by:
Dan Ma, China University of Mining and Technology, ChinaQinwen Tan, China University of Geosciences Wuhan, China
Copyright © 2023 Amin, Khan, Ahmad, Hakamy, Sikandar and Sabri Sabri. This is an open-access article distributed under the terms of the Creative Commons Attribution License (CC BY). The use, distribution or reproduction in other forums is permitted, provided the original author(s) and the copyright owner(s) are credited and that the original publication in this journal is cited, in accordance with accepted academic practice. No use, distribution or reproduction is permitted which does not comply with these terms.
*Correspondence: Beenish Jehan Khan, YmVlbmlzaEBjZWNvcy5lZHUucGs=