- 1College of Geography and Environmental Science, Northwest Normal University, Lanzhou, China
- 2State Key Laboratory of Cryospheric Science/Tian Shan Glaciological Station, Northwest Institute of Eco-Environment and Resources, Chinese Academy of Sciences, Lanzhou, China
Precipitation is one of the most important climatological data for global hydrothermal cycle and climate change. The accuracy of precipitation data not only directly affects the hydrological processes, but also plays an important role in the climate and hydrology at regional and global scales. According to the in situ datasets, the precipitation measurement in automatic weather stations for Geonor T-200B was corrected by the World Meteorological Organization Solid Precipitation Intercomparison Experiment (WMO-SPICE) transfer functions. The parameters of transfer functions were tested and recalibrated by the local datasets. The results showed that the transfer functions showed better performance after recalibrating parameters by the local datasets. The root-mean-square error (RMSE) and mean bias decreased by an average of 34% and 42%, respectively. The corrected snowfall increased by 7% (14 mm) at the test station. Then, the new parameters were used in other automatic weather stations to correct precipitation, and it was found that solid precipitation was underestimated by 13% on the glacier surface affected by wind speed. Moreover, according to the corrected precipitation datasets observed in automatic weather stations and national meteorological stations, the precipitation–altitude relationship in the Urumqi River Basin was analyzed. The annual precipitation gradient was 115 mm km-1, and the maximum seasonal altitude occurred in summer with a value of 35 mm km-1 and in autumn with the lowest value of 1 mm km-1. When considering precipitation on the glacier surface, the yearly precipitation gradient was increased with the value of 158 mm km -1 in 2019.
1 Introduction
Precipitation plays a crucial role in atmospheric and land surface processes at a variety of spatial and temporal scales (Kidd and Huffman, 2011; Yang and Luo, 2014; Tang et al., 2016; Lu et al., 2019). Accurate precipitation data are critical for research in the fields of hydrology and meteorology, and for improving accurate weather predictions in high altitudes and cold mountainous regions (Lu et al., 2019; Zhao et al., 2021). However, due to the complex topography and sparse monitoring stations, it is difficult to obtain accurate precipitation data in high mountain areas (Daly et al., 2007; Wang et al., 2017). The most important environmental factor affecting solid precipitation measurements is the wind speed (Yang et al., 1995). The first precipitation measurement intercomparison was conducted by the World Meteorological Organization (WMO) in 1955. The third precipitation measurement intercomparison was carried out from 1986 to 1993, recommending the Double-Fence Intercomparison Reference (DFIR) as the standard for solid precipitation measurement (Goodison et al., 1998).
In addition, it is widely recognized that measurements of solid precipitation are influenced by the size and shape of the gauge types, local climate conditions, different wind shields, and snowflake characteristics (Sevruk et al., 1991; Sevruk and Nespor, 1994; Yang et al., 1995; Smith, 2009; Thériault et al., 2012; Zhao et al., 2021). Solid precipitation measurements are subjected to large measurement errors resulting primitively from the undercatch caused by wind (Jia et al., 2020). The fact that wind induces a bias on solid precipitation measurements is well established (Wolff and IsaksenPetersen-Overleir, 2015). Previous studies have indicated that snowfall errors caused by wind using different precipitation gauges can reach 20%–80% in high-latitude and -altitude regions (Sugiura et al., 2006; Pan et al., 2016; Smith et al., 2020). In recent years, research on adjusting solid precipitation measurements has been developed (Zhao et al., 2021). Many studies have been carried out on the undercatch of solid precipitation by using different gauges (Weiss, 1961; Larson and Peck, 1974; Goodison et al., 1998; Yang et al., 2000; Sugiura et al., 2006; Hanson, 2007).
The WMO Solid Precipitation Intercomparison Experiment (WMO-SPICE) was initiated in 2010 to evaluate the automated precipitation gauges and correct the effects of wind-induced errors on automated solid precipitation measurements, as well as to evaluate new and existing precipitation and snow depth sensors in different configurations and climate regimes (Goodison et al., 1998; Nitu et al., 2012). The WMO-SPICE transfer functions were used to correct the underestimation of precipitation measurements caused by wind and describe the precipitation catch efficiency for systems with shielded gauges. It has been derived as a function of wind speed and air temperature, applied over shorter periods. The results of the transfer function have been tested and verified in many experimental sites (Wolff and IsaksenPetersen-Overleir, 2015; Kochendorfer et al., 2017a; Pierre et al., 2019; smith et al., 2020).
In China, the solid precipitation measurement intercomparison was first carried out in the Urumqi River Basin in the third WMO precipitation measurement intercomparison experiment (1985–1987), and the Chinese standard precipitation gauge (CSPG) and the Hellmann gauge were initially compared using the DFIR shield as a reference configuration in this area. The wetting loss, evaporation loss, wind-induced undercatch, and trace precipitation of the CSPGs were well quantified based on the massive observation data (Yang, 1988; Yang et al., 1991). In 2018, an experimental site for the precipitation intercomparison measurement was established in the Hulu watershed of the Qilian Mountains and it compared the CSPGs equipped with different wind shields and created correction functions for unshielded CSPGs and single-alter-shielded CSPGs under different precipitation types (Chen et al., 2014; 2015). Zhao et al. (2021) corrected the precipitation measured with Geonor T-200B by the World Meteorological Organization Solid Precipitation Intercomparison Experiment transfer functions, recalibrating the coefficients using local datasets. The results showed that the transfer functions fitted to the local datasets showed better performance than those using the original parameters.
Cold regions are the major research frontiers of atmospheric and hydrologic sciences (Woo, 2008; Chen et al., 2014). In these regions, meteorological stations are generally located in the lowlands because of accessibility considerations, thus under-representing in the highlands. The Urumqi River Basin spans plain and alpine cold zones to glacierized regions, which is conducive to atmospheric research. For the correction and gradient of precipitation in the Urumqi River Basin, some studies have been conducted in low-altitude regions in the basin (Yang et al., 1988; Kong and Pang, 2016; Li et al., 2018). Only a few studies have been conducted in high-altitude regions, especially in glacierized regions, due to the shortage of synchronous measured data. In this study, the observed precipitation data at high altitudes of the Urumqi River were corrected by the World Meteorological Organization Solid Precipitation Intercomparison Experiment transfer functions and applied to explore the precipitation gradient. It is the first time to systematically correct the precipitation data observed at the glacier terminus and the surface, and explore the precipitation gradient in the glacierized region in the Urumqi River Basin. The precipitation gradient was analyzed based on six meteorological data from different elevations ranging from 935 m to 4,025 m. The study will greatly improve our understanding of the meteorological mechanisms in the glacierized catchment of cold regions in central Asia.
2 Study area
The Urumqi River (43°00′–44°07′N and 86°45′–87°56′E) is located on the northern slope of the Tianshan Mountains in the Xinjiang Uygur Autonomous Region of Northwest China. The river originates from Urumqi Glacier No. 1 (UG1) on the northern side of Tianger Peak No. II and flows to the northeast. The basin is characterized by continental temperate arid climate and is influenced by westerly circulation. The precipitation mainly occurs from April to September. Cold winter temperatures and precipitations are caused by the Siberian anticyclonic circulation.
Following the main Urumqi River Basin, six meteorological stations were installed between 935 m a.s.l. and 4,025 m a.s.l., spanning the plain, forest zone, alpine cold zone, middle mountain zone, alpine meadow, and glacier surface, with significant vertical characteristics (Figure 1). The precipitation mainly occurs in high-altitude mountainous areas. We define the six stations as S1–S6 from upstream to downstream. S1 was built on the glacier surface at an elevation of 4,025 m near its central flowline in a relatively flat area with a slope of about 2°. The average temperature was −12.9°C, and the mean precipitation was 790 mm during 2018–2020. S2 was located on a flat glacial moraine ridge at the snout of UG1, with an altitude of 3,835 m. Surrounded by mountain ridges in three directions with an average temperature of −5.1 °C and an average precipitation of 787 mm during 2011–2020, S3, S5, and S6 were national ordinary meteorological stations run by the China Meteorological Administration (CMA). S3 was located in the alpine meadow and started to operate in 1959 with an elevation of 3,539 m. The average temperature and precipitation were −4.2°C and 550 mm, respectively. S4 was located on the meadow at an elevation of 2,130 m. The average temperature and precipitation were 1.6°C and 425 mm, respectively. S5 was located in the middle mountain forest zone with an elevation of 1,930 m. The average temperature and precipitation were 0°C and 488 mm, respectively. S6 was located in Urumqi city with an elevation of 935 m. The climatic environments may be different from those stations in the mountains. The average temperature and precipitation were 8.1°C and 305 mm, respectively. The details of the stations are given in Table 1.
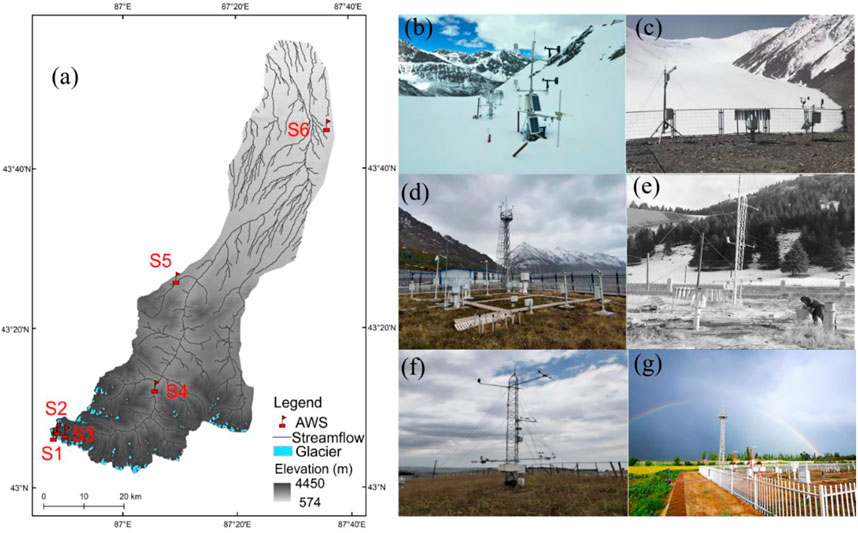
FIGURE 1. Maps showing (A) locations of meteorological stations in the Urumqi River Basin and (B–G) photographs of the observation site for S1–S6.
3 Data
3.1 Precipitation data analysis in S2
The datasets from S2 in 2019 were used to test transfer functions. Geonor T-200B was mounted on a steel pole at about 1.6 m above the surface, which was surrounded by a single-alter shield. Geonor T-200B was used to observe precipitation with a resolution of 0.1 mm SWE and an accuracy of 0.1% (He et al., 2009; Zhang et al., 2015), which had been used by the WMO for the solid precipitation measurement in the SPICE project. A present weather sensor (PWS100) was collocated 4 m beside Geonor T-200B to quantify the precipitation type with a resolution of 0.0001 mm. PWS100 can classify precipitation into nine types, such as rain and snow. The meteorological data were collected every 30 min in this study. The average precipitation intensity and precipitation type data were recorded by PWS100 every 1 min to quantify the precipitation type. Quality control is needed for all data. The process of quality control was also studied by Kochendorfer et al. (2017a) and Zhao et al. (2021). A total of 1,834 events were selected to test the transfer functions and recalibrate the parameters during the study period in 2019, including 907 events (49%) of snowfall, 29 events (2%) of rainfall, and 898 events (48%) of mixed precipitation.
3.2 Datasets from other stations
The datasets from S3, S5, and S6 were obtained from the China Meteorological Data Service Center (http://data.cma.cn). The data require strict quality control in its data management. At S1 and S4, precipitation was observed from the same Geonor T-200B with S2 and corrected by the transfer functions. S1 began to be observed in April 2018. Due to the asynchronicity of the data series among the six stations, we selected consistent observation periods during 2011–2019 at the other five stations to calculate the average annual and seasonal precipitation gradient. To cover precipitation at high altitudes, the datasets, in 2019, from the six stations were also used to calculate the precipitation gradients.
4 Materials and methods
4.1 Precipitation types
PWS100 recorded the precipitation types and precipitation intensity data every 1 min. It can classify precipitation as drizzle, freezing drizzle, rain, freezing rain, snow grains, snowflakes, ice pellets, hail, and graupel. According to the same period temperature measured at AWS in S2, we used 30-min accumulated data recorded by PWS100 to determine the minimum threshold temperature that caused rain and the maximum threshold temperature that caused snow. We assume the temperature between the maximum and the minimum threshold is when mixed precipitation (sleet) occurred.
4.2 Transfer functions
A transfer function of temperature and wind speed introduced by Kochendorfer et al. (2017a) uses all the similarly shielded and unshielded precipitation gauge measurements. Eq. 1 describes the transfer function model:
where CE is the catch efficiency; W is the average wind speed; T is the average air temperature; and a, b, and c are fit to be the data coefficients. The coefficients a= 0.0348, b=1.366, and c=0.779 (Kochendorfer et al., 2017a). Eq. 2 was created for mixed precipitation and snow, as well as the mean wind following Kochendorfer et al. (2017a):
where a, b, and c are also coefficients. The precipitation types were determined by PWS100. Solid precipitation is defined as the air temperature below −0.5°C, and mixed precipitation is defined as the air temperature ranging from −0.5°C to 8°C (Section 4.1). According to Kochendorfer et al. (2017a), the coefficients of solid precipitation (a=0.728, b=0.230, and c=0.336) and those of mixed precipitation (a=0.668, b=0.132, and c=5 0.339) were used in this study.
The average wind speed at the gauge height was 1.09 m s-1. Higher than 1.09 m s-1, the wind speed was replaced by 1.09 m s-1 (Kochendorfer et al., 2017a). To exclude the wind speed of 0 m s-1 (Zhao et al., 2021), local datasets were used to adjust the parameters of transfer functions and the wind speed threshold was reevaluated.
4.3 Assessment of the precipitation amount from the DFIR
Since the DFIR is recommended as the standard for solid precipitation measurement (Goodison et al., 1998), we can calculate the precipitation amount from the DFIR to validate the results of transfer function correction, according to the precipitation observation comparison between the DFIR and Geonor T-200B in Canada (Smith, 2007). The relationship is described as follows:
where CE is the relative catch efficiency; T is the precipitation amount observed from Geonor T-200B; DFIR is the precipitation amount observed from the DFIR gauge; and Ua is the average wind speed at gauge height (m s-1), which can be described as follows (Goodison et al., 1998):
where h is the gauge height, Z0 is the roughness length (0.01 in winter), H is the wind speed measurement height, and UH is the wind speed at the height from the ground.
4.4 Transfer function testing
The tenfold cross-validation reported by Kochendorfer et al. (2018) was applied in this paper. Here, 90% of the data were used to derive the functional coefficients, which were then tested on the remaining 10% of the data. This approach was repeated for 10 iterations, with the assessment results taken as the average values over all 10 iterations (Zhao et al., 2021). The RMSE, mean bias (difference of mean precipitation between two rain gauges), Pearson’s correction coefficient (r), and PE0.1mm (the ratio within the threshold of 0.1 mm to total precipitation events) were used to quantify the corrected performance.
5 Results
5.1 Precipitation type distribution
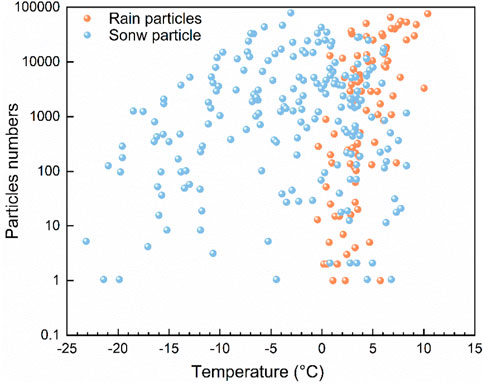
According to the nine precipitation types determined by the present weather sensor and the corresponding temperature data in 2019, we summarized the nine kinds of particles into rain particles and snow particles, and then calculated the daily accumulated particle numbers. The relationship between rain and snow particles and temperature was analyzed. Figure 2 shows the distribution of rain and snow particles with temperature. The snow particles appeared when the temperature was below 8°C, and the rain particles appeared when the temperature was higher than −0.5°C. Therefore, the threshold temperatures of rainfall and snowfall were −0.5 and 8°C, respectively. The mixed precipitation appeared when the temperature was between −0.5°C and 8°C.
5.2 Relationships between the catch efficiency and wind speed and air temperature
It has been found that wind speed has a very significant influence on the catch efficiency, and many transfer functions have been developed in previous studies to reduce this impact (Smith, 2009; Yang, 2014; Wolff and IsaksenPetersen-Overleir, 2015; Kochendorfer et al., 2017a; b; Zhao et al., 2021). Figure 3 shows the relationship between the catch efficiency with the wind speed for different precipitation types. The precipitation type was rainfall when the air temperature was above 8°C. The catch efficiency of rainfall ranged from 0.99 to 1.04 and was not significantly influenced by the wind speed. The mixed precipitation appeared when the air temperature was between −0.5°C and 8°C. When the air temperature was above 0°C, there was still snowfall mainly because the study site was located at a high altitude. The catch efficiency of mixed precipitation ranged from 0.95 to 1.02. The precipitation type was all snowfall when the air temperature was below −0.5°C and the catch efficiency ranged from 0.86 to 1.01. As the wind speed increased, the catch efficiency of snowfall decreased. Among the three precipitation types, the catch efficiency of snowfall was the lowest, indicating that the wind speed had an evident effect.
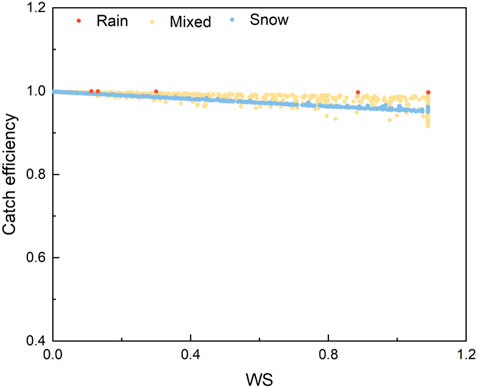
FIGURE 3. Distribution of the catch efficiency for rain, snow, and mixed precipitation with the wind speed.
5.3 Relationship between precipitations observed from Geonor T-200B and DFIR
The measured liquid precipitation data from Geonor T-200B showed a strong correlation with precipitation data derived from the DFIR before correction with transfer functions. The R2 value was approximately 0.99 (Figure 4B). However, the linear relationship for all precipitation and mixed precipitation was scattered with relatively low R2 values of 0.95. Special attention should be paid to solid precipitation, and it is necessary to correct solid precipitation due to the lowest R2 value. The variations in environmental conditions will deduce the correlation coefficients (Chen et al., 2015).
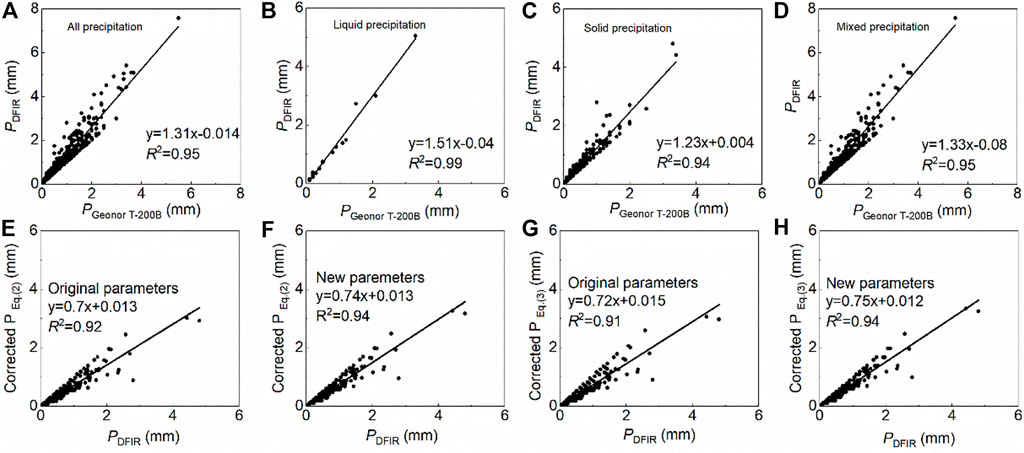
FIGURE 4. Comparison of the precipitation amount observed from Geonor T-200B and derived from the DFIR for precipitation (A), liquid precipitation (B), solid precipitation (C), and mixed precipitation (D) before correction and the comparison between the DFIR and adjusted solid precipitation with original parameters (E, G) using Eqs 2, 3 and new parameters (F, H).
The original and new parameters (given in Section 4.4) were used to correct solid precipitation. A comparison of the adjusted transfer function results is shown in Figure 4. In Figure 4B, the unadjusted precipitation observed from Geonor T-200B was smaller than that from the DFIR. After correction using Eqs 2, 3 with original parameters, the results were more scattered than those using the new parameters. Because the experimental configuration of the original parameters was different from our study site, the precipitation before and after correction was lower than that from the DFIR. This may result from the fact that precipitation from the DFIR was calculated by an empirical equation due to the lack of observed datasets.
5.4 Testing results of Geonor T-200B at S2
Figure 5 showed the comparison of the precipitation amount observed from Geonor T-200B and derived from the DFIR for total precipitation (A), liquid precipitation (B), solid precipitation (C) and mixed precipitation (D) before correction and the comparison between the DFIR and adjusted solid precipitation with original parameters (E, G) using Eqs 2, 3 and new parameters (F, H). There were significant differences between the transfer functions with original parameters and those derived from the local datasets for the Geonor-T200B gauge snowfall measurement (Figure 5). We mainly compared the corrected data using the original and new parameters. After using the new parameters, the accuracy after correction by Eqs 2, 3 was significantly increased, and the RMSE value decreased by 18% and 50% using Eqs 2, 3, respectively. The bias values decreased by 17% and 67%, respectively. The r values for both Eqs 2, 3 increased from 0.96 to 0.97, and the PE0.1mm values for Eq. 3 decreased by 54%. The solid precipitation undercatch reached an average of 7%.
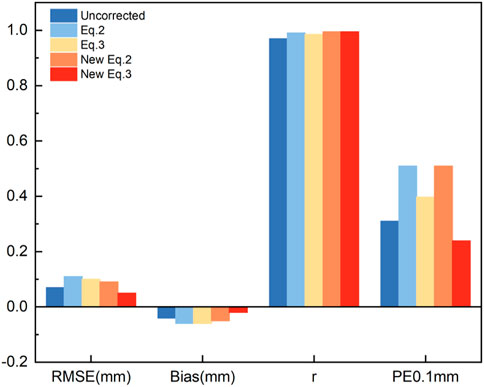
FIGURE 5. RMSE, mean bias, r, and PE0.1mm values of snowfall for Geonor T-200B Eqs 2, 3 were the results calculated by original parameters from Kochendorfer et al. (2017a), and new Eqs 2, 3 were the results calculated by the local datasets using the tenfold cross-validation method.
Better performance was shown for the transfer functions driven by the locally measured data than those using original parameters. The parameters for Eq. 2 calibrating with local data were a=0.011, b=1.661, and c=0.772. The parameters of snowfall for Eq. 3 were a=0.459, b=0.009, and c=0.531 and of mixed precipitation were a=0.665, b=0.106, and c=0.327. The new transfer function parameters were applied to the other observation sites in the Urumqi River Basin.
6 Discussion
6.1 Application to other observation sites in the Urumqi River Basin
In S2, both the transfer functions with adjusted parameters were suitable to correct precipitation. Therefore, the correction with these parameters was applied in S1 and S4 with similar experimental configurations and evaluated results. Since the other two stations did not install PWS100, the precipitation type observation was missing. The 30-min air temperature was used to determine precipitation types. The environmental conditions and altitude of S1 were similar to those of S2. The temperature threshold used the values of −0.5°C and 8°C in S2. As for S4, −2°C and 2°C were used to distinguish precipitation types, which has been widely used in previous studies (Wolff and IsaksenPetersen-Overleir, 2015; Kochendorfer et al., 2017a; Kochendorfer et al., 2017b).
S4 was located at a low altitude with a low share of snowfall, and the wind speed had less influence on it. In contrast, S1 was located on the glacier surface and precipitation was dominated by solid and mixed precipitation. Therefore, we mainly analyzed the corrected results in S1. There were 1,949 precipitation events measured in S1 in 2019, including 583 snowfall events and 1,366 mixed precipitation events. The recalibrated coefficients were applied to correct precipitation using Eqs 2, 3. Figure 6 shows the relationship between the corrected precipitation amount and DFIR precipitation. We found a higher correlation for snowfall corrected with Eq 3 and for mixed precipitation with Eq. 2. The accuracy was significantly increased after correcting with Eqs 2, 3, and the RMSE value decreased by 14% and 37% using Eqs 2, 3, respectively. The bias values decreased by 17% and 49%, respectively. The r values for both Eqs 2, 3 increased from 0.96 to 0.97, and the PE0.1mm values for Eqs 2, 3 decreased by 4% and 8%, respectively (Figure 7). The transfer functions and recalibrated coefficients showed good performance in S1. On an average, the solid precipitation undercatch can be up to 13%.
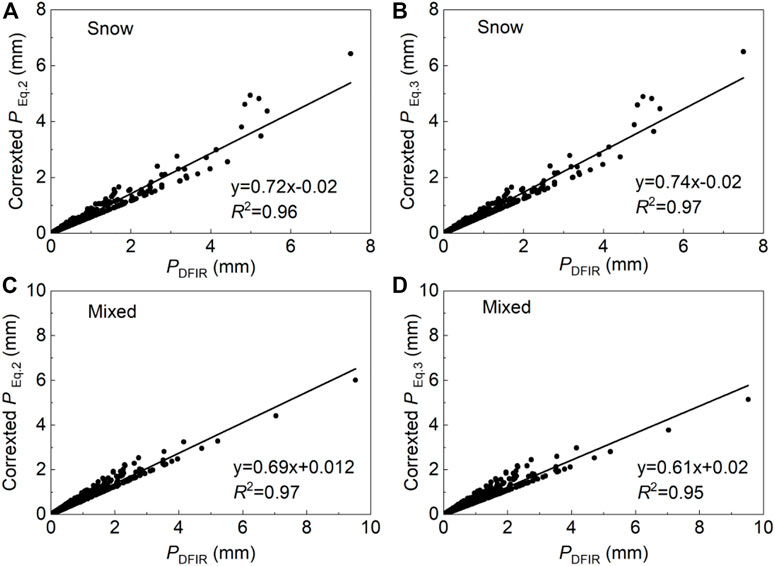
FIGURE 6. Comparison of corrected snow (A, B) and mixed precipitation (C, D) using Eqs 2, 3 with the precipitation derived from the DFIR.
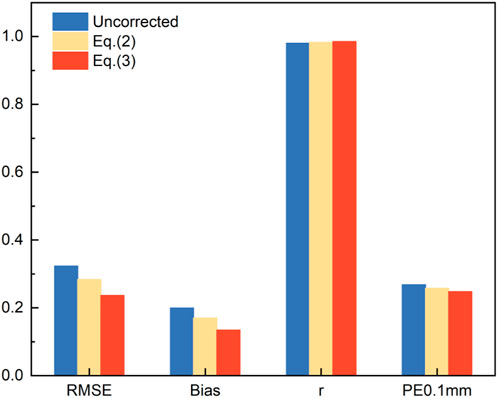
FIGURE 7. RMSE, mean bias, r, and PE0.1mm of snowfall in S1 Eqs 2, 3 are the results calculated by recalibrated parameters in S1.
6.2 Variations of precipitation with the altitude in the Urumqi River Basin
Precipitation data in mountainous regions have large spatio-temporal differences, and the spatial distribution of precipitation is closely related to elevation (Zhang et al., 2021). The precipitation generally increases with the elevation in mountainous regions. In recent years, altitudinal precipitation gradients have been investigated for a large number of mountain ranges (Kotlarski et al., 2012; Ruelland, 2020; Zan et al., 2020; Li et al., 2021). However, because most studies still suffer from a lack of data gathered in higher mountainous regions, the accuracy of the results is still very limited (Marquı́nez et al., 2003; Ward et al., 2011) and the important issues remain unresolved (Roe and O'Neal, 2010). In our study in the Urumqi River Basin, precipitation mainly varies with altitude.
The relationship between the altitude and precipitation was linear. At six meteorological stations, the average daily precipitation gradient was 3 mm km-1 in 2019 (Figure 8A). On an annual scale, the average precipitation gradient was 158 mm km-1 (Figure 8B). The precipitation gradient was subjected to seasonal differences. The largest gradient of 116 mm km–1 (Figure 9B) occurred in summer, and the lowest gradient of 15 mm km–1 occurred in autumn (Figure 9C). It was about 19 mm km–1 in spring (Figure 9A) and winter (Figure 9D). The relationship between precipitation and altitude is complex in arid and cold seasons probably because of the changeable climate in spring and autumn and little snowfall in winter (Chen et al., 2014).
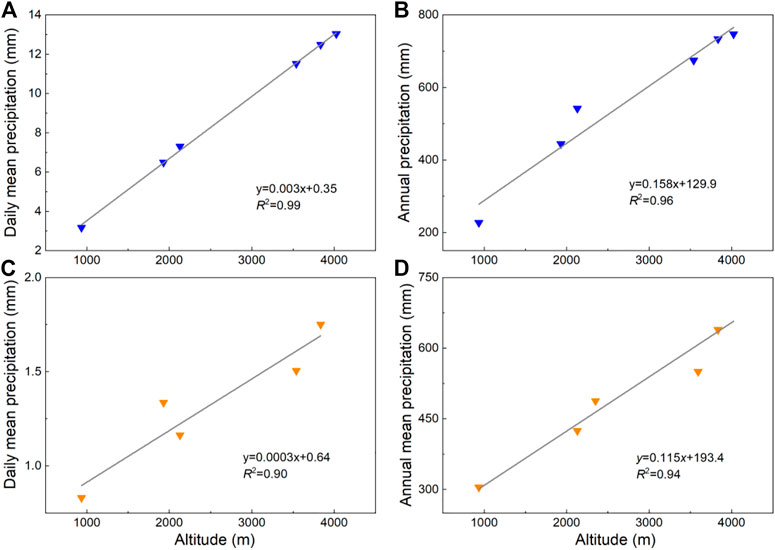
FIGURE 8. Variations of average daily precipitation (A) and annual precipitation (B) along with an altitude in 2019 and daily mean precipitation (C) and annual mean precipitation (D) during 2011–2019.
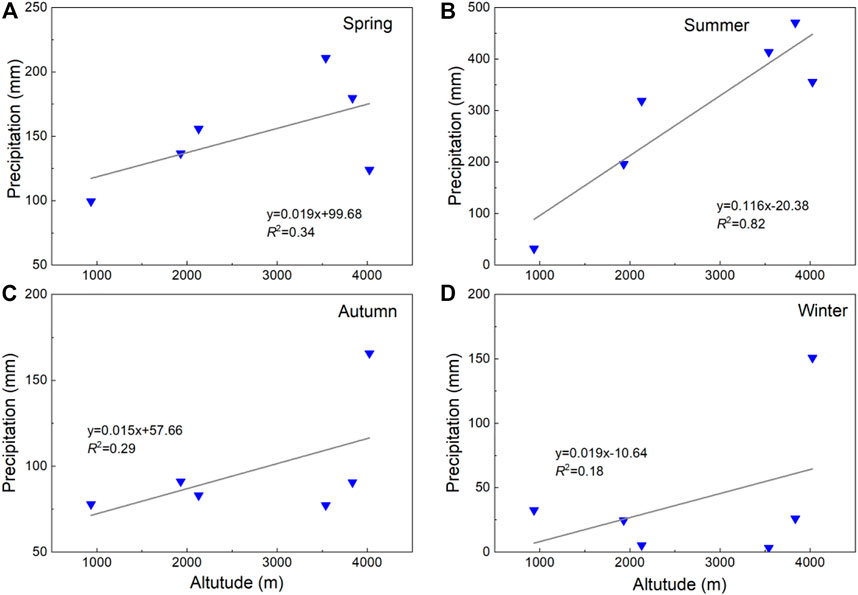
FIGURE 9. Variations of precipitation in Spring (A), Summer (B), Autumn (C) and Winter (D) along with elevation in 2019.
The 1-year duration of the precipitation data is not climatic averages, which is relatively insufficient to evaluate any climatic characteristics. Therefore, the data from S2 to S6 during 2011–2019 were used to recalculate the precipitation gradient. However, precipitation is not covering the glacier surface. From 2011 to 2019, the average daily precipitation gradient was 0.3 mm km-1 (Figure 8C) and the average annual gradient was 115 mm km-1 (Figure 8D). As for the seasonal scale, the largest gradient of 35 mm km–1 (Figure 10B) occurred in summer and the lowest gradient of 1 mm km–1 occurred in winter (Figure 10D). It was about 8 mm km–1 in spring (Figure 10A) and 2 mm km–1 in autumn (Figure 10C).
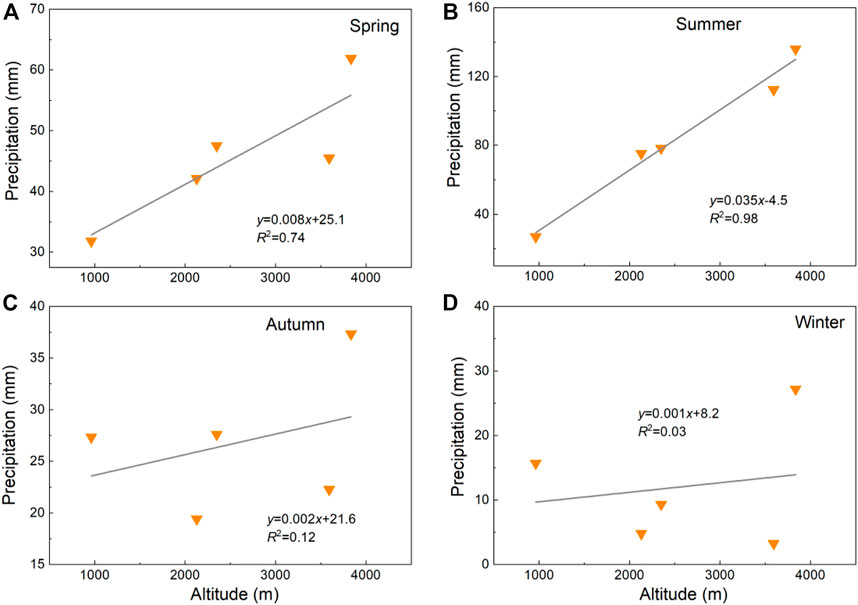
FIGURE 10. Average variations of precipitation in Spring (A), Summer (B), Autumn (C) and Winter (D) along with elevation during 2011-2019.
When considering S6, the precipitation gradient became larger in 2019. This may be because S6 was installed on the glacier surface, and the glacier, as a special underlying surface, would increase the gradient when precipitation transitions from non-glacierized areas to glacierized areas. The glacier surface is characterized by a low heat transfer rate, high reflectivity, high thermal transmittance, and low surface water vapor content (Zhang and Zhou, 2000). It affects precipitation through a combination of cooling effects, glacial wind, and reduced convective cloud condensation height. A previous study found that the contribution of Urumqi Glacier No .1 accounts for 5.6% of the total annual precipitation as a special underlying surface (Zhang and Zhou, 2000). As a result, the precipitation gradient increased.
The precipitation gradient of our study was higher than that of previous studies. Liu et al. (2011) reported PG was 63 mm km-1 on the northern slope of the Tianshan Mountains using the Tropical Rainfall Measuring Mission (TRMM) and ground data, although the altitudinal gradient was much lower than the observed value due to the coarse spatial resolution of TRMM data and other reasons. Li et al. (2018) used data gathered in the seven meteorological stations in the Urumqi River Basin (1961–2016) to find a PG of 32.6 mm km-1, far lower than our results. It may be attributed to the lower altitude of meteorological stations. It was lower than the results of the Hulu watershed in the Qilian Mountains of China in 2010 and 2011. However, the average annual precipitation gradient during 1960–2011 of upstream regions below an elevation of 3,400 m in the Heihe mainstream watershed was similar to our average annual value during 2011–2019 (Chen et al., 2014).
7 Conclusion
This study explored the influence of environmental conditions in high-altitude glacierized areas on the accurate measurement of precipitation by applying the WMO-SPICE transfer functions from Kochendorfer et al. (2017b) at the site in the snout of UG1 and using the local datasets to recalibrate parameters. The methods and recalibrated parameters have been applied to other automatic meteorological stations built in the Urumqi River Basin of the Tianshan Mountains to correct the solid precipitation data. Then, the precipitation gradients were calculated using the corrected precipitation from three AWSs and the precipitation datasets from three national meteorological stations in the Urumqi River Basin. The main results are summarized in the following paragraph.
The experimental configuration and environmental conditions influence the precipitation measurement and correction. Due to the difference in our instrument configurations and disposition with the standard site recommended by WMO (2014), the original transfer function parameters were not fit for our datasets. After using our local datasets in S2 to recalibrate the parameters, the accuracy after correction by Eqs 2, 3 was significantly increased. The RMSE values decreased by 18% and 50% using Eqs 2, 3, respectively; the bias values decreased by 17% and 67%, respectively; the r values for both Eqs 2, 3 increased from 0.96 to 0.97, respectively; and the PE0.1mm values for Eq. 3 decreased by 90%. The solid precipitation in S2 undercatch reached an average of 7%. In S1, which was dominated by solid and mixed precipitation, the RMSE value decreased by 14% and 37%, respectively; the bias value decreased by 17% and 49%, respectively; and the solid precipitation undercatch can reach up to 13%.
The precipitation gradients were evident on annual and seasonal scales in the Urumqi River Basin. A good relationship between yearly precipitation and altitude was found in 2019 in the six meteorological stations ranging from 935 to 4,025 mm with a value of 158 mm km-1 and during 2011–2019 in five meteorological stations ranging from 935 to 3,835 m with a value of 115 mm km-1 in the Urumqi River Basin. On a seasonal scale, the largest gradient of 116 mm km-1 occurred in summer and the lowest gradient of 15 mm km-1 occurred in autumn from the six meteorological stations. As for the average seasonal precipitation during 2011–2019, the largest gradient of 35 mm km-1 occurred in summer and the lowest gradient of 1 mm km-1 occurred in winter. When considering the precipitation on the glacier surface, the precipitation gradient was increased.
Data availability statement
The original contributions presented in the study are included in the article/Supplementary Material. Further inquiries can be directed to the corresponding author.
Author contributions
Conceptualization: YJ and ZL; data curation: FW and PC; formal analysis: YJ; methodology: YJ; resources: YJ, ZL, PC and FW; software: YJ; visualization: YJ; writing the original draft: YJ; revision: YJ and ZL.
Funding
This study was supported by the Second Tibetan Plateau Scientific Expedition and Research (2019QZKK0201), the Strategic Priority Research Program of Chinese Academy of Sciences (Class A) (XDA20020102), and the Innovative Research Groups of the National Natural Science Foundation (41721091).
Conflict of interest
The authors declare that the research was conducted in the absence of any commercial or financial relationships that could be construed as a potential conflict of interest.
Publisher’s note
All claims expressed in this article are solely those of the authors and do not necessarily represent those of their affiliated organizations, or those of the publisher, the editors, and the reviewers. Any product that may be evaluated in this article, or claim that may be made by its manufacturer, is not guaranteed or endorsed by the publisher.
References
Chen, R. S., Liu, J. F., Kang, E. S., Yang, Y., Liu, Z. W., Song, Y. X., et al. (2015). Precipitation measurement intercomparison in the qilian mountains, north-eastern Tibetan plateau. Cryosphere 9, 1995–2008. doi:10.5194/tc-9-1995-2015
Chen, R., Song, Y., Kang, E., Han, C., Liu, J., Yang, Y., et al. (2014). A cryosphere-hydrology observation system in a small alpine watershed in the Qilian Mountains of China and its meteorological gradient. Arct. Antarct. Alp. Res. 46 (2), 505–523. doi:10.1657/1938-4246-46.2.505
Daly, C., Smith, J. W., Smith, J. I., and McKane, R. B. (2007). High-resolution spatial modeling of daily weather elements for a catchment in the Oregon Cascade Mountains, United States. J. Appl. Meteorol. Climatol. 46, 1565–1586. doi:10.1175/JAM2548.1
Goodison, B. E., Louie, P. Y. T., and Yang, D. (1998). “WMO solid precipitation measurement intercomparison: Final report,” WMO/TD 872 (Geneva, Switzerland: World Meteorological Organization).
Hanson, C. L. (2007). Precipitation catch measured by tue Wyoming shield and tue dual-gage SYSTEM1. J. Am. Water Resour. Assoc. 25, 159–164. doi:10.1111/j.1752-1688.1989.tb05677.x
He, X., Ye, B., and Ding, Y. (2009). Bias correction for precipitation measurement in tanggula mountain Tibetan plateau. Adv. Water Sci. 20, 403–408. (In Chinese).
Jia, Y., Li, Z., Xu, C., Jin, S., and Deng, H. (2020). A comparison of precipitation measurements with a PWS100 laser sensor and a geonor T-200B precipitation gauge at a nival glacial zone in eastern tianshan, central Asia. Atmosphere 11 (10), 1079. doi:10.3390/atmos11101079
Kidd, C., and Huffman, G. (2011). Global precipitation measurement. Meteorol. Appl. 18, 334–353. doi:10.1002/met.284
Kochendorfer, J., Nitu, R., Wolff, M., Mekis, E., Rasmussen, R., Baker, B., et al. (2017a). Analysis of single-Alter-shielded and unshielded measurements of mixed and solid precipitation from WMO-SPICE. Hydrol. Earth Syst. Sci. 21 (7), 3525–3542. doi:10.5194/hess-21-3525-2017
Kochendorfer, J., Nitu, R., Wolff, M., Mekis, E., Rasmussen, R., Baker, B., et al. (2018). Testing and development of transfer functions for weighing precipitation gauges in WMO-SPICE. Hydrol. Earth Syst. Sci. 22 (2), 1437–1452. doi:10.5194/hess-22-1437-2018
Kochendorfer, J., Rasmussen, R., Wolff, M., Baker, B., Hall1, M. E., Meyers, T., et al. (2017b). The quantification and correction of wind-induced precipitation measurement errors. Hydrol. Earth Syst. Sci. 21 (4), 1973–1989. doi:10.5194/hess-21-1973-2017
Kong, Y., and Pang, Z. (2016). A positive altitude gradient of isotopes in the precipitation over the Tianshan Mountains: Effects of moisture recycling and sub-cloud evaporation. J. Hydrol. 542, 222–230. doi:10.1016/j.jhydrol.2016.09.007
Kotlarski, S., Bosshard, T., Lüthi, D., Pall, P., and Schär, C. (2012). Elevation gradients of European climate change in the regional climate model COSMO-CLM. Clim. Change 112, 189–215. doi:10.1007/s10584-011-0195-5
Larson, L. W., and Peck, E. L. (1974). Accuracy of precipitation measurements for hydrologic modeling. Water Resour. Res. 10, 857–863. doi:10.1029/wr010i004p00857
Li, G., Yu, Z., Wang, W., Ju, Q., and Chen, X. (2021). Analysis of the spatial distribution of precipitation and topography with GPM data in the Tibetan Plateau. Atmos. Res. 247, 105259. doi:10.1016/j.atmosres.2020.105259
Li, K., Zhong, X., Jiang, Y., Li, J., Li, L., and Zhou, P. (2018). Study on vertical gradient change of air temperature and precipitation in Urumqi River basin during 1961–2016. J. Glaciol. Geocryol. 40 (3), 607–615. (in Chinese).
Liu, J., Chen, R., Qin, W., and Yang, Y. (2011). Study on the vertical distribution of precipitation in mountainous regions using TRMM data. Adv. Water Sci. 22, 447–454. (in Chinese).
Lu, X., Tang, G., Wang, X., Liu, Y., Jia, L., Xie, G., et al. (2019). Correcting GPM IMERG precipitation data over the tianshan mountains in China. J. Hydrol. 575, 1239–1252. doi:10.1016/j.jhydrol.2019.06.019
Marquı́nez, J., Lastra, J., and Garcı́a, P. (2003). Estimation models for precipitation in mountainous regions: The use of GIS and multivariate analysis. J. Hydrol. 270 (1-2), 1–11. doi:10.1016/S0022-1694(02)00110-5
Nitu, R., Rasmussen, R., and Baker, B. (2012). WMO intercomparison of instruments and methods for the measurement of solid precipitation and snow on the ground: Organization of the experiment. Brussels, Belgium: World Meteorological Organization.
Pan, X., Yang, D., Li, Y., Barr, A., Helgason, W., Hayashi, M., et al. (2016). Bias Corrections of precipitation measurements across experimental sites in different ecoclimatic regions of Western Canada. Cryosphere 10, 2347–2360. doi:10.5194/tc-10-2347-2016
Pierre, A., Jutras, S., Smith, C., Kochendorfer, J., Fortin, V., and Anctil, F. (2019). Evaluation of catch efficiency transfer functions for unshielded and single-alter-shielded solid precipitation measurements. J. Atmos. Ocean. Technol. 36, 865–881. doi:10.1175/JTECH-D-18-0112.1
Roe, G. H., and O’Neal, M. A. (2010). The response of glaciers to intrinsic climate variability: Observations and models of late-holocene variations in the pacific northwest. J. Glaciol. 55 (193), 839–854. doi:10.3189/002214309790152438
Ruelland, D. (2020). Should altitudinal gradients of temperature and precipitation inputs be inferred from key parameters in snow-hydrological models? Hydrol. Earth Syst. Sci. 24 (5), 2609–2632. doi:10.5194/hess-24-2609-2020
Sevruk, B., Hertig, J. A., and Spiess, R. (1991). The effect of a precipitation gauge orifice rim on the wind field deformation as investigated in a wind tunnel. Atmos. Environ. 25, 1173–1179. doi:10.1016/0960-1686(91)90228-Y
Sevruk, B., and Nespor, V. (1994). “The effect of dimensions and shape of precipitation gauges on the wind-induced error,” in Global precipitations and climate change. Editors M. Desbois, and F. Désalmand (Berlin/Heidelberg, Germany: Springer), 231–246. doi:10.1007/978-3-642-79268-7_14
Smith, C. D. (2007). “Correcting the wind bias in snowfall measurements made with a Geonor T-200B precipitation gauge and Alter wind shield,” in Proceedings of the 87th American Meteorological Society Annual Meeting, San Antonio, TX, USA, January 2007, 13–18.36
Smith, C., Ross1, A., Kochendorfer, J., Earle, M. E., Wolff, M., Buisán, S., et al. (2020). Evaluation of the WMO Solid Precipitation Intercomparison Experiment (SPICE) transfer functions for adjusting the wind bias in solid precipitation measurements. Hydrol. Earth Syst. Sci. 24, 4025–4043. doi:10.5194/hess-24-4025-2020
Smith, C. (2009). “The relationships between snowfall catch efficiency and wind speed for the Geonor T-200B precipitation gauge utilizing various wind shield configurations,” in Proceedings of the 77th Western Snow Conference, Canmore, Alberta, April 2009, 115–121.
Sugiura, K., Ohata, T., and Yang, D. (2006). Catch characteristics of precipitation gauges in high-latitude regions with high winds. J. Hydrometeorol. 7, 984–994. doi:10.1175/JHM542.1
Tang, G., Zeng, Z., Long, D., Guo, X., Yong, B., Zhang, W., et al. (2016). Statistical and hydrological comparisons between TRMM and GPM level-3 products over a midlatitude basin: Is day-1 IMERG a good successor for TMPA 3B42V7? J. Hydrometeorol. 17 (1), 121–137. doi:10.1175/JHM-D-15-0059.1
Thériault, J., Rasmussen, M., Ikeda, R., K., and Landolt, S. (2012). Dependence of snow gauge collection efficiency on snowflake characteristics. J. Appl. Meteor. Climatol. 51, 745–762. doi:10.1175/JAMC-D-11-0116.1
Wang, L., Chen, R., Song, Y., Yang, Y., Liu, J., Han, C., et al. (2017). Precipitation–altitude relationships on different timescales and at different precipitation magnitudes in the Qilian Mountains. Theor. Appl. Climatol. 134, 875–884. doi:10.1007/s00704-017-2316-1
Ward, E., Buytaert, W., Peaver, L., and Wheater, H. (2011). Evaluation of precipitation products over complex mountainous terrain: A water resources perspective. Adv. Water Resour. 34, 1222–1231. doi:10.1016/j.advwatres.2011.05.007
Weiss, L. (1961). Relative catches of snow in shielded and unshielded gages at different wind speeds. Mon. Weather Rev. 89, 397–400. doi:10.1175/1520-0493(1961)089<0397
WMO (2014). Guide to meteorological instruments and methods of observation. 8th. Geneva, Switzerland: World Meteorological Organization.
Wolff, M. A., Isaksen, K., Petersen-Overleir, A., Odemark, K., Reitan, T., and Brækkan, R. (2015). Derivation of a new continuous adjustment function for correcting wind-induced loss of solid precipitation: Results of a Norwegian field study. Hydrol. Earth Syst. Sci. 19, 951–967. doi:10.5194/hess-19-951-2015
Yang, D. (2014). Double-fence intercomparison reference (DFIR) vs.Bush gauge for ‘‘true’’ snowfall measurement. J. Hydrol. 509, 94–100. doi:10.1016/j.jhydrol.2013.08.052
Yang, D., Jiang, T., and Zhang, Y. (1988). Analysis and correction of errors in precipitation measurement at the head of Urumqi river, Tianshan. J. Glaciol. Geocryol. 10, 384–396. (In Chinese).
Yang, D., Kane, D. L., Hinzman, L. D., Goodison, B. E., Metcalfe, J. R., Louie, P. Y. T., et al. (1995). Accuracy of tretyakov precipitation gauge: Result of wmo intercomparison. Hydrol. Process. 9, 877–895. doi:10.1002/hyp.3360090805
Yang, D. Q., Kane, D. L., Hinzman, L. D., Goodison, B. E., Metcalfe, J. R., Louie, P. Y. T., et al. (2000). An evaluation of the Wyoming gauge system for snowfall measurement. Water Resour. Res. 36, 2665–2677. doi:10.1029/2000WR900158
Yang, D., Shi, Y., Kang, E., Zhang, Y., and Yang, X. (1991). Results of solid precipitation measurement intercomparison in the Alpine area of Urumqi River basin. Chin. Sci. Bull. 36, 1105–1109.
Yang, Y., and Luo, Y. (2014). Evaluating the performance of remote sensing precipitation products CMORPH, PERSIANN, and TMPA, in the arid region of northwest China. Theor. Appl. Climatol. 118 (3), 429–445. doi:10.1007/s00704-013-1072-0
Zan, J., Fang, X., Kang, J., Li, X., and Yan, M. (2020). Spatial and altitudinal variations in the magnetic properties of eolian deposits in the northern Tibetan plateau and its adjacent regions: Implications for delineating the climatic boundary. Earth Sci. Rev. 208, 103271. doi:10.1016/j.earscirev.2020.103271
Zhang, D., and Zhou, S. (2000). Quantitative analysis of the glacial effect on precipitation of glacier No .1 at the headwaters of the Urumqi River, tianshan mountains. J. Glaciol. Geocryol. 22 (22), 243–249. (in Chinese).
Zhang, G., Su, X., Ayantobo, O. O., Feng, K., and Guo, J. (2021). Spatial interpolation of daily precipitation based on modified adw method for gauge-scarce mountainous regions: A case study in the shiyang River basin. Atmos. Res. 247, 105167. doi:10.1016/j.atmosres.2020.105167
Zhang, L., Zhao, L., Xie, C., Liu, G., Gao, L., Xiao, Y., et al. (2015). Intercomparison of solid precipitation derived from the weighting rain gauge and optical instruments in the interior qinghai-Tibetan plateau. Adv. Meteorol. 936724, 1–11. doi:10.1155/2015/936724
Keywords: glacierized basin, precipitation measurement, automatic weather stations, precipitation gradient, weighing precipitation gauges
Citation: Jia Y, Li Z, Wang F and Chen P (2023) Correction of precipitation measurement for weighing precipitation gauges in a glacierized basin in the Tianshan Mountains. Front. Earth Sci. 11:1115299. doi: 10.3389/feart.2023.1115299
Received: 03 December 2022; Accepted: 28 February 2023;
Published: 14 March 2023.
Edited by:
Andreas Franz Prein, National Center for Atmospheric Research (UCAR), United StatesCopyright © 2023 Jia, Li, Wang and Chen. This is an open-access article distributed under the terms of the Creative Commons Attribution License (CC BY). The use, distribution or reproduction in other forums is permitted, provided the original author(s) and the copyright owner(s) are credited and that the original publication in this journal is cited, in accordance with accepted academic practice. No use, distribution or reproduction is permitted which does not comply with these terms.
*Correspondence: Zhongqin Li, bGl6cUBsemIuYWMuY24=
 Yufeng Jia
 Zhongqin Li1,2*
