 Amiya Baruah
 Manas Kumar Roy3
 Nibir Mandal
 Santanu Misra
95% of researchers rate our articles as excellent or good
Learn more about the work of our research integrity team to safeguard the quality of each article we publish.
Find out more
ORIGINAL RESEARCH article
Front. Earth Sci. , 22 December 2023
Sec. Petrology
Volume 11 - 2023 | https://doi.org/10.3389/feart.2023.1115103
Petrological assimilation is a key process in the evolution of high-grade metamorphic terrains in the continental crusts. This study examines the mechanisms of such macroscopic assimilation between felsic (F) and mafic (M) constituents as two petrologically interacting continuum phases, as observed in the Chotanagpur Granite Gneissic Complex (CGGC), India, which underwent amphibolite to granulite facies metamorphism (∼775 to 900°C and 7 to 11 kb) between from the Paleoproterozoic to the late Mesoproterozoic. From field investigation we could recognized four interface patterns: planar, wavy, fingering and incoherent, which are generated at the interface between the F and M units. We have adopted the Turing type reaction-diffusion (RD) approach, which is a well established theoretical model to interpret any complex auto-regulatory pattern in natural and physical sciences, to understand the physics of the self-organizing interface geometries observed across the CGGC. The RD model findings suggest that these patterns are constrained by a combination of: diffusion coefficients (DF, DM) of F and M, a linear or non-linear reaction term (R) that describes phase interactions and a pinning field (W) that introduces microscale heterogeneity. For linear interactions, F − M undergo homogeneous mixing and show planar/wavy interfaces, when DF = DM and W = 0. The mixing turns heterogeneous as DF ≠ DM and W > 0, resulting in phase boundary migration with a fingering pattern. Non-linear reaction coupling enhances heterogeneous mixing and produces incoherent phase boundaries where F-phases host relics of M-phases, following a power-law size distribution. Striking similarities of interface patterns and fractal dimensions estimated from model and CGGC validate the proposed mechanism of macroscopic petrological assimilation. We argue that RD model provides a new insight into the genesis of hybrid rocks in metamorphic terrains.
The continental crust is a storehouse of geological events that have shaped the landmass architecture of the Earth, continuously evolving in time. Understanding the complex chemical as well as physical mechanisms of crust formation is one of the key challenges in solid earth geosciences. Despite substantial advancement in crustal segregation studies (Brown and Rushmer, 2006; Cruden and Weinberg, 2018), there is a serious need for theorizing the post-segregation processes involved in the transformation of petrologically heterogeneous continental masses on geological time scales. The present article aims to address a fundamental question of petrological mixing in the evolution of granitic terrains that share a major part of old continental cratons.
The process of petrological assimilation, often mediated by extensive chemical interactions between the participating lithological components of different varieties is extensively documented from high-grade metamorphic terrains (Reiners et al., 1995; Kemp et al., 2007; Solano et al., 2012). The solid-melt interactions is a well-accepted model on the origin of hybrid or macroscopically composite rocks consisting of felsic and varying mafic domains, often called migmatites (Brown, 1973; Brown, 1994; Johannes and Gupta, 1982; Sawyer, 1987; Sawyer, 2010; Milord et al., 2001; Ashworth, 2012; Misra et al., 2014). From thermodynamic calculations of mineral-phase equilibria, several reaction schemes have been proposed to show the petrological conditions of melt generation, resulting in migmatization of rocks at elevated pressures and temperatures (Grant, 1985; Vernon, 1999; Rosenberg and Riller, 2000; Brown, 2007; Bartoli, 2017). However, most of these studies primarily focus upon the problem of melt sources, giving little emphasis on the mechanism of solid-melt interactions, which is the deciding process in forming characteristic macroscopic structural features of high-grade terrains (Brown, 1995; Weinberg et al., 2015). Solid-state interaction, on the other hand, has been recognized as another effective assimilation process involved in the formation of gneisses and other mixed rock types in metamorphic terrains (Sederholm, 1967; Mehnert, 1968; Ghosh and Sengupta, 1999; Diener et al., 2008). Substantial evidence for sub-solidus interactions of contrasting petrological entities, such as felsic and mafic rocks, in many migmatites indicate a non-anatectic transformation of the system (Lindh and Wahlgren, 1985; Chavagnac et al., 1999). From the close association of gneisses in migmatites and diatexite, Flinn (1995) ruled out the possibility of melting, arguing that the metamorphic grade was too low for melting, and favoured the idea of solid-state grain-growth recrystallization. Based on Fe and Ti-rich minerals, CO2-rich fluid inclusions and REE augmentation, Whitney and Irving (1994) distinguished between leucosomes of anatectic and subsolidus origin, and explained the spatial coexistence of both in the same petrological setting. Several workers predicted sub-solidus conditions for the formation of migmatites and gneisses using textural and macroscopic structural criteria, such as partially assimilated mafic bodies in granite gneisses (Lindh and Wahlgren, 1985; Plümper and Putnis, 2009).
Theorizing these interactions between two petrological components in a continuum scale can be a potential approach to understand their assimilation process in metamorphic terrains. A remarkable advantage of this macroscopic approach is that the interactions can be theorized without inspecting the grain scale phenomena, as successfully employed in material sciences (Vittal and Quah, 2017). In this study, we present evidence from natural observations and numerical models to show such interaction as a feasible mechanism for petrological assimilation in high-grade metamorphic terrains. We conceptualize the problem of assimilation within a framework of the reaction-diffusion (RD) theory (Dybkov, 2002), which has widespread applications in physical, chemical, biological and engineering systems to deal with self-regulated and diffusion-controlled spatio-temporal pattern formation (del Castillo-Negrete et al., 2003; Baruah et al., 2014; Liu et al., 2023). RD modelling fundamentally combines the diffusion equation with a reaction term that macroscopically describes the chemical interactions between two materials, excluding any micro-level process (May, 1976). The seminal work by Turing (1952) showed that chemical systems, dominated by reaction and diffusion, involve a mutual competition between the two processes that trigger instabilities across the phase interface, forming complex patterns.
We examine the interaction between two end-member petrological (i.e., felsic and mafic) entities in granite gneisses (Słaby and Martin, 2008) and model the growth kinetics of felsic phases at the expense of the mafic phases, as a manifestation of the competition between the temporal growth rates of mass transport and spatial mass diffusivity. Although both the phases contain a set of reactants with similar kinetics, the contrast in their diffusional properties guides the phase with higher diffusivity to firmly control the pattern of inter-phase interaction (Yang et al., 2002). Our theoretical consideration is pivoted on the assumption that such assimilation in high-grade metamorphic conditions occurs when the local thermodynamic conditions allow the two rocks to endure a chemical reaction. The felsic and mafic petrological units are considered as two continuum phases, which represent the bulk diffusional properties of their mineral aggregates as discussed later.
The present study focuses upon the mechanisms of diffusional assimilation between the two continuum (i.e., the mafic and felsic) phases on a geological time scale, with an objective to investigate the petrological mixing process in a fairly large metamorphic terrain. This article builds a new theoretical approach for explaining such processes in the framework of reaction-diffusion (RD) dynamics. The coupled RD model is used to explain various types of assimilation structures produced by the interactions of the two participating phases, as applicable to many metamorphic terrains. We support our model results with field examples from the Chotanagpur Granite Gneissic Complex (CGGC) in Eastern India that suggest interactions between felsic and mafic units in a strongly unsteady state, leading to fractal geometry of their interface. We introduce an inherent micro-scale heterogeneity in the system as pinning disorder (explained later) in our model. The model also demonstrates the key factors controlling the evolution of interface patterns by phase boundary migration and predicts their fractal characteristics.
We studied the macroscopic assimilation of two distinct petrological phases: 1) light coloured felsic (F) materials, and 2) the dark coloured mafic (M) rocks in the CGGC (see Supplementary Material Section S1 for details). This vast metamorphic terrain witnessed amphibolites to granulite facies metamorphism, thus reaching an estimated pressure-temperature condition of 7 to 11 kb and ∼775 to 900°C, respectively (Chatterjee et al., 2008). The granitic materials or felsic (F) phase consists predominantly of plagioclase and quartz, with biotite, K-feldspar and apatite occurring as the minor minerals. The mafic (M) components primarily represent the coarse-grained amphibolites composed of amphiboles and plagioclase feldspar as well as some biotite, quartz and titanite minerals. We examined their macroscopic assimilation and hybridization mechanisms from field observations. The qualitative assessment of the colour intensity and spatial distribution between these two end-member petrological phases suggest that the mafic phase progressively underwent transformations into silica-rich phases in course of mixing with quartzo-feldspathic materials. The close spatial relationship between F- and M-phases involving their mutual assimilation and hybridization forms a range of distinctly identifiable patterns on outcrop scales. It is to note that hybridized mafic units are qualitatively distinctive from their pure counterpart in terms of their differences in colour shades and mineral contents (Figure 1, also see Supplementary Figure S2). Discrete pods and lenses of mafic rocks are left as relicts due to partial assimilation in the vast granitic host. From such varying degrees of assimilation, it was possible to classify these mafic units into two petrological categories: (i) pure mafic constituents with little or no petrological mixing (M1), and ii) a hybrid product (M2) with substantial mixing with quartzofeldspathic constituents and contains more of quartz and titanite minerals than the M1-phase. M1 and M2 often coexist in the gneissic host with diffuse and gradational boundaries (Figures 1A, B), preserving pre-assimilation internal tectonic fabrics of penetrative foliations. We use a digital image processing method (see Supplementary Material Section S2 for details) to map the phase boundaries, which reveal a continuous spectrum of phase weight index from the felsic (F) host to M1, through M2. Such progressive transitions in mafic units suggest that M2 bodies were derived from M1, intermediated by progressive petrological assimilation with the F phase. Extreme assimilation resulted in near-complete digestion of M1, leaving isolated mafic materials as relic islands as well as disjointed arrays of thin layers and pods within the felsic matrix. An analysis of their size in small domains shows a large variation, ranging from 0.57 cm2 to 3150 cm2. Their aspect ratio, calculated from the length to width proportion (AR), also varies on a wide spectrum, from 1 to
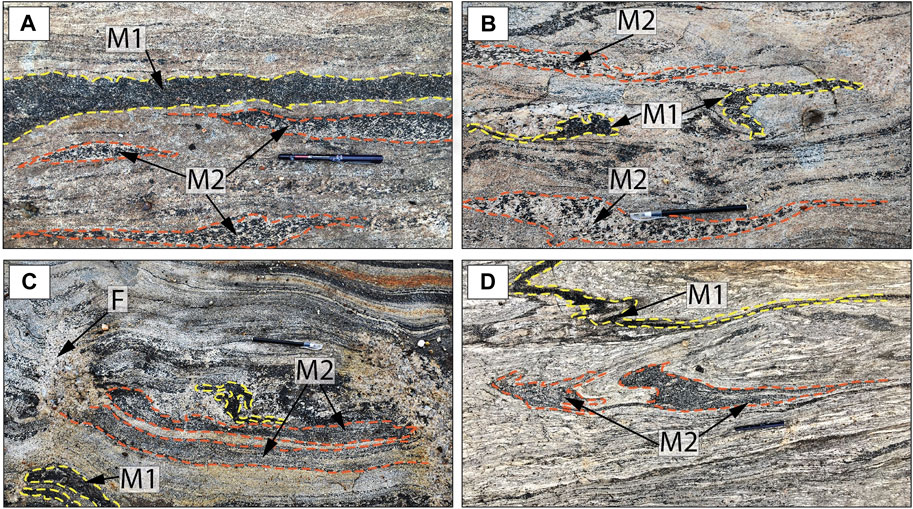
FIGURE 1. Hybridization of pre-existing mafic rocks with felsic rocks due to their mutual reaction as observed in CGGC. (A, B) Heterogeneous spatial distribution of M1 (less hybridized domains that largely retain their initial topology) and M2 (extreme alteration and often near-completely digested) masses in the felsic (F) host. (C) Partially digested mafic boudinaged layers by quartzofeldspathic materials emplaced preferentially in the neck zone of the structure. (D) Folded mafic layers within granitic rocks, showing varying degree of assimilation in their limb and hinge regions. In both C and D the pre-existing M-layers could be reconstructed only from their preserved outlines due to extreme assimilation.
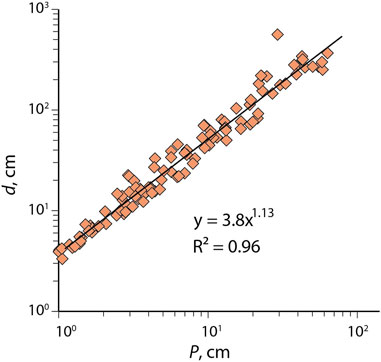
FIGURE 2. Diameter (d) versus perimeter (P) plots on a log-log space, showing the size distribution of mafic relics observed in the CGGC. The linear best-fit suggests a power-law size distribution. D = 1.13 is the fractal dimension of the size distribution. R2 indicates the correlation coefficient.
Assimilation processes are equally observed along phase interfaces in association with pre-existing deformed structures that are initially triggered by mechanical instabilities such as boudins and folds. For example, large boudinaged mafic layers show structural signatures of syntectonic hybridization of boudins with varying lengths (∼40 cm to a few meters) and thicknesses (∼20 to 90 cm). Felsic (F) materials emplaced preferentially in the pinched zones of boudins and assimilated the mafic (M) units, retaining their internal structural features, e.g., foliation drags (Figure 1C). We estimated the degree of assimilation considering the area percentage (ϕ) of petrological modification of M-phase, which yielded ϕ in the range ∼ 35% to 82%. However, in places, we noted ϕ = 100%, implying the M-phases are completely hybridized by the F-phases, where their existence could only be detected from their preserved structural outlines in the host. Similarly, we also observed folded mafic layers in granitic hosts that display structural imprints of their intense assimilation with the host, such as thin and discontinuous relic layers at their limbs and relatively thick and irregular masses in the hinge regions (Figure 1D). However, it is important to note that such folds occur on much larger wavelengths than those produced by the RD-driven assimilation, implying that the two processes hardly influenced each other.
Our field observations, as discussed above, suggest progressively reducing volume of the M-phases due to their reaction-assisted assimilation by F-phases (see Supplementary Figure S2), evident from their phase boundary migration. In the following section, we present a set of field examples to demonstrate the patterns produced by phase boundary migration and explore them as a proxy to interpret the assimilation mechanism.
In the field, the macroscopic interactions between the F- and M-phases are manifested in varying geometrical patterns along their boundaries. We used a phase mapping technique to detect the phase interface from the field photographs for their geometrical analysis and quantitative evaluation of phase assimilation across the interface. Such analysis shows the relative across-interface spatial variation of the felsic and mafic mineralogical constituents in the two phases, hereafter called as phase boundaries. Four types of phase boundary patterns, Type I (planar), Type II (wavy), Type III (fingering) and Type IV (incoherent) could be recognized, as shown in Figure 3.
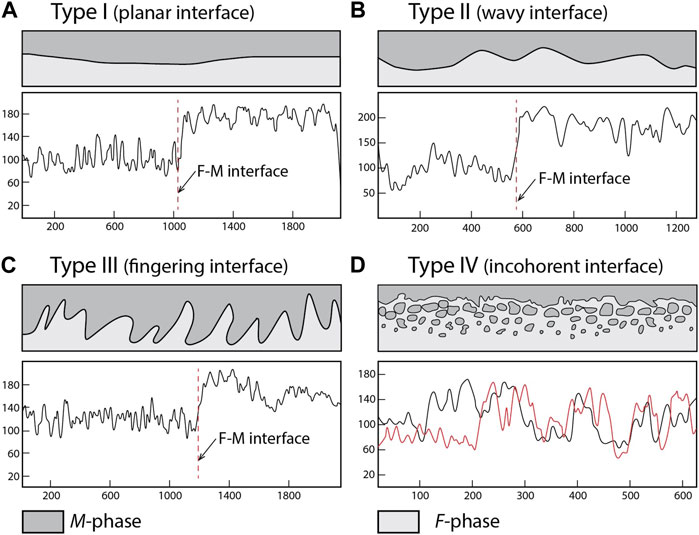
FIGURE 3. A schematic illustration of the four phase interface patterns between M and F domains. In each panel the upper sketch represents a simplistic outline of the corresponding interface geometry. (A) Type I: planar interface; (B) Type II: wavy interface, (C) Type III: interface with fingering of F-phase into M-domains; (D) Type IV: incoherent interface containing large numbers of isolated mafic relics. Lower panels show composition profiles across the F − M phase interface. Type I to III interfaces show qualitatively similar compositional profiles, with a sharp change across the phase boundary. In contrast, Type IV shows a broad, irregular variation. Black and red lines represent composition profiles derived from their respective interface types obtained from the CGGC, and are marked as dotted lines in Figure 4. The units on the horizontal axis show length dimension (in mm) whereas the vertical axis represents the relative colour intensity across the interface.
Type I forms nearly planar first-order geometry of the phase interface, containing locally low-amplitude irregularities (∼2 to 7 mm) with large wavelengths (>15 cm) (Figure 4A). The compositional profiles derived from the corresponding phase map typically show sharp compositional variations across the F-M domain boundaries (Figure 3A). F − M boundaries can also display a multi-ordered irregular geometry, suggesting a strongly heterogeneous digestion of M-by F-phases to produce either a Type II (Figures 3B, 4B) and/or a Type III pattern (Figures 3C, 4C). We could recognize three-orders of waves with wave numbers of 0.08, 0.4 and 0.8 (units in cm−1) to constitute Type II wavy patterns. However, their high-resolution geometrical analysis indicates that their wavy forms follow power-law distributions with fractal dimensions, D in the range: 1.682 ± 0.033 to 1.731 ± 0.017, with a mode value of 1.694 ± 0.025 (Figure 5A) (see Supplementary Material Section S3 for details).
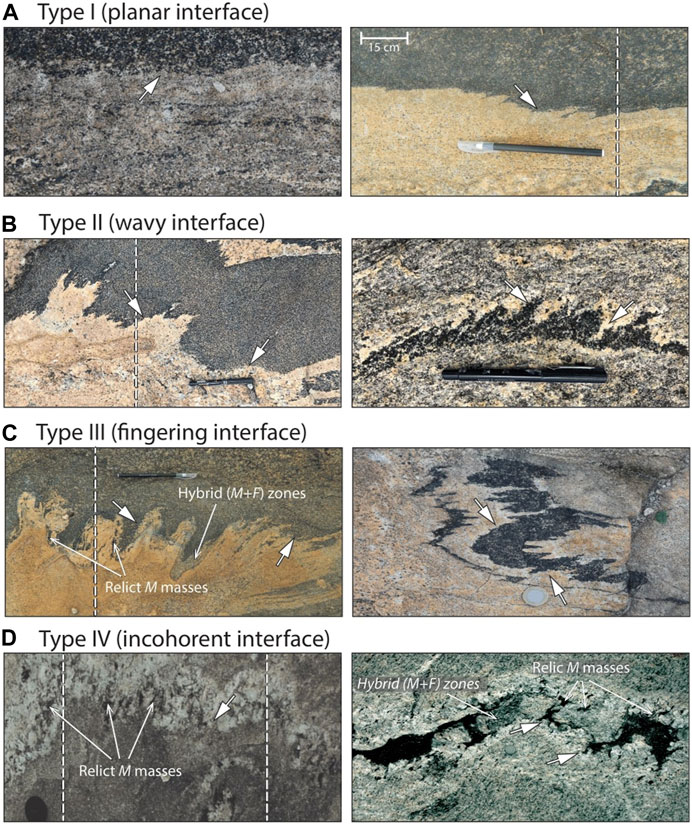
FIGURE 4. (A–D) Four principal types (I–IV) of phase boundary patterns between F and M materials recognized in the CGGC (see text for their detailed description). White arrows indicate the F − M boundary. The prolific presence of relic M masses associated with the interface suggest that these structures are essentially produced by reaction-diffusion driven processes.
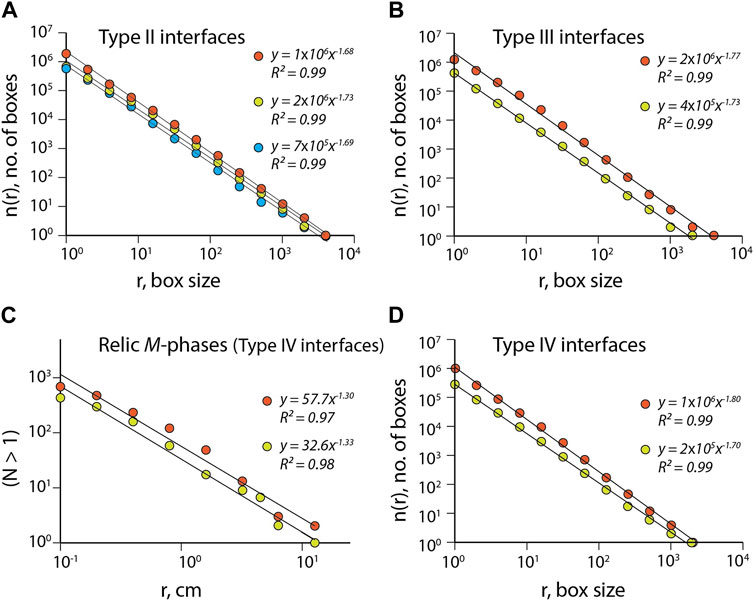
FIGURE 5. Fractal analysis of the three types of F − M phase interfaces: (A) Type II, (B) Type III, and (C, D) Type IV, employing a box counting method. N is the number of clasts with size
Type III patterns show finger-like incursion of the F- into the M-phases, forming a feature classically called lit-par-lit structures (Sederholm, 1967). This pattern was common in mafic boudins, which underwent syntectonic assimilation with their quartzofeldspathic host. In many cases, Type III had M tongues, projecting into the F host, partially digested to produce discrete, smaller masses at the interfaces (Figure 4C). We performed a quantitative analysis of Type III geometry using the length to width ratio (AR) of large F-fingers protruded into M and obtained a multi-modal value of AR, where the most dominant mode is 3.3. On a wide spectrum of the geometrical irregularities, Type III defines an excellent fractal pattern with a characteristic D value, 1.767 ± 0.032 to 1.728 ± 0.017 (Figure 5B). The fractal analyses suggest that D is an effective parameter to characterize Type II and III patterns (detail in Section 4.2). The fractal dimension estimates presented in this study might be affected by post-assimilation deformation events. However, the characteristic field and model interface patterns are likely to display a similar trend of D values. For example, Type-III interface yields D values higher than Type-II, and the two patterns will probably retain their difference in D even if they experience post-interactions bulk deformations. Their absolute D values can, however, change depending on the deformation magnitudes.
Type IV phase interactions are defined by incoherent interfaces containing isolated or partially connected M-hosted in the F-phases and characterized by a zone of mixed petrological constituents. Such isolated M-masses seem to have undergone further mixing by the granitic material in a random fashion, producing smaller masses of varying sizes in large numbers (Figures 3D, 4D). Their size distribution analysis yields a linear size versus frequency regression on a log-log space, implying that the relic masses follow essentially a fractal distribution with D = 1.301 ± 0.089 (Figure 5C). Overall, Type IV interactions show diffused boundary layers with their thickness varying from a few centimeters to a few meters.
During our field investigations, we studied rock outcrops with relatively weak imprints of penetrative tectonic foliations to minimize the uncertainty arising from post-assimilation deformation events. It was possible to find such outcrops as the terrain is strongly heterogeneous in terms of tectonic deformations. Field examples suggest that the assimilation features often do not track deformational fabrics (see left panels of Figures 4B–D). In fact, it was common to observe interface patterns without any definite directional relationship with the host foliation; sometimes the foliation is parallel to the interface (Figure 4A), elsewhere they are obliquely oriented (right panels of Figures 4B, D). Furthermore, the interface geometry in Type -II and –III phase boundary patterns that sometimes give a false impression of folding are, however, predominantly associated with one side of the massive rock units that are difficult to explain by folding instability mechanism. Based on these field observations, we assumed that the interface patterns observed in the CGGC reflect the assimilation process due to RD mechanism, even though the terrain display multiple phases of deformational imprints.
Mathematical approaches to understand and predict the complex time evolution of auto-regulatory pattern formation in various chemical, physical, biological, geological systems have been an extensive frontier in scientific pursuit. Such theoretical modeling can be performed by quantitatively considering each domain of the system at micro level, which works fine only for simple systems, where spatio-temporal parameters are not of significant importance. However, for the complex systems, the Turing or reaction-diffusion type of models, that treats the system through a set of simple mathematical expressions to analyze the system phenomenologically at the cost of some details of the modeled system, have led to very insightful interpretations applicable to many natural systems (Kondo and Miura, 2010). Such RD system considers two different materials that can interact with one another other while they are undergoing diffusion, and can produce self-regulated spatial patterns (Turing, 1952).
Our theoretical RD model considers diffusional mass transfer mechanisms to describe the interactions between felsic and mafic materials, treating them as two continuum phases. The diffusion coefficient assigned to a continuum phase represents the bulk diffusion properties of the participating rocks, constituted by diverse minerals with different diffusional properties (DePaolo and Getty, 1996; Watson and Baxter, 2007). This model is fundamentally applicable to two coexisting continuum phases with a chemically interactive relationship, where one phase invades into the other through phase boundary migration. Our model aims to explain the four types of phase boundaries presented in the preceding section as a function of the diffusion-controlled transport mechanisms, coupled with additional factors, such as non-linear interaction and grain-scale heterogeneities.
Diffusion controlled instability of a phase boundary produces specific geometrical patterns, which are found to be reliable indicators of the physico-chemical factors controlling the mass transport properties (Turing, 1952; del Castillo-Negrete et al., 2003; Roy et al., 2010; Baruah et al., 2014). Certain concentrations of fine dispersive particles can locally hinder the diffusion process, thereby modulate the phase boundary migration, often called the pinning effect (Latva-Kokko and Rothman, 2005). The reaction between the two participating phases must overcome the pinning threshold at the specific particle locations in space and time. Presence of any intrinsic micro-scale chemical and structural heterogeneities, for example, rigid minerals or small fragments in the rock masses, can act as chemical and structural barriers in mass transport processes, which in turn influence the interface morphometry. To incorporate the effect of such perturbations, we have introduced a pinning parameter (W) in our RD models to investigate how their occurrence along the interface between the two interacting phases can influence the development of a phase front. It is noteworthy that such point-source heterogeneities can critically govern the mass transport process by a combination of reaction and diffusion mechanisms. During the interaction between the two lithological phases, the phase interface will have to overcome the pinning agencies at different locations, as revealed by the RD model results. Thus, this factor characterizes local disordering in the system and increases its free energy, and has been extensively used in theorizing a range of phenomena (Ebner et al., 2009; Brodhag et al., 2011). Such perturbations are global and well mixed in the system, and they usually represent a very confined physical disorderness relative to some intrinsic material parameters in the system with a narrow width and low mass. The theoretical model of Bercovici and Ricard (2012) explains the mechanics of plate boundary generation, considering the interplay of grain-damage, pinning factor and grain size reduction in polycrystalline rocks. Furthermore, in case of anatectic migmatites prograde as well as retrograde reactions between the residual materials and the melt fraction (Kriegsman, 2001), there is possibility that the observed interface between mesosome and palaeosome fractions may evolve as a function of either increasing or decreasing values of W. In this study, we develop an RD model by extending the Diffusive Fisher Kolmogorov (DFK) type model to embrace the effects of a pinning disorder in the two continuum phases. Our model is used to quantify the material exchange between two interacting phases, driven by the local concentration gradients and inspect spatio-temporal patterns of the phase boundaries.
We adopt a set of reaction-diffusion equations for a two-phase system (Kessler and Levine, 1998) to model chemically interacting F − and M-phases with their diffusion coefficients as DF and DM, respectively. These two parameters determine the efficiency of diffusion-controlled material transport, and thereby mediate the phase boundary migration between the two phases. The corresponding governing equations of diffusion-controlled material transport of F − and M − phases can be expressed as,
Here, SF(x, y, t) and SM(x, y, t) represent the particle mass densities in the phase space, and R(SF, SM) denotes the reaction term, which regulates the phase interaction (Baxter and DePaolo, 2000). For smooth non-linearity of the reaction term, i.e., R(SF, SM), the solutions (SF, SM) in all our RD simulation satisfy the following mass conservation condition:
Considering a linear form of the reaction term R, Eq. 1 follows,
where, H is the Heaviside step function to represent the chemical transition between the two phases. The second term on the right-hand side of Eq. 3: CSFSMH[SF − W(x, y)] represents the reaction term, where C is the coupling factor and W stands for the pinning field in the phase space. It should be noted that the phase boundary migration due to the growth of F phase, which occurs at the cost of the M phase, must overcome W. The coupling factor (C), which can also be termed as reaction-coefficient or reaction constant, is a parameter with wide physical interpretation and mathematical significance. C is physically a coarse and homogeneous parameter with respect to its spatial distribution within the model domain. A high value of C represents a system where the two interacting phases are tightly held, approximating a single-phase system, and the diffusion term will not be compatible mathematically. Conversely, a very low value (close to 0) suggests two phases that interact only by diffusion, without any strong chemical interactions. C can vary as a function of temperature, stress or other physical fields. But, in our present study, we assumed the rate to be constant and in a state of thermal and mechanical equilibrium. We also considered C to be either linearly or non-linearly coupled, as discussed later.
In our second set of numerical simulations, we consider a non-linear coupling of the F − M phases in the reaction term for generating a more heterogeneous chemical interaction, attributed to micro-scale heterogeneities in the phase space. Thus, the revised RD equation for this second case of simulation can be expressed as,
We performed RD simulations on a two-dimensional rectangular space, covering a model domain size of 200 × 500 grid points. We solved Eqs 3, 4 using a finite central difference scheme in space and a forward difference scheme in time (see Supplementary Material Sections S4, S5 for details). The M-phase space was randomly assigned to SM values between 0 and 1. The dimension of the continuum system considered in our study is quite large compared to the thermal diffusion range. Thus, we employ zero flux boundary condition as,
where K and n are the flux density and vector normal to the boundary, respectively. This condition (Eq. 5) ensures that the total mass is conserved during the model simulations.
We implemented Eqs 3, 4, considering W as a random matrix of the same form for SF and SM, and set minimum and maximum W at 0.0 and 0.25, respectively. We chose extremely fine spatial grids to resolve the instability issue as well as the non-dissipativeness of the problem. It is important to note that the diffusion rates are well constrained only for specific elements in different minerals, fluids, etc. For example, the experimentally calculated diffusion rates of oxygen in zircon can vary roughly between 10–6 and 10–21 m2/s (Peck et al., 2003). Similarly, diffusion coefficients values of Fe and Mg in olivine have been shown to vary from 10–14 to 10–22 m2/s as a function of temperature and oxygen fugacity (Chakraborty, 2010). Furthermore, halogen (F, Cl, Br) diffusion rates in phonolitic melts have been experimentally inferred in the range of 10–11 to 7 × 10⁻¹² m2/s for the temperature range of 1250–1450°C (Balcone-Boissard et al., 2009). The current progress in the diffusion profiles of different elements in melts and magmas has been elaborately discussed by Zhang and Gan (2022). However, the present study aims to model the physics of self-organization and the subsequent autoregulatory spatial pattern generation of the macroscopic F − M interface due to the interactive chemical and diffusion dynamics. For probing such large macroscopic systems, the model requires a single diffusion value for the mafic and felsic rock units as a single continuum body and not the rate of diffusion of some selective diffusing species. There is a lack of data for the diffusion values of mineral and/or mush aggregates forming crustal rocks. To overcome this, we have constrained the diffusion coefficients of felsic and mafic phases phenomenologically on a very wide range based on the available estimates (Bickle and McKenzie, 1987; DePaolo and Getty, 1996; Watson and Baxter, 2007). We understand that the model results will vary for the choice of diffusion coefficients and precise determination of their values, when they are available, will significantly improve the model findings presented in this study.
Reference model simulation: We first present a reference simulation, performed with DF = 5 × 10⁻¹⁷ m2/s, DM = 1 × 10⁻¹⁸ m2/s (DePaolo and Getty, 1996) and C = 0.5 using Eq. 3 to show the evolution of phase boundaries in the course of assimilation between the F − and M − phases (Figure 6). This assimilation condition allows the F − M phase boundary to advance incoherently into the M-phase, forming a Type IV pattern (Figure 4D). Estimates from the RD simulations indicate that a reaction-diffusion mechanism, operating on a time scale of tens of millions of years, results in the phase boundary migration on a length scale in the order of 10 cm, which matches with our field observations. On a time scale of ∼ 20.5 Myr, the phase boundary undergoes a long-range (∼18 cm) migration, leaving isolated masses of M-phase of varying sizes in the F host, to form a thick (∼12 cm) interface zone between the two phases (Figure 6D). The RD model is also utilized to estimate the growth rate of the Type IV phase interface, which ranges from ∼ 0.8 to 1 cm/Myr. According to this estimate, 10 to 30 cm thick boudins observed in the field (Figure 1C) would be completely assimilated within the granitic host on a time scale of ∼ 12.5 to 37.5 Myr, respectively, which complies with the CGGC orogenic events (Acharyya, 2003). Our RD model thus reproduces the phase mixing processes, resulting in the macroscopic assimilation of pre-existing mafic bodies hosted in the granitic terrains of CGGC (Figure 1). To summarize, the RD models predict a non-linear phase interaction pattern, coupled with pinning disorder (i.e., W ≠ 0) as a necessary diffusional condition for the formation of an incoherent (Type IV) phase boundary.
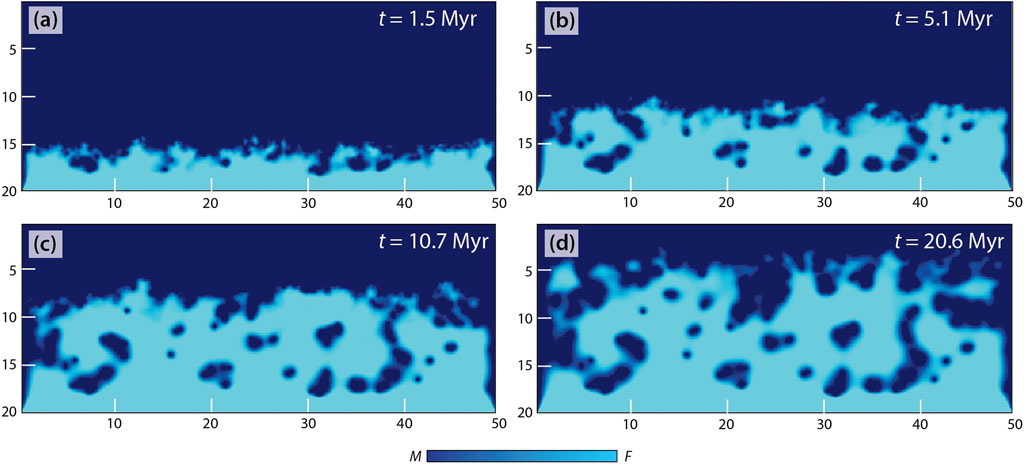
FIGURE 6. Progressive stages [(A) 1.5 Myr, (B) 5.1 Myr, (C) 10.7 Myr, (D) 20.6 Myr] of the F − M assimilation in the reference RD model simulations run with DF = 5 × 10⁻¹⁷ m2/s, DM = 1 × 10⁻¹⁸ m2/s, C = 0.5 and W = 0.02. The length dimensions are in centimeters.
Parametric analysis: We performed RD model simulations to explore further the diffusional conditions required for the growth of the four types of F − M interface patterns recognized in the field. The diffusion coefficients (DF, DM) and the reaction term: R(SF, SM) in Eq. 1 are considered as the main physical variables in running the simulations. We selectively present the simulation results to show the specific conditions for the growth of four types (Type I-IV) of phase boundaries.
A condition of equally high diffusion rates in the two phases (DF = DM = 1 × 10⁻¹⁶ m2/s; Bickle and McKenzie (1987)) and C = 0.1 favour a nearly linear phase boundary migration in the F − M phase space, giving rise to Type I pattern (Figure 7A). The simulations allow us to predict that such a uniform interface dynamics occurs essentially in a two-phase system with no pinning disorder (W = 0). According to our model estimates, Type I interfaces migrate at a rate of
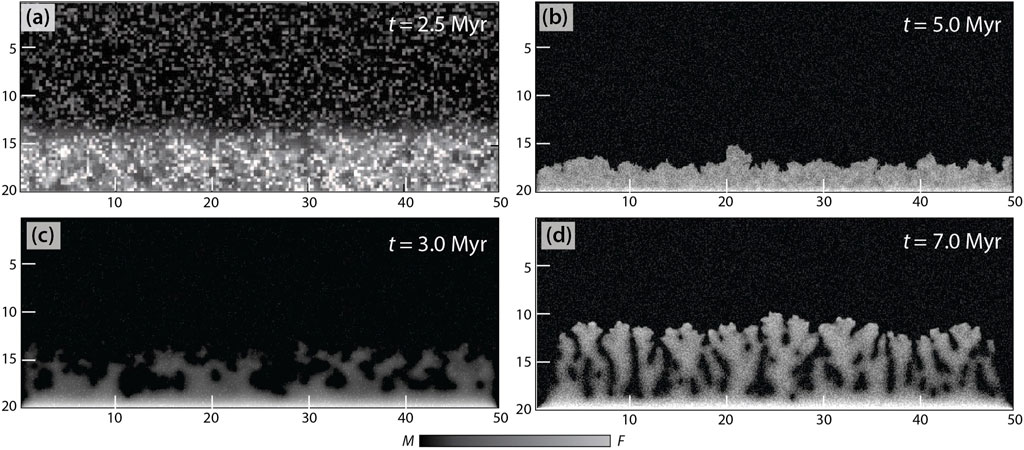
FIGURE 7. Contrasting F − M interface patterns produced in RD simulations run with varying diffusion coefficients (DF, DM) and the pinning disorder (W). (A) Phase boundary migration with a planar (Type I) interface; DF = DM = 1 × 10⁻¹⁶ m2/s, and W = 0. (B) Formation of multi-ordered wavy (Type II) interface; DF = DM = 1 × 10⁻¹⁷ m2/s and W = 0. (C) Incoherent phase boundary migration with nonlinear interaction (Eq. 3), leading to a Type IV interface; DF = 5 × 10⁻¹⁶ m2/s, DM = 1 × 10⁻¹⁷ m2/s and W = 0.1. (D) Phase boundary migration with linear interaction (Eq. 2), showing fingering (Type III) of one phase into the other; DF = 5 × 10⁻¹⁶ m2/s, DM = 1 × 10⁻¹⁶ m2/s and W = 0.25. Units of X- and Y-axes are in centimeters.
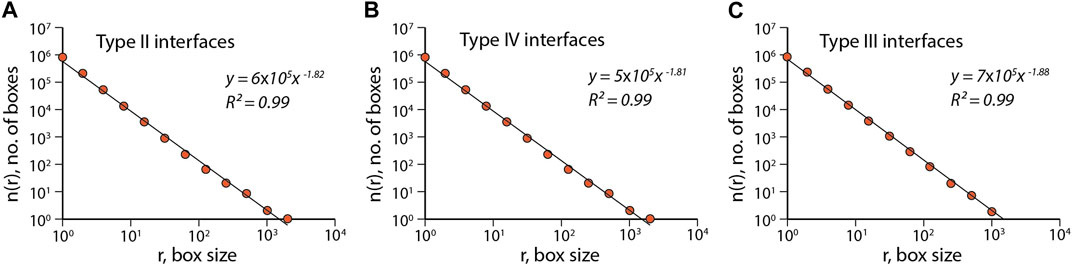
FIGURE 8. Estimation of the fractal dimensions for: (A) Type II, (B) Type IV and (C) Type III interfaces from RD simulations.
We investigated the effects of the pinning factor (W) on the phase boundary geometry. Unlike the previous set of model runs, the addition of W in the phase space (i.e., W ≠ 0) significantly facilitates the phase boundary migration and increases the degree of interface irregularity when the two phases have contrasting diffusional properties. For, DF = 5 × 10⁻¹⁶ m2/s, DM = 1 × 10⁻¹⁷ m2/s and W = 0.1, the migrating phase boundary becomes incoherent and develops an extremely rough phase interface, similar to Type IV. These incoherent dynamics produces irregular bodies of the M-phase as isolated relics in the interface zone (Figure 7C), which is also described in the reference simulation. The interface zone attains a thickness of ∼ 4 cm on a time scale of ∼ 3 Myr. Type IV interface geometry simulated in the RD models shows a fractal pattern, with D = 1.812 ± 0.031 (Figure 8B).
Figure 7D shows an RD simulation run with comparable diffusion rates (DF = 5 × 10⁻¹⁶ m2/s, DM = 1 × 10⁻¹⁶ m2/s) of the two interacting phases, but with a strong pinning field (W = 0.25) and keeping a linear reaction term Eq. 2. The phase boundary in this model develops characteristically fingering (Type III) patterns, displayed by a finger-like protrusion of the F-phase into the mafic bodies. Such fingering structures develop in multiple orders, which branch off into smaller elongate segments. Results suggest, that the fingering directions track the direction of phase boundary migration (Figure 4C). The fingering patterns are found to form a fractal pattern with D = 1.882 ± 0.074 (Figure 8C). The maximum finger length defines the interface zone thickness, which grows at the rate of
We used the RD model to develop a phase concentration map and study the mass transfer behavior and its spatio-temporal patterns depending on the varying mode of reaction-diffusion driven phase assimilation. Two different simulations with model parameters (DF = 5 × 10⁻¹⁶ m2/s and DM = 1 × 10⁻¹⁷ m2/s, C = 0.5 and maximum W = 0.0175): one with linear coupling (Eq. 2; Figure 9A) and the other with non-linear coupling (Eq. 3; Figure 9B) between the two phases show a remarkable difference in the phase interface characteristics. A linear coupling gives rise to directional mass transport, as reflected from the phase concentration map (Figure 9A), characterized by Type III interface pattern. The phase concentration profiles along and across the interface show a coherent spatial variation (Figure 9C). Across-interface profiles form peaks of the F-phase close to the M-phase space. Conversely, an along-interface profile displays a periodic variation of the phase concentration. The non-linear coupling in the reaction term causes incoherent concentration distributions due to a strongly heterogeneous mass exchange between F − and M − phases (Figure 9B). The interface zone consists of isolated patches of M-phase. The RD simulations suggest that the exponent of non-linearity in the order of 3 (cf. Eq. 3) provides realistic agreement with the pattern of chemical redistribution associated with Type IV phase interactions as observed in the CGGC. Across-interface profiles show an asymmetric pattern of concentration variation, where it is extremely irregular towards the F-space, and tends to be linearly flat moving into the M-space (Figure 9D). Secondly, the M-phase space shows short-range concentration heterogeneities, indicating the phase replacement to nucleate at isolated points that grow and coalesce with one another, resulting in incoherence in the phase space to produce an interface with patchy M-phases. Our estimates show a difference in the fractal dimensions of phase interfaces for linear (D = 1.833 ± 0.018, Figure 9E) and non-linear (D = 1.804 ± 0.024, Figure 9F) reaction coupling.
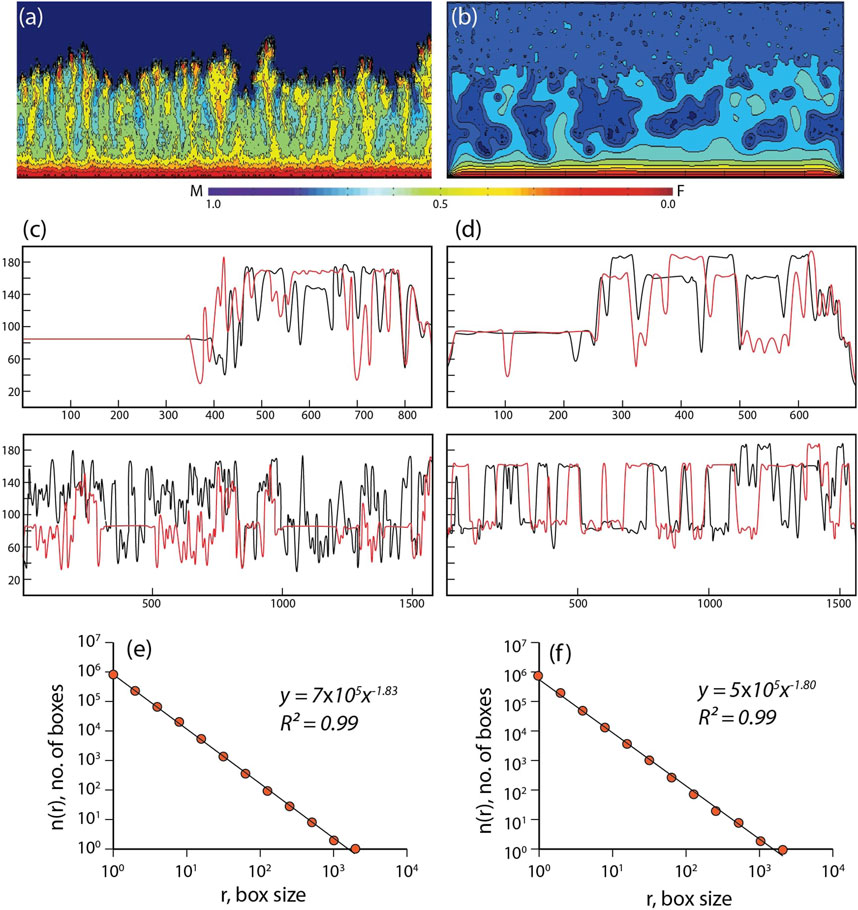
FIGURE 9. Phase concentration maps based on RD models, showing (A) fingering type of interface, for a linear coupling in the reaction term (Eq. 2), and (B) strongly heterogeneous phase distributions (incoherent type of the interface) for a non-linear coupling in the reaction term (Eq. 3). Both the simulations correspond to a time step of about 20 Myr, and W = 0.0175. The colour bar represents the volume fraction of each phase. (C) Profiles of phase concentration across (top) and along (bottom) interface for the linear coupling. The across-interface profiles show a sudden jump in the phase concentration, whereas the along-interface profile shows an apparently periodic variation of the phase concentration. (D) Across (top) and along (bottom) phase concentration profiles represent the patterns obtained from models with non-linear reaction term. Note that the variations in the profile axes are less chaotic due to the presence of relic M masses. Fractal analyses of the interfaces are presented for (E) linear, and (F) non-linear coupling in R term.
Assimilation of contrasting but chemically interacting petrological end-member entities: mafic and felsic constituents, can be a major macroscopic (cm-to meter scale) mixing process in the evolution of granite gneisses (Sederholm, 1967; Korikovsky and Khodorevskaya, 2006; Słaby and Martin, 2008; Pek et al., 2012; Safonov and Aranovich, 2014). Although such lithological mixing has remained a subject of considerable interest over many decades, the underlying physics of petrological assimilation remains inadequately explored, especially in the light of material transport kinetics (Artemieva and Shulgin, 2019). The present article reports field evidence in favour of the assimilation of pre-existing mafic rocks (i.e., assimilant) by quartzofeldspathic components in a granite gneissic terrain (Figure 10). We use these evidences to characterize and explain the specific imprints of hybridization on the macroscopic scale. Our theoretical model demonstrates the reaction-diffusion as a viable mechanism of material transport, allowing the mixing process to operate on a timescale of tens of millions of years. Secondly, the RD model shows that the felsic host progressively consumes mafic bodies (Figures 6, 7), mediated by a diffusion-controlled migration of the petrological interface to produce specific geometrical patterns as observed in the CGGC (Figures 10A, B). The four types of phase interface patterns (planar, wavy, fingering and incoherent) may be considered as first-hand indicators of the micro-scale transport mechanisms controlling the petrological assimilation between the two continuum phases leading to alteration of the crustal materials (Figure 10C), which is elaborated in Section 4.2.
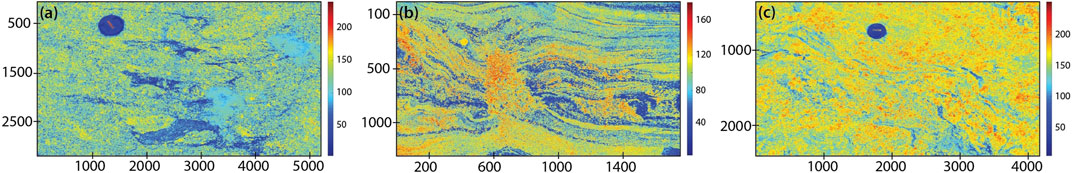
FIGURE 10. Phase maps of the hybrid rocks showing varying degrees of petrological assimilation in the CGGC. (A) Strongly heterogeneous assimilation M phase (blue) due to their diffusion controlled reaction with F-materials (red), leaving many remnant masses. (B) A mafic body digested by felsic materials, giving rise to a gneissic character under the influence of tectonic deformation. (C) Extremely granitized domain showing its spatio-temporal associations with a pre-existing amphibolitic rock. The colour contours represent the phase concentration (details of the image processing technique employing for the phase mapping are provided in Supplementary Material Section S2 for details).
High-grade metamorphic terrains like those of the CGGC (Acharyya, 2003), generally evolve through intense petrological mixing in millimetres to centimetres scales (Korikovsky and Khodorevskaya, 2006; Pek et al., 2012; Safonov and Aranovich, 2014). The hybridization process commonly involves the development of gneissic foliations, characterized by fine-scale banding of quartzofeldspathic and ferromagnesian materials (Sawyer, 1987; Brown, 1995; Misra et al., 2014). A line of studies has proposed melt-injection models (Brown, 1973; Weinberg and Mark, 2008) to explain the transformation of the mafic host by dispersing quartzofeldspathic melts through some mechanical processes. However, such a model cannot fully explain the mechanics of melt transport, as a large amount of penetrative dilational fractures poses a mechanical problem in space accommodation. The process of petrological mixing operates in a deep-crustal environment, where the availability of porosity for melt migration in the host is very low (0.001, see (Manning, 2018). Porosity waves can be a potential mechanism for migration as well as the mixing of large volumes of partially molten mass (Jordan et al., 2018; Dohmen and Schmeling, 2021). However, this mechanism mostly operates in some specific geodynamic settings, such as mid-ocean ridges, subduction settings, hotspots and plumes, etc., and its implications in mass transportation at low melt fraction, as considered in the present study, will intuitively be very limited. Deformation driven permeability associated with shear zones and tensile fractures might be potential mechanisms of melt transport (Bons et al., 2004; Misra et al., 2009). However, these features are generally non-penetrative, and are difficult to account for millimetres scale melt migration over a large terrain. The RD model proposed in this study overcomes the problem of dilation associated with such melt migration and provides a new theoretical explanation for micro-to macro-scale mixing of felsic and mafic petrological components in the evolution of a vast granite-gneiss terrain.
To summarize, our RD model can resolve the problem of fine-scale material transport required for the evolution of granitic crustal rocks, mixing of magmatic melts, during the interaction of separate magma batches within a magma chamber, magma injection, emplacement of pegmatitic dikes, etc. Melts can penetrate the mafic hosts through large scale fractures. However, their subsequent re-mobilization for attaining macroscopic petrological homogenization is essentially mediated by the reaction-diffusion mechanisms.
Evidence from the CGGC (Figure 4) suggests that the phase interaction can take place in different modes under the same physical environment. The RD model proposed in this paper effectively explains their origin as a response to varying micro-scale attributes to diffusion-controlled phase interactions (Table 1). The relative values of the diffusion coefficients (DF and DM) of the two interacting petrological entities: felsic (F) and mafic (M) phases, predominantly determine their interactions and the pattern of phase boundary migration. The F-phase space migrates into the M-space, maintaining a planar interface only when DF = DM, irrespective of their linear or non-linear reaction coupling. However, this mode of phase interaction occurs only in the absence of any pinning field, which accounts for local departures in the thermo-mechanical properties. Such a unique condition forms a band-like structure, as extensively observed in the CGGC, constituted by alternate F − and M-layers with intervening hybridized layers (Figure 11A). The planar interface pattern switches to wavy patterns (Figure 11B) with decreasing values of the diffusion coefficients from 10–16 to 10–17 m2/s. The geometrical characteristics of wavy patterns, e.g., multi-ordered irregularities observed in CGGC validate our RD simulations (Figures 4B, 7B). Furthermore, the fractal dimension of the theoretical wavy interfaces (D ∼ 1.8) closely replicates those determined from the field examples (∼1.7) (Table 1).
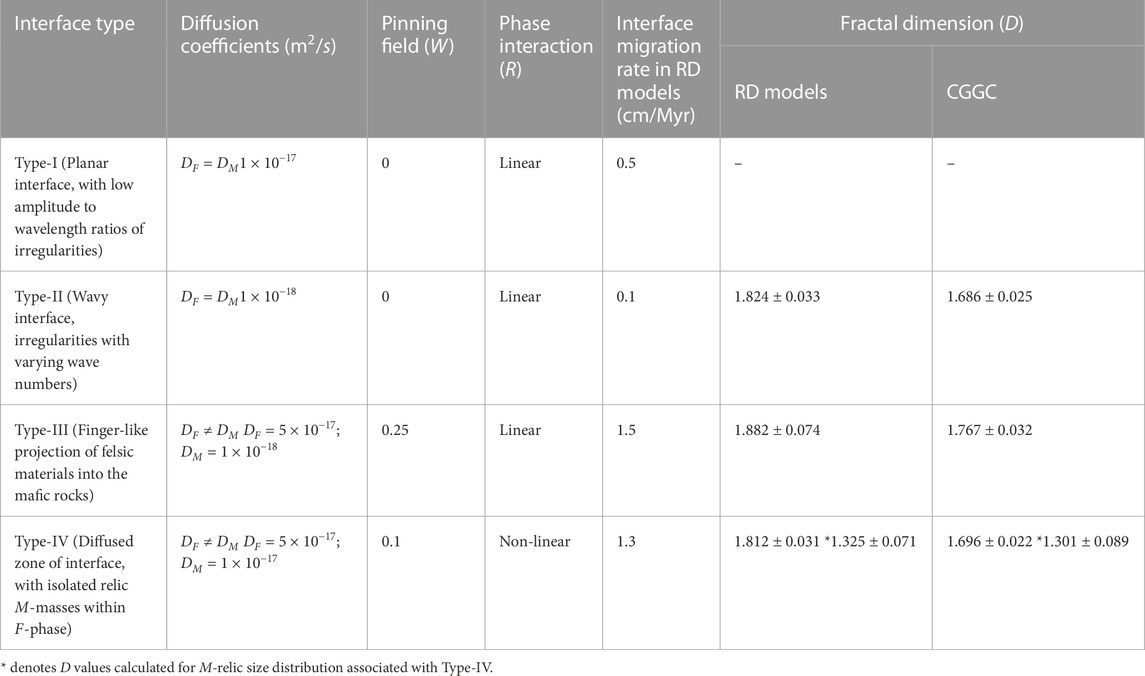
TABLE 1. List of parameters for the four principal phase interface patterns identified in CGGC and predicted from RD model results.
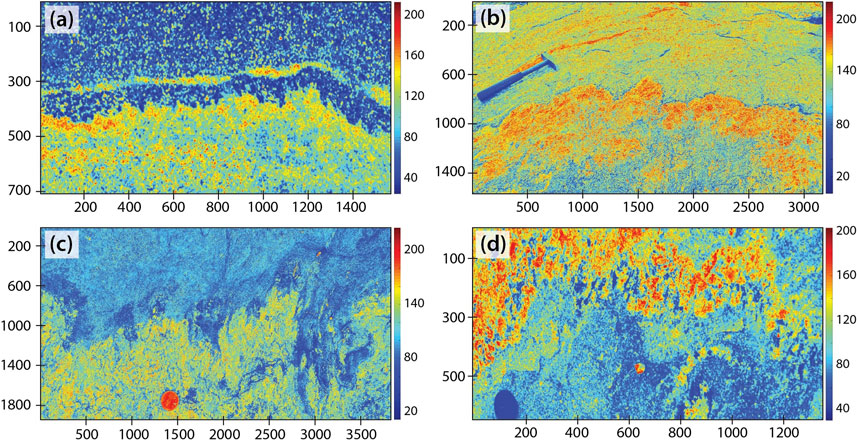
FIGURE 11. Phase maps, prepared from field photographs, showing the four basic types of interface: (A) planar, (B) wavy, (C) fingering, and (D) incoherent. The geometries are found to be scale invariant.
The RD simulations show that the process of phase interaction becomes complex, leading to strongly irregular phase boundary migration when the two phases have unequal diffusion coefficients, i.e., DF ≠ DM (Figure 11C). The complexity amplifies further due to additional effects of the pinning field (W) in the phase space, giving rise to Type III patterns, defined by fingering of the felsic phase into a mafic space. The phenomenon can also be compared with serrated grain boundaries formed by grain boundary migration in recrystallized grains (Piazolo et al., 2006) and quartzofeldspathic melt injection into the ferromagnesian unit (Weinberg et al., 2009). According to our RD model, such lit-par-lit structures can develop through interactions of two chemically contrasting constituents in composite rocks, assisted by the local pining perturbations. We show that these perturbations (thermal or mechanical) that are initially confined to very small spatial distribution, primarily exploit the contrast in diffusion coefficients to stimulate and sustain large localized disorderness in the system. Thus, our study emphasizes that the presence of even small thermo-mechanical inhomogeneities can result in spatially varying front velocities in RD systems and produce distinct patterns of the phase boundary. The observed length (∼10 s of cm) of such protrusions is in good agreement with the predicted diffusive length (
RD simulations with a strong inherent pinning effect and non-linear interaction (Eq. 3) develop incoherent phase boundaries with intricately irregular geometry (Type IV). Such phase boundary migration often leaves isolated relics of mafic materials in the interface zone (Figure 7C), which we can visually compare with the phase maps prepared from the field structures (Figure 11D). Two geometrical parameters: 1) relic mass size distributions, and 2) fractal geometry of the phase boundary, are considered here for a quantitative comparison between estimates from our simulations and the interface pattern recorded in the CGGC. The fractal dimensions of relic mafic bodies associated with the hybrid zone in the Type IV interface, calculated from RD simulations (1.325 ± 0.071) agrees with the field estimates (1.301 ± 0.089) (Table 1). Similarly, the fractal analyses of irregular Type IV interface geometry in the RD simulations and the field yield almost the same D values (∼1.8) (Figures 5D, 8B). Such quantitative consistency in the geometrical patterns produced in numerical simulations with their equivalent in the CGGC, further reinforces our proposition for the relevance of the RD model for the formation of hybrid rock in high-grade metamorphic terrain.
Metamorphic reaction rates have been experimentally constrained in laboratory conditions for varying pressure, temperature and chemical environments (DePaolo and Getty, 1996; Lasaga and Lasaga, 1998; Baxter and DePaolo, 2000), which can be extrapolated to understand natural systems (Baxter and DePaolo, 2000). These studies primarily rely on the diffusion kinetics of particular minerals or natural isotopes to reconstruct the reactions for estimating reaction rates (Baxter and DePaolo, 2000), the time scale of exhumation (Faryad and Chakraborty, 2005) and cooling rates (Ague and Baxter, 2007) of metamorphic events, as well as geochronological interpretations (Ganguly et al., 2013) and strain rate of deformation (Camacho et al., 2009). However, the phase concentration mapping based on the present RD models takes into account the diffusion behaviour of a macroscopic petrological phase by idealizing the average diffusion kinetics of the constituent minerals present in a specific petrological unit. Diffusion occurs in minerals either through the lattice structure by self-diffusion (Ganguly, 2010) or grain boundary diffusion (Joesten, 1991). The diffusion coefficients for silicate minerals can vary from 6.1 × 10⁻⁶ to 1.4 × 10⁻¹¹ m2/s (Brady and Cherniak, 2010). Conversely, the bulk diffusion of constituent minerals in crustal rocks has been treated as a continuum phase, and the diffusion coefficients in such materials can range from ∼ 10–13 to 10–18 m2/s (Bickle and McKenzie, 1987; DePaolo and Getty, 1996; Watson and Baxter, 2007). Thus, for different values of diffusion coefficients, the length as well as time scales estimated in our study will vary significantly. For example, for a length scale of centimeters, the time scale of reaction-diffusion processes proposed in our model can vary between a lower bound of less than a million year to an upper bound of tens of million years on a variation of D from 10–10 m2/s (Brady and Cherniak, 2010) to 10–18 m2/s (DePaolo and Getty, 1996). Several factors, such as kinetics of chemical reactions (Lasaga, 1984), textural characteristics of mineral aggregates (Carlson, 1989), fabric development (Getsinger and Hirth, 2014) and the presence of fluid phase (Baxter, 2003) have a profound influence on the bulk diffusional kinetics of mineral aggregates. Also, the diffusivity values of the each phases may locally fluctuate to a large extent as a function of the ambient thermal field leading to either melting or crystallization of the system. Due to the collective effects of these different factors, the bulk diffusion coefficient of a continuum phase considered in our study represents a particular petrological variety (e.g., felsic or mafic rocks), which can vary to a large extent. For example, a trace of hydrous materials can significantly promote the materials transport, resulting in an increase of the diffusion coefficient (Baxter, 2003). Our RD simulations suggest that a large contrast in the diffusion coefficients between two phases would cause the phase boundary to migrate with a complex pattern. A DF = DM condition produces either a planar (Type I) or a wavy (Type II) interface, which transforms into more complex forms (Type III/IV) for contrasting diffusivities.
In this study, we have introduced a coupling factor (or, reaction rate), both linear and non-linear, in the reaction term of the reaction-diffusion equation. The simulations suggest this factor has a nontrivial effect in two-phase interactions and provide a new line of interpretation for metamorphic reactions. A linear coupling condition steers the reaction-diffusion process to produce a felsic phase fingering into the mafic phase (Figure 9A). The mode of phase interaction undergoes a transition in the style of phase boundary migration when the coupling term becomes non-linear (Eq. 3), and eventually produces an incoherent phase boundary. This process leaves the mafic phase as remnant masses (Figure 9B), comparable to restites observed in high-grade metamorphic suites. The sporadic presence of isolated leucosome units within gneissic rocks is often attributed to a product of partial melting in high-temperature metamorphic conditions (Brown, 1973; Sawyer, 2010). Our numerical simulations suggest that the coupling factor is responsible for determining the local self-reorganization when two phases assimilates by coupled diffusion-reaction mechanism. Linear coupling produces a continuous interface with distinctive phase geometry, whereas a non-linear coupling leads to the generation of discontinuous blobs of one phase distributed randomly within the other phase without any recognizable phase boundary. It is worth noting that there is no explicit theoretical or experimental verification of the physico-chemical parameters that decide the applicability of the linear versus non-linear reaction coupling. Our studies offer a new outlook for explaining varied types of petrological phase mixing in a continuum scale as a function of the rigourosity of the chemical reactions.
The concept of pinning field (W) is in vogue to theorize the transport dynamics in many physical (Brodhag et al., 2011) as well as chemical (Ebner et al., 2009) systems. The use of W mainly aims to introduce micro-scale disordering in the mass transport, attributed to various factors present in a system. Here, we discuss specific conditions in which pinning objects act as a micro-scale obstacle or perturbations to material transport mechanisms and introduces disordering in the phase interaction. The two interacting petrological phases considered in our case can contain resistant minerals (e.g., zircon) as potential pinning materials. Furthermore, mineral grains of contrasting sizes, porphyroblasts or porphyroclasts in the relatively fine grained matrix can also act as pinning objects. These textural or mineralogical heterogeneities, which act as a pinning field, results in the formation of result in complex phase interfaces, such as Type IV, in harmony with the reaction-diffusion process. To the best of our knowledge, there is no precise quantitative estimation of W parameter in natural rocks. Intuitively, a very high value of W may largely obstruct any front propagation and associated pattern formation in Turing-type systems. Conversely, very low W values, for example, during local anatectic events will provide least barrier to mass transportation phenomena.
The set of RD equations in our study does not consider the role of deformation in the continuum two-phase system. The theoretical extrapolation of this study represents a simplified and idealized set-up, where the mafic assimilant and the felsic materials interact with each other purely on a reactive principle, further aided by the inter-diffusion of the binary system. Our RD model does not account for any dynamic parameter to entail deformation in the petrological system, which can, however, play a significant role in controlling the kinetics of the material transport during the mixing processes. Furthermore, such tectonic deformation can influence the dynamics of the interface mobility and modify their geometrical patterns. We suggest from our field observations that, while deformation might facilitate the pace of phase-boundary migration or alter the wavelengths of irregular interface patterns, the process alone cannot produce the different types of patterns identified in this study. Such geometries, signifying the assimilation process, are always triggered by the reaction-diffusion mechanism as shown in the numerical simulations, substantiated by the similarity of fractal dimensions of natural and simulated interface patterns.
The two interacting phases (M and F) in the RD model represent phenomenologically continuum (macroscopic) phases, which are programmed to react to each other within a no-flux boundary condition. Thus, the RD equations used in the present study cannot be utilized to investigate any mineralogical transformations from one phase to another. For example, our model cannot determine the mechanism of grain-scale transformation of specific minerals present in mafic layers when they react with those present in felsic layers. In fact, our RD theoretical treatment excludes any microscopic process that actually governs the macroscopic interactions, which generates the spatio-temporal self-regulatory pattern formation (Kondo and Miura, 2010). In fact, this study aims to bring a new perspective on what could be a viable process of macroscopic assimilation in gneissic terrains between two contrasting petrological entities. The RD model also provides an insight into how the interface geometrical pattern of a phase interface can respond to such interactions driven by a reaction-diffusion mechanism, without looking at the chemical transformation involved during the breakup and reorganization of individual minerals in the F- and M- phases.
The reaction term in the RD equations contains a coupling factor (C), formulation of linear and non-linear kinetics and a pinning field (W) in the model domain, which are not fully constrained. In fact, our study invokes reaction–diffusion mechanism as a possible alternative for assimilation in high-grade metamorphic terrains and is premised on some basic assumptions that render close similarity with natural examples documented from CGGC. Also, our theoretical treatment of the binary phase assimilation ignores the thermal dependency of diffusion coefficients. Thus, our model results are not affected by the episodes of thermal cooling or heating in the course of protracted processes of assimilation in a natural setting.
Despite these limitations, the model offered in this study explains the mechanism of macroscale assimilation between two end-member petrological components: a mafic assimilant and a felsic materials, by relating the inter-diffusion of the two continuum phases with their chemical interaction. There is a vast scope for refining and advancing our theoretical treatment. Nevertheless, it offers a new and simple model for elucidating petrological phase interaction en-route the assimilation, and its possible role in the hybridization of a metamorphic terrain under favourable thermodynamic set-up.
This study opens a new theoretical approach to the modelling of petrological assimilation, treating felsic and mafic constituents as continuum phases. The reaction-diffusion (RD) mechanisms produce four characteristic interface patterns: planar, wavy, fingering and incoherent, depending upon the varying diffusional conditions set by the diffusion coefficients of interacting phases, coupling factor in the reaction term, and a pinning field. There can be homogeneous hybridization of the two phases to produce a planar phase interface only when the diffusion coefficients are equal, and the system is free from any pinning influence. The interactions turn to be strongly heterogeneous, resulting in irregular mixing fronts with characteristic geometry, when the phases have contrasting diffusion coefficients and the diffusion occurs under the influence of a pinning field. Our theoretical approach leads us to conclude that the nature of coupling (i.e., linear versus non-linear) in the reaction term is an influential factor for petrological assimilation. Linear coupling produces fingering of the granitic phase into the mafic rocks, maintaining a continuous reaction front. In contrast, non-linear coupling transforms the pattern with discontinuous fronts, characterized by the presence of isolated mafic masses. Phase boundary migration is fundamental for the evolution of the phase interface, and its pattern can be assessed from the characteristic fractal dimension (D). Wavy phase interfaces display self-repeating geometrical irregularities, as observed in the field, having a fractal distribution with D ∼ 1.68. The fingering interface also shows fractal geometry, defined by higher D values (∼1.76). The pinning factor largely influences the mode of phase boundary migration. Strong pining effects result in the development of incoherent phase interfaces, containing isolated mafic relics. The relic mafic bodies follow a power-law size distribution, with D ∼ 1.3.
The original contributions presented in the study are included in the article/Supplementary Material, further inquiries can be directed to the corresponding author.
AB, MR, NM, and SM contributed to the conception and design of the study. MR and AB performed the numerical modeling and other analysis. All authors contributed to the article and approved the submitted version.
This work has been supported by the Science and Engineering Research Board, India with the Early Career research (ECR/2016/002045) grant to AB. NM and SM acknowledge the J. C. Bose Fellowship (SR/S2/JCB-36/2012) and the Swarnajayanti Fellowship (DST/SJF/E&ASA-01/2015-16) awarded to them by Science and Engineering Research Board, India and Department of Science and Technology, India, respectively.
We greatly benefited from incisive comments and many constructive suggestions from three reviewers to improve this study. We thank Editors Jeroen van Hunen, and Bjarne Sven Gustav Almqvist for providing an effective guideline to revise the manuscript. We also thank Dip Ghosh who assisted us in image processing and fractal analysis.
The authors declare that the research was conducted in the absence of any commercial or financial relationships that could be construed as a potential conflict of interest.
All claims expressed in this article are solely those of the authors and do not necessarily represent those of their affiliated organizations, or those of the publisher, the editors and the reviewers. Any product that may be evaluated in this article, or claim that may be made by its manufacturer, is not guaranteed or endorsed by the publisher.
The Supplementary Material for this article can be found online at: https://www.frontiersin.org/articles/10.3389/feart.2023.1115103/full#supplementary-material
Acharyya, S. (2003). The nature of mesoproterozoic central indian tectonic zone with exhumed and reworked older granulites. Gondwana Res. 6, 197–214. doi:10.1016/s1342-937x(05)70970-9
Ague, J. J., and Baxter, E. F. (2007). Brief thermal pulses during mountain building recorded by sr diffusion in apatite and multicomponent diffusion in garnet. Earth Planet. Sci. Lett. 261, 500–516. doi:10.1016/j.epsl.2007.07.017
Artemieva, I. M., and Shulgin, A. (2019). Making and altering the crust: a global perspective on crustal structure and evolution. Earth Planet. Sci. Lett. 512, 8–16. doi:10.1016/j.epsl.2019.01.033
Balcone-Boissard, H., Baker, D., Villemant, B., and Boudon, G. (2009). F and cl diffusion in phonolitic melts: influence of the na/k ratio. Chem. Geol. 263, 89–98. doi:10.1016/j.chemgeo.2008.08.018
Bartoli, O. (2017). Phase equilibria modelling of residual migmatites and granulites: an evaluation of the melt-reintegration approach. J. Metamorph. Geol. 35, 919–942. doi:10.1111/jmg.12261
Baruah, A., Roy, M. K., Sarkar, S., and Mandal, N. (2014). Dynamics of solid-melt front migration from a reaction–diffusion model. Heat Mass Transf. 50, 31–38. doi:10.1007/s00231-013-1221-0
Baxter, E. (2003). Geochronology–linking the isotopic record with petrology and textures, 220. London: Geological Society of London, Special Publication, Ch. Natural Constraints on Metamorphic Reaction Rates, 183–202.
Baxter, E., and DePaolo, D. J. (2000). Field measurement of slow metamorphic reaction rates at temperatures of 500 to 600 c. Science 288, 1411–1414. doi:10.1126/science.288.5470.1411
Bercovici, D., and Ricard, Y. (2012). Mechanisms for the generation of plate tectonics by two-phase grain-damage and pinning. Phys. Earth Planet. Interiors 202, 27–55. doi:10.1016/j.pepi.2012.05.003
Bickle, M., and McKenzie, D. (1987). The transport of heat and matter by fluids during metamorphism. Contributions Mineralogy Petrology 95, 384–392. doi:10.1007/bf00371852
Bons, P. D., Arnold, J., Elburg, M. A., Kalda, J., Soesoo, A., and van Milligen, B. P. (2004). Melt extraction and accumulation from partially molten rocks. Lithos 78, 25–42. doi:10.1016/j.lithos.2004.04.041
Brady, J. B., and Cherniak, D. J. (2010). Diffusion in minerals: an overview of published experimental diffusion data. Rev. mineralogy Geochem. 72, 899–920. doi:10.2138/rmg.2010.72.20
Brodhag, S. H., Herwegh, M., and Berger, A. (2011). Grain coarsening in polymineralic contact metamorphic carbonate rocks: the role of different physical interactions during coarsening. J. Struct. Geol. 33, 698–712. doi:10.1016/j.jsg.2010.12.003
Brown, M. (1973). The definition of metatexis, diatexis and migmatite. Proc. Geologists’ Assoc. 84, 371–IN2. doi:10.1016/s0016-7878(73)80021-5
Brown, M. (1994). The generation, segregation, ascent and emplacement of granite magma: the migmatite-to-crustally-derived granite connection in thickened orogens. Earth-Science Rev. 36, 83–130. doi:10.1016/0012-8252(94)90009-4
Brown, M. (2007). Crustal melting and melt extraction, ascent and emplacement in orogens: mechanisms and consequences. J. Geol. Soc. 164, 709–730. doi:10.1144/0016-76492006-171
Brown, M., Averkin, Y. A., McLellan, E. L., and Sawyer, E. W. (1995). Melt segregation in migmatites. J. Geophys. Res. 100, 15655–15679. doi:10.1029/95jb00517
Brown, M., and Rushmer, T. (2006). Evolution and differentiation of the continental crust. Cambridge University Press.
Camacho, A., Yang, P., and Frederiksen, A. (2009). Constraints from diffusion profiles on the duration of high-strain deformation in thickened crust. Geology 37, 755–758. doi:10.1130/g25753a.1
Carlson, W. D. (1989). The significance of intergranular diffusion to the mechanisms and kinetics of porphyroblast crystallization. Contributions Mineralogy Petrology 103, 1–24. doi:10.1007/bf00371361
Chakraborty, S. (2010). Diffusion coefficients in olivine, wadsleyite and ringwoodite. Rev. mineralogy Geochem. 72, 603–639. doi:10.2138/rmg.2010.72.13
Chatterjee, N., Crowley, J. L., and Ghose, N. C. (2008). Geochronology of the 1.55 ga bengal anorthosite and grenvillian metamorphism in the chotanagpur gneissic complex, eastern India. Precambrian Res. 161, 303–316. doi:10.1016/j.precamres.2007.09.005
Chavagnac, V., Nägler, T. F., and Kramers, J. D. (1999). Migmatization by metamorphic segregation at subsolidus conditions: implications for nd–pb isotope exchange. Lithos 46, 275–298. doi:10.1016/s0024-4937(98)00071-1
Cruden, A., and Weinberg, R. (2018). Mechanisms of magma transport and storage in the lower and middle crust—magma segregation, ascent and emplacement. Volcan. igneous Plumb. Syst., 13–53. doi:10.1016/b978-0-12-809749-6.00002-9
del Castillo-Negrete, D., Carreras, B. A., and Lynch, V. E. (2003). Front dynamics in reaction-diffusion systems with levy flights: a fractional diffusion approach. Phys. Rev. Lett. 91, 018302. doi:10.1103/PhysRevLett.91.018302
DePaolo, D. J., and Getty, S. R. (1996). Models of isotopic exchange in reactive fluid-rock systems: implications for geochronology in metamorphic rocks. Geochimica Cosmochimica Acta 60, 3933–3947. doi:10.1016/0016-7037(96)00215-3
Diener, J., White, R., and Powell, R. (2008). Granulite facies metamorphism and subsolidus fluid-absent reworking, strangways range, arunta block, central Australia. J. Metamorph. Geol. 26, 603–622. doi:10.1111/j.1525-1314.2008.00782.x
Dohmen, J., and Schmeling, H. (2021). Magma ascent mechanisms in the transition regime from solitary porosity waves to diapirism. Solid earth. 12, 1549–1561. doi:10.5194/se-12-1549-2021
Dybkov, I. V. (2002). Reaction diffusion and solid state chemical kinetics. Zurich: IPMS publications Kyiv).
Ebner, M., Koehn, D., Toussaint, R., and Renard, F. (2009). The influence of rock heterogeneity on the scaling properties of simulated and natural stylolites. J. Struct. Geol. 31, 72–82. doi:10.1016/j.jsg.2008.10.004
Faryad, S. W., and Chakraborty, S. (2005). Duration of eo-alpine metamorphic events obtained from multicomponent diffusion modeling of garnet: a case study from the eastern alps. Contributions Mineralogy Petrology 150, 306–318. doi:10.1007/s00410-005-0020-0
Flinn, D. (1995). Formation of gneisses of migmatite and diatexite appearance in yell, shetland, by solid-state grain-growth recrystallization. Geol. J. 30, 415–422. doi:10.1002/gj.3350300316
Ganguly, J. (2010). Cation diffusion kinetics in aluminosilicate garnets and geological applications. Rev. Mineralogy Geochem. 72, 559–601. doi:10.2138/rmg.2010.72.12
Ganguly, J., Tirone, M., Chakraborty, S., and Domanik, K. (2013). H-chondrite parent asteroid: a multistage cooling, fragmentation and re-accretion history constrained by thermometric studies, diffusion kinetic modeling and geochronological data. Geochimica Cosmochimica Acta 105, 206–220. doi:10.1016/j.gca.2012.11.024
Getsinger, A., and Hirth, G. (2014). Amphibole fabric formation during diffusion creep and the rheology of shear zones. Geology 42, 535–538. doi:10.1130/g35327.1
Ghosh, S., and Sengupta, S. (1999). Boudinage and composite boudinage in superposed deformations and syntectonic migmatization. J. Struct. Geol. 21, 97–110. doi:10.1016/s0191-8141(98)00096-0
Grant, J. A. (1985). “Phase equilibria in partial melting of pelitic rocks,” in Migmatites (Springer), 86–144.
Joesten, R. (1991). “Grain-boundary diffusion kinetics in silicate and oxide minerals,” in Diffusion, atomic ordering, and mass transport (Springer), 345–395.
Johannes, W., and Gupta, L. (1982). Origin and evolution of a migmatite. Contributions Mineralogy Petrology 79, 114–123. doi:10.1007/bf01132881
Jordan, J. S., Hesse, M. A., and Rudge, J. F. (2018). On mass transport in porosity waves. Earth Planet. Sci. Lett. 485, 65–78. doi:10.1016/j.epsl.2017.12.024
Kemp, A., Hawkesworth, C., Foster, G., Paterson, B., Woodhead, J., Hergt, J., et al. (2007). Magmatic and crustal differentiation history of granitic rocks from hf-o isotopes in zircon. Science 315, 980–983. doi:10.1126/science.1136154
Kessler, D. A., and Levine, H. (1998). Fluctuation-induced diffusive instabilities. Nature 394, 556–558. doi:10.1038/29020
Kondo, S., and Miura, T. (2010). Reaction-diffusion model as a framework for understanding biological pattern formation. science 329, 1616–1620. doi:10.1126/science.1179047
Korikovsky, S., and Khodorevskaya, L. (2006). Granitization of paleoproterozoic high-pressure metagabbro-norites of the belomorian group in gorelyi island, kandalaksha bay area, baltic shield. Petrology 14, 423–451. doi:10.1134/s086959110605002x
Kriegsman, L. M. (2001). Partial melting, partial melt extraction and partial back reaction in anatectic migmatites. Lithos 56, 75–96. doi:10.1016/s0024-4937(00)00060-8
Lasaga, A. C. (1984). Chemical kinetics of water-rock interactions. J. Geophys. Res. solid earth 89, 4009–4025. doi:10.1029/jb089ib06p04009
Latva-Kokko, M., and Rothman, D. H. (2005). Diffusion properties of gradient-based lattice Boltzmann models of immiscible fluids. Phys. Rev. E 71, 056702. doi:10.1103/physreve.71.056702
Lindh, A., and Wahlgren, C.-H. (1985). Migmatite formation at subsolidus conditions–an alternative to anatexis. J. Metamorph. Geol. 3, 1–12. doi:10.1111/j.1525-1314.1985.tb00301.x
Liu, C., Calo, V. M., Regenauer-Lieb, K., and Hu, M. (2023). Coefficients of reaction-diffusion processes derived from patterns in rocks. J. Geophys. Res. Solid Earth 128, e2022JB026253. doi:10.1029/2022jb026253
Manning, C. E. (2018). Fluids of the lower crust: deep is different. Annu. Rev. Earth Planet. Sci. 46, 67–97. doi:10.1146/annurev-earth-060614-105224
May, R. (1976). Simple mathematical models with very complicated dynamics. Nature 261, 459–467. doi:10.1038/261459a0
Mehnert, K. R. (1968). Migmatites and the origin of granitic rocks. Megascopic Struct. migmatite, 7–42.
Milord, I., Sawyer, E., and Brown, M. (2001). Formation of diatexite migmatite and granite magma during anatexis of semi-pelitic metasedimentary rocks: an example from st. malo, France. J. Petrology 42, 487–505. doi:10.1093/petrology/42.3.487
Misra, S., Burg, J.-P., Vigneresse, J.-L., and Mainprice, D. (2014). Rheological transition during large strain deformation of melting and crystallizing metapelites. J. Geophys. Res. Solid Earth 119, 3971–3985. doi:10.1002/2013jb010777
Misra, S., Burlini, L., and Burg, J.-P. (2009). Strain localization and melt segregation in deforming metapelites. Phys. Earth Planet. Interiors 177, 173–179. doi:10.1016/j.pepi.2009.08.011
Peck, W. H., Valley, J. W., and Graham, C. M. (2003). Slow oxygen diffusion rates in igneous zircons from metamorphic rocks. Am. Mineralogist 88, 1003–1014. doi:10.2138/am-2003-0708
Pek, A., Mal’kovsky, V., and Korikovsky, S. (2012). Reactive infiltration instability of a granitization front during the generation and development of granite-gneiss domes. Petrology 20, 205–217. doi:10.1134/s0869591112030046
Piazolo, S., Bestmann, M., Prior, D., and Spiers, C. (2006). Temperature dependent grain boundary migration in deformed-then-annealed material: observations from experimentally deformed synthetic rocksalt. Tectonophysics 427, 55–71. doi:10.1016/j.tecto.2006.06.007
Plümper, O., and Putnis, A. (2009). The complex hydrothermal history of granitic rocks: multiple feldspar replacement reactions under subsolidus conditions. J. Petrology 50, 967–987. doi:10.1093/petrology/egp028
Reiners, P. W., Nelson, B. K., and Ghiorso, M. S. (1995). Assimilation of felsic crust by basaltic magma: thermal limits and extents of crustal contamination of mantle-derived magmas. Geology 23, 563–566. doi:10.1130/0091-7613(1995)023<0563:aofcbb>2.3.co;2
Rosenberg, C., and Riller, U. (2000). Partial-melt topology in statically and dynamically recrystallized granite. Geology 28, 7–10. doi:10.1130/0091-7613(2000)028<0007:pmtisa>2.3.co;2
Roy, M. K., Banerjee, P., Sengupta, T. K., and Dattagupta, S. (2010). Glucose induced fractal colony pattern of bacillus thuringiensis. J. Theor. Biol. 265, 389–395. doi:10.1016/j.jtbi.2010.05.016
Safonov, O. G., and Aranovich, L. Y. (2014). Alkali control of high-grade metamorphism and granitization. Geosci. Front. 5, 711–727. doi:10.1016/j.gsf.2014.03.010
Sawyer, E. (1987). The role of partial melting and fractional crystallization in determining discordant migmatite leucosome compositions. J. Petrology 28, 445–473. doi:10.1093/petrology/28.3.445
Sawyer, E. (2010). Migmatites formed by water-fluxed partial melting of a leucogranodiorite protolith: microstructures in the residual rocks and source of the fluid. Lithos 116, 273–286. doi:10.1016/j.lithos.2009.07.003
Słaby, E., and Martin, H. (2008). Mafic and felsic magma interaction in granites: the hercynian karkonosze pluton (sudetes, bohemian massif). J. Petrology 49, 353–391. doi:10.1093/petrology/egm085
Solano, J., Jackson, M., Sparks, R., Blundy, J. D., and Annen, C. (2012). Melt segregation in deep crustal hot zones: a mechanism for chemical differentiation, crustal assimilation and the formation of evolved magmas. J. Petrology 53, 1999–2026. doi:10.1093/petrology/egs041
Turing, A. (1952). The chemical basis of morphogenesis. Philos. t Roy. Soc. b 237 (641), 37–72. doi:10.1098/rstb.1952.0012
Vernon, R. H. (1999). Quartz and feldspar microstructures in metamorphic rocks. Can. Mineral. 37, 513–524.
Vittal, J. J., and Quah, H. S. (2017). Photochemical reactions of metal complexes in the solid state. Dalton Trans. 46, 7120–7140. doi:10.1039/c7dt00873b
Watson, E. B., and Baxter, E. F. (2007). Diffusion in solid-earth systems. Earth Planet. Sci. Lett. 253, 307–327. doi:10.1016/j.epsl.2006.11.015
Weinberg, R. F., and Mark, G. (2008). Magma migration, folding, and disaggregation of migmatites in the karakoram shear zone, ladakh, nw India. Geol. Soc. Am. Bull. 120, 994–1009. doi:10.1130/b26227.1
Weinberg, R. F., Mark, G., and Reichardt, H. (2009). Magma ponding in the karakoram shear zone, ladakh, nw India. Geol. Soc. Am. Bull. 121, 278–285. doi:10.1130/B26358.1
Weinberg, R. F., Veveakis, E., and Regenauer-Lieb, K. (2015). Compaction-driven melt segregation in migmatites. Geology 43, 471–474. doi:10.1130/g36562.1
Whitney, D., and Irving, A. (1994). Origin of k-poor leucosomes in a metasedimentary migmatite complex by ultrametamorphism, syn-metamorphic magmatism and subsolidus processes. Lithos 32, 173–192. doi:10.1016/0024-4937(94)90038-8
Yang, L., Dolnik, M., Zhabotinsky, A. M., and Epstein, I. R. (2002). Spatial resonances and superposition patterns in a reaction-diffusion model with interacting turing modes. Phys. Rev. Lett. 88, 208303. doi:10.1103/PhysRevLett.88.208303
Keywords: lithological hybridization, phase-interaction, interface pattern, diffusional-mixing, reaction-coupling, pinning effects
Citation: Baruah A, Roy MK, Mandal N and Misra S (2023) Reaction-diffusion modelling of petrological mixing mechanisms in the evolution of continental crusts. Front. Earth Sci. 11:1115103. doi: 10.3389/feart.2023.1115103
Received: 03 December 2022; Accepted: 04 December 2023;
Published: 22 December 2023.
Edited by:
Jeroen van Hunen, Durham University, United KingdomReviewed by:
Ritabrata Dasgupta, Yonsei University, Republic of KoreaCopyright © 2023 Baruah, Roy, Mandal and Misra. This is an open-access article distributed under the terms of the Creative Commons Attribution License (CC BY). The use, distribution or reproduction in other forums is permitted, provided the original author(s) and the copyright owner(s) are credited and that the original publication in this journal is cited, in accordance with accepted academic practice. No use, distribution or reproduction is permitted which does not comply with these terms.
*Correspondence: Amiya Baruah, YW1peWEuYmFydWFoQGNvdHRvbnVuaXZlcnNpdHkuYWMuaW4=
Disclaimer: All claims expressed in this article are solely those of the authors and do not necessarily represent those of their affiliated organizations, or those of the publisher, the editors and the reviewers. Any product that may be evaluated in this article or claim that may be made by its manufacturer is not guaranteed or endorsed by the publisher.
Research integrity at Frontiers
Learn more about the work of our research integrity team to safeguard the quality of each article we publish.