 Gang Chen
 Hongyan Qi1
 Chenggang Xian
95% of researchers rate our articles as excellent or good
Learn more about the work of our research integrity team to safeguard the quality of each article we publish.
Find out more
ORIGINAL RESEARCH article
Front. Earth Sci. , 19 January 2023
Sec. Solid Earth Geophysics
Volume 11 - 2023 | https://doi.org/10.3389/feart.2023.1114389
This article is part of the Research Topic Unconventional Hydrocarbon Resources Evaluation Through Geological, Geophysical and AI View all 9 articles
Fengcheng Formation in the Mabei Slope of Junggar Basin has low porosity and permeability. However, fractures are well developed, representing an effective storage space for shale oil. Core and experimental data show that the shale oil reservoir of Fengcheng Formation positively correlates with oil content and fractures. And the fracture density has a good quantitatively positive correlation with crude oil production from the production data. Fengcheng Formation has been significantly enriched and accumulated with shale oil due to fractures serving as reservoirs and seepage channels. Therefore, quantitative prediction of fractures is the key to finding high production areas of shale oil in the Fengcheng Formation. The purpose of this study is to extract the seismic attributes that are sensitive to shale oil reservoir fractures. These attributes include curvature, deep learning fracture detection, maximum likelihood, eigenvalue coherence, and variance cube. Furthermore, a seismic multi-attribute fracture density prediction model is trained at the well point using a feedforward neural network method, and the spatial distribution of fracture density is predicted. The results show that the predicted fracture density is consistent with the formation micro imaging logs in the area. Simultaneously, combined with the understanding of the quantitative relationship between fracture density and shale oil production, quantitative prediction results of fracture density could provide the basis for determining the distribution and optimal location of high-quality shale oil wells in the study area. This study will serve as a benchmark for identifying fractures in shale oil reservoirs worldwide.
In the Junggar basin of Western China, exploration and development have gradually moved toward deep areas with substantial potential resources, but these deep-buried reservoirs are usually unconventional tight sandstone reservoirs or shale reservoirs with low porosity and ultra-low permeability. Shale reservoirs of the Fengcheng Formation in Mabei have average effective porosity lower than 6%, and their horizontal permeability is less than .024 mD (Song et al., 2022). In this reservoir, fine dolomite siltstone and dolomitic mudstone dominate, which indicates low porosity and ultra-low permeability (Zhi et al., 2021). However, microfractures are well developed and provide significant oil reservoir space. Based on core observation and description, there is a significant positive correlation between the shale oil content and fracture in this area (Yang et al., 2021). The reservoirs are characterized by extensive fractures that have contributed to the accumulation and enrichment of shale oil and served as an important storage area and seepage channel (Ahmad et al., 2020; Ahmad et al., 2022).
Currently, mainly geological, logging, and seismic methods are used for fracture prediction. With continuous observation in space, seismic data has played a significant role in fracture prediction. There are mainly two ways of seismic fracture prediction: post-stack and pre-stack. However, at present, seismic fracture prediction primarily uses geometric attributes like amplitude or phase attributes extracted from seismic data to predict fractures qualitatively, but a quantitative prediction method for fracture density has not yet been formed. Machine learning is the combination of algorithms and statistical model that enables computers to extract attribute information directly from large data sets without inferring the physical mechanism. Experienced seismologists have the intuition and logic in data analysis, but machine learning can surpass human beings to discover new and invisible attributes hidden in datasets (Jia et al., 2019; Xie et al., 2019; Chen et al., 2021). Research has applied machine learning to fracture prediction, but most of them are limited to the prediction of logging data (Shen et al., 2007). Li et al. (2006) combined logging data with seismic data and used BP neural network to comprehensively predict fracture development zones. He et al. (2020) used the approximate support vector machine algorithm for fracture classification.
In order to realize the quantitative prediction of fracture density in Mabei Fengcheng Formation, this study proposes to establish a quantitative prediction relationship between fracture sensitive attributes and fracture density interpreted by FMI logging based on a multi-layer feedforward neural network algorithm. Firstly, fracture sensitive attributes are extracted which should be compatible with FMI logging. Then, a seismic multi-attribute fracture density prediction model is trained at the well point using a multi-layer feedforward neural network method. Finally the spatial distribution of fracture density is predicted.
The north slope of Mahu sag is structure with Wuxia fault zone in the north and Mahu sag in the south. Wuxia fault zone is mainly composed of NE trending faults, folds, which are related to thrust faults and fault folds. There are few faults and undeveloped folds in the southern slope, and the Permian, Triassic, Jurassic, and Cretaceous are inclined to the South as a whole. High quality alkaline lacustrine source rocks are developed in Fengcheng Formation, which is the key strata for exploration as well. The Fengcheng Formation is jointly affected by terrigenous clastic sedimentation, endogenous chemical sedimentation and volcanic activity, forming the orderly distribution of glutenite dolomitic sandstone dolomitic mudstone and argillaceous dolomite, which are spatially associated with conventional volcanic rocks and fractured reservoirs, forming a full range of reservoirs. Thus, the shale oil reservoir lithology of Permian Fengcheng Formation in the north slope area of Mahu sag is dominated by dolomite and a small amount of volcanic rock fragments. Through the analysis of logging data, seismic facies, and paleogeomorphology, it is considered that this formation mainly develops shore-shallow lacustrine, with inner-sourcing fine-grained sediments as the main and out-sourcing sediments as the auxiliary (He et al., 2021). Fengcheng Formation is controlled by facies sequence, and all types of oil and gas reservoirs of conventional oil reservoir, tight oil reservoir and shale oil reservoir coexist orderly. Some areas are affected by strong volcanic activities, which led to high tufaceous content.
According to reservoir sample analysis of Fengcheng Formation, the porosity of the dolomite sweet spots reservoir is 3.1%∼12.3%, with an average of 5.3%. And the permeability is .011∼228 mD, with an average of .201 mD, which belongs to low porosity and ultra-low permeability reservoir with typical shale oil characteristics (Song et al., 2022). The pores containing shale oil in Fengcheng Formation, Mabei area are fractures and dissolution pore. From the comprehensive interpretation of core, slice, and well logging, shale microfractures are relatively developed in Fengcheng Formation, which represents an important storage space for shale oil. The fracture types of Fengcheng Formation include netted fractures, straight split fractures, oblique fractures, and horizontal fractures (Figures 1A–C) with an average fracture density of 20∼30 fractures per meter, average fracture width of .1∼8 mm, and average fracture length of 1∼53 cm. Through core observation and analysis, we found that there is an obvious positive correlation between the oil content and fracture in the Fengcheng Formation shale oil reservoir. For the same lithofacies, the more developed the fractures are, the better the oil-bearing property is (Figure 1D).
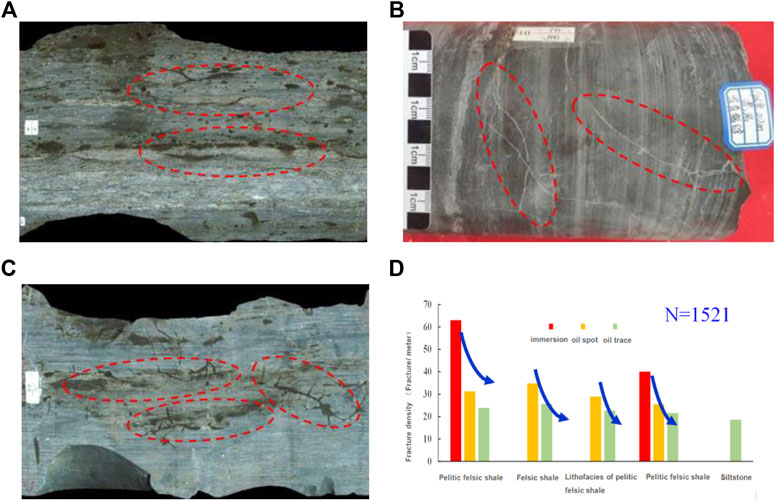
FIGURE 1. Core photos of Fengcheng Formation of Mahe north slope and Correlation between oil-bearing attribute and fracture density, (A) Clay shale, fracture filled with dolomite, (B) Clay shale, high angle oblique fracture, (C) dolomitic shale, map cracking, (D) Correlation between oil-bearing attribute and fracture density of Fengcheng Formation.
We consider that the quantitative prediction of fracture density is a regression problem. Therefore, to find out the fracture development area of the shale oil reservoir in the Mabei Fengcheng Formation, the fracture quantitative prediction model is established by multi-layer feedforward neural network (Rumelhart and McClelland, 1986). Firstly, it is important to extract the seismic attributes sensitive to shale oil reservoir fractures. Secondly, a quantitative prediction relationship is established between fracture-sensitive attributes and fracture density interpreted by FMI logging based on multi-layer feedforward neural network algorithm.
Currently, there are mainly three methods for seismic fault identification: coherence attribute, curvature attribute, and unconventional attributes. Coherence class attributes include coherence, variance, and likelihood. These attributes are based on the discontinuity of seismic reflection events caused by the fault to predict the fault distribution. Curvature attributes (maximum positive curvature, maximum negative curvature, Gaussian curvature, etc.) mainly predict the fault development position through the bending change of seismic waveform caused by the fault. In recent years, the distribution of faults predicted by unconventional methods has also gradually increased. These methods are based on deep-learning which is helpful to improve the identification ability of small faults.
Curvature is used to reflect the bending degree of geometry. It describes the bending degree of any point on the curve and indicates the degree of deviation of the curve from the straight line (Roberts, 2001). The greater the curvature is, the greater the degree of curvature of the curve. Among various curvature attributes, the maximum positive curvature and the minimum negative curvature have been widely concerned by researchers and proved effective for fault and fracture identification. The maximum positive and minimum negative values of all normal curvatures of a point are the maximum positive and the minimum negative curvatures, respectively. The maximum positive curvature highlights the positive curvature value at any point on the surface. It highlights the anticline and uplift structures on the surface. The minimum negative curvature highlights the negative curvature value at any point on the surface and highlights the syncline and depression structure on the surface (Chopra and Marfurt, 2007).
The maximum likelihood attribute is proposed by Hale in 2012 when studying fault section extraction and fault distance estimation mainly used to enhance the seismic imaging effect of faults. The calculation of the likelihoods attribute is based on the seismic similarity attribute, so the similarity attribute is calculated firstly before calculating likelihoods attribute. Similarity attribute (Semblance) oriented by highlighting fault identification can be expressed as follows:
Where
Likelihoods attribute can be calculated as follows:
The likelihood attribute is the difference between the exponential power of the semblance attribute and 1, and its value range is limited to 0–1. Compared with the semblance attribute, the likelihood attribute has an amplification effect on the comparison of similarity between adjacent samples, which is more conducive to convexity imaging of obvious fracture. At the fault location, the continuity of the seismic event becomes poor, the semblance becomes small, and the likelihood attribute becomes large, which means that the possibility of the fault is increased.
The theoretical basis of variance attribute is error analysis theory, which describes the horizontal heterogeneity of strata and lithology by using the similarity between adjacent seismic traces, especially in identifying faults and understanding the distribution of sand bodies closely related to reservoir characteristics. The core of the variance attribute is to obtain the variance value of all points of the whole three-dimensional data volume. The specific steps are: firstly, the variance value of each sample point is obtained, that is, the variance between the point and the average principal value calculated by all sample points in the time window of adjacent seismic traces around, and then the required value by weighted normalization is acquired (Zhao et al., 2006).
In conventional attributes, faults are considered as seismic reflection discontinuities and are detected by calculating attributes that estimate reflection continuities or discontinuities. In the unconventional deep-learning method, fault detection is considered a binary image segmentation problem of labeling a 3D seismic image with ones on faults and zeros elsewhere. An efficient image-to-image fault segmentation is performed by using a supervised convolutional neural network. To train the network, 200 3D synthetic seismic images, and corresponding binary fault labeling images are created by seismic fault forward modeling (Figures 2A,B). These fault labeling images are comprised of different scale faults. After training with only the synthetic datasets, the network automatically learns to calculate rich and proper features that are important for fault detection. Compared with conventional methods, the network can identify different scale fractures, including the large-scale fault fracture zone, the mesoscale fracture zone, and the small-scale fracture zones. Multiple field examples show that the neural network (trained by only synthetic datasets) can more accurately and efficiently predict faults from 3D seismic images than the conventional methods (Wu et al., 2019).
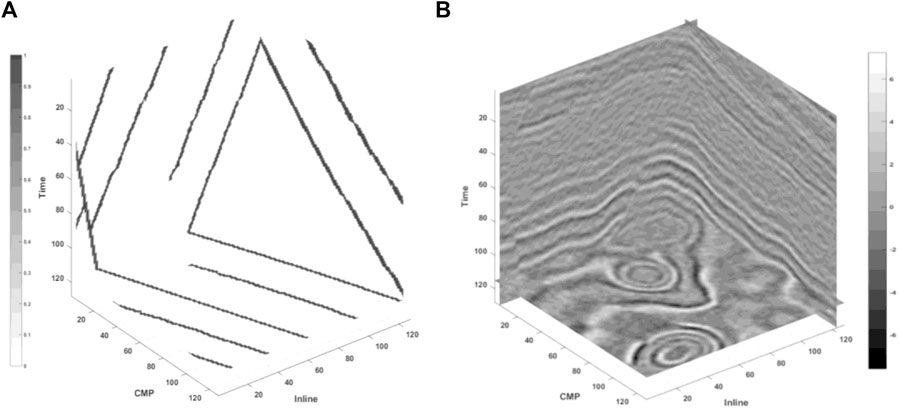
FIGURE 2. (A) fault label, (B) seismic synthetic with fault label forward.
Eigenvalue coherence is the third generation coherence technique, a quantitative method to calculate the similarity of waveforms. It is realized by defining the global aperture in time and space and calculating inclination and azimuth. In this attribute, a covariance matrix is composed of the multi-channel seismic data. The correlation between the multi-channel data is obtained by using the multi-channel feature decomposition technique.
Machine learning is widely used in oil and gas exploration and production. It is suitable for a large amount of data and many types of data. The machine learning algorithm is used to mine the desired information and improve work efficiency; Feedforward neural network, also known as multi-layer perceptron, is a typical Machine learning model (Figure 3). It is a unidirectional multi-layer structure, in which each layer contains several neurons, and each neuron is fully interconnected with the next layer of neurons, without the same layer connection and cross layer connection, including an input layer, an output layer, and several hidden layers.
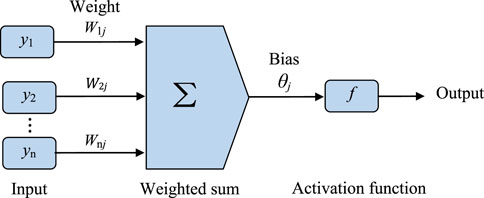
FIGURE 3. Schematic diagram of forward propagation input.
The neural network weights are initialized to small random numbers, and each neuron has an associated bias, which is also initialized to small random numbers.
Take a single neural network cell as an example, as shown below.
Given the cell
Where
Given the net input
For the output layer cell
Where
For the hidden layer cell
Where
Weights update, as shown below:
Where
Bias update, as shown below:
Where
The process of error back propagation is to distribute the error to all cells of each layer, to obtain the error signal of each layer, and then correct the weight of each cell, that is, the weight adjustment process.
To realize the quantitative prediction of fracture density, a specific workflow based on sensitive seismic attributes and a multi-layer feedforward neural network algorithm is explicitly described and shown in Figure 4.
• The seismic fracture identification attributes compatible with fracture density interpreted by FMI logging are extracted. The near well attribute traces are used as the training data of MFNN.
• The fracture density interpreted by FMI logging is used as the labeled data, and the MFNN is applied for learning to obtain the fracture quantitative prediction model.
• The fracture quantitative prediction model is applied to the whole seismic fracture identification attribute volumes to obtain the fracture density volume, then verify the accuracy of the fracture density volume, and find out the favorable area for fracture development.
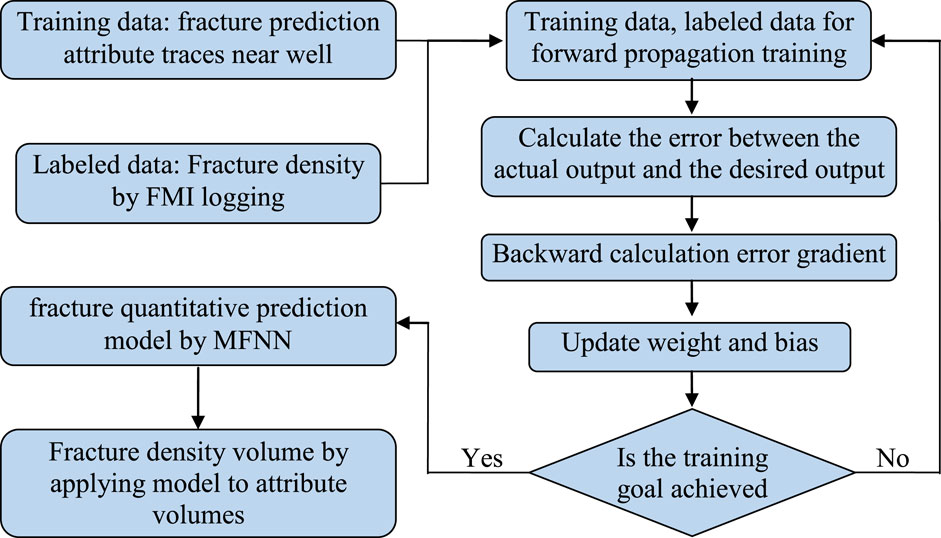
FIGURE 4. Flow chart of fracture quantitative prediction model using multilayer feedforward neural network.
The maximum positive curvature attribute of the third member of the Fengcheng Formation in Mabei is superimposed on the current geomorphic map. The shale oil reservoir in the target area is compressed by north-south tectonic stress, forming two large-scale East-West regional structural faults. Large curvature values represent large structural faults, and medium and small curvature values represent small-scale faults and fracture-developed areas. On the whole, fractures are relatively developed near large-scale faults and in the shale with high dolomite in the northern part of the area (Figure 5).
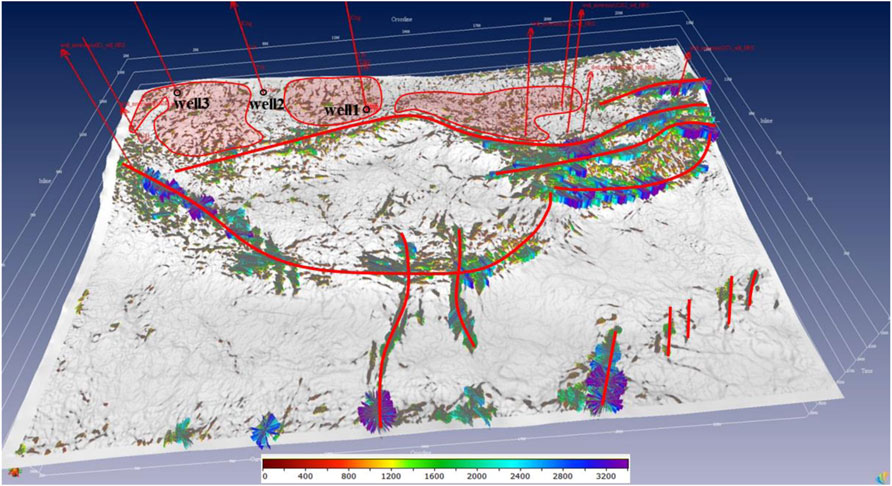
FIGURE 5. Plane view of curvature attributes superimposed current structural fractures prediction in upper sweet spots of Fengcheng Formation, Mabei slope.
According to the development of local fracture characteristics, the fracture development of well one and well three is greater than that of well two, which consists of the interpretation result that the fracture density of well one and well three is greater than that of well two interpreted by logging FMI (Figure 6). Therefore, the curvature attributes can be used as attributes for fracture density prediction.
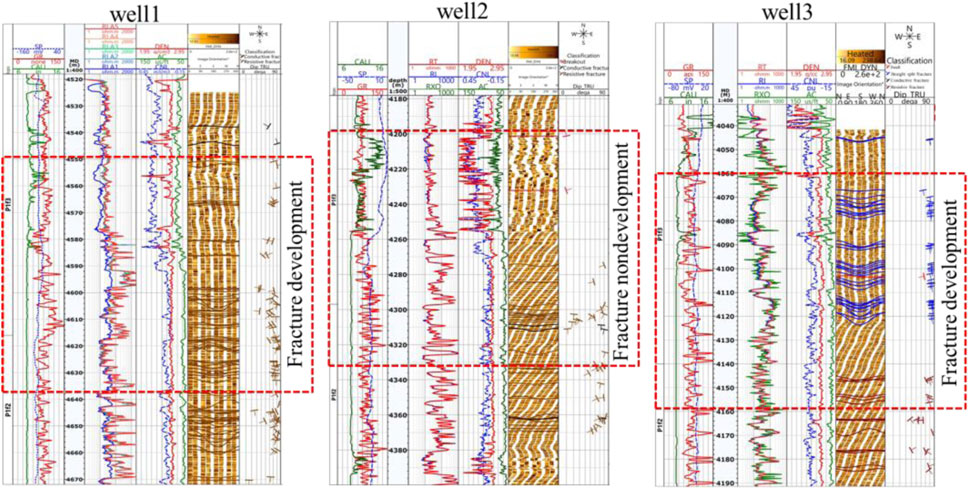
FIGURE 6. FMI logging of fracture density of the third member of Fengcheng Formation in Mabei slope.
The seismic curvature attributes reflect the difference of formation faults resulting from the different degree of plane bending when the formation is compressed by tectonic stress (Figure 7A). The maximum likelihood method is to use the probability model to find the corresponding fault attributes that can produce different seismic trace with high probability (Hale D. 2013) (Figure 7B). The basis of seismic variance cube is error analysis, which mainly counts the variance value of adjacent seismic signals to represent the similarity, so as to describe the faults (Figure 7C). Wu et al. (2019) used the U-net simplified end-to-end convolution neural network proposed by Ronneberger et al. (2015) to train a large number of forward seismic sections containing faults and fault label data in the way of binary pattern recognition, and established a deep learning fault recognition model, which obtained an excellent effect in fracture recognition (Wu et al., 2019) (Figure 7D). The basis of eigenvalue coherence is the coherence algorithm, which establishes the matrix of adjacent seismic subbodies, and calculates the eigenvalues of the matrix to describe the development law of faults (Figure 7E).
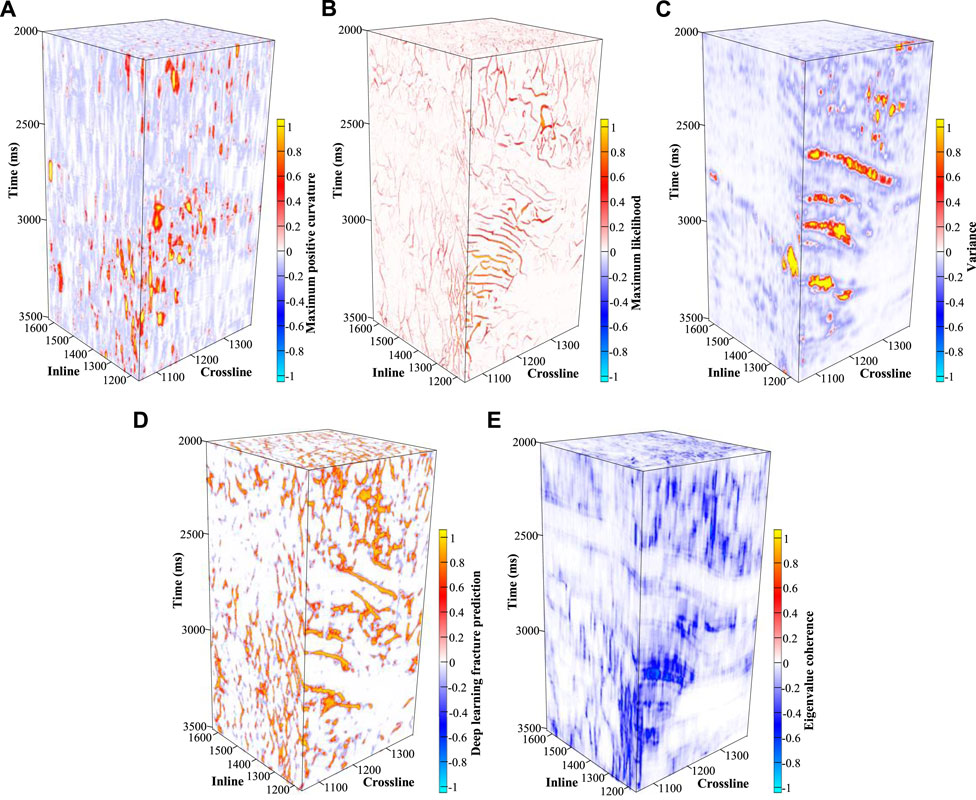
FIGURE 7. Stereoscopic display of the fracture attribute body, (A) maximum positive curvature, (B) maximum likelihoods, (C) Variance, (D) deep learning fracture prediction, (E) eigenvalue coherence.
The quantitative prediction of fracture density interpreted by FMI logging based on multiple seismic fracture sensitive attributes is a quantitative prediction of continuous regression value. Therefore, the multi-layer feedforward neural network is selected. Within the network, neurons of each layer are fully interconnected with that of the next layer, and there is no same-layer connection or cross-layer connection between neurons. Such a structure is called multi-layer feedforward neural network.
The neural network learning process is to adjust the weight between neurons and the threshold value of each functional neuron according to the training data. The main idea is to input the training dataset into the input layer of MFNN, pass through the hidden layer, and finally reach the output layer and output the results, which is the forward propagation process of MFNN. Due to the error between MFNN output and the actual outcome, we managed to calculate the error between the estimated value and the actual value and back propagated the error from the output layer to the hidden layer until it is propagated to the input layer; In the process of back propagation, the values of various parameters are adjusted according to the error. The above process is continuously iterated until convergence. Due to the well relativity between selected seismic fracture sensitive attributes and the fracture density law, the regression fracture density calculation model does not need to be too complex. Therefore, the design of multi-layer feedforward neural network uses a simple three-layer neural network, including 10 hidden nodes and five input nodes with 50 times of total iterations and 50 times of conjugate gradient.
According to the quantitative FMI logging prediction of structural fracture density based on seismic multi-fracture sensitive attributes, the fracture density of well 1 is between 1 and 2 fractures per meter, which is relatively developed as a whole. There is a large fault fracture zone in the south. The fracture density of well 2 is .5 fractures per meter, and that of well 3 is 1.5–2 fractures per meter (Figure 8C), which is consistent with the results of well FMI logging. Moreover, the distribution characteristics of fracture density are consistent with the fracture prediction attributes as a whole (Figures 8A,B), which confirms the accuracy of fracture density prediction. By comparing the fracture density volume with the seismic fracture prediction attributes, the variance can only describe large-scale fractures, and the effect of describing small-scale fractures is poor. The maximum positive curvature attribute has a good effect on describing medium and small-scale fractures, but the overall distribution of large-scale fractures is slightly poor, The fracture density volume not only makes the fracture prediction from qualitative to quantitative, but also integrates the characteristics of all fracture prediction attributes, which has a good description effect on large, medium and small-scale fractures. Combining intersection analysis of fracture density and shale oil production in the well, we can learn that when the fracture density is less than .5, there is basically no production (Figure 8D). Therefore, our deployment wells must be deployed where the fracture density is greater than .5.
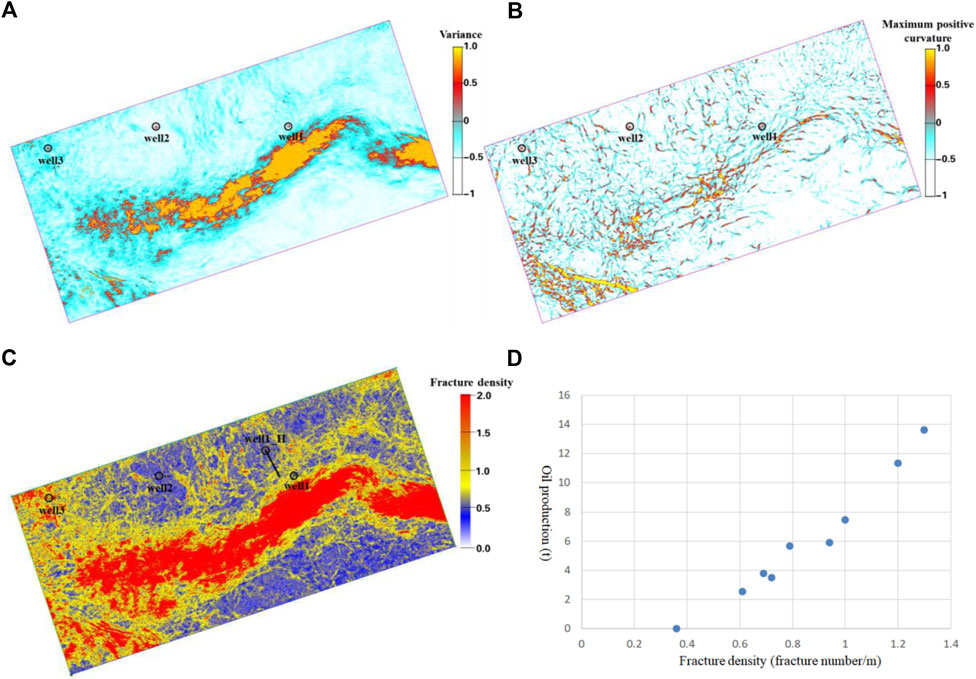
FIGURE 8. (A) Variance in upper sweet spot, (B) maximum positive curvature in upper sweet spot, (C) fracture density in upper sweet spot predicted by multilayer feedforward neural network, (D) intersection analysis of fracture density and shale oil production in the well.
According to the quantitative prediction results of fracture density and In-situ stress characteristics for the study area, a horizontal well (well1_H) has been deployed in the fracture development zone in the north of well1 to explore the shale oil productivity of Fengcheng Formation in the slope of Mahu (Figure 9B). At present, the well has been drilled and the horizontal section is 1000 m long. FMI fracture interpretation results in Figure 9A show that the well trajectory can be divided into four sections according to the degree of fracture development, the corresponding fracture number and fracture density are: ① 112 pieces, .37 pieces/m, ② 452 pieces, 1.13 pieces/m, ③ 146 pieces, .73 pieces/m, ④ 492 pieces, 1.23 pieces/m. The fracture density prediction result in Figure 9B shows that the well trajectory can also be divided into four sections, and the corresponding fracture density is: ① .4 pieces/m, ② 1.0 pieces/m, ③ .7 pieces/m, ④ 1.1 pieces/m. The fracture density prediction results are consistent with the FMI fracture interpretation results. This shows that the quantitatively predicted fracture density results are very reliable. Moreover, this deployed horizontal well (well1_H) has a maximum daily crude oil output of 108t, which is due to the fact that the trajectory of the horizontal well is optimized to have all fracture densities greater than .5 between control points A and B.
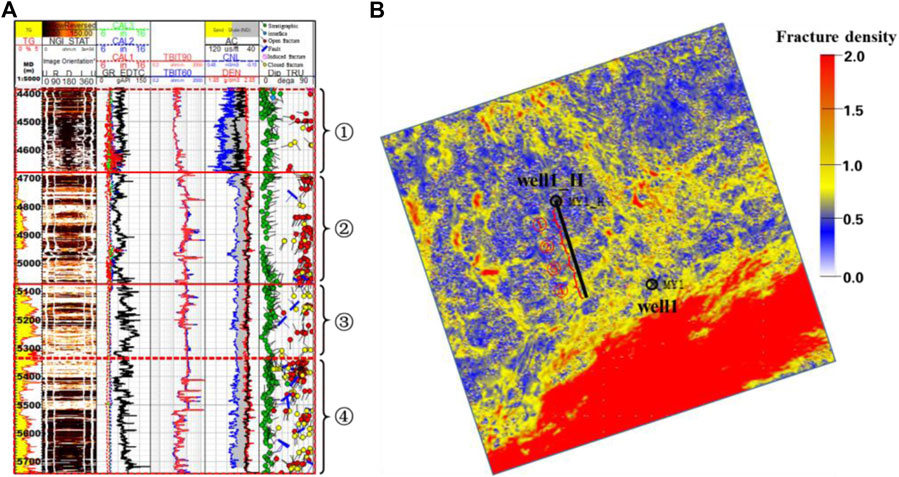
FIGURE 9. (A) well1_H FMI fracture interpretation result, (B) local fracture density display plan.
There are many fracture prediction attributes. When the neural network is learning, seismic fracture attributes should be chosen that are consistent with the FMI interpretation results, ensuring the learning results’ accuracy. Variance and eigenvalue coherence are good for characterizing large-scale fractures, and maximum likelihoods, maximum positive curvature, deep learning fracture prediction are advantageous for characterizing medium and small-scale fractures. The selection of neural network parameters is crucial to the prediction results. The optimal number of hidden layer nodes and the optimal times of iterations should be selected appropriately. Then, the fracture density volume can be obtained through the training data without wasting computing power and time. We believe that the methodology presented in this study is not the region- or case-specific. Therefore, it could be adopted by researchers working in different fields.
The shale oil reservoir of Fengcheng Formation in the Mabei Slope of Junggar Basin has low porosity and permeability. However, fractures are well developed, representing an effective storage space for shale oil. Core and experimental data show that the Fengcheng Formation shale oil reservoir positively correlates with oil content and fractures. Thus, a quantitative fracture prediction model need to be established by using seismic fracture sensitive attributes based on a multi-layer feedforward neural network algorithm to realize the quantitative prediction of fracture density of Fengcheng Formation in Mabei Slope of Junggar Basin. By comparing the fracture density quantitatively predicted by the multi-layer neural network with the fracture density explained by the FMI of the actual drilling, it can be seen that the established fracture prediction model in this paper has good accuracy. And according to fracture density being a good positive correlation with crude oil production from the production data, horizontal wells should not be deployed in areas with fracture density less than .5 in the shale oil reservoir of Fengcheng Formation. This can help guide us where the horizontal wells should be deployed to efficiently develop shale oil. Therefore, the quantitative prediction method of fracture density using a multi-layer feedforward neural network proposed in this paper will serve as a benchmark for identifying fractures in shale oil reservoirs worldwide.
The raw data supporting the conclusion of this article will be made available by the authors, without undue reservation.
Conceptualization: GC, HQ, CX, and YS; methodology: GC, JY, and WL; formal analysis: ML, and JW; writing-original draft preparation: GC, JY and WL; and writing-review and editing: GC, JY and WL.
Thanks for the support of CNPC’s major science and technology project “Research and application of key technologies for exploration and development of terrestrial medium and high maturity shale oil” (2019E-26) and the Science and Technology Fund Projects of PetroChina Company Limited (2021DJ1803). We also thank reviewers for reviewing this manuscript.
GC, HQ, JY, WL, YS, and JW were employed by PetroChina Xinjiang Oilfield Company; ML was employed by Exploration and Development Research Institution, PetroChina Xinjiang Oilfield Company.
The remaining authors declare that the research was conducted in the absence of any commercial or financial relationships that could be construed as a potential conflict of interest.
All claims expressed in this article are solely those of the authors and do not necessarily represent those of their affiliated organizations, or those of the publisher, the editors and the reviewers. Any product that may be evaluated in this article, or claim that may be made by its manufacturer, is not guaranteed or endorsed by the publisher.
Adnan Ahmad, Q., Irfan Ehsan, M., Khan, N., Majeed, A., Zeeshan, A., Ahmad, R., et al. (2022). Numerical simulation and modeling of a poroelastic media for detection and discrimination of geo-fluids using finite difference method. Alexandria Eng. J. 61 (5), 3447–3462. doi:10.1016/j.aej.2021.08.064
Ahmad, QA., Wu, G., Zong, Z., Wu, J., Irfan Ehsan, M., and Du, Z. (2020). A rock physical approach to understand geo-mechanics of cracked porous media having three fluid phases. Geomechanics Eng. 23 (4), 327–338.November 25
Chen, Q., Wen, X., He, J., Hn, L., and L, L. (2021). Prediction of a fracture zone using an extreme learning machine. Geophys. Prospect. petroleum 60 (1), 149–156.
Chopra, S., and Marfurt, K. J. (2007). Seismic attributes for prospect identification and reservoir characterization. Society of Exploration Geophysicists. Tulsa, Oklahoma[M]
Hale, D. (2013). Methods to compute fault images, extract fault surfaces, and estimate fault throws from 3D seismic images. Geophysics 78 (2), 33–43. doi:10.1190/geo2012-0331.1
He, J., Wu, G., Nie, W., Liu, S., and Huang, W. (2020). Fracture classification method based on proximal support vector machine. Lithol. Reserv. 32 (2), 115–121.
He, W., Qian, Y., Zhao, Y., Li, N., Zhao, X., Liu, G., et al. (2021). Exploration implications of total Petroleum system in Fengcheng Formation, Mahu sag, Junggar Basin. Xinjiang Pet. Geol. 42 (6), 641–655.
Jia, J., WangYun, F., and WuJu, Q. (2019). Review of the application of machine learning in seis-mic detection and phase recognition. China Earthq. Eng. J. 41 (6), 1419–1425.[J]
Li, J., Tianna, H., and Zhao, B. (2006). Comprehensive prediction of fracture development zone with seismic and logging data. Prog. Geophys. 21 (1), 179–183.
Roberts, A. (2001). Curvature attributes and their application to 3D interpreted horizons. First break 19 (2), 85–100. doi:10.1046/j.0263-5046.2001.00142.x
Ronneberger, O., Fischer, P., and Brox, T. (2015). U-net: Convolutional networks for biomedical image segmentation: International Conference on Medical image computing and computer-assisted intervention. Springer, Berlin, Germany, 234–241.
Rumelhart, D. E. (1986). Learning representations by error propagation, in DE rumelhart, JL McClelland & PDP research group. Parallel distrib. Process. 1.
Shen, H., and Gao, S. (2007). Study on fracture identification based on BP neural network. Fault-block Oil Gas Fields 14 (02), 60–62.
Song, Y., Yang, Z., He, W., Gan, R., Zhang, R., Huang, L., et al. (2022). Exploration progress of alkaline lake type shale oil of the Permian Fengcheng Formation in Mahu Sag, Junggar Basin. China Pet. Explor. 27 (1), 60–72.
Wu, X., Liang, L., Shi, Y., and Fomel, S. (2019). FaultSeg3D: Using synthetic data sets to train an end-to-end convolutional neural network for 3D seismic fault segmentation [J]. Geophysics 84, 1–36.
Xie, W., Chenchen, Bi., Liu, W., Yao, M., and Hu, S. (2019). Research progress of application of machine learning method in geophysical logging. Annu. Meet. oil gas Geophys.
Yang, Z., Tang, Y., Guo, X., Huang, L., Wang, Z., and Zhao, X. (2021). Occurrence states and potential influencing factors of shale oil in the permian Fengcheng Formation of Mahu sag, Junggar Basin. Petroleum Geol. Exp. 43 (5), 784–796.
Zhao, M., Yang, W., and Cui, H. (2006). Identification of small faults and fissure development zones with variance volume technique. Geophys. Geochem. Calc. Technol. 28 (3), 216–218.
Keywords: shale oil reservoirs, fracture density prediction, seismic multi-attribute, neural network, low porosity and permeability
Citation: Chen G, Qi H, Yu J, Li W, Xian C, Lu M, Song Y and Wu J (2023) Application of a multi-layer feedforward neural network to predict fracture density in shale oil, Junggar Basin, China. Front. Earth Sci. 11:1114389. doi: 10.3389/feart.2023.1114389
Received: 02 December 2022; Accepted: 05 January 2023;
Published: 19 January 2023.
Edited by:
Qamar Yasin, Institute of Geophysics (Polska Akademia Nauk - PAN), PolandReviewed by:
Qazi Adnan Ahmad, Yonsei University, South KoreaCopyright © 2023 Chen, Qi, Yu, Li, Xian, Lu, Song and Wu. This is an open-access article distributed under the terms of the Creative Commons Attribution License (CC BY). The use, distribution or reproduction in other forums is permitted, provided the original author(s) and the copyright owner(s) are credited and that the original publication in this journal is cited, in accordance with accepted academic practice. No use, distribution or reproduction is permitted which does not comply with these terms.
*Correspondence: Gang Chen, am9pbnRpbnZlcnNpb25AMTYzLmNvbQ==
Disclaimer: All claims expressed in this article are solely those of the authors and do not necessarily represent those of their affiliated organizations, or those of the publisher, the editors and the reviewers. Any product that may be evaluated in this article or claim that may be made by its manufacturer is not guaranteed or endorsed by the publisher.
Research integrity at Frontiers
Learn more about the work of our research integrity team to safeguard the quality of each article we publish.