
94% of researchers rate our articles as excellent or good
Learn more about the work of our research integrity team to safeguard the quality of each article we publish.
Find out more
ORIGINAL RESEARCH article
Front. Earth Sci., 20 April 2023
Sec. Volcanology
Volume 11 - 2023 | https://doi.org/10.3389/feart.2023.1114001
This article is part of the Research TopicRemote Sensing of Volcanic Gas Emissions from the Ground, Air, and SpaceView all 18 articles
 Susana Layana1,2,3*
 Felipe Aguilera1,3,4
 Manuel Inostroza1
 Franco Tassi5
 Thomas Charles Wilkes6
 Stefan Bredemeyer7,8
 Cristóbal González1,2
 Tom David Pering6
 Andrew John Samuel McGonigle9
One of the major problems in the volcanic surveillance is how data from several techniques can be correlated and used to discriminate between possible precursors of volcanic eruptions and changes related to non-eruptive processes. Gas chemical surveys and measurements of SO2 emission rates performed in the past (2006–2019) at Lastarria volcano in Northern Chile have revealed a persistent increment of magmatic sourced gas emissions since late November 2012, following a 13 years period of intense ground uplift. In this work, we provide new insights into the gas-chemical evolution of Lastarria’s fumarolic discharges obtained from direct sampling (2006–2019) and SO2 emission rates using UV camera and DOAS instruments (2018–2019) and link these to pre-existing information on ground deformation (1998–2016) in order to determine the origin of observed degassing and ground deformation processes. We revise the four mechanisms originally proposed as alternatives by Lopez et al. (Geosphere, 2018, 14 (3), 983–1007) to explain the changes observed in the fluid geochemistry and ground deformation between 2009 and 2012, in order to explain major changes in gas-geochemistry over an extended period between 1998 and 2019. We hypothesize that a continuous sequence of processes explains the evolution in the fluid geochemistry of fumarolic discharges. Two mechanisms are responsible of the changes in the gas composition during the studied period, corresponding to a 1) deep magma chamber (7–15 km depth) pressurized by volatile exsolution (1998–2020), which is responsible of the large-scale deformation; followed by 2) a crystallization-induced degassing (2001–2020) and pressurization of the hydrothermal system (2003-early November 2012), where the former process induced the changes in the gas composition from hydrothermal-dominated to magmatic-dominated, whereas the last produced the small-scale deformation at Lastarria volcano. The changes in the gas composition since late November 2012, which were strongly dominated by magmatic volatiles, produced two consecutive processes: 1) acidification (late November 2012–2020) and 2) depletion (2019–2020) of the hydrothermal system. In this work we have shown that a long-term surveillance of the chemistry of fluid discharges provides valuable insights into underlying magmatic/volcanic processes, and consequently, for forecasting future eruptions.
Changes in volcanic activity can be tracked by the variations in the data obtained from several monitoring techniques as seismicity, degassing, thermal energy released, ground deformation, among others. Those variations can be in some cases indicative of eruptions (Spampinato et al., 2019; Caudron et al., 2021), although in other cases only represent changes in the internal activity of volcanoes, not necessarily finishing with an eruption (Galetto et al., 2019; Guo et al., 2019). For decades, several investigations have focused on determining the internal behavior of volcanic systems and to track pre-eruptive activity, in order to find possible precursor signals, to anticipate the eruptive activity, and consequently, to reduce the risks related to volcanic processes (Williams-Jones and Rymer, 2002; Dempsey et al., 2020). Geophysical parameters, such as seismicity, ground deformation and gravimetry have been measured and monitored individually or combined to detect several internal processes, such as influx of new magma, ascent of magma, magma crystallization, perturbations of hydrothermal systems, among others (Tizzani et al., 2009; Tizzani et al., 2015; Calahorrano-Di Patre et al., 2019). For example, increasing frequency and intensity of earthquakes, and occurrence of swarms (e.g., low frequency events; Bell et al., 2018; Roman and Cashman, 2018) are considered a typical precursor of volcanic activity (e.g., Cameron et al., 2018). Although volcanic eruptions are common after episodes of strong inflation (Segall, 2013), a global study carried out by Biggs et al. (2014) demonstrated that only ∼46% of volcanoes which presented deformation erupted, while 94% of non-deforming volcanoes did not erupt. Similar results were obtained by Galetto et al. (2022), who suggest that magma inflow rates are more reliable in forecasting eruption, at least at basaltic calderas. Complementary, increasing CO2/SO2 ratios can allow detection of the pre-eruptive degassing of rising magma (Aiuppa et al., 2007). Therefore, changes in seismic and ground-deformation data, as well as in the degassing rate, fumarolic fluid composition, and emitted thermal energy, have been used to try to forecast eruptions (Reath et al., 2019; Coppola et al., 2022), although in some cases strong changes in activity and precursory signals have not been followed by eruptive events (Ebmeier et al., 2018; Lopez et al., 2018; Layana et al., 2020).
Lastarria volcano (Northern Chile) is one of the most intense persistently degassing volcanoes in the Central Volcanic Zone of the Andes (CVZA) (Tamburello et al., 2014; Lopez et al., 2018), which has been continuously degassing since at least late XIX century (González-Ferrán, 1995). Since 1998, the volcanic chain constituted by Lastarria, Cordón del Azufre, and Cerro Bayo volcanoes, and also known as Lazufre, has undergone a continuous large scale ground deformation process related to a deep-magmatic source, and Lastarria volcano exhibited localized small-scale deformation processes (2003–2005) related to a pressurization of its hydrothermal system (e.g., Froger et al., 2007; Ruch et al., 2008). Chemical compositions of gases discharged by Lastarria volcano between 2006 and 2009 were dominated by hydrothermally sourced gas (Aguilera et al., 2012). Data obtained by Tamburello et al. (2014) using MultiGAS, filter pack, and ground-based remote techniques during a field campaign in late November 2012 in contrast indicate a clear magmatic composition. Similarly, Lopez et al. (2018) combined the results of direct gas sampling, MultiGAS, filter pack, ground-based remote techniques, and diffuse CO2 sampling acquired by the participants of the 2014 International Association of Volcanology and Chemistry of the Earth’s Interior (IAVCEI) Commission on the Chemistry of Volcanic Gases (CCVG) 12th Gas Workshop in November 2014, detecting major changes in the gas composition. They proposed 4 alternative models in order to explain the changes in the gas composition between 2009 and 2012 considering the contemporary ground deformation process. These geophysical and geochemical changes may be interpreted as precursory signs of a potential eruptive phase (Lopez et al., 2018).
Despite of the first attempt of Lopez et al. (2018), any correlation between large-and-small scale ground deformation and the changes observed in the gas composition remains elusive. Here we present a unique and large database (due to the frequency of sampling, the number of techniques involved, and the time span considered) of fumarolic gas compositions and emission rates of Lastarria volcano, comprising previously published (May 2006- June 2009) and new unpublished (June 2010-November 2019) data obtained from direct sampling, UV Camera (May 2018-November 2019) and Differential Optical Absorption Spectrometry-DOAS (January and November 2019). The aim of this work is to establish the source(s) of gases, to determine the processes explaining the changes observed in gas composition between 2006 and 2019, and to link with the previously published ground deformation studies (Pritchard and Simons, 2002; Pritchard and Simons, 2004; Froger et al., 2007; Ruch et al., 2008; Anderssohn et al., 2009; Pearse and Lundgren, 2013; Henderson et al., 2017; Pritchard et al., 2018). Consequently, our contribution will point to provide more evidence that the combination of several techniques can be used to detect possible precursors for future eruptions in arc-related volcanoes.
Lastarria sensu stricto (ss) is an active stratovolcano located in the southern portion of the Central Volcanic Zone of the Andes (CVZA) which extends along the Chile-Argentina border (Figure 1). Lastarria ss is part of the Lastarria Volcanic Complex (LVC), which also includes the Negriales lava field and Espolón Sur volcano (Naranjo, 2010). Negriales volcano (from 400 ± 60 to 116 ± 26 ka) is composed of andesitic-to-dacitic lava flows, coulees, and domes, whereas Espolón Sur volcano (150 ± 50 ka) is constituted of andesitic lava and pyroclastic flow deposits. Lastarria ss is the only active structure of the complex and has evolved through 10 eruptive stages (from 260 ± 20 to 2.46 ± 0.050 ka; Naranjo, 2010). Their volcanic products correspond to andesitic-to-dacitic lava flows and domes, pyroclastic flows and fallout deposits, and debris avalanche deposits (Naranjo, 1992; Naranjo, 2010). Although there are no records of historical eruptive activity, a persistent degassing has been observed since the early 19th century (Casertano, 1963; González-Ferrán, 1995), which is concentrated in four fumarolic fields (Figure 1) located in the northwestern flank (fumarolic field 1), in the eastern and western rim of crater IV (fumarolic fields 2 and 3) ,and inside of crater V (fumarolic field 4) (Aguilera et al., 2012).
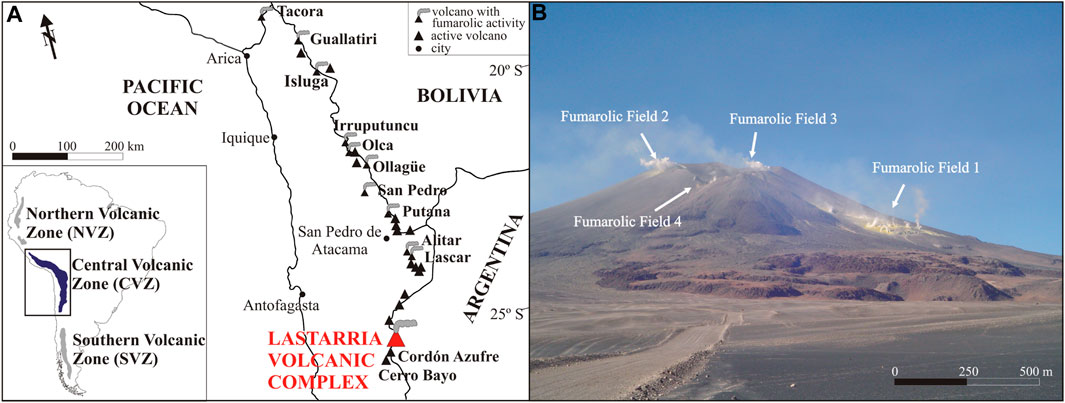
FIGURE 1. (A) Location map of the Lastarria Volcanic Complex and (B) picture of the 4 fumarolic fields (seen from the North).
Large-scale deformation, as detected by InSAR (Interferometric synthetic-aperture radar) and geodetic measurements, has been observed since 1998 in the Lazufre area, which consists of, from north to south, LVC, Cordón del Azufre and Bayo volcanoes. The zone of uplift has been extending over a ∼45 × 37 km NNE-oriented elliptical area (Pritchard and Simons, 2002; Pritchard and Simons, 2004; Froger et al., 2007; Ruch et al., 2008; Anderssohn et al., 2009; Pearse and Lundgren, 2013; Henderson et al., 2017; Pritchard et al., 2018). The maximum average uplift was observed until 2010 with a rate of 3 cm/yr (Pearse and Lundgren, 2013), whilst between 2011 and 2016 the uplift rate was reduced to <1.5 cm/yr, and should continue to decrease over the next decades, until uplift is anticipated to stop (Henderson et al., 2017). Six alternative models have been proposed to explain this large-scale deformation: 1) magma injection; 2) thermal expansion due to assimilation of wall rock; 3) thermally induced volatile exsolution produced by magma crystallization; 4) lateral expansion due to the intrusion of a sill-like magmatic body (Pritchard and Simons, 2004; Froger et al., 2007; Ruch et al., 2008; Anderssohn et al., 2009; Pearse and Lundgren, 2013); 5) a pulse of heat from the magmatic system into an overlying hydrothermal aquifer without changes in magma reservoir volume (Froger et al., 2007); 6) exsolved volatiles from a melt and temporally trapped at relative deep levels (>10 km) that cause pressurization of a deep reservoir, and consequently ground uplift (Pritchard et al., 2018). The source of the large-scale deformation has been located in a range between 7 and 15 km deep (Pritchard and Simons, 2004; Froger et al., 2007; Ruch et al., 2008; Anderssohn et al., 2009; Pearse and Lundgren, 2013; Henderson et al., 2017; Pritchard et al., 2018). A secondary small-scale deformation affecting an area of 6 km2 was observed below Lastarria ss edifice between 2003 and 2005, with a deformation rate of ∼9 mm/yr, which has been related to a pressurized shallow source (hydrothermal aquifer) lying <1,000 m below Lastarria ss edifice (Froger et al., 2007).
Spica et al. (2015), using seismic tomography, further identified a shallow magmatic source located between 3 and 6 km depth (not previously identified), and a shallow hydrothermal source located at 0.4 km depth. Stechern et al. (2017) using petrological approaches (mostly related to Holocene explosive events), identified two magmatic sources, the shallower located at 5–8 km depth, as well as a deeper reservoir between 11 and 15 km depth. Díaz et al. (2015) using resistivity measurements identified three resistivity zones, which are coincident with the shallow hydrothermal system, and the two magmatic reservoirs previously described.
Gas samples from fumarolic emissions were collected using a 50 cm in length and 25 mm in inner diameter titanium tube and pyrex glass dewared pipes connected with metallic clips and Teflon plugs. A 60 mL pre-evacuated glass flask equipped with a Thorion® valve and partially filled (20 mL) with an alkaline suspension (4 M NaOH and 0.15 M Cd(OH)2) was assembled in the titanium-glass line (Montegrossi et al., 2001). Incondensable species (He, Ar, N2, O2, CH4, H2, CO, and light hydrocarbons) remained in the headspace, soluble (water vapor), acidic species (SO2, HCl, HF) and CO2 dissolved into solution, whereas H2S precipitated as CdS.
The chemical compositions of incondensable, dissolved, and precipitated species were determined at the Laboratory of Fluid Geochemistry of the Department of Earth Sciences, University of Florence, Italy. Incondensable species from the headspace were analyzed by gas chromatography (GC) using the Shimadzu 15, 14 A and Thermo Focus equipment. The liquid phase was analyzed by ionic chromatography (IC; Metrohm 761), where the concentration of Cl− (from HCl dissolution), F− (from HF dissolution), and SO42- (from SO2 dissolution) were determined. Acidic titration (AT; Metrohm Basic Titrino) was used to determine the concentration of CO23- (from CO2 dissolution). Solid CdS was dissolved using H2O2 to analyze H2S as SO42- by IC (Montegrossi et al., 2001). Analytical error for GC, AT, and IC analysis was <5%.
SO2 emission rates of Lastarria volcano were measured using a PiCam, a low-cost UV camera, developed at University of Sheffield, United Kingdom (Wilkes et al., 2016; 2017). This instrument consists of two cameras with a field of view (FOV) of 23.1°
The measurements were carried out on 12, 13 May and 1, 2 November 2018, on 17, 18 January and 21, 22 November 2019 at a distance of 2–5 km from the plume, with a range of geographic altitude from 4,600 to 5,000 m above sea level (m a.s.l. Figure 2; Table 1). On each day of measurement, calibration was performed every hour, with measurements possible for up to 6 h each time.
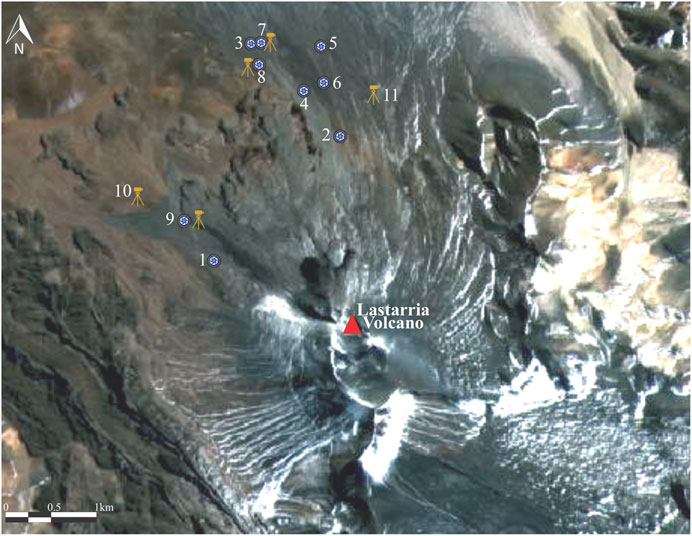
FIGURE 2. Location of measurements with UV Picam and DOAS at Lastarria volcano. The blue and black circle correspond to locations of UV Picam measurements, and the yellow tripods correspond to DOAS measurements. The numbers correspond to the correlative location points in the Table 1.
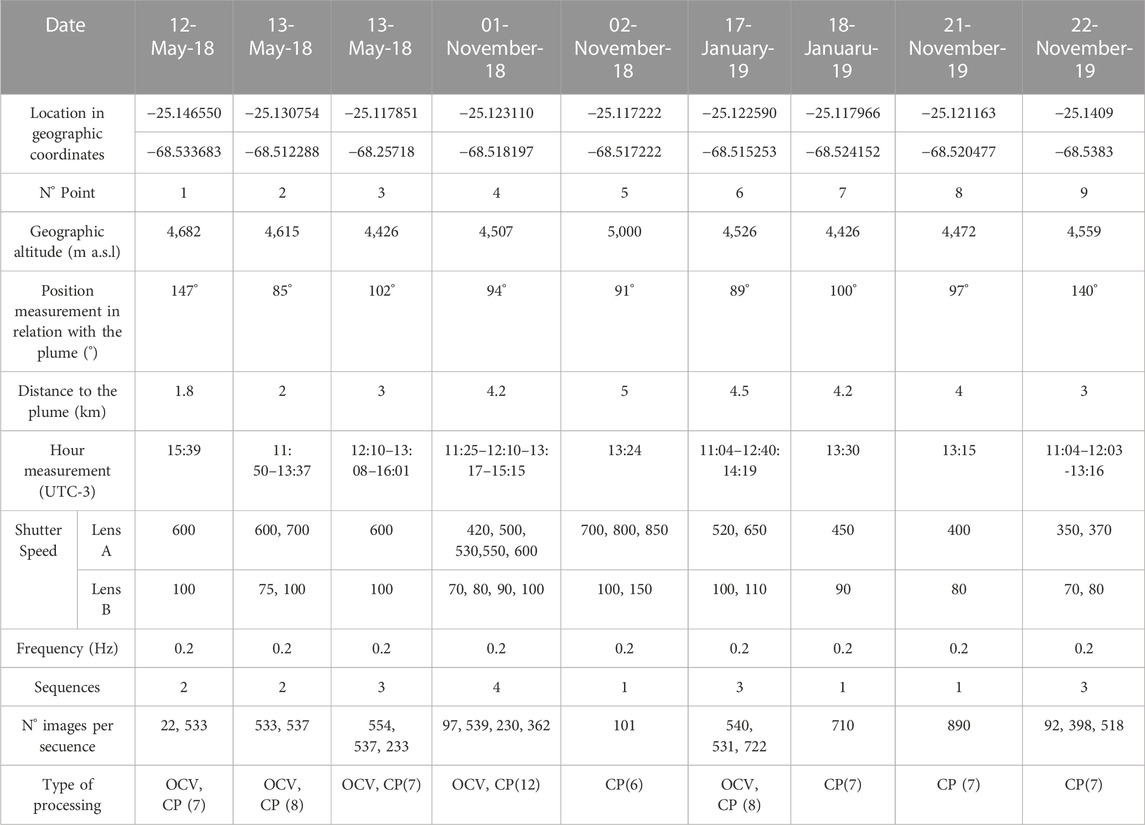
TABLE 1. Technical information about measurements with PiCam, coordinates in decimal degrees, m a.s.l.: meters about sea level, OCV: openCV method for post processing. CP: control points method for post processing (N° of control points used).
The sequences were processed using a python-based code in order to determine SO2 emission rates (Wilkes et al., 2017; Aguilera et al., 2020). Plume velocity was calculated using cross-correlation technique, because the error with this technique is minor, considering the high temporal and spatial resolution of UV camera (McGonigle et al., 2005; Kantzas et al., 2010).
All the measurements presented in this article have uncertainties inherent to field conditions and characteristics of the instrument, which could affect the quality of data. Following Ilanko et al. (2020); Aguilera et al. (2020), uncertainties were determined (Table 2) associated with plume velocity, gas cell concentration and calibration drift, column density across line integration, light dilution. Uncertainties due to plume direction were negligible given near perpendicularity to the plume (Klein et al., 2017), while the plume was near transparent meaning errors from in-plume scattering were also negligible. Despite some uncertainty related to grounding plumes affecting 19% of the data, in this work we have processed UV camera data using integration lines which include the border between ground and plume, and in several positions along the plume, in order to reduce to the minimum that uncertainty. An estimation of this uncertainty has not been carried out.
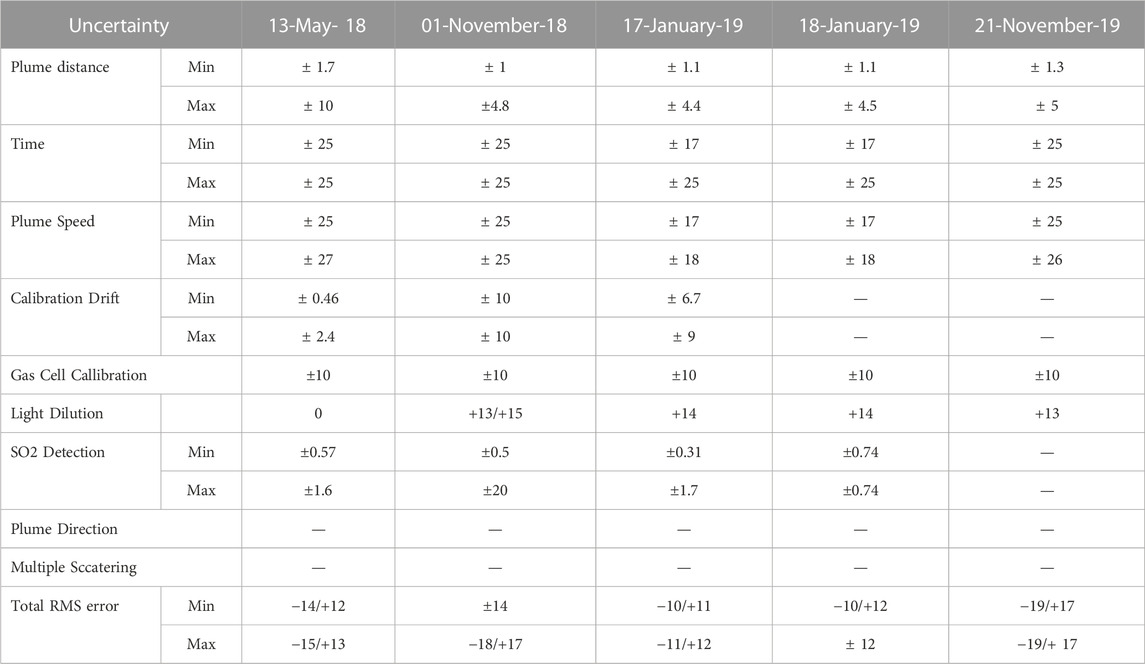
TABLE 2. Uncertainties in each measurement. Total RMS error (root mean square) is included (%). (-) represent a despicable error.
The plume speed uncertainty depends on the distance between the PiCam and the plume (and consequently the distance between the two integrated columns amounts (ICA)), and the difference in time of the plume movement between one ICA and another during cross-correlation. Considering the distance errors of 200 m, the uncertainty related to the plume speed of our measurements is of ±27%. In the case of calibration drift, we considered variations in the illumination because of the changes in the sun position along 1 day of measurements, selecting and comparing all calibrations carried out and used for the processing of images, in the same site and same day, as per Ilanko et al. (2019). Low uncertainties were calculated for calibration drift, with values ranging from < ±0.46% to ±10%. Uncertainties in column density across line integration were low, with a minimum of ±0.25% and a maximum of ±20%, which were calculated according to Wilkes et al. (2017). In the case of uncertainties related to the light dilution, which is generated by scattering of photons into the FOV of the camera between the plume and the PiCam, we have considered the specific atmospheric conditions in the northern Chile Altiplano, as relatively low atmospheric pressure, very low humidity and scarce aerosol concentrations. According to these conditions; Aguilera et al. (2020) based on Campion et al. (2015) suggest that measurements carried out at distance <3 km, light dilution is negligible, whereas for distances between 3 and 6 km, this will be at least up to +20%. In relation to the above, at Lastarria volcano, we have estimated a negligible light dilution error in the case of 13 May 2018 measurements (distance from the plume <3 km), 1 November 2018, 17, 18 January 2019, and 21 November 2019 an uncertainty variable between +13 and +15% (distance of 4–4.5 km from the plume) and +25% for 2 November 2018 measurements (5 km distance from the plume), the above as a proportion in relation to the indicated by Aguilera et al. (2020). Uncertainty related to gas cell calibration is provided by the manufacturer (Resonance Ltd.), and is ±10% for 100, 467 and 1,989 ppm m cells.
Finally, the total error percentage calculated by the root mean square error (RMS) varies in a range of −19% and +17% (Table 2).
In this work we have used two different Differential Optical Absorption Spectroscopy (DOAS) instruments, the first one developed by The University of Sheffield, UK (Linear Scanning Spectrometer- LSS), whilst the second one was a portable scanning Mini-DOAS station of the NOVAC-type, which was equipped with conical scanning optics (see Galle et al., 2010; Conde et al., 2014 for details on the instrument). Both instruments were used for scanning DOAS measurements.
LSS instrument allowed us to determine the SO2 column densities, from the light spectra scanned by the spectrometer, whose slit entrance is 50
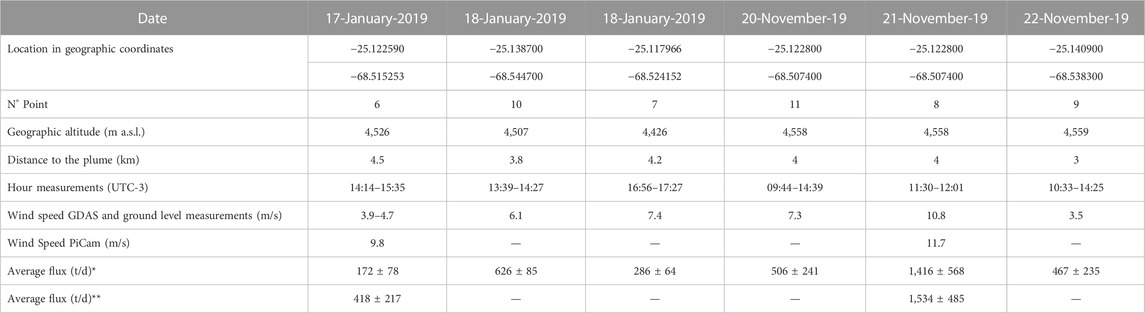
TABLE 3. Technical information of measurements with DOAS. m a.s.l.: meters above sea level. *Average flux calculated using wind speed from GDAS and ground level measurements. ** Average flux calculated using wind speed from PiCam.
The SO2 emission rate measurements from the NOVAC-type instrument were carried out on 17, 18 January 2019. On each acquisition day, the instrument was deployed for several hours at accessible locations roughly beneath the gas plume and about 4–8 km downwind of the emission sources on Lastarria (Figure 2; Table 3). For data acquisition, the DOAS instrument scans across the sky collecting spectra of incoming scattered UV light at 51 angular steps of 3.6° along a semi-conical surface in order to obtain SO2 column density profiles perpendicular to the transport direction of the volcanic gas plume. Prior to each scan, exposure times (50–1,000 ms) used for the recording of individual spectra were automatically adjusted by the instrument depending on previously measured UV light intensity. Resulting acquisition times ranged between 5 and 15 min for a complete scan from horizon to horizon.
Scans were evaluated using the DOAS method (Platt and Stutz, 2008) in order to retrieve SO2 column densities from the sunlight spectra measured across the gas plume. DOAS fits were performed in the 310–325 nm wavelength range of the measurement spectra, additionally including reference absorption spectra of SO2 (Vandaele et al., 1994) and O3 (Voigt et al., 2001), the latter being the main interfering gaseous UV absorber relevant for SO2 retrieval in this spectral range. Furthermore, a Ring reference spectrum (Chance and Spurr, 1997) was included in the DOAS fit to reduce the undesired effects of rotational Raman scattering, and spectral shifts of measured spectra were determined and corrected for by means of comparison with a solar reference spectrum (Chance and Kurucz, 2010). Reference spectra were calibrated to match the spectral resolution of the two spectrometers by means of convolution with the slit function of respective spectrometers.
SO2 emission rates were calculated using auxiliary information on plume transport height and direction constraining location of the gas plume within the measurement geometry of the scanning DOAS, and information on the speed of gas transport. Plume heights were estimated by visual inspection of plume photographs. Knowing the locations of both emission source and DOAS instrument, the plume transport directions were also determined by means of triangulation using the center of SO2 mass in measured plume cross-sections and estimated plume heights as reference. For evaluation of the data, plume speeds required to eventually calculate emission rate were approximated using modeled wind speeds obtained from archived data of the Global Forecast System (GFS) provided by National Oceanic and Atmospheric Administration (NOAA), and by cross-correlation of plume features in image sequences obtained from contemporary UV-camera measurements.
H2O, CO2, H2S, and HCl emission rates were calculated using Eq. 1 (López et al., 2013) combining determined daily average SO2 emission rate (
where
Here we present a large database of 63 samples, 29 corresponding to the period May 2006–April 2009 (Aguilera et al., 2012), 1 sample from June 2010 (this work), 4 samples of November 2014 (2 from Lopez et al. (2018) and 2 this work), and 29 samples between May 2011 and November 2019 (this work). Altitude (m a.s.l.), temperature (°C) and chemical composition (mol%) of fumarolic gas discharge at Lastarria volcano, are presented in the Table 4. Fumaroles for the period May 2006-November 2019 presented outlet gas temperatures between 80.1°C and 408°C. Gas composition can be described in two different periods:
1. May 2006-November 2012: Water vapor and CO2 were the predominant compounds whose concentrations were 81–91 and 7.2–17 mol%, respectively. SO2 concentrations were within the range of 0.01 and 0.68 mol%, while H2S concentrations varied from 0.01 to 0.3 mol%. Significant amounts of HCl (0.001–0.12 mol%), HF (0.0001–0.05 mol%), N2 (0.03–0.51 mol%) and H2 (0.0005–0.24 mol%) were also found in fumarolic gases. Minor amounts of carbon-bearing compounds such as CH4 (≤0.001 mol%) and CO (≤0.001 mol%) were found, whereas noble gases (He and Ar) have values ≤0.0002 mol%, and concentrations of O2 were below 0.01 mol%.
2. November 2014-November 2019: Water vapor and CO2 were still the predominant compounds with concentrations of 68–96 mol% and 2–19 mol%, respectively, although large differences were observed in January 2019, when water vapor concentrations dropped to their lowest concentrations, whereas CO2 reached the highest concentrations. SO2 and H2S increase in comparison with the previous period with concentrations of 0.69–4.1 mol%, and 0.32–1.5 mol%, respectively. HCl (0.09–0.52 mol%), HF (0.005–0.09 mol%), and N2 (0.04–0.96 mol%) also increased in concentration, although H2 showed more significant increases (0.02–7.1 mol%), especially during January 2019. Minor species, such as CH4 (≤0.0002 mol%), CO (≤0.001 mol%), He (≤0.0002 mol%), Ar (≤0.008 mol%), and O2 (≤0.002 mol%), maintained low concentrations.
The results of the UV camera measurements were determined for individual and/or combined fumarolic fields, and corresponding to SO2 emission rates ±1 standard deviation, the last representing the variability of the data during the measurement process, are presented in the Table 5, and summarized as follows:
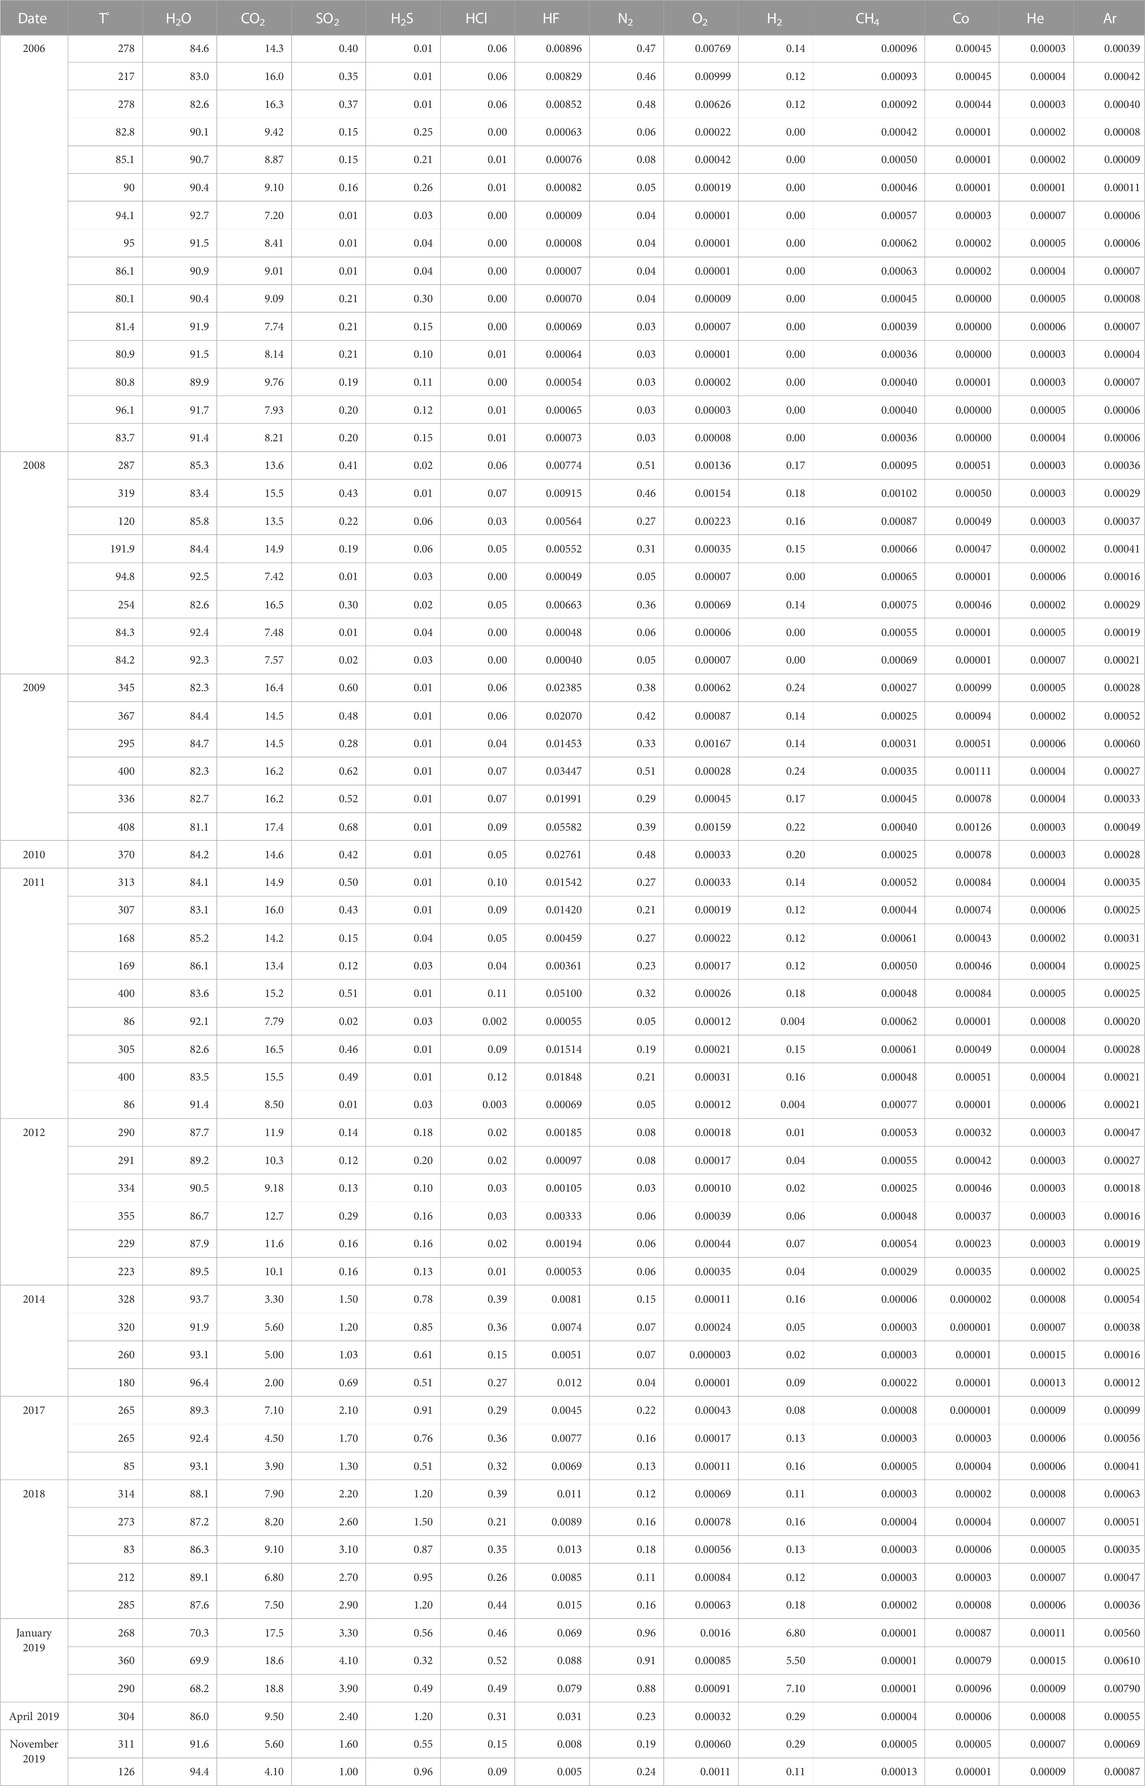
TABLE 4. Temperature (in °C) and chemical composition (in mol%) of fumarolic gases from Lastarria volcano.
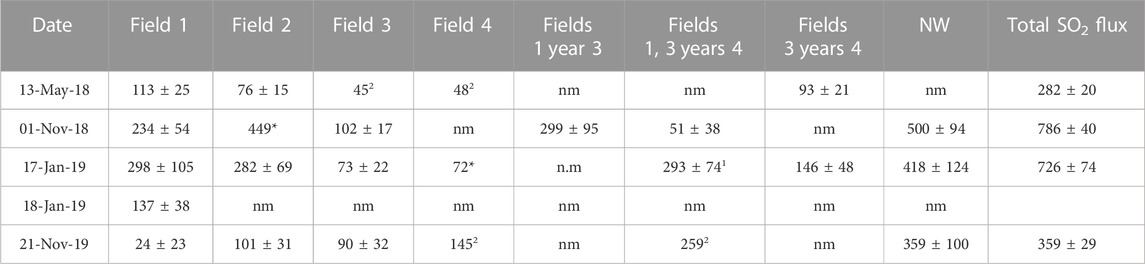
TABLE 5. SO2 fluxes obtained in the different measurements in t/d. The measured fields are indicated. nm: not measured; 1 Results presented only as a reference; 2 Fluxes estimated from the difference between the bulk plume and individual fumarolic fields measurements and/or difference between combined and individual fumarolic fields.
On 13 May 2018 we measured SO2 sequences with a total of 1,070 images obtained, where fumarolic fields 1 and 2 were measured individually, obtaining rates of 113 ± 25 and 76 ± 15 t/d, respectively, whereas the rates by combination of the emissions from the fumarolic fields 3 and 4 was 93 ± 21 t/d. The overall average emission rate considering the four fumarolic fields for 13 May 2018 was 282 ± 20 t/d.
SO2 measurements on 1 November 2018 averaged 786 ± 40 t/d, which is an increase in comparison with SO2 measurements carried out in May 2018, for all fumarole fields combined. Considerable increases were observed in field 1 (234 ± 54 t/d), and the plume produced by combination of fumaroles from fumarolic fields 1, 3, and 4 (500 ± 94 t/d).
On 17 January 2019 the overall emission rate measured was 726 ± 74 t/d, similar to those measured on 1 November 2018, and with an emission rate for fumarolic fields 1, 2, 3, and 4 of 298 ± 105, 282 ± 69, 73 ± 22, and 72 t/d, respectively. On 18 January 2019, the plume moved in an atypical direction (west), and only the fumarolic field 1 could be measured, obtaining a minimum emission rate of 137 ± 38 t/d.
The overall SO2 emission rate estimated for 21 November 2019 (1 sequence and 890 images) was 359 ± 29 t/d, with a low SO2 emission rate in the fumarolic field 1 (24 ± 23 t/d) in comparison to the measurements of November 2018 and January 2019.
If we consider the root mean square error (RMS) expressed in percentage (Table 2), the final emission rates for the same dates, and expressed as a range, where minimum and maximum values correspond to the overall average emission rate plus negative and positive maximum RMS error, the SO2 emission rates correspond to 240–319 t/d (13 May 2018), 645–935 t/d (1 November 2018), 646–813 t/d (17 January 2019), and 291–420 t/d (21 November 2019).
The results of the measurements carried out with mini-DOAS in bulk plume are presented in the Table 3. On 17 January 2019, using wind speed values of 3.9 and 4.7 m/s, both obtained from GDAS1 at 500 hPa (corresponding at ∼5,600 m a.s.l.), the total SO2 emission rate obtained was 172 ± 78 t/d. Recalculating the total SO2 emission rate using the plume speed average values obtained from simultaneous measurements with the PiCam (9.8 m/s), the total SO2 emission rate increased to 418 ± 217 t/d. On 18 January 2019, measurements were carried out at two different locations. At point 7, using a wind speed of 6.1 m/s (GDAS1 at 400 hPa), the total SO2 emission rate obtained was 282 ± 64 t/d. At the point 10, using a wind speed 7.4 m/s (GDAS1 at 400 hPa), the total SO2 emission rate obtained was 626 ± 85 t/d. The overall SO2 emission rate for both days was 376 ± 111 t/d.
On 20–22 November 2019, we used average ground level wind speed (by use of an anemometer) of 7.3, 10.8, and 3.5 m/s, respectively, because the mean wind speeds obtained by the GFS model (GDAS1 at 500 hPa) were on average 40% lower than those observed in the field. The SO2 emission rate (average ± 1SD) was 506 ± 241, 1,416 ± 568, and 467 ± 235 t/d, respectively. Whereas using the PiCam plume speed (11.7 m/s), the recalculated measurement increased to 1,534 ± 485 t/d on 21 November 2019 (the only day with a reliable plume speed obtained by PiCam). The overall SO2 emission rate for 3 days was 981 ± 382 t/d.
The results of emission rates of gases for the years 2014, 2018, and 2019 are presented in Table 6, where only high temperature fumaroles were considered. Here we present the results for each period considering the average of direct sampling data obtained from the different fumaroles, and using the variations of the SO2 emission rates based on the RMS error presented in the Section 4.2. For November 2014 we estimated the emission rates of main species using the average SO2 emission rate measured by Lopez et al. (2018) corresponding to 604 t/d, and we used the ±50% error reported for remote measurements, corresponding to a range between 302 and 906 t/d. Consequently, for November 2014, the emission rates of H2O, CO2, H2S, and HCl ranged 7,208–21,626, 747–2,241, 100–299, and 46–137 t/d. In the following years, the H2O, H2S, and HCl decrease, reaching the lowest ranges during January 2019, corresponding to 3,351–4,217, 42–52, and 48–60 t/d, whereas CO2 increases to its highest range in the same period (2,158–2,716 t/d). During November 2019, the emission rates of H2O and H2S increase to values similar to the November 2018 (5,823–8,405 and 90–130 t/d, respectively), whereas CO2 and HCl reached the lowest flux along the whole revised period (746–1,077 and 15–22 t/d, respectively).
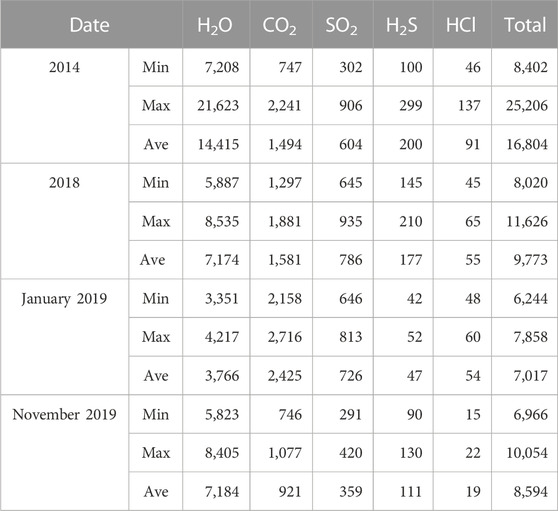
TABLE 6. Total volatile fluxes and fluxes for each gas specie in t/d. Minimum (min), maximum (max) and average (ave) fluxes are shown.
The chemical composition of the fumarolic discharges from Lastarria volcano, which were investigated by Aguilera et al. (2012), covering a period between May 2006 and June 2009 (Table 4), showed that fluids have two origins: 1) a deep magmatic and 2) a shallow hydrothermal source. Along the whole range of fumarolic discharge temperatures (80°C–408°C) acid species such as SO2, HCl, and HF were present, indicating a significant fluid contribution from magma degassing. Additionally, water isotopic composition (δD and δ18O) showed a pristine magmatic origin, poorly affected by meteoric contributions (Aguilera et al., 2012). However, concentrations of species like SO2 and HF are lower than expected for magmatically dominated arc volcanoes (Fischer et al., 1998; Lewicki et al., 2000), especially if only fumaroles with temperatures above the saturated steam vapor at the local atmospheric pressure (120°C–408°C; Table 4) are considered. The latter suggests that secondary processes modified the original composition of magmatic volatiles, which include gas-rock interaction and salt deposition. The hydrothermal reservoir corresponds to a shallow boiling aquifer producing gases such as H2S and CH4. Magmatic volatiles are cooled and scrubbed at shallower depth, decreasing the concentration of highly soluble gases and the temperatures down to levels where condensation can occur. According to the model presented by Aguilera et al. (2012), the mixed distribution of low (<96°C) and high (>120°C) temperatures is explained by the occurrence of a discontinuous shallow aquifer, where water vaporization is catalyzed by the rising of hot magmatic volatiles. Consequently, for the period May 2006-June 2009, Lastarria can be considered as a volcano dominated by hydrothermal discharges (Figure 3), with some contributions of magmatic volatiles. According to our new data presented here (Table 4), the gas composition between May 2011 and 11 November 2012 remained stable without major changes and was dominated by hydrothermal fluids, similar to observations of the previous years (Figure 3). A major change in gas composition was detected only 2 weeks later by Tamburello et al. (2014) who used a combination of MultiGAS, filter packs, and ground-based remote measurements of SO2 emission rates on 27–29 November 2012. Their data in comparison to previous measurements showed a clear increase of SO2 and HCl contents, and a decrease of CO2, which is considered compatible with an increasing magmatic signature. Tamburello et al. (2014) explained these changes by (1) dissimilar sampling conditions, where MultiGAS were carried out in the “bulk” plume, whereas previous direct sampling was concentrated in few fumaroles which could be more affected by secondary processes, therefore not representative of the bulk emissions; or (2) a consequence of a real evolution of the volcanic system from hydrothermal-to-more magmatic degassing. Lopez et al. (2018) confirmed the changes in the gas composition by combination of direct gas sampling, MultiGAS, filter pack, ground-based remote, and CO2 diffuse measurements, describing an evolution of fluids to a stronger magmatic signature, as the increasing SO2 and HCl concentrations suggest (Figure 3; Table 4). Unpublished data from February 2017 to November 2018 (Table 4) showed similar concentrations to the November 2014 data, confirming the increasing of SO2 and HCl, although an increase of N2 by one order of magnitude was also observed. In January 2019, new changes were observed in the gas compositions (Table 4), H2O decreased to 68.2–70.3 mol%, whereas CO2, HF and H2 increased one order of magnitude in comparison with 2014–2018 data, corresponding to the highest concentrations throughout the studied period. Between April and November 2019 gas concentrations returned to the values observed during February 2017 and November 2018 (Table 4).
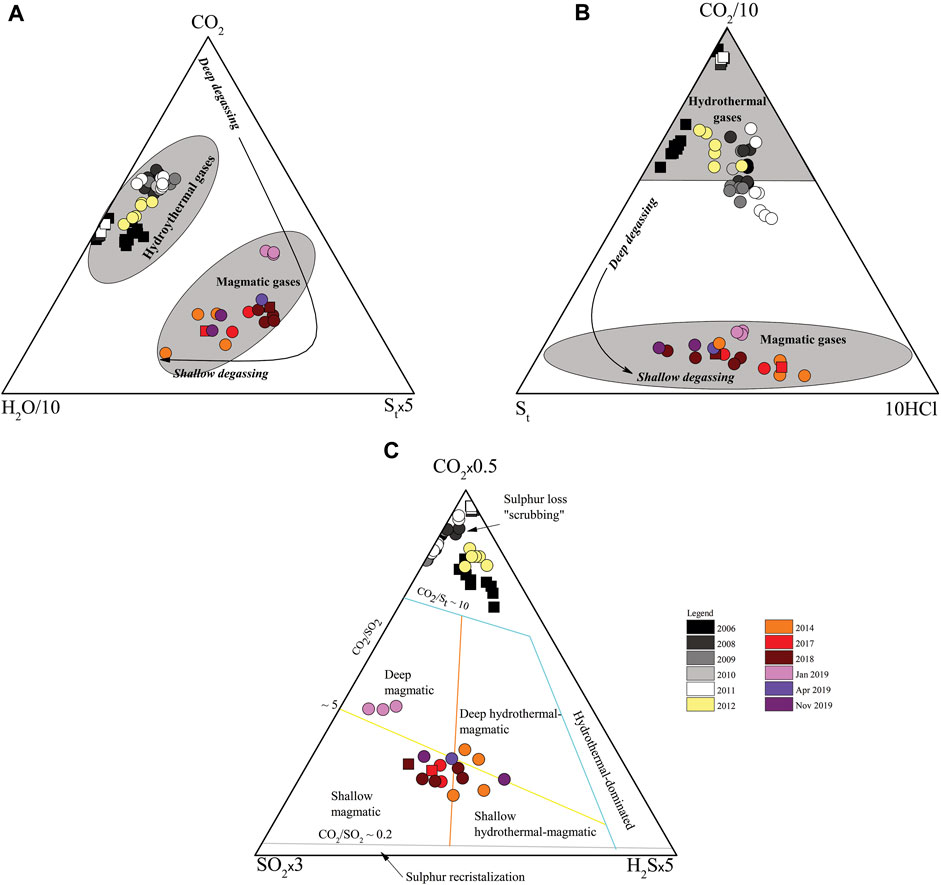
FIGURE 3. Ternary diagrams for Lastarria volcano gas compositions. (A) H2O/10-CO2-Stx5; (B) St-CO2/10-HClx10; (C) SO2x3-CO2x0.5-H2Sx5. <96°C fumaroles are shown as filled squares; >120°C fumaroles are shown as filled circles. Hydrothermal and magmatic gases fields are highlighted in grey. Transition of deep-to-shallow degassing is shown as long black arrows. Classification of gases and limits of compositional fields for (C) diagram were adopted from Lages et al. (2019). St correspond to to SO2+H2S.
According to the evolution of gas composition previously described a noticeable evolution from hydrothermal-dominated to magmatic-dominated volatiles is observed in Lastarria volcano since May 2006 up to November 2019 (Figure 3). Despite the presence of magmatic gases like SO2 and HF, hydrothermal compounds predominated between May 2006 and early November 2012, which have been attributed to secondary water-rock interaction processes such as interaction of magmatic gases with rocks and/or salt deposition/precipitation with decreasing temperatures, promoting the scrubbing of highly soluble species such as SO2, HCl, and HF (Aguilera et al., 2012; Lopez et al., 2018). The magmatic-dominated compositions observed since late November 2012, are compatible with a shallow degassing process, due to the decreasing of CO2, and the increasing of SO2 and HCl concentrations (Figure 3). The increase of the more soluble species was likely caused by a more restricted scrubbing in the shallow hydrothermal system. The decreasing of the scrubbing process could be attributed to the increased input of magmatic volatiles, followed by the acidification and partial consumption of the hydrothermal system. Increase of SO2 emission rate has been observed in the period between November 2018 and January 2019, which will be discussed in the following sections. Acidification of the hydrothermal system explains the decrease of H2O/SO2 and H2O/HCl, which started in late November 2012 (Figure 4). In January 2019 the lowest concentrations of water vapor were observed (68.2–70.3 mol%; Table 4), which could be related to consumption of the hydrothermal system caused by the enhanced hot magmatic fluid inputs that led to an increase of the reservoir ebullition. The input of magmatic volatiles caused an increase in the temperature of the hydrothermal reservoir increasing the concentration of the temperature dependent gases, such as H2 and CO (Table 4). This process was concordant with the first ever witnessed active sulfur flows at this volcano. In April and November 2019, the returning of gas composition to values close February 2017-November 2018 seems to represent a subtle recovery of the previously depleted hydrothermal system.
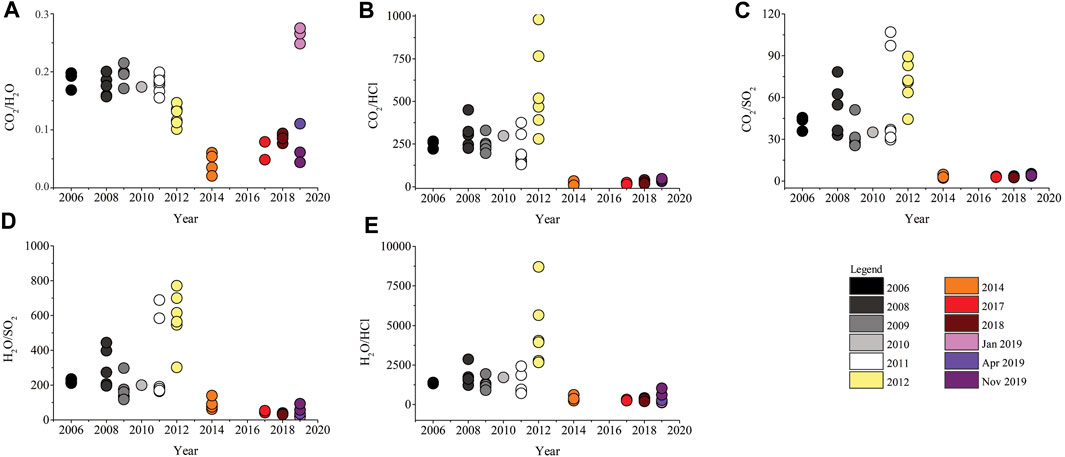
FIGURE 4. Gas ratios of Lastarria volcano fumarolic discharges (A) CO2/H2O; (B) CO2/HCl; (C) CO2/SO2; (D) H2O/SO2; (E) H2O/HCl. Only fumaroles with temperatures >120°C were considered.
Similar to fumarolic gas composition, changes have been observed in the SO2 emission rates in the period between November 2012 and November 2019 (Figure 5). The first SO2 emission rates reported for Lastarria volcano were acquired using mini-DOAS from the summit of Lastarria (Tamburello et al., 2014). The daily rates (expressed as average ±1 standard deviation) were 1,917 ± 607, 473 ± 188, and 433 ± 314 t/d for 27, 28, and 29 November 2012, with an overall value for the 3 days of 884 ± 779 t/d and a much lower median of merely 538 t/d, the latter reflecting the outlier nature of the much higher emission rates obtained for 27 November 2012. SO2 emission rates of 27 November 2012 generally were a factor ∼5 larger than those of 28 and 29 November 2017, and temporarily peaked at 36.14 kg/sec (which would correspond to 3,123 t/d). These observations were carried out in stormy and gusty conditions (wind speeds of up to 17 m/sec) during the passage of a low-pressure frontal system causing air pressure to drop by 10 hPa in 12 h (9:00–21:00) which may have enforced gas release on that day, and thus these emission rates may be considered as exceptionally high and likely not representative in the long-term. As to not overrate the measurements of November 27, we consider the median SO2 emission rate of 538 t/d of the November 2012 campaign as representative of this period. Lopez et al. (2018) present data on 22 November 2014 based on UV camera and DOAS measurements, with an overall SO2 emission rate of 604 ± 296 t/d. Although the SO2 emission rate in November 2014 probably was slightly higher than November 2012, the high standard deviation and high error reported (±50%; Lopez et al., 2018) make it unclear whether this is related to increasing of degassing caused by rising of deep magmatic volatiles. Our UV camera data (Table 5) show clearly an increasing of SO2 emission rate on 1 November 2018 and 17 January 2019 (786 ± 40 and 726 ± 74 t/d) (Figure 6) in comparison with May 2018 (282 ± 20 t/d), decreasing subsequently on 21 November 2019 (359 ± 29 t/d) (Figures 5, 6). These data show high stability (low standard deviation) and lower errors (−19 and +17%; Table 2) compared with Tamburello et al. (2014); Lopez et al. (2018) data, which can be considered as highly reliable. This behavior is compatible with the changes observed in the fumarolic gas composition, where the most magmatic signature of gas is coincident with the highest SO2 emission rates in November 2018 and January 2019. Consequently, the increase of SO2 emission rates could be explained by rising of magmatic volatiles, which caused a decrease of scrubbing, as argued in the previous section. The decrease of SO2 emission rate in November 2019 is also coincident with the returning of the fumarolic gas composition to values of 2017. This decrease led to an increase of magmatic gas scrubbing and, consequently, a partial recovery of the hydrothermal system, as was previously discussed. We have not considered in this analysis the DOAS data from January and November 2019, because the scanning was done in a geometry not able to cover the total of the plume during January 2019, which produced an underestimation of the SO2 emission rate. In the case of measurements carried out in November 2019, the overestimation of the emission rates is also related to the scanning geometry, where semi-horizontal scanning covered an “excess” of plume.
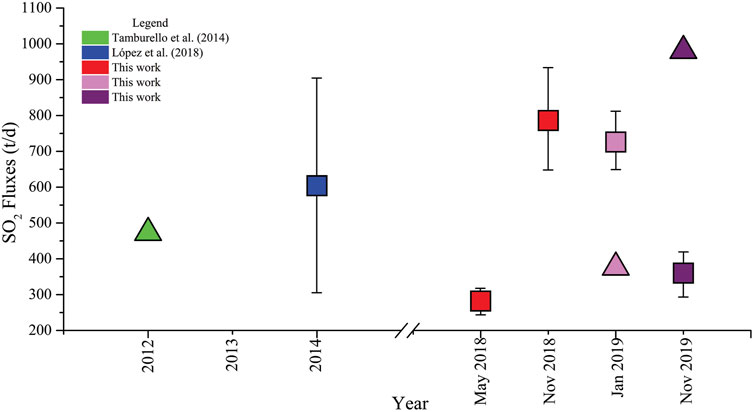
FIGURE 5. SO2 emission rates (t/d) of Lastarria volcano during the period 2012–2019. Filled squares correspond to UV camera measurements (except Lopez et al., 2018, which was calculated on the base of UV camera and DOAS data), filled triangles correspond to DOAS measurements. Moreover, SO2 emission rates obtained by Tamburello et al. (2014), in this work we merely consider the DOAS data of 28 November 2012. SO2 emission rates from UV camera correspond to the Total SO2 flux column from the Table 5, whereas SO2 emission rates from our DOAS instruments correspond to the overall emission rate among measured days. Root mean square (RMS) obtained from UV camera measurements are shown as error bars.
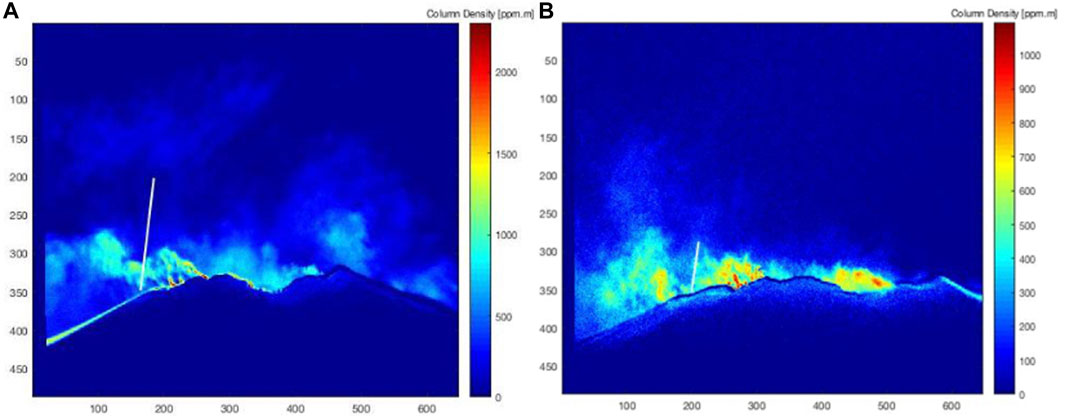
FIGURE 6. Images obtained with the PiCam UV Camera of Lastarria volcano gas plume, indicating the total SO2 emission rates obtained from the four fumarolic fields. (A) 17 January 2019; (B) 21 November 2019. The white lines correspond to cross-plume profiles along which Integrated Column Amount (ICA) have been determined. The color bar displays column density in ppm•m.
We have calculated the volatile budgets combining the emission rates of main species (H2O, CO2, SO2, H2S, and HCl; Table 6) for four different periods (November 2014, November 2018, January and November 2019), considering the species measured by direct sampling (Table 4). We have not combined our direct sampling data with SO2 emission rates from Tamburello et al. (2014) due to large differences between our gas composition (hydrothermal-dominated) and that reported during late November 2012, which show magmatic-dominated composition. Consequently, here we assume that the enhanced SO2 emission rates which were measured during late November 2012 were related to the magmatic signature. The volatile budget of November 2014 averaged at 16,804 t/d (with a minimum of 8,402 t/d and maximum 25,206 t/d), which is close to that calculated by Lopez et al. (2018) for the same date (average 12,401 t/d), and the budget calculated for November 2012 (13,480 t/d; Tamburello et al., 2014). Lopez et al. (2018) present large differences between minimum and maximum emission rates in their work—3,579 and 38,311 t/d, respectively—whereas in our case the differences are more restricted, with a minimum flux of 8,402 t/d and a maximum of 25,206 t/d. Lopez et al. (2018) calculated the volatile fluxes including the variations in the SO2 emission rates and the changes in the gas compositions, whereas in our case, we used the average of the gas composition and the SO2 emission rate average and their related RMS error. We consider our data more reliable due the very low variability of the SO2 emission rates, and because our gas composition was standardized by the same sampling and analyzing methods, in the last case even using the same laboratory. On the contrary, Lopez et al. (2018) combined data from different direct sampling methods applying analyzing methods from different laboratories. The volatile budget decreased in November 2018 and January 2019 to 9,773 and 7,017 t/d, respectively, and in November 2019 it further increased subtly to 8,594 t/d. Here we have considered only our UV camera data, due to the under and overestimation observed for our DOAS data in January and November 2019, and discussed in the Section 5.2. The same pattern was followed by H2O and H2S, which is compatible with a progressive depletion of the hydrothermal system. On the contrary, CO2 emission rates increase up to January 2019 when their highest values were reached, descending again in November 2019. The progressive increase of CO2 emission rates could be related to the incorporation of deep magmatic volatiles, similar to the trend in direct sampling data.
In the regional context of the CVZA, Ubinas and Sabancaya volcanoes presented average total volatile fluxes of 23,898 and 5,469 t/d respectively, whereas average CO2 and SO2 emission rates ranged 1,222–1,366 and 988–1,325 t/d, respectively (both in November 2015; Moussallam et al., 2017). In the case of Ubinas volcano, the measurements were carried out during an eruptive period, and in the case of Sabancaya measurements were a few months before the beginning of a new eruptive cycle. According to Tamburello et al. (2014), Lascar volcano had a total flux of 6,517 t/d, while CO2 and SO2 emission rates were 534 and 554 t/d, measurements carried out during a passive degassing period without eruptive activity involved. Lastarria volcano average total fluxes varied in a range of 7,017–16,804 t/d, CO2 emission rates from 921 to 2,425 t/d, and SO2 emission rates between 359 and 786 t/d, making Lastarria volcano one of the most strongly degassing volcanoes of the CVZA, especially in the case of CO2.
Several studies have shown changes in the deformation rates of the large-scale deformation area (Lazufre), with an initial rate of 1 cm/yr in the period 1998–2003 (Pritchard and Simons, 2002), changing to 2.5–3 cm/yr for 2003–2010 (Froger et al., 2007; Ruch et al., 2008; Anderssohn et al., 2009; Ruch et al., 2009; Pearse and Lundgren, 2013), decreasing and stabilizing at ∼1.5 cm/yr between 2011 and 2016 (Henderson et al., 2017) (Figure 7). In the case of the small-scale deformation area (Lastarria volcano), a deformation rate of ∼9 mm/yr was detected between 2003 and 2008 (Froger et al., 2007; Ruch et al., 2009) (Figure 7). No studies have been carried out to detect deformation in this area in the period 2008–2014, whilst no deformation has been observed in this area after 2014 (Thomas Walter, pers. comm.). If a temporal comparison between ground-deformation and degassing data is performed (Figure 7), it is clear that a correlation exists between both processes. In order to better understand the possible linkage between both processes, we invoke the mechanisms proposed by Lopez et al. (2018) to explain the changes in the gas composition of Lastarria volcano:
Mechanism 1: Decompression-induced magma ascent and degassing in the shallow crust.
Mechanism 2: Crystallization-induced degassing of a stalled magma body.
Mechanism 3: Acidification of the hydrothermal system.
Mechanism 4: Depletion of the hydrothermal system due to heating, changes in the local stress, and/or minimal precipitation.
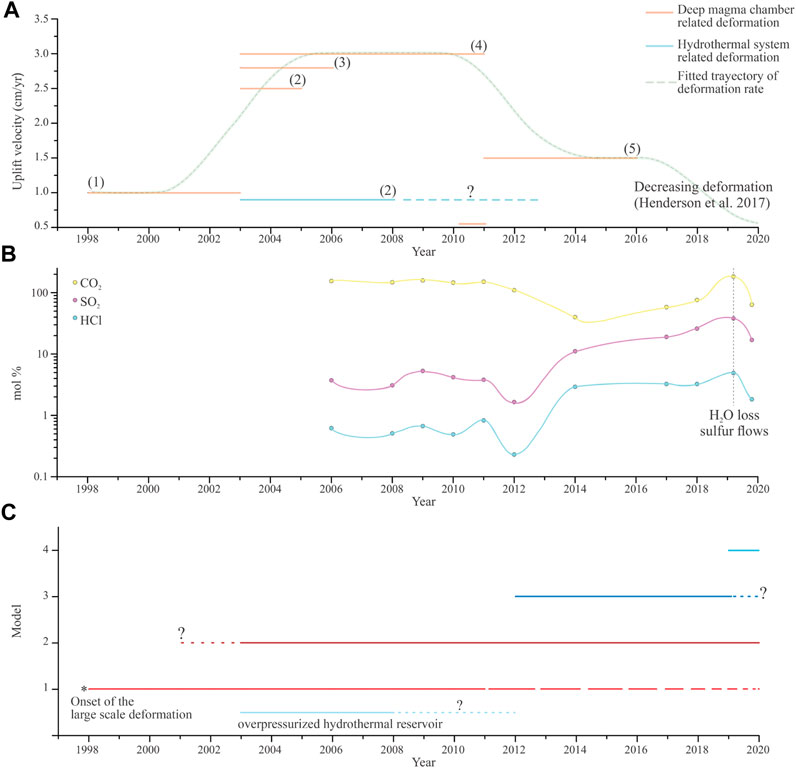
FIGURE 7. Time series of (A) ground deformation data, (B) direct sampling degassing data, and (C) the sequence of mechanisms that explain degassing/deformation processes. In the diagrams (A) the orange lines correspond to the deformation related to the deep magma chamber, the blue one related to the shallow hydrothermal system deformation, and the green short-dashed line corresponds to a fitted possible trajectory of the deformation rate 1) Pritchard and Simons (2002), 2) Froger et al. (2007), 3) Ruch et al. (2008), 4) Pritchard et al. (2018), and 5) Henderson et al. (2017). In (B), the black short-dashed line marks the occurrence of sulfur flows.
The mechanism 1 could explain the initial deep large-scale deformation in the period 1998–2003, and then the increasing deformation between 2003 and 2010. Additionally, this process could explain the high concentrations of CO2, and relative high CO2/SO2 ratio (Figure 4) in the fumarolic gas composition between 2006 and early November 2012. Lopez et al. (2018) modelled the degassing depths by use of melt compositions and volatile solubilities, suggesting that Lastarria degassing process is a combination of an open-system and close-system end members (with a 1 wt% exsolved volatiles), with an initial deep degassing at depth between 10.5 and 6.6 km in the period 2006–2009, followed by degassing in a broad range of depths between 9 and 1.2 km depth (2014). According to this, mechanism 1 is possible only if shallow small-scale deformation (2003–2008) is magma-related, and inflation also continued after 2008. However, the evidence of shallow deformation suggests that it is sourced <1 km depth and due to the overpressure of the hydrothermal system, and not to magma rising (e.g., Froger et al., 2007). In fact, Díaz et al. (2015); Spica et al. (2015) showed the presence of a hydrothermal system at similar depths (∼1 km), while a shallow magma body is located at 3–6 km depth. Similarly, the mechanisms that explain the deep large-scale deformation show no evidence of magma rising (Pritchard and Simons, 2004; Froger et al., 2007; Ruch et al., 2008; Anderssohn et al., 2009; Pearse and Lundgren, 2013; Pritchard et al., 2018). Mechanism 2 could explain the gas composition prior to late November 2012, and the deformation between 1998 and 2010, if the stalled magma corresponds to the deep reservoir (7–18 km depth; Stechern et al., 2017; Pritchard et al., 2018). In fact, thermally induced volatile exsolution produced by magma crystallization has been suggested as a possible explanation of the deep large-scale deformation (e.g., Froger et al., 2007). On the other hand, this mechanism explains the gas composition after late November 2012 only if the stalled magma is located in the shallow magma reservoir (3–6 km depth), which is compatible with a shallow degassing and high concentrations of SO2 and HCl. Similar to mechanism 1, this mechanism cannot explain the depth and source of the shallow deformation in the period 2003–2008. Mechanism 3 provides explanation of the gas composition since late 2014, due to the increasing of acid species as SO2, HCl, and HF. Lopez et al. (2018) suggest that no shallow deformation should be involved, consequently, the absence of shallow deformation, at least since 2008, is concordant with this mechanism. Mechanism 4 explains exclusively a single event, corresponding to the “excessive” loss of water vapor observed during January 2019, which was accompanied by the emission of sulfur flows. The heating of the hydrothermal system and the changes in local stress are plausible processes, in the first case by ascent of volatiles related to a deep magma chamber and/or increase of gas flux, while in the last, Ruch et al. (2009) have proposed changes in the local stress as a process that can explain the shallow small-scale deformation at Lastarria in the period 2003–2008. The minimal precipitation can be ruled out since Lastarria is located in a hyper arid environment, and lack of precipitation is permanent, not an exception. Lopez et al. (2018) suggest that mechanisms 1 and 2 fit better to explain the observed changes in the gas composition and deformation data. However, considering that Lopez et al. (2018) included only the early years of changes (2 years) in the degassing process, several uncertainties were still present. Here we show that the four mechanisms worked as a continuous and linked process, where the mechanisms 1 and 2 explain the linkage between deformation and degassing processes, encompassing changes through the years, and how both triggered the mechanisms 3 and 4 (Figures 7, 8).
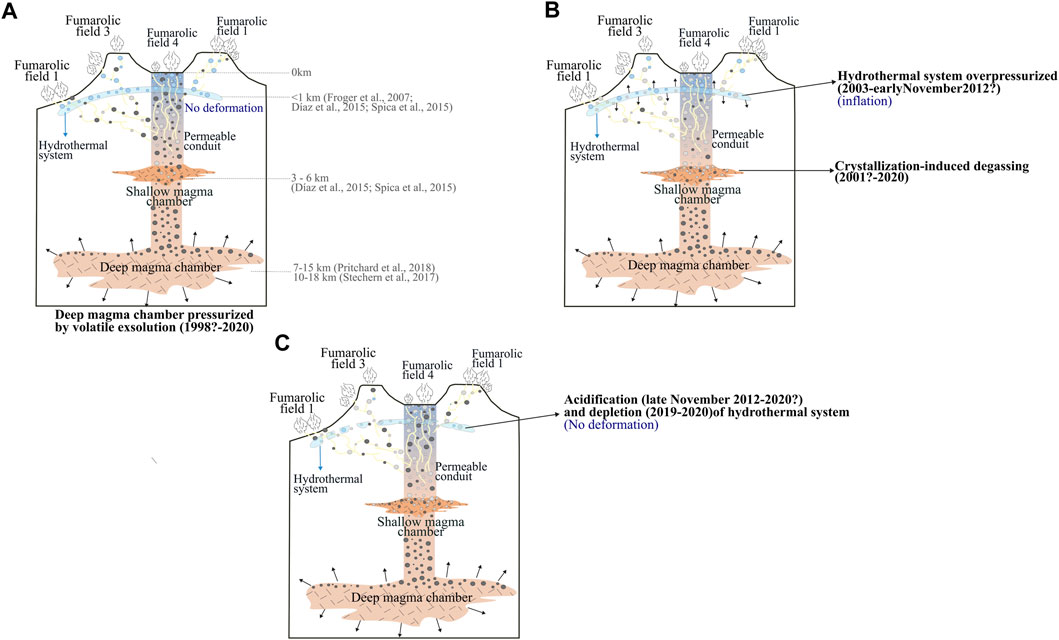
FIGURE 8. Conceptual sketches the sequence of mechanisms that explain the deformation and gas composition in the studied period. (A) Accumulation of deep-derived fluids (1998–2011), (B) Crystallization induced degassing in the shallow magma chamber (2003–2019) and over-pressurization of the shallow hydrothermal system (2003–2009). (C) Acidification and drying of hydrothermal system (2003–2019). Dark grey bubbles represent volatiles exsolved from a deep magmatic source, light grey bubbles correspond to volatiles exsolved from a shallow magmatic source, and blue bubbles are volatiles from a boiling aquifer. Black arrows represent inflation of both magmatic and hydrothermal systems.
According to Pritchard et al. (2018), the deep large-scale deformation observed since 1998 and currently ongoing in the Lazufre area, occurs due to exsolved volatiles from a partial melting and temporally trapped at relative deep levels (>10 km) that cause pressurization of a deep magma chamber. Following Pritchard et al. (2018), and assuming that volatiles are originated exclusively from the deep magma chamber, we can expect that the gas composition of fumarolic discharges is dominated by water vapor and CO2. We observed gas compositions corresponding to hydrothermally-dominated fluids between 2006 and early November 2012. Although there is no information about fluid composition before 2006, if we assume that the hydrothermally-dominated composition was constant since 1998, when the deformation started, the hypothesis of a deep magma chamber pressurized by exsolution of volatiles from a melt and temporally trapped at relative deep levels allows us to explain the initial deep large-deformation and the gas composition between 2006 and early November 2012. The increase of deformation rate up to 3 cm/yr in the period between 2003 and 2010 could be related to the maximum volatile exsolution, and consequently, the maximum pressure and deformation rate. As mentioned previously, Lopez et al. (2018) indicate that in the period 2006–2009 the degassing was sourced from a depth of 6.6–10.5 km, which is coincident with the location of the deep and large magma chamber (Figure 8A).
In the period 2003–2008, the small and shallow (<1 km) deformation zone below Lastarria volcano was active, and was originally attributed to the pressurization of the hydrothermal system (Figure 8B; Froger et al., 2007). The gas composition in the same period was characterized by a hydrothermal signature, where water vapor and CO2 were the most abundant species, which correlate with the interpretation of Froger et al. (2007). Although no information exists about further deformation at Lastarria volcano between 2008 and 2012, if we assume the shallow inflation process was continuous, and then finished during 2012, the changes in the gas composition observed since late November 2012 and discussed in the previous section, would be intimately linked with this shallow inflation, and consequently, related with major changes in the hydrothermal system. Ruch et al. (2009) propose that a stress changes in the wall of the reservoir (in this case a hydrothermal reservoir) may have caused linkage of pre-existing fractures, increasing rock permeability, and thus promoting the release of fluids to the atmosphere. Changes in the stress regime can be induced by the internal pressure exerted by the accumulation of volatiles (Heap et al., 2010). The original pressurized hydrothermal reservoir due to accumulation of volatiles then started to release higher volatile fluxes, decompressing the hydrothermal system, and consequently, stopping the shallow deformation. However, the changes in the gas composition since late November 2012 cannot be explained simply by the last reviewed processes. As was discussed in the previous sections, the gas composition between late November 2012 and November 2018 was characterized by a magmatic signature, with high concentrations of SO2 and HCl, depleted in CO2, and low H2O/SO2, CO2/SO2, and CO2/HCl ratios (Figures 4, 7), suggesting an increase of magmatic degassing. These changes can be related to the degassing of a shallow magma chamber, which in the case of Lastarria volcano is located between 3 and 6 km (Díaz et al., 2015; Spica et al., 2015). Lopez et al. (2018) suggest that the crystallization-induced degassing of a stalled magma body can produce the fluid signature observed after November 2012. In this case, the rising of an “excess” of volatiles from a deep source could “reactivate” the shallow magma chamber (probably a cooler and more evolved magma), for example, inducing crystallization, forcing convection and, consequently, degassing. Evidence of an evolved and degassed shallow magma chamber below Lastarria volcano has been provided by Robidoux et al. (2020), according to the low R/Ra ratios measured in melt inclusions found in pyroclastic samples that are dated to late Holocene. Lopez et al. (2018) propose that magma rising is also responsible for the changes in gas composition after November 2012; although the rising of magma is a plausible explanation of these changes, we suggest that more evidence is necessary to confirm such. It is expected that crystallization induced degassing rather would produce deflation of the shallow magma chamber, whereas magma rising, which could finish in the replenishment of the shallow magma chamber, would produce inflation. However, no deformation related to the shallow magma chamber has been observed throughout the study period. According to Girona et al. (2014), passive degassing may reduce the pressure of shallow magma chambers in only a few months to years. Considering that no eruptions have been involved during this period, and the degassing has been only passive, no deformation can be expected for both processes. Considering that the deformation started at least during 1998, the ascent of “excess” volatiles from a deep source should be a continuous process which started previously. Further, we hypothesize that the crystallization-induced degassing of a stalled magma (Figure 8B) should have started upon gradual cooling of the previously heated magma body a few months or years after large-scale deformation began. Consequently, the over-pressure of the hydrothermal system, which produced the shallow deformation, could be induced by the increasing of volatile flux from the shallow magma chamber. Following Ruch et al. (2009), changes in the stress field of the hydrothermal reservoir caused the release of fluids to the atmosphere, which as we can show were dominated by fluids enriched in magmatic compounds degassed from a shallow magma chamber.
As consequence, the “excessive” release of acid gases since late November 2012, produced changes in the hydrothermal reservoir, including its acidification. The acidification of the hydrothermal system (Figure 8C) has been a continuous process until November 2019. Another consequence of the increase of magmatic volatile fluxes (as observed in November 2018 and January 2019; Sections 5.2, 5.3), is the depletion of the hydrothermal system (Figure 8C), caused by an intense vaporization of the boiling aquifer, which could lead to the total consumption of parts of the aquifer. Although a depletion of the hydrothermal system could produce a shallow deflation, in this case the extension seems to be limited to only small areas of the fumarolic fields.
Lastarria volcano has undergone changes in its fumarolic gas composition in the last 8 years, following a period of both, large scale deformation in the Lazufre area at least since 1998 and localized small-scale deformation in the hydrothermal fields of Lastarria volcano since 2003, respectively. The present study has shown that a sequence of linked processes explains the changes in both degassing and deformation data, starting in 1998 with the accumulation of volatiles causing pressurization of a deep magma chamber, which in turn produced a large zone of uplift. The rising of volatiles from a deep magma chamber later probably induced the “reactivation” of a shallow magmatic chamber. Subsequent cooling of previously formed partial melts eventually led to the crystallization-induced degassing of this shallow stalled magma. The volatiles released from the shallow and deep magma body in 2003 started to accumulate below the partially sealed hydrothermal system, which explains its pressurization and, consequently, the shallow-sourced ground inflation until 2008. During this period and until mid-November 2012 the superficial degassing was dominated by hydrothermal fluids, with H2O and CO2 as the most abundant species. Volatiles related to the degassing of the shallow magma chamber started to be emitted to the atmosphere since late November 2012, most likely as a response to changes in the local stress field of the hydrothermal reservoir, which re-established pre-existing degassing paths. This enhancement in degassing activity allowed for decompression of the hydrothermal system, which explains why shallow inflation at Lastarria volcano was not detected in the following years. The fluids emitted since late November 2012 presented a typical magmatic signature related to a shallow degassing process (high concentrations of SO2 and HCl, partially depleted in CO2, and low H2O/SO2, CO2/SO2, and CO2/HCl ratios). These changes may indicate the acidification and depletion of the hydrothermal system, which is why acid gas species were less scrubbed in the hydrothermal environment due to an increase of magmatic fluid fluxes, and enhanced vaporization of water from the boiling aquifer. In this work we have shown that a long-term surveillance of the chemistry of fluid discharges provides valuable insights into underlying magmatic/volcanic processes, and consequently, for forecasting the occurrence of future eruptions.
The original contributions presented in the study are included in the article/supplementary material, further inquiries can be directed to the corresponding author.
SL measured and process UV camera data, carried out direct sampling campaigns, conceptualized, and wrote the manuscript; FA carried out direct sampling campaigns, conceptualized, and wrote the manuscript; MI and FT carried out direct sampling campaigns and wrote the manuscript; TW built the UV camera and one of the DOAS, wrote the manuscript, and reviewed the English; SB carried out DOAS measurements and processed the data, and wrote the manuscript; CG carried out DOAS measurements and processed the data; TP and AM built the UV camera and one of the DOAS and reviewed the English.
SL was funded by Beca Doctorado Nacional ANID-PCHA/ Doctorado Nacional/21160276 (Agencia Nacional de Investigación y Desarrollo-ANID). This work was partially funded by the ANID Iniciativa Milenio-ICN2021_038 “Instituto Milenio de Investigación en Riesgo Volcánico—Ckelar Volcanes”, ANID-FONDAP 15110017 project “Centro de Investigación para la Gestión Integrada del Riesgo de Desastres, CIGIDEN”, FIC-R BIP 30488832-0 project ”Mitigación de los Riesgos Asociados a Procesos Volcánicos en la Región de Antofagasta”, funded by the Antofagasta Regional Government, National Research Funding Competition FONDECYT Regular 2021 Code 1211220, and Special Project 2017 (277/2017) Vicerrectoría de Investigación y Desarrollo Tecnológico, Universidad Católica del Norte, “Procesos que controlan el balance de masa en volcanes activos del Norte de Chile”.
The authors declare that the research was conducted in the absence of any commercial or financial relationships that could be construed as a potential conflict of interest.
All claims expressed in this article are solely those of the authors and do not necessarily represent those of their affiliated organizations, or those of the publisher, the editors and the reviewers. Any product that may be evaluated in this article, or claim that may be made by its manufacturer, is not guaranteed or endorsed by the publisher.
Aguilera, F., Layana, S., Rojas, F., Arratia, P., Wilkes, T. C., González, C., et al. (2020). First measurements of gas flux with a low-cost smartphone sensor-based UV camera on the volcanoes of northern Chile. Remote Sens. 12 (13), 2122.
Aguilera, F., Tassi, F., Darrah, T., Moune, S., and Vaselli, O. (2012). Geochemical model of a magmatic–hydrothermal system at the Lastarria volcano, northern Chile. Bull. Volcanol. 74 (1), 119–134. doi:10.1007/s00445-011-0489-5
Aiuppa, A., Moretti, R., Federico, C., Giudice, G., Gurrieri, S., Liuzzo, M., et al. (2007). Forecasting Etna eruptions by real-time observation of volcanic gas composition. Geology 35 (12), 1115–1118. doi:10.1130/g24149a.1
Anderssohn, J., Motagh, M., Walter, T. R., Rosenau, M., Kaufmann, H., and Oncken, O. (2009). Surface deformation time series and source modeling for a volcanic complex system based on satellite wide swath and image mode interferometry: The Lazufre system, central Andes. Remote Sens. Environ. 113 (10), 2062–2075. doi:10.1016/j.rse.2009.05.004
Bell, A. F., Naylor, M., Hernandez, S., Main, I. G., Gaunt, H. E., Mothes, P., et al. (2018). Volcanic eruption forecasts from accelerating rates of drumbeat long-period earthquakes. Geophys. Res. Lett. 45, 1339–1348. doi:10.1002/2017gl076429
Biggs, J., Ebmeier, S. K., Aspinall, W. P., Lu, Z., Pritchard, M. E., Sparks, R. S. J., et al. (2014). Global link between deformation and volcanic eruption quantified by satellite imagery. Nat. Commun. 5 (1), 3471–3477. doi:10.1038/ncomms4471
Calahorrano-Di Patre, A., Williams-Jones, G., Battaglia, M., Mothes, P., Gaunt, E., Zurek, J., et al. (2019). Hydrothermal fluid migration due to interaction with shallow magma: Insights from gravity changes before and after the 2015 eruption of Cotopaxi volcano, Ecuador. J. Volcanol. Geotherm. Res. 387, 106667. doi:10.1016/j.jvolgeores.2019.106667
Cameron, C. E., Prejean, S. G., Coombs, M. L., Wallace, K. L., Power, J. A., and Roman, D. C. (2018). Alaska volcano observatory alert and forecasting timeliness: 1989-2017. Front. Earth Sci. 6, 86. doi:10.3389/feart.2018.00086
Campion, R., Delgado-Granados, H., and Mori, T. (2015). Image-based correction of the light dilution effect for SO2 camera measurements. J. Volcanol. Geotherm. Res. 300, 48–57. doi:10.1016/j.jvolgeores.2015.01.004
Casertano, L. (1963). General characteristics of active Andean volcanoes and a summary of their activities during recent centuries. Bull. Seismol. Soc. Am. 53 (6), 1415–1433. doi:10.1785/bssa0530061415
Caudron, C., Girona, T., Jolly, A., Christenson, B., Kane Savage, M., Carniel, R., et al. (2021). A quest for unrest in multiparameter observations at Whakaari/White Island volcano, New Zealand 2007–2018. Earth Planets Space 73, 195. doi:10.1186/s40623-021-01506-0
Chance, K., and Kurucz, R. L. (2010). An improved high-resolution solar reference spectrum for earth's atmosphere measurements in the ultraviolet, visible, and near infrared. J. quantitative Spectrosc. Radiat. Transf. 111 (9), 1289–1295. doi:10.1016/j.jqsrt.2010.01.036
Chance, K. V., and Spurr, R. J. (1997). Ring effect studies: Rayleigh scattering, including molecular parameters for rotational Raman scattering, and the fraunhofer spectrum. Appl. Opt. 36 (21), 5224–5230. doi:10.1364/ao.36.005224
Conde, V., Nilsson, D., Galle, B., Cartagena, R., and Muñoz, A. (2014). A rapid deployment instrument network for temporarily monitoring volcanic SO&lt;sub&gt;2&lt;/sub&gt; emissions – A case study from telica volcano. Geoscientific Instrum. Methods Data Syst. 3 (2), 127–134. doi:10.5194/gi-3-127-2014
Coppola, D., Valade, S., Masias, P., Laiolo, M., Massimetti, F., Campus, A., et al. (2022). Shallow magma convection evidenced by excess degassing and thermal radiation during the dome-forming Sabancaya eruption (2012–2020). Bull. Volcanol. 84 (2), 16–19. doi:10.1007/s00445-022-01523-1
Dempsey, D., Cronin, S., Mei, S., and Kempa-Liehr, A. (2020). Automatic precursor recognition and real-time forecasting of sudden explosive volcanic eruptions at Whakaari, New Zealand. Nat. Commun. 11 (1), 3562–3568. doi:10.1038/s41467-020-17375-2
Díaz, D., Heise, W., and Zamudio, F. (2015). Three-dimensional resistivity image of the magmatic system beneath Lastarria volcano and evidence for magmatic intrusion in the back arc (northern Chile). Geophys. Res. Lett. 42 (13), 5212–5218. doi:10.1002/2015gl064426
Ebmeier, S. K., Andrews, B. J., Araya, M. C., Arnold, D. W. D., Biggs, J., Cooper, C., et al. (2018). Synthesis of global satellite observations of magmatic and volcanic deformation: Implications for volcano monitoring and the lateral extent of magmatic domains. J. Appl. Volcanol. 7, 2. doi:10.1186/s13617-018-0071-3
Fischer, T., Giggenbach, W., Sano, Y., and Williams, S. (1998). Fluxes and sources of volatiles discharged from Kudryavy, a subduction zone volcano, Kurile Islands. Earth Planet. Sci. Lett. 160, 81–96. doi:10.1016/s0012-821x(98)00086-7
Froger, J. L., Rémy, D., Bonvalot, S., and Legrand, D. (2007). Two scales of inflation at Lastarria-Cordon del Azufre volcanic complex, central Andes, revealed from ASAR-ENVISAT interferometric data. Earth Planet. Sci. Lett. 255 (1-2), 148–163. doi:10.1016/j.epsl.2006.12.012
Galetto, F., Acocella, V., Hooper, A., and Bagnardi, M. (2022). Eruption at basaltic calderas forecast by magma flow rate. Nat. Geosci. 15, 580–584. doi:10.1038/s41561-022-00960-z
Galetto, F., Bagnardi, M., Acocella, V., and Hooper, A. (2019). Noneruptive unrest at the Caldera of Alcedo Volcano (Galápagos Islands) revealed by InSAR data and geodetic modeling. J. Geophys. Res. Solid Earth 124 (4), 3365–3381. doi:10.1029/2018jb017103
Galle, B., Johansson, M., Rivera, C., Zhang, Y., Kihlman, M., Kern, C., et al. (2010). Network for observation of volcanic and atmospheric change (NOVAC)—a global network for volcanic gas monitoring: Network layout and instrument description. J. Geophys. Res. Atmos. 115 (D5), D05304. doi:10.1029/2009jd011823
Girona, T., Costa, F., Newhall, C., and Taisne, B. (2014). On depressurization of volcanic magma reservoirs by passive degassing. J. Geophys. Res. Solid Earth 119 (12), 8667–8687. doi:10.1002/2014jb011368
Guo, Q., Xu, C., Wen, Y., Liu, Y., and Xu, G. (2019). The 2017 noneruptive unrest at the Caldera of Cerro Azul Volcano (Galápagos Islands) revealed by InSAR observations and geodetic modelling. Remote Sens. 11 (17), 1992. doi:10.3390/rs11171992
Heap, M., Faulkner, D., Meredith, P., and Vinciguerra, S. (2010). Elastic moduli evolution and accompanying stress changes with increasing crack damage: Implications for stress changes around fault zones and volcanoes during deformation. Geophys. J. Int. 183, 225–236. doi:10.1111/j.1365-246x.2010.04726.x
Henderson, S. T., Delgado, F., Elliott, J., Pritchard, M. E., and Lundgren, P. R. (2017). Decelerating uplift at Lazufre volcanic center, Central Andes, from AD 2010 to 2016, and implications for geodetic models. Geosphere 13 (5), 1489–1505. doi:10.1130/ges01441.1
Ilanko, T., Pering, T. D., Wilkes, T. C., Choquehuayta, F. E. A., Kern, C., Moreno, A. D., et al. (2019). Degassing at Sabancaya volcano measured by UV cameras and the NOVAC network. Volcanica 2 (2), 239–252. doi:10.30909/vol.02.02.239252
Kantzas, E. P., McGonigle, A. J., Tamburello, G., Aiuppa, A., and Bryant, R. G. (2010). Protocols for UV camera volcanic SO2 measurements. J. Volcanol. Geotherm. Res. 194 (1-3), 55–60. doi:10.1016/j.jvolgeores.2010.05.003
Klein, A., Lübcke, P., Bobrowski, N., Kuhn, J., and Platt, U. (2017). Plume propagation direction determination with SO&lt;sub&gt;2&lt;/sub&gt; cameras. Atmos. Meas. Tech. 10 (3), 979–987. doi:10.5194/amt-10-979-2017
Lages, J., Chacón, Z., Burbano, V., Meza, L., Arellano, S., Liuzzo, M., et al. (2019). Volcanic gas emissions along the Colombian arc segment of the northern volcanic zone (CAS-NVZ): Implications for volcano monitoring and volatile budget of the andean volcanic belt. Geochem. Geophys. Geosystems 20 (11), 5057–5081. doi:10.1029/2019gc008573
Layana, S., Aguilera, F., Rojo, G., Vergara, Á., Salazar, P., Quispe, J., et al. (2020). Volcanic Anomalies monitoring System (VOLCANOMS), a low-cost volcanic monitoring system based on Landsat images. Remote Sens. 12 (10), 1589. doi:10.3390/rs12101589
Lewicki, J., Fischer, T., and Williams, S. (2000). Chemical and isotopic compositions of fluids at cumbal volcano, Colombia: Evidence for magmatic contribution. Bull. Volcanol. 62, 347–361. doi:10.1007/s004450000100
Lopez, T., Aguilera, F., Tassi, F., De Moor, J. M., Bobrowski, N., Aiuppa, A., et al. (2018). New insights into the magmatic-hydrothermal system and volatile budget of Lastarria volcano, Chile: Integrated results from the 2014 IAVCEI CCVG 12th Volcanic Gas Workshop. Geosphere 14 (3), 983–1007. doi:10.1130/ges01495.1
López, T., Ushakov, S., Izbekov, P., Tassi, F., Cahill, C., Neill, O., et al. (2013). Constraints on magma processes, subsurface conditions, and total volatile flux at Bezymianny Volcano in 2007–2010 from direct and remote volcanic gas measurements. J. Volcanol. Geotherm. Res. 263, 92–107. doi:10.1016/j.jvolgeores.2012.10.015
McGonigle, A. J. S., Hilton, D. R., Fischer, T. P., and Oppenheimer, C. (2005). Plume velocity determination for volcanic SO2 flux measurements. Geophys. Res. Lett. 32 (11). doi:10.1029/2005GL022470
Montegrossi, G., Tassi, F., Vaselli, O., Buccianti, A., and Garofalo, K. (2001). Sulfur species in volcanic gases. Anal. Chem. 73 (15), 3709–3715. doi:10.1021/ac001429b
Moussallam, Y., Tamburello, G., Peters, N., Apaza, F., Schipper, C. I., Curtis, A., et al. (2017). Volcanic gas emissions and degassing dynamics at Ubinas and Sabancaya volcanoes; implications for the volatile budget of the central volcanic zone. J. Volcanol. Geotherm. Res. 343, 181–191. doi:10.1016/j.jvolgeores.2017.06.027
Naranjo, J. A. (1992). Chemistry and petrological evolution of the Lastarria volcanic complex in the north Chilean Andes. Geol. Mag. 129 (6), 723–740. doi:10.1017/s0016756800008451
Naranjo, J. (2010). Geología del Complejo Volcánico Lastarria, Región de Antofagasta: Servicio Nacional de Geología y Minería Carta Geológica de Chile, 123.
Pearse, J., and Lundgren, P. (2013). Source model of deformation at Lazufre volcanic center, central Andes, constrained by InSAR time series. Geophys. Res. Lett. 40 (6), 1059–1064. doi:10.1002/grl.50276
Platt, U., and Stutz, J. (2008). “Differential absorption spectroscopy,” in Differential optical absorption spectroscopy (Berlin, Heidelberg: Springer), 135–174.
Pritchard, M., de Silva, S., Michelfelder, G., Zandt, G., McNutt, S., Gottsmann, J., et al. (2018). Synthesis: Plutons: Investigating the relationship between pluton growth and volcanism in the central Andes. Geosphere 14 (3), 954–982. doi:10.1130/ges01578.1
Pritchard, M., and Simons, M. (2002). A satellite geodetic survey of large-scale deformation of volcanic centres in the central Andes. Nature 418 (6894), 167–171. doi:10.1038/nature00872
Pritchard, M., and Simons, M. (2004). An InSAR-based survey of volcanic deformation in the central Andes. Geochem. Geophys. Geosystems 5 (2). doi:10.1029/2003gc000610
Reath, K., Pritchard, M., Poland, M., Delgado, F., Carn, S., Coppola, D., et al. (2019). Thermal, deformation, and degassing remote sensing time series (CE 2000–2017) at the 47 most active volcanoes in Latin America: Implications for volcanic systems. J. Geophys. Res. Solid Earth 124 (1), 195–218. doi:10.1029/2018jb016199
Robidoux, P., Rizzo, A. L., Aguilera, F., Aiuppa, A., Artale, M., Liuzzo, M., et al. (2020). Petrological and noble gas features of Lascar and Lastarria volcanoes (Chile): Inferences on plumbing systems and mantle characteristics. Lithos 370, 105615. doi:10.1016/j.lithos.2020.105615
Roman, D. C., and Cashman, K. V. (2018). Top-down precursory volcanic seismicity: Implications for ‘stealth’ magma ascent and long-term eruption forecasting. Front. Earth Sci. 6, 124. doi:10.3389/feart.2018.00124
Ruch, J., Anderssohn, J., Walter, T., and Motagh, M. (2008). Caldera-scale inflation of the Lazufre volcanic area, south America: Evidence from InSAR. J. Volcanol. Geotherm. Res. 174 (4), 337–344. doi:10.1016/j.jvolgeores.2008.03.009
Ruch, J., Manconi, A., Zeni, G., Solaro, G., Pepe, A., Shirzaei, M., et al. (2009). Stress transfer in the Lazufre volcanic area, central Andes. Geophys. Res. Lett. 36 (22), L22303. doi:10.1029/2009gl041276
Segall, P. (2013). Volcano deformation and eruption forecasting. Geol. Soc. Lond. Spec. Publ. 380 (1), 85–106. doi:10.1144/sp380.4
Spampinato, S., Langer, H., Messina, A., and Falsaperla, S. (2019). Short-term detection of volcanic unrest at Mt. Etna by means of a multi-station warning system. Sci. Rep. 9, 6506. doi:10.1038/s41598-019-42930-3
Spica, Z., Legrand, D., Iglesias, A., Walter, T., Heimann, S., Dahm, T., et al. (2015). Hydrothermal and magmatic reservoirs at Lazufre volcanic area, revealed by a high-resolution seismic noise tomography. Earth Planet. Sci. Lett. 421, 27–38. doi:10.1016/j.epsl.2015.03.042
Stechern, A., Just, T., Holtz, F., Blume-Oeste, M., and Namur, O. (2017). Decoding magma plumbing and geochemical evolution beneath the Lastarria volcanic complex (northern Chile)—evidence for multiple magma storage regions. J. Volcanol. Geotherm. Res. 338, 25–45. doi:10.1016/j.jvolgeores.2017.03.018
Tamburello, G., Hansteen, T. H., Bredemeyer, S., Aiuppa, A., and Tassi, F. (2014). Gas emissions from five volcanoes in northern Chile and implications for the volatiles budget of the Central Volcanic Zone. Geophys. Res. Lett. 41 (14), 4961–4969. doi:10.1002/2014gl060653
Tizzani, P., Battaglia, M., Castaldo, R., Pepe, A., Zeni, G., and Lanari, R. (2015). Magma and fluid migration at Yellowstone Caldera in the last three decades inferred from InSAR, leveling, and gravity measurements. J. Geophys. Res. Solid Earth 120 (4), 2627–2647. doi:10.1002/2014jb011502
Tizzani, P., Battaglia, M., Zeni, G., Atzori, S., Berardino, P., and Lanari, R. (2009). Uplift and magma intrusion at Long Valley caldera from InSAR and gravity measurements. Geology 37 (1), 63–66. doi:10.1130/g25318a.1
Vandaele, A., Simon, P., Guilmot, J., Carleer, M., and Colin, R. (1994). SO2 absorption cross section measurement in the UV using a Fourier transform spectrometer. J. Geophys. Res. Atmos. 99 (D12), 25599–25605. doi:10.1029/94jd02187
Voigt, S., Orphal, J., Bogumil, K., and Burrows, J. (2001). The temperature dependence (203–293 K) of the absorption cross sections of O3 in the 230–850 nm region measured by Fourier-transform spectroscopy. J. Photochem. Photobiol. A Chem. 143 (1), 1–9. doi:10.1016/s1010-6030(01)00480-4
Wilkes, T. C., McGonigle, A. J., Pering, T. D., Taggart, A. J., White, B. S., Bryant, R. G., et al. (2016). Ultraviolet imaging with low cost smartphone sensors: development and application of a Raspberry Pi-based UV camera. Sensors 16 (10), 1649. doi:10.3390/s16101649
Wilkes, T., Pering, T., McGonigle, A., Tamburello, G., and Willmott, J. (2017). A low-cost smartphone sensor-based UV camera for volcanic SO2 emission measurements. Remote Sens. 9 (1), 27. doi:10.3390/rs9010027
Keywords: volcanic degassing, volatile flux, central volcanic zone of the andes, PiCam, ground-based remote gas measurements, direct sampling
Citation: Layana S, Aguilera F, Inostroza M, Tassi F, Wilkes TC, Bredemeyer S, González C, Pering TD and McGonigle AJS (2023) Evolution of the magmatic-hydrothermal system at Lastarria volcano (Northern Chile) between 2006 and 2019: Insights from fluid geochemistry. Front. Earth Sci. 11:1114001. doi: 10.3389/feart.2023.1114001
Received: 02 December 2022; Accepted: 03 April 2023;
Published: 20 April 2023.
Edited by:
Ryunosuke Kazahaya, National Institute of Advanced Industrial Science and Technology (AIST), JapanReviewed by:
Taryn Lopez, University of Alaska Fairbanks, United StatesCopyright © 2023 Layana, Aguilera, Inostroza, Tassi, Wilkes, Bredemeyer, González, Pering and McGonigle. This is an open-access article distributed under the terms of the Creative Commons Attribution License (CC BY). The use, distribution or reproduction in other forums is permitted, provided the original author(s) and the copyright owner(s) are credited and that the original publication in this journal is cited, in accordance with accepted academic practice. No use, distribution or reproduction is permitted which does not comply with these terms.
*Correspondence: Susana Layana, c3VzYW5hLmxheWFuYUBja2VsYXIub3Jn
Disclaimer: All claims expressed in this article are solely those of the authors and do not necessarily represent those of their affiliated organizations, or those of the publisher, the editors and the reviewers. Any product that may be evaluated in this article or claim that may be made by its manufacturer is not guaranteed or endorsed by the publisher.
Research integrity at Frontiers
Learn more about the work of our research integrity team to safeguard the quality of each article we publish.