 Yiheng Zhu
 Shan Yang1,2*
 Anning Cai
95% of researchers rate our articles as excellent or good
Learn more about the work of our research integrity team to safeguard the quality of each article we publish.
Find out more
ORIGINAL RESEARCH article
Front. Earth Sci. , 16 March 2023
Sec. Geoscience and Society
Volume 11 - 2023 | https://doi.org/10.3389/feart.2023.1112423
This article is part of the Research Topic Mapping Multiscale Water-Energy-Food-Land-Climate Nexus for Delivery of Sustainable Development Goals View all 4 articles
The speed of urban growth affects urban development’s momentum and urban agglomeration’s spatial state. The influence of the asymmetric flow of population and land factors on the economic agglomeration effect is an essential issue in the coordinated development of urbanization. To study its impact on the orderly development of China’s urban economy, this paper selects 41 cities in the Yangtze River Delta (YRD) region, measuring the spatial and temporal evolution of the allometric growth relationship between population and land, explores the mechanism of the effect of allometric relationships on the economic agglomeration effect. The results show that: 1) Population-land allometric growth is characterized by a transition from population to land expansion. The transition phase is divided into six stages, from positive to negative allometric growth. In terms of scaling coefficients, the period from 2000 to 2011 is characterized by negative allometric growth, and the period from 2012 to 2019 is characterized by positive allometric growth. Spatially, the Shanghai metropolitan area evolves into a positive allometric primary stage, while the core and central areas evolve into a positive allometric secondary stage, with the latter’s development transition lagging behind the former by about 10 years. 2) The spatial dependence of economic agglomeration in the Yangtze River Delta is strong, showing a spatial distribution trend of “high in the middle, low in the north and south, high in the east and low in the west,” the agglomeration gap is gradually reduced, forming a “continuous area of high-value economic agglomeration” with the core area as the center and spreading outward, reflecting the efficacy of the Yangtze River Delta integrated development strategy. 3) The economic agglomeration effect of allometric growth is classified into four types: positive-allometric positive-effect, positive-allometric negative-effect, negative-allometric positive-effect, and negative-allometric negative-effect. In the Yangtze River Delta region, 70.7% of the cities have positive effects, of which 93.1% are positive-positive. 4) The allometric growth has an important impact on the reconfiguration of economic agglomeration pattern, 78% of the cities in the study period produced leapfrog movements in different quadrants, and the incongruity between population growth and land expansion should be actively regulated in the future to promote the evolution of cities towards an intensive type of population-land coordination to lead the high-quality development of the regional economy.
The Industrial Revolution started a necessary urbanization process in human history (Li and Qi, 2019). Since the reform and opening up, China’s urbanization has dramatically accelerated, with the urbanization rate of the resident population growing from 17.9% in 1978 to 60.6% in 2019, exceeding 60% for the first time, with an average annual growth rate of more than 1% (Lu and Chen, 2015). The important symbols in the process of urbanization development are population urbanization and land urbanization, which are respectively represented by the transformation of urban population structure and the transformation of rural land into urban land (Lu et al., 2019), and the resulting contradiction between people and land has become increasingly prominent (Huang and Liu, 2022). Due to the differences in each city’s location, resource endowment, and historical development base, the starting speed of urban development shows specific differences, and the accumulation of the different cycles results in the imbalance of shared benefits between regions. As a basic form of urbanization, the imbalance between population growth and land expansion has been a broad concern by society (Marshall, 2007; Deng, 2021; You et al., 2021). At the critical stage of transformation of China’s high-quality modernization construction, it is of practical significance to accurately grasp the spatio-temporal evolution characteristics of the differences in population and land development rates between cities and explore their impact on economic agglomeration development for sustainable regional development.
Allometric growth was first discovered and applied in the field of biology. It is used to describe the phenomenon that the growth and development of one part of an organism grow in proportion to the organism as a whole or another part (Gould, 1966; West et al., 2002). In the mid-20th century, Naroll and Bertalanffy introduced the law of allometric growth from the field of biology to the field of geography (Naroll and Bertalanffy, 1973). Beckmann proposed the equation of allometric growth of urban systems, which was used to portray the relative ratio of the largest urban population to the total population of all cities in urban systems (Beckmann, 1958), so that the law of allometric growth was gradually applied to the study of geography, and then gradually became one of the fundamental laws of urban geography (Zhou, 1995). The concept of allometric growth in urban geography is derived from referring to the constant proportional relationship between an urban system’s local growth rate and the system’s relative growth rate as a whole or another part of the system (Chen, 2004).
In the spatial distribution and dynamic evolution of urban development factors, the allometric growth model provides a new idea and method for studying urban and urban agglomeration. Domestic and foreign scholars have focused on the urban-rural subsystem and the allometric growth of urbanization factors such as population, land, and economy within cities. Naroll and Bertalanffy first verified the allometric growth relationship between urban and rural populations (Naroll and Bertalanffy, 1973), and then Dutton proposed that the allometric growth equation also satisfied the relationship between urban population and urban area (Dutton, 1973). A series of studies by West et al. (2002) found that different economic and social indicators of cities can be expressed uniformly as a power function relationship, i.e., there is a universal scalar law, such that urban infrastructure is proportional to the 0.85th power of urban population size (Bettencourt and West, 2010; West, 2018). In recent years, scholars’ studies on allometric growth have focused on the allometric relationship between urban population and urban area (Liu and Chen, 2005; Zhu and Ou, 2020), urban population and rural population (Chen, 1999; Xu et al., 2018), urban size and economic output (Chen and Jiang, 2009; Gao et al., 2013), and infrastructure density (Li et al., 2015; Jia et al., 2022). The primary purpose of this research is to measure the allometric growth relationship among urban elements in the urbanization process, to discern the rationality of the development and utilization of each element, and to propose reasonable suggestions for the development and optimization of urbanization. Specifically, in terms of population-land allometric growth, scholars have studied regions such as Beijing-Tianjin-Hebei urban agglomeration, Shandong province, Jiangsu province, and Henan province based on theories, methods, or data such as fractal theory, the law of dislocation scale, and nighttime light data (Sun et al., 2011; Fu et al., 2015; Long and Chen, 2019). These studies found obvious allometric growth characteristics in multiple regions, significant development differences, and relatively chaotic population-land relations within and between regions (Dong et al., 2012; Chen and Zhang, 2014). In addition, scholars have also studied the allometric growth in areas such as city limits, road network structure, port throughput, and population size (Adhikari and de Beurs, 2017; Chen, 2017; Chen et al., 2018; Lan et al., 2019; Lan et al., 2021), further enriching the depth and breadth of related studies.
China’s economy has shifted from the stage of high-speed growth to the stage of high-quality development, and the spatial carrier of economic activities also tends to develop mainly in the form of urban clusters. In the context of the changing pattern of the global economic cycle, the spatial structure of economic agglomeration development is undergoing profound changes, and urban agglomerations have become necessary territorial organizational units for national participation in the international division of labor and global competition. China has also taken urban agglomerations as the primary form of urbanization (Fang, 2021), elevated to an effective nation-regional integration and development strategy. Urban agglomerations are the critical link in optimizing the regional economic layout and have a leading role in regional economic development. Current research on economic agglomeration focuses on constructing, measuring, and evaluating the index system of high-quality economic development (Shi and Ren, 2018; Li, 2022), regional disparities in economic development, and exploring paths for coordinated economic development (Xu and Jia, 2005; Ou et al., 2012; Zhao et al., 2014; Wang and Jin, 2018). In the study of the relationship between urbanization factors on economic growth, some scholars have explored the decoupling relationship between land factors and economic growth and the spatial spillover effect of land factor inputs on urban economic growth with the help of the decoupling index model and three-factor C-D production function economic growth model (Yang et al., 2020; Wang et al., 2021), and some scholars have analyzed the urbanization of land and population with the help of econometric models in terms of their effect on economic growth with the help of econometric models (Zhu et al., 2020). The influence of economic factors on balanced regional development is diverse and complex, but only some scholars have explored its effect on regional economic agglomeration from the perspective of allometric growth. Therefore, there is an urgent need to study the economic agglomeration of regional development from the perspective of allometric growth. It is used to propose policy measures for coordinating and co-processing between urban factor flow and economic agglomeration development to regulate the orderly flow of regional factors.
In summary, this paper takes 41 cities in the YRD region as the case study. The population-land allometric growth model is constructed through multiple scales from Shanghai metropolitan area, core area, and central area. To study the evolution pattern of allometric growth in the YRD as a whole, locally and by cities from 2000 to 2019. On this basis, explore the economic agglomeration effect of population-land allometric growth. The study hopes to provide a scientific basis for coordinated regional development.
The rest of the paper is organized as follows: Section 2 explains the methodology and data; Section 3 analyzes the population-land allometric growth characteristics and explores the economic agglomeration effects of allometric growth; Section 4 discusses the empirical evidence and makes relevant policy recommendations, and Section 5 is the conclusion.
The Yangtze River Delta (YRD) region is one of the most economically dynamic regions in China, located in the center of the eastern coast of mainland China, with a total regional land area of 358,000 square kilometers. By the end of 2019, with 16.1% of the population and less than 4% of the land, the YRD region created a regional GDP of 23.75 trillion yuan, accounting for about 23.9% of the country, the urbanization rate of the resident population was 67.23%, 6.63% points higher than the national average (CSB, 2020). It is an essential engine for China’s economic and social development and an important platform for participation in international competition.
This paper takes three provinces and one city of the whole YRD region as the study area. According to the latest administrative division at the end of 2019, there are 41 basic units, one municipality directly under the central government of Shanghai, 13 prefecture-level cities in Jiangsu Province, 11 prefecture-level cities in Zhejiang Province, and 16 prefecture-level cities in Anhui Province. Based on the Regional Plan for the YRD Region promulgated in 2010, the Outline of the YRD Regional Integrated Development Plan promulgated in 2019, and the Spatial Synergy Plan for the Shanghai Metropolitan Area promulgated in 2022, etc., the YRD region is subdivided into three sub-regions, the Shanghai Metropolitan Area, the Core Area, and the Central Area, each containing 9, 16, and 27 cities (Figure 1). To analyze the evolutionary characteristics of sub-regional allometric growth relationships and the differences in their effects on economic agglomeration from different scales to better serve the coordinated and high-quality development of the YRD region.
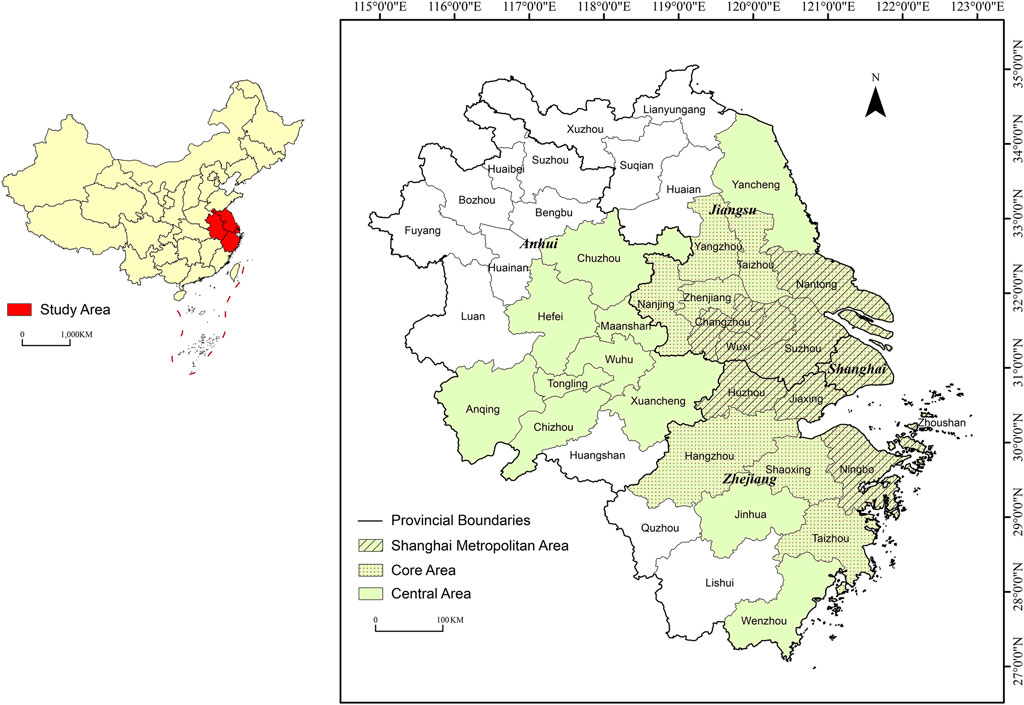
FIGURE 1. Study area.
The spatial distribution relationship between urban population and urban land is an essential basis for rationalizing urban resource allocation and formulating related policies. This paper selects the resident population and the built-up area to characterize the interaction between population and land use. Economic development has a rich connotation that covers many aspects of economic growth and can better meet the growing real needs of the people in terms of economic development methods, structures, and dynamic states (Jin, 2018). This paper selects six economic factors to build an economic agglomeration index evaluation index system in conjunction with relevant studies (Table 1). Among them, maintaining a certain rate and scale of economic growth is a necessary support condition for urban economic development; the advanced level of industrialization and urban competitiveness provide the basis for the enhancement of urban economic strength and risk resistance; the efficiency of labor productivity and the level of market consumption have a role in the stable development of society (Zhu et al., 2022).
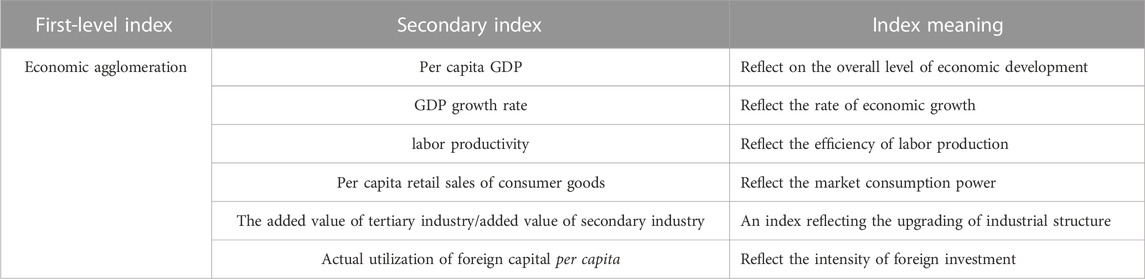
TABLE 1. Economic agglomeration index evaluation index system.
The research data mainly come from the Statistical Yearbook of Chinese cities from 2001 to 2020, the Statistical Yearbook of Shanghai, the Statistical Yearbook of Jiangsu Province, the Statistical Yearbook of Zhejiang Province, the Statistical Yearbook of Anhui Province, the statistical yearbooks of prefecture-level cities and the statistical bulletins of national economic and social development of prefecture-level cities. Considering the adjustment of administrative divisions and the continuity of data, the data were divided and merged according to the latest administrative divisions during the study period, and the data of some missing years were supplemented by interpolation. Uses ArcGIS software to extract the administrative boundary map of the YRD region and vectorize it as a base map for related research work in the YRD.
The entropy mainly characterizes the dispersion degree of indicators. The smaller the entropy value indicates that the greater the dispersion of the indicator, the greater the weight of the indicator for the comprehensive evaluation; conversely, the smaller the weight of the indicator for the comprehensive evaluation. The scientific setting of the weights of each indicator plays a pivotal role in the accurate calculation of the economic agglomeration index. This paper adopts this objective weighting method, which effectively avoids the bias of subjective artificial factors on the weighting of economic agglomeration indicators in the YRD region. Finally, it uses composite weighting to calculate the economic agglomeration index of the YRD region from 2000 to 2019. For detailed calculation steps, see Reference (Xue and Zeng, 2016).
Allometric growth is a classical scalar concept in biology and ecology, reflecting the geometric measure of the relationship between the local and the whole of an organism (Li et al., 2009). Allometric growth relation is the constant proportion between the relative growth rate of one part of a system and the relative growth rate of the whole system or another part of the system. This paper measures the allometric relationship between the population and land elements in urban systems. The different research objects divide into longitudinal allometry and transverse allometry. Longitudinal allometric growth measures the allometric relationship between geographic units in time series. Transverse allometric growth explores the allometric relationship of different geographical units on a time scale. The calculation formula of the allometric growth model is (Yin and Yang, 2021):
Taking the logarithm of both sides of Eq. 1, we can get:
Where At is the urban population at time t, Pt is the urban land use situation at time t, a is the proportion coefficient, and b is the scale coefficient, also known as the allometric growth coefficient. Studies by many scholars showed that when the allometric growth coefficient b is between 2/3 and 1, that is, when the average value is about 0.85, population and land are regarded as basically coordinated and equal speed growth. When b > 0.85, it is positive allometric growth, and the growth rate of the population is lower than that of land. When b < 0.85, it is negative allometric growth, and the growth rate of the population is greater than that of land (Li et al., 2009; Sun et al., 2011; Ma et al., 2018; Yin and Yang, 2021). Positive and negative allometric growth is divided into three levels, and the classification criteria and characteristics are shown in Table 2.
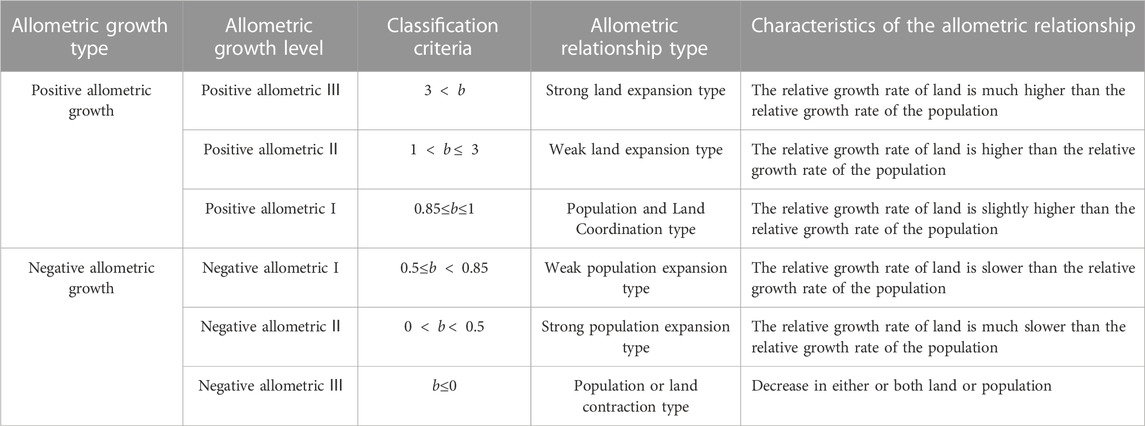
TABLE 2. The classification table of the allometric relationship between population and land.
The trend surface uses spatial data to fit a mathematical surface that illustrates the spatial trends in the distribution patterns of observations of geographic elements over a sizeable spatial span (Xu, 2002). This paper uses trend surface analysis to abstract the overall pattern of divergent trends of economic agglomeration in the YRD region in different years.
Based on the geographical location of each city and the 20-year panel data of the economic agglomeration index, using spatial interpolation to obtain the multi-year trend surface of the geographical distribution. Based on the trend surface definition, the formula is (Li et al., 2013):
Where Zi (xi, yi) is the geographic location of the city i, (xi, yi) is the plane space coordinates, Ti (xi,yi) is the trend function, εi is the residual value, β 0 is the constant term, β 1-β 5 are the coefficients of the variables in the trend function.
Using Global spatial autocorrelation (Global Moran’s I) to analyze the spatial correlation of economic agglomeration between study regions, i.e., it contains spatially positive, spatially negative, or randomly distributed. The calculation formula is as follows (Liu et al., 2019):
where, n is the number of study units, xi and xj are the economic agglomeration indices of city i and city j,
Using Pearson correlation coefficient to Explore the relationship between population-land and economic agglomeration. The calculation formula is as follows (Sun, 2014):
where, QXY is the correlation coefficient, and its value range QXY∈[−1,1], QXY
A double-log linear fit of population and land in the YRD region from 2000 to 2019 by an allometric growth model. It obtains the results of the population-land allometric growth models for the YRD region as a whole and the three regions of the Shanghai metropolitan area, core area, and central area (Table 3). The results show the variation of each region’s scaling coefficient (Figure 2).
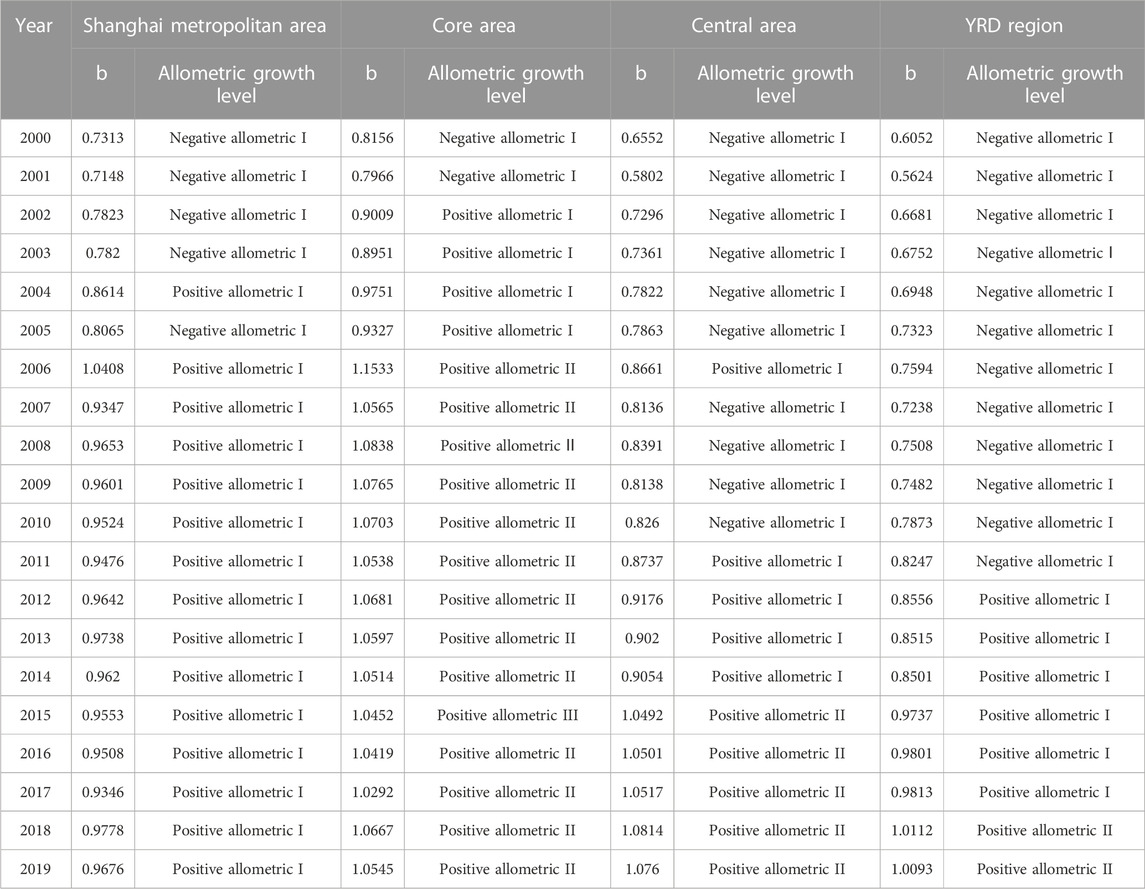
TABLE 3. Results of the population-land allometric growth fitting in the YRD region.

FIGURE 2. Change in the scale coefficient of population-land allometric growth in the YRD region.
The scalar coefficient for the YRD region fluctuates in the range of 0.6052–1.0112 from 2000 to 2019. During the study period, the YRD region gradually evolves from negative allometric I to positive allometric growth Ⅱ stage. The fitting effect of each year is good, and the goodness of fit of the fitting equation is above 0.65. According to the change of the scale coefficient, there is a general fluctuating upward trend during the study period, but it showed a slight downward trend in 2001, 2007, and 2014. The scale coefficient’s value and the type of allometric growth division can be divided into three periods: 2000–2011, 2012–2017, and 2018–2019. From 2000 to 2011, the scale coefficient fluctuated from 0.6052 to 0.8247, which is in the negative allometric growth I stage of a weakly expanding population. From 2012 to 2017, the scale coefficient fluctuated continuously above 0.85, increasing from 0.8556 to 0.9113, and showed a sharp upward trend from 0.8501 to 0.9737, increasing by 14.5% in 2014–2015. This period is in the positive allometric growth I stage. That is, the land-relative growth rate is slightly higher than the population-relative growth rate of the bare coordination stage. In 2018–2019, the scale coefficient was higher than one but with a slight decrease, and it is in the positive allometric growth II stage of weak land expansion. Overall, the three periods can be combined into two more periods: a negative allometric period of population expansion from 2000 to 2011 and a favorable allometric period of land expansion from 2012 to 2019, i.e., the YRD region as a whole is in a transition stage from population expansion to land expansion during the study period.
Further comparison is to explore the population-land allometric growth relationship at different scales in the YRD (Figure 2). The goodness of fit for the Shanghai metropolitan area is above 0.81, the core area is above 0.76, and the central area is above 0.70, indicating that the allometric growth model fits well in each region. The scale coefficients of the Shanghai metropolitan area and the core area have similar trends. The years from 2000 to 2006 were in a fluctuating upward trend, rising from 0.7313 to 1.0408 and 0.8156 to 1.1533, respectively, with the years from 2005 to 2006 in a sharp upward trend, increasing by 29.1% and 23.7%, respectively; the years 2007–2019 were in a relatively stable stage. From 2000 to 2019, the scale coefficient of the central area was in a continuous fluctuating upward trend, which increased from 0.6552 to 1.076, increasing by 64.2% during the study period. In addition, the core area, Shanghai metropolitan area, and central area have crossed the 0.85 demarcation line since 2002, and urban development has gradually transformed from population expansion to land expansion.
Combined with the typology of allometric growth (Table 3), all scale ranges from 2000 to 2019 transition from negative to positive allometric growth. Shanghai metropolitan area was in the negative allometric growth I stage of weak population expansion from 2000 to 2006 but fluctuated in 2004 and 2006. From 2007 to 2019, the average annual population and land development rate is at the positive allometric growth I stage, indicating that the urban population growth and land expansion in Shanghai metropolitan area are reasonable, and their growth rates are the same. With the expansion of the research scope and scale, the allometric growth types of the core and central areas are similar, showing the development transition of “population expansion, population-land coordination, and land expansion,” but there is a certain lag in the central area. The core area was in the negative allometric growth I stage of weak population expansion from 2000 to 2001, the positive allometric growth I stage of population-land coordination from 2002 to 2005, and the positive allometric growth II stage of land expansion from 2006 to 2019. The central area was a negative allometric growth I stage from 2000 to 2010 (with fluctuations in 2006), a positive allometric growth I stage from 2011 to 2014, and a positive allometric growth II stage from 2015 to 2019.
The mean scale coefficients of the Shanghai metropolitan area, core area, central area, and YRD from 2000 to 2019 were 0.9083, 1.0113, 0.8668, and 0.8022, respectively; the standard deviations of the scaling coefficients are 0.0906, 0.0919, 0.1379, and 0.1319, respectively. With the continuous expansion of the scale of the research scope, the allometric growth pattern of core area > Shanghai metropolitan area > central area > YRD as a whole was presented, and the scale coefficient of the central area changed the most dramatically, while the scale coefficient of Shanghai metropolitan area was the most stable. Generally, the regions of different scales are transitioning from the negative allometric growth I stage of weak population expansion to positive allometric growth. Shanghai metropolitan area is gradually transformed into the population and land coordination type, and the core area, central area, and the YRD as a whole is gradually transformed into the weak land expansion type.
From the above, divide the allometric growth in the YRD region from 2000 to 2019 into two major stages to further explore the population-land allometric growth relationship among different cities. Calculating the transverse allometric growth fitting model for 2000–2011 and 2012–2019 and visualizing its scale coefficients (Figure 3).
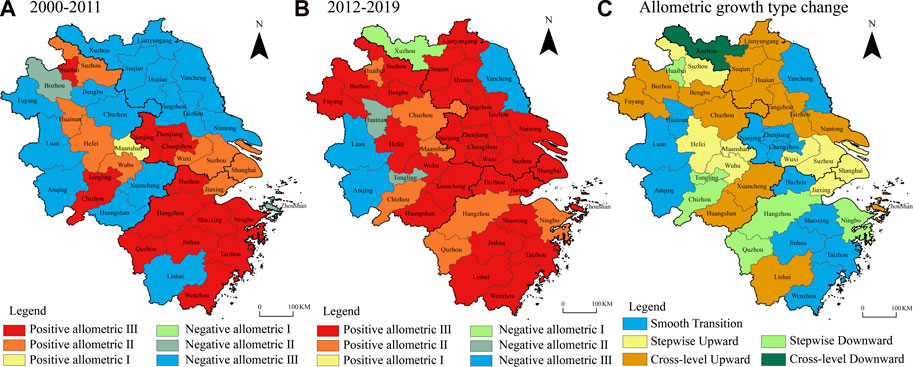
FIGURE 3. Distribution of population-land allometric growth types in the YRD from 2000 to 2019.
From 2000 to 2011, the YRD region was dominated by positive allometric growth, with 23 vibrant allometric cities accounting for 56.1% of all cities. There were 18 hostile allometric cities, accounting for 43.9% of all cities. Vivacious allometric cities are mainly distributed in Shanghai, Zhejiang, southern Jiangsu, and central Anhui, among which 7, 12, and 19 cities in Shanghai metropolitan area, core area, and central area are positive allometric growth, accounting for about 77.8%, 75%, and 70.4%, respectively. Specifically, there were 14 positive allometric growth III stage cities with substantial land expansion during the study period, accounting for 60.9% of the vibrant allometric growth cities. It is mainly distributed in Zhejiang province, Nanjing, Zhenjiang, Changzhou in Jiangsu Province, and Tongling, Chizhou, and Huaibei in Anhui Province. Only one city, Ma ‘anshan city, Anhui Province, was in the positive allometric growth I stage of population-land coordination. The remaining eight cities were in the positive allometric growth II stage of weak land expansion. Negative allometric growth was dominated by hostile allometric III growth cities with shrinking populations and land, accounting for 88.9% of hostile allometric growth cities, mainly concentrated in northern Jiangsu, western and southern Anhui. Only two cities, Zhoushan City, Zhejiang Province, and Bozhou City, Anhui Province, were in the negative allometric growth II stage with substantial population expansion. The goodness of fit of the allometric growth model for each city is generally high, and only four cities, Nantong, Suzhou, Lu’an, and Bozhou, have a goodness of fit below 0.40.
From 2011 to 2019, the YRD region still showed positive allometric growth. There are 37 vibrant allometric cities, accounting for 90.2% of all cities. It is mainly concentrated in Shanghai, Jiangsu, southeastern Zhejiang, and most areas of Anhui. Nine positive allometric growth II stage cities, accounting for 24.3% of the total number of vibrant allometric cities, distributed in central and southern Anhui and northern Zhejiang. There were 28 positive allometric growth III stage cities, accounting for 75.7% of the total vivacious allometric cities, distributed in Shanghai, Jiangsu, southern Zhejiang, northern and southern Anhui, and other regions. There were four hostile allometric cities, accounting for 9.8% of all cities. Among them, there was only one negative allometric growth I stage city, Xuzhou. There were three negative allometric growth III stage cities, Yancheng, Lu’an, and Anqing. The overall fitting effect is good from the perspective of the goodness of fit. Only four cities Yancheng, Taizhou, Huainan, and Anqing have a goodness of fit below 0.40.
According to the different categories of population-land allometric growth in the two time periods of 2000–2011 and 2012–2019, they are classified into five types of evolution. Namely, stepwise upward (positive and negative allometric velocity levels fluctuate upward by one level), cross-level upward (positive and negative allometric velocity levels fluctuate upward by more than one level), stepwise downward (positive and negative allometric velocity levels fluctuate downward by one level), cross-level downward (positive and negative allometric velocity levels fluctuate upward by more than one level), and smooth transition (positive and negative allometric velocity levels do not change). Specifically, there were 22 cities with upward changes (stepwise upward and cross-level upward), accounting for 53.7% of all cities. After the change, 20 cities turned into positive allometric growth III stage cities, and the number of cities with upward change was large and widely distributed. Twelve cities, mainly distributed in southwestern Zhejiang, southern Jiangsu, and western Anhui, have maintained a smooth transition, accounting for 29.2% of all cities. There were seven cities with downward changes (stepwise downward and cross-level downward), including Xuzhou in Jiangsu Province, Hangzhou in Zhejiang Province, Ningbo and Quzhou in Zhejiang Province, and Huaibei, Tongling, and Chizhou in Anhui Province, accounting for 17.1% of all cities.
In general, from 2000 to 2019, the YRD region was dominated by land expansion, where the relative growth rate of land exceeded the population. Moreover, the degree of land expansion increased continuously from 2012 to 2019. Over time, the rate of land expansion in the YRD keeps a high level and continues to improve, and land expansion has become the main focus of urban development.
Using the entropy weight method, obtain the economic agglomeration index of the YRD region from 2000 to 2019. Combined with the above research, visualize and analyze three periods of economic agglomeration index in 2000, 2011, and 2019 on the trend surface (Figure 4). According to the trend surface changes, the north-south direction (Y-axis) from 2000 to 2019 showed an inverted U-shaped trend of “high in the middle and low in the north and south,” and the north-south gap has fallen. The east-west direction (X-axis) shows an evident trend of “east is high, and west is low,” extending from west to east as a parabola, but the gap between east and west also narrowed. Further, according to the contour visualization diagram, the economic agglomeration index of the YRD has been continuously improved during the study period. The gap between regional agglomeration and development has gradually narrowed from the “single center” of Shanghai in 2000 to the “multi-center” of Shanghai-Nanjing-Hangzhou-Hefei in 2011, and then to the “continuous economic high-value agglomeration area” with the provincial capital city as the center in 2019. In general, the economic agglomeration in the YRD shows a spatial distribution trend of “high in the middle and low in the north and south, high in the east and low in the west” and gradually forms a distribution pattern of “continuous economic high-value agglomeration area” with the core area as the center. The degree of spatial clustering of economic agglomeration gradually decreases and tends to spread, reflecting the efficacy of the promotion of the integrated development strategy of the YRD.
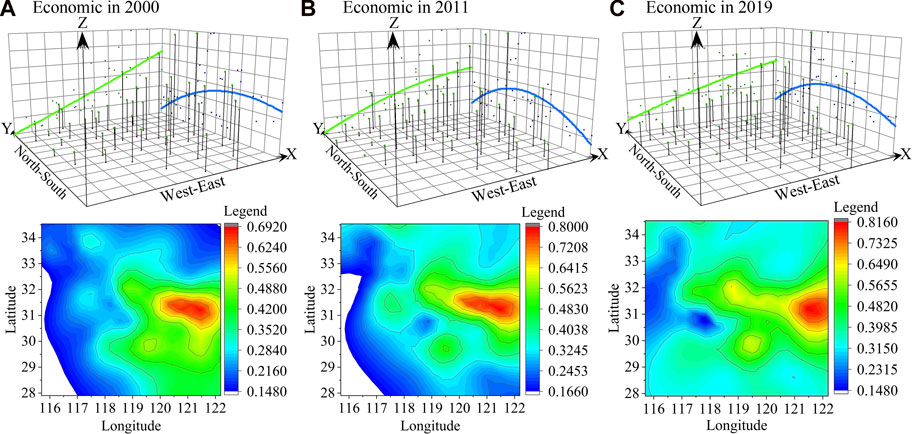
FIGURE 4. Spatial distribution pattern of economic agglomeration index in the YRD from 2000 to 2019.
Using SPSS to explore the correlation between the population-land and economic agglomeration indices by measuring its cross-sectional data for three periods 2000, 2011, and 2019 (Table 4). There is a significant correlation between population-land factors and economic agglomeration, and the Pearson correlation coefficient gradually increases with time. This indicates that the correlation between population, land, and economic agglomeration is constantly increasing, and the correlation between land and economic agglomeration is significantly higher than that of population. Specifically, the Pearson correlation coefficient of each region has increased to different degrees. The correlation coefficients of population and land in the Shanghai metropolitan area increased from 0.518 and 0.555 in 2000 to 0.725 and 0.809 in 2019, respectively. The correlation coefficients of population and land in the core area increased from 0.501 and 0.576 to 0.642 and 0.788, respectively. The correlation coefficients of the overall population and land in the YRD increased from 0.353 and 0.544 to 0.575 and 0.751, respectively. However, except for the correlation coefficient between population and economic agglomeration in the central area increased from 0.522 to 0.606, the correlation between land and economic agglomeration decreased slightly, from 0.781 to 0.753, indicating that the impact of land on economic agglomeration in the central area has been reduced. However, it still plays a significant role compared with the population. In general, with the expansion of the research scope and the change of time, land has a significant promoting effect on economic agglomeration. At the end of the study, forming the overall influence pattern of Shanghai metropolitan area > core area > central area > YRD.
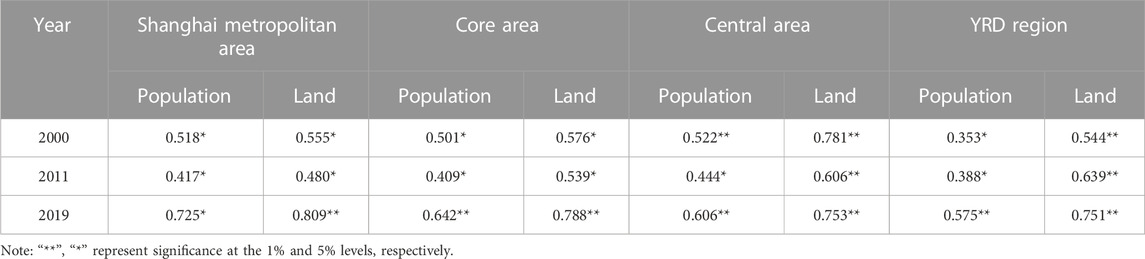
TABLE 4. Pearson correlation analysis of population-land and economic agglomeration in the YRD.
To further measure the difference in the economic agglomeration index from 2000-2011-2019, if the difference is positive, it is a positive effect, indicating that the economic agglomeration index of the city has increased. Otherwise, it is a negative effect. Therefore, combined with the classification of allometric growth types and the evolution of economic agglomeration, dividing the YRD region into four types of cities: “positive-positive,” “positive-negative,” “negative-positive,” and “negative-negative.” In quadrant I, the positive-positive type is the economic agglomeration city with land expansion. In quadrant II, the positive-negative type is the economic diffusion city with land expansion, the negative-positive quadrant III is the economic agglomeration city with population expansion, and in quadrant IV, the negative-negative type refers to the cities with population expansion and economic diffusion. The specific classification basis and categories are as follows (Table 5).
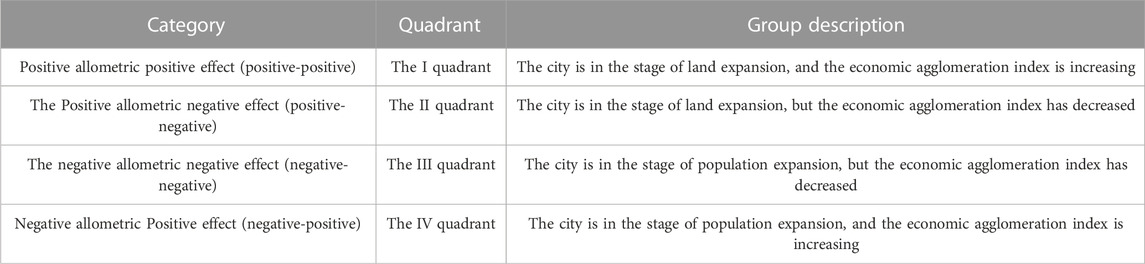
TABLE 5. Grouping category and basis of economic agglomeration effect of allometric growth.
According to the measurement results of the economic agglomeration effect of allometric growth (Figure 5), the cities and directions indicated by the arrows are the evolvement changes of 2012–2019 compared with 2000–2011. From 2000 to 2011, there were 14 positive-positive cities, accounting for 34.1% of all cities, mainly concentrated in the core area of Shanghai, southern Jiangsu, and eastern Anhui. Nine positive-negative cities, accounting for 21.9% of all cities, are concentrated in Zhejiang and Anhui’s northern areas. There were 14 negative-positive cities, mainly concentrated in northern Jiangsu and central Anhui. Only four negative-negative cities, accounting for 9.7% of all cities, are mainly distributed in southern Anhui.
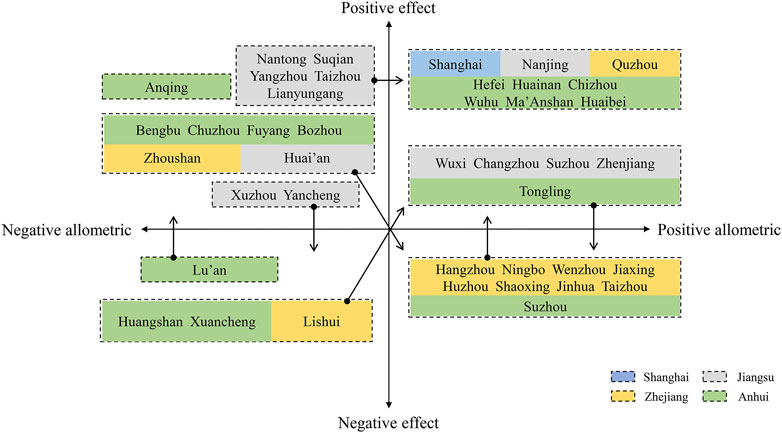
FIGURE 5. Evolution of economic agglomeration effect of allometric growth from 2000 to 2019.
In comparison, most cities experienced leapfrog movements in different quadrants from 2012 to 2019. The number of positive-positive cities increased to 27, mainly in Shanghai, Zhejiang, and eastern Anhui provinces. The number of positive-negative cities increased to 10, mainly distributed in Jiangsu Province. The number of negative-positive cities decreased to 2, namely, Anqing and Lu’an in Anhui Province. The negative-negative cities were also reduced to Xuzhou and Yancheng in Jiangsu province. During the study period, the proportion of cities with the positive effect of allometric growth on economic agglomeration increased to 70.7%, while the proportion of cities with the negative effect decreased to 29.3%. The positive allometric effect of land expansion is dominant, indicating that land expansion significantly promotes economic agglomeration in the YRD.
The land expansion development mode mainly drove the economic agglomeration effect in the YRD from 2000 to 2019. The percentage of cities with positive economic agglomeration effects of allometric growth is 70.7%, which has a significant promoting effect. The allometric growth of the population-land has an essential impact on reconstructing the economic agglomeration pattern in the YRD region. During the study period, the vast majority of cities have leapfrog movements in different quadrants, and only 22% of cities are stable in the stage of positive allometric positive effect. With the expansion of the research scope and scale, the effect of land on economic agglomeration in the YRD showed a pattern of Shanghai metropolitan area > core area > central area > YRD as a whole.
Urban agglomeration is the inevitable outcome of the advanced stage of urbanization. It is vital in promoting coordinated regional development and participating in international cooperation and competition. However, there are still some problems in urban agglomerations in China, such as the uncoordinated development of cities and their factors and low efficiency of resource allocation (Fan et al., 2019; Ji et al., 2020; Lin et al., 2021; Zhang et al., 2022). The study of the economic agglomeration effect of population-land allometric growth found that the current rapid economic development in the YRD is still dominated by land expansion, consistent with the results analyzed by scholars using econometric models (Zhu et al., 2020), and it also shows a time lag in the economic impact of population-land allometric growth between regions. Therefore, the contradiction between population and land is still one of the crucial problems to be solved for a long time. Exploring the strategies for improving the regional economy under the coordinated development model between population and land is essential for future urban development in China. To this end, relevant policy suggestions are put forward from the three levels of the country, region, and city, to continuously alleviate the current incoordination between population and land and promote high-quality agglomeration development of the economy.
First, at the national level, we should steadily promote the new urbanization strategy of “people-oriented.” We are avoiding various risks such as housing shortage, investment distortion, energy tension, and social fragmentation caused by the excessive growth of large cities due to the blind pursuit of rapid urbanization goals of population and land in the short term. Second, at the regional level, optimizing the economic structure and adopting differentiated local industrial development policies is necessary. Strengthen the demand management of urban space growth in different scopes such as the Shanghai metropolitan area, core area, and central area, guide the reasonable layout of industries on a larger spatial scale, effectively improve the overall economic agglomeration effect of regional urban space, and realize the coordinated and orderly development of cities of different scopes. Third, a comprehensive spatial planning system should be constructed at the city level. Intending to build compact cities, we promote the organic integration of urban areas in terms of population industry and land use and increase the population capacity of urban space. At the same time, it is also necessary to strengthen the construction of compact cities or land urbanization and to ensure the sustainability of compact cities through stable policies and urban planning.
The high-quality development of the YRD region provides the theoretical basis and practical experience for driving the sustained economic and social development and prosperity of the Yangtze River Economic Belt and China, as well as the coordinated development and rapid promotion of urbanization in other urban clusters and regions. Based on the study of population-land allometric growth, this paper explores its effect on urban economic agglomeration in depth. However, further exploration is possible in the following places. The first is that the current study measures the data of 41 prefecture-level cities in the YRD region, but if the study data is extended to county-level cities, the allometric growth rate of counties within cities can be portrayed. The effect on economic agglomeration can be more accurately analyzed. Secondly, allometric growth is only studied for population and land. In the future, social and ecological environmental factors can be added to construct the urbanization measurement system to explore the allometric growth characteristics among urbanization subsystems and compare the economic agglomeration differences of allometric growth among different urban agglomerations. Thus, the general law of economic agglomeration effect from the perspective of allometric growth at the level of urban agglomeration is extracted.
This paper takes 41 cities in three provinces and one city in the YRD as the research unit and takes the permanent resident population and built-up area of each city from 2000 to 2019 as the research object to explore the evolution characteristics of the population-land allometric growth. To construct and measure the economic agglomeration index, analyze the economic agglomeration effect of the population-land allometric growth, and draw the following main conclusion.
1) The population and land factor in the YRD shows the transition from negative allometric growth of population expansion to positive allometric growth of land expansion. According to the scale coefficient value, it is divided into six categories, from positive allometric to negative allometric. According to the scale coefficient, the period from 2000 to 2011 is negative allometric growth, and from 2012 to 2019 is positive allometric growth. From the perspective of space, Shanghai metropolitan area gradually transformed into a positive allometric growth I stage of population and land coordination by 2019. The core and central areas gradually transformed into the positive allometric growth II stage with weak land expansion, and the development transition between them had a time lag of about 10 years.
2) The economic agglomeration in the YRD shows a spatial distribution trend of “high in the middle and low in the north and south, high in the east and low in the west.” The regional development gap showed a narrowing trend and gradually spread from point to surface, forming a distribution pattern of “continuous economic high-value agglomeration area” centered on the core area. The spatial dependence of economic agglomeration is strong, but it shows a gradually weakening trend of diffusion development, which reflects the promoting effect of the national strategy of integrated development of the YRD. The degree of spatial clustering of economic agglomeration gradually decreases and tends to spread, reflecting the efficacy of the promotion of the integrated development strategy of the YRD.
3) The economic agglomeration effect of allometric growth is divided into four types: positive allometric positive effect, positive allometric negative effect, negative allometric positive effect, and negative allometric negative effect. The land expansion development mode mainly drove the economic agglomeration effect in the YRD from 2000 to 2019. The percentage of cities with positive economic agglomeration effect is 70.7%, of which 93.1% are positive land expansion types with significant propulsion effects.
4) Population-land allometric growth has important implications for reconstructing economic agglomeration patterns in the YRD region. The majority of cities produced different quadrants of leapfrog movements during the study period, and only 24.4% of cities remained stable, of which 90% are in the stage of positive allometric positive effects. With the research scope and scale expansion, the positive allometric growth of land expansion in the YRD showed the influence pattern of Shanghai metropolitan area > core area > central area > YRD as a whole on economic agglomeration. In the future, we should actively regulate the phenomenon of the mismatch between the growth of the mouth and the expansion of land and promote the intensive evolution of the city to the coordination of population-land to lead to the high-quality development of the regional economy Table 5.
The datasets presented in this study can be found in online repositories. The names of the repository/repositories and accession number(s) can be found below: http://www.stats.gov.cn/tjsj.
All authors listed have made a substantial, direct, and intellectual contribution to the work and approved it for publication.
This work was supported by the National Natural Science Foundation of China (No. 42171200& 52078237).
The authors declare that the research was conducted in the absence of any commercial or financial relationships that could be construed as a potential conflict of interest.
All claims expressed in this article are solely those of the authors and do not necessarily represent those of their affiliated organizations, or those of the publisher, the editors and the reviewers. Any product that may be evaluated in this article, or claim that may be made by its manufacturer, is not guaranteed or endorsed by the publisher.
Adhikari, P., and de Beurs, K. M. (2017). Growth in urban extent and allometric analysis of West African cities. J. land use Sci. 12, 105–124. doi:10.1080/1747423X.2017.1280550
Beckmann, M. J. (1958). City hierarchies and the distribution of city size. Econ. Dev. Cult. Change 6, 243–248. doi:10.1086/449769
Bettencourt, L., and West, G. B. (2010). A unified theory of urban living. Nature 467, 912–913. doi:10.1038/467912a
Chen, J., Fei, Y., Zhu, Y., and Zhang, F. (2018). Allometric relationship between port throughput growth and urban population: A case study of Shanghai port and Shanghai city. Adv. Mech. Eng. 10, 168781401876093. doi:10.1177/1687814018760933
Chen, Y., and Jiang, S. (2009). An analytical process of the spatio-temporal evolution of urban systems based on allometric and fractal ideas. Chaos, Solit. Fractals 39, 49–64. doi:10.1016/j.chaos.2007.01.130
Chen, Y., Jin, J., and Yu, G. (1999). An allometric analysis of henan's urbanization dynamics. J. Xinyang Normal Univ. Nat. Sci. Ed. 19, 321–325. doi:10.3969/j.issn.1003-0972.1999.03.020
Chen, Y. (2017). Multi-scaling allometric analysis for urban and regional development. Phys. A Stat. Mech. its Appl. 465, 673–689. doi:10.1016/j.physa.2016.08.008
Chen, Y. (2004). Doctoral thesis. Beijing, China: Peking University, Study on spatial complexity of fractal urban system.
Chen, Y., and Zhang, L. (2014). An allometric analysis of the scaling relations between population and urban area of xinyang. Prog. Geogr. 33, 1058–1067. doi:10.11820/dlkxjz.2014.08.006
Csb (China Statistical Bureau), (2020). China statistical yearbook. Beijing, China: Chinese Statistics Press.
Deng, S. L. (2021). Exploring the relationship between new-type urbanization and sustainable urban land use: Evidence from prefecture-level cities in China. Sustain. Comput. Inf. Syst. 30, 100446. doi:10.1016/j.suscom.2020.100446
Dong, L., Wang, L., and Li, D. (2012). Analysis of the city of Shandong Province in the last 20 years, the different speed of growth. Urban Probl. 31, 47–51. doi:10.13239/j.bjsshkxy.cswt.2012.08.013
Dutton, G. (1973). Foreword: Size and shape in the growth of human communities. Ekistics 36, 241–243. doi:10.2307/43619309
Fan, Q., Yang, S., and Liu, S. (2019). Asymmetrically spatial effects of urban scale and agglomeration on haze pollution in China. Int. J. Environ. Res. Public Health 16, 4936. doi:10.3390/ijerph16244936
Fang, C. (2021). China’s urban agglomeration and metropolitan area construction under the new development pattern. Econ. Geogr. 41, 1–7. doi:10.15957/j.cnki.jjdl.2021.04.001
Fu, J., Li, G., Zhao, H., and Zhang, J. (2015). Relation between the population and the land area of urban built-up area in China: An empirical research of 652 counties. China Land Sci. 29, 46–53. doi:10.13708/j.cnki.cn11-2640.2015.02.006
Gao, Z., Han, Y., and Zhang, L. (2013). A fractal study on the relationship between urban population size and city GDP: With xinjiang as an example. City Plan. Rev. 37, 37–40.
Gould, S. J. (1966). Allometry and size in ontogeny and phylogeny. Biol. Rev. 41, 587–638. doi:10.1111/j.1469-185x.1966.tb01624.x
Huang, W., and Liu, C. (2022). On the optimal allocation of urban and rural land resources in rapidly urbanizing areas of the Yangtze River Delta, China: A case study of the nanjing jiangbei new area. Land, 11, 1193. doi:10.3390/land11081193
Ji, Y., Guo, X., Zhong, S., and Wu, L. (2020). Land financialization, uncoordinated development of population urbanization and land urbanization, and economic growth: Evidence from China. Land 9, 481. doi:10.3390/land9120481
Jia, Y., Tang, L., Zhang, M., Luo, L., and Zhang, Q. (2022). Exploring the scaling relations between urban spatial form and infrastructure. Int. J. Sustain. Dev. World Ecol. 29, 665–675. doi:10.1080/13504509.2022.2084796
Jin, B. (2018). Study on the “high-quality development” economics. China Ind. Econ. 32, 5–18. doi:10.19581/j.cnki.ciejournal.2018.04.001
Lan, T., Li, Z., and Zhang, H. (2019). Urban allometric scaling beneath structural fractality of road networks. Ann. Am. Assoc. Geogr. 109, 943–957. doi:10.1080/24694452.2018.1492898
Lan, T., Peng, Q., Wang, H., Gong, X., Li, J., and Shi, Z. (2021). Exploring allometric scaling relations between fractal dimensions of metro networks and economic, environmental and social indicators: A case study of 26 cities in China. ISPRS Int. J. Geo-Information 10, 429. doi:10.3390/ijgi10070429
Li, G., and Qi, W. (2019). Impacts of construction land expansion on landscape pattern evolution in China. Acta Geogr. Sin. 74, 2572–2591. doi:10.11821/dlxb201912011
Li, Q., Wang, S., and Mei, L. (2013). The spatial characteristics and mechanism of supermarkets in central district of changchun, China. Sci. Geogr. Sin. 33, 553–561.
Li, W. (2022). Measurement on high-quality development level of regional economy in China: Taking the Yangtze River Delta region as an example. Statistics Decis. 38, 21–25. doi:10.13546/j.cnki.tjyjc.2022.13.004
Li, X., Chen, G., and Xu, X. (2009). Urban allometric growth in China: Theory and facts. Acta Geogr. Sin. 64, 399–407. doi:10.11821/xb200904002
Li, X., Wang, X., Zhang, J., and Wu, L. (2015). Allometric scaling, size distribution and pattern formation of natural cities. Humanit. Soc. Sci. Commun. 1, 15017. doi:10.1057/palcomms.2015.17
Lin, J., Wu, K., Yang, S., and Liu, Q. (2021). The asymmetric pattern of population mobility during the spring festival in the Yangtze River Delta based on complex network analysis: An empirical analysis of “tencent migration” big data. ISPRS Int. J. Geo-Inf. 10, 582. doi:10.3390/ijgi10090582
Liu, J., and Chen, Y. (2005). An allometric analysis of the Shandong urban system using ideas from fractals. Sci. Geogr. Sin. 25, 135–141. doi:10.3969/j.issn.1000-0690.2005.02.002
Liu, Y., Wang, R., Xue, D., and Zeng, J. (2019). The spatial pattern and determinants of skilled laborers and less skilled laborers in China: Evidence from 2000 and 2010 censuses. Geogr. Res. 38, 1949–1964.
Long, Y., Chen, Y., and Yanguang, C. (2019). Multi-scaling allometric analysis of the Beijing-Tianjin-Hebei urban system based on nighttime light data. Prog. Geogr. 38, 88–100. doi:10.18306/dlkxjz.2019.01.008
Lu, D., and Chen, M. (2015). Several viewpoints on the background of compiling the "national new urbanization planning (2014-2020). Acta Geogr. Sin. 70, 179–185. doi:10.11821/dlxb201502001
Lu, X., Ke, N., Kuang, B., and Han, J. (2019). Spatial-temporal features and influencing factors of difference in land urbanization level of central China. Econ. Geogr. 39, 192–198. doi:10.15957/j.cnki.jjdl.2019.04.023
Ma, Y., Zhang, J., and Wang, L. (2018). City-size distribution and allometric growth in Xinjiang based on fractal theory. Arid. Land Geogr. 41, 661–667. doi:10.13826/j.cnki.cn65-1103/x.2018.03.026
Marshall, J. D. (2007). Urban land area and population growth: A new scaling relationship for metropolitan expansion. Urban Stud. 44, 1889–1904. doi:10.1080/00420980701471943
Naroll, R. S., and Bertalanffy, L. V. (1973). The principle of allometry in biology and social sciences. Ekistics 36, 244–252. doi:10.2307/43619310
Ou, X., Ye, L., Zhang, X., and Lu, H. (2012). The comparison of intercounty economic development inequality and polarization in Jiangsu province. Econ. Geogr. 32, 24–29. doi:10.15957/j.cnki.jjdl.2012.07.005
Shi, B., and Ren, B. (2018). A measurement of China’s provincial economic high-quality development. Econ. Problems 40, 1–6. doi:10.16011/j.cnki.jjwt.2018.04.001
Sun, Z., Yuan, Y., Wang, Y., and Zhang, X. (2011). Research on city-size distribution and allometric growth in Jiangsu Province based on fractal theory. Geogr. Res. 30, 2163–2172.
Wang, Q., and Jin, C. (2018). Quantitative measurement of economic development imbalance among urban agglomerations in China. J. Quantitative Technol. Econ. 35, 77–94. doi:10.13653/j.cnki.jqte
Wang, X., Gao, P., Song, C., Chen, X., and Wang, C. (2021). Decoupling analysis between urban land expansion and economic growth at the different scale: A case study of Shandong province in China. Econ. Geogr. 41, 91–104. doi:10.15957/j.cnki.jjdl.2021.03.010
West, G. B., Woodruff, W. H., and Brown, J. H. (2002). Allometric scaling of metabolic rate from molecules and mitochondria to cells and mammals. PNAS 99, 2473–2478. doi:10.1073/pnas.012579799
Xu, F., Gu, J., and Liu, B. (2018). Study on the development phase of urbanization in hunan province based on allometric analysis of urban and rural population. J. Urban Stud. 39, 24–29.
Xu, Y., and Jia, W. (2005). The measurement and evaluation of regional economic development disparities in China recent 20 years. Econ. Geogr. 25, 600–603. doi:10.15957/j.cnki.Jjdl.2005.05.002
Xue, D., and Zeng, X. (2016). Evaluation of China's urbanization quality and analysis of its spatial pattern transformation based on the modern life index. Acta Geogr. Sin. 71, 194–204. doi:10.11821/dlxb201602002
Yang, X., Lu, X., and Shen, W. (2020). Spatial spillover effect of land element input on urban economic growth in China. Econ. Geogr. 40, 83–90. doi:10.15957/j.cnki.jjdl.2020.10.010
Yin, S., and Yang, S. (2021). The characteristics and driving mechanism of allometric growth of urban population and green space area in the Yangtze River Delta region. Geogr. Res. 40, 2780–2795. doi:10.11821/dlyj020201111
You, H., Wu, S., Wu, X., Guo, X., and Song, Y. (2021). The underlying influencing factors of farmland transfer in urbanizing China: Implications for sustainable land use goals. Environ. Dev. Sustain. 23, 8722–8745. doi:10.1007/s10668-020-00990-w
Zhang, X., Wang, J., Song, W., Wang, F., Gao, X., Liu, L., et al. (2022). Decoupling analysis between rural population change and rural construction land changes in China. Land 11, 231. doi:10.3390/land11020231
Zhao, L., Fang, C., and Ding, Y. (2014). The comparison of intercountry economic development inequality and polarization in Zhejiang province. Econ. Geogr. 34, 36–43. doi:10.15957/j.cnki.jjdl.2014.07.036
Zhu, J., and Ou, X. (2020). Research on the allometric growth and coordinated development of population land urbanization in Jiangsu. Territ. Nat. Resour. Study 42, 37–42. doi:10.3969/j.issn.1003-7853.2020.02.010
Zhu, J., Xu, J., Li, X., Lou, F., and Chen, Y. (2020). Impact of land urbanization and population urbanization on economic growth in China. Sci. Geogr. Sin. 40, 1654–1662. doi:10.13249/j.cnki.sgs.2020.10.009
Keywords: urban population, built-up area, allometric growth, agglomeration effect, spatial and temporal patterns, Yangtze River Delta (YRD) region
Citation: Zhu Y, Yang S, Lin J and Cai A (2023) Pattern and effect of economic agglomeration in the Yangtze River Delta region based on population-land allometric growth. Front. Earth Sci. 11:1112423. doi: 10.3389/feart.2023.1112423
Received: 30 November 2022; Accepted: 06 March 2023;
Published: 16 March 2023.
Edited by:
Fei Lun, China Agricultural University, ChinaReviewed by:
Zhen Xie, Fujian Agriculture And Forestry University, ChinaCopyright © 2023 Zhu, Yang, Lin and Cai. This is an open-access article distributed under the terms of the Creative Commons Attribution License (CC BY). The use, distribution or reproduction in other forums is permitted, provided the original author(s) and the copyright owner(s) are credited and that the original publication in this journal is cited, in accordance with accepted academic practice. No use, distribution or reproduction is permitted which does not comply with these terms.
*Correspondence: Shan Yang, eWFuZ3NoYW5AbmpudS5lZHUuY24=
Disclaimer: All claims expressed in this article are solely those of the authors and do not necessarily represent those of their affiliated organizations, or those of the publisher, the editors and the reviewers. Any product that may be evaluated in this article or claim that may be made by its manufacturer is not guaranteed or endorsed by the publisher.
Research integrity at Frontiers
Learn more about the work of our research integrity team to safeguard the quality of each article we publish.