 Hsiao-Chun Tseng
 Yokie Tai Yuh Han1†
 Gwo-Ching Gong
- 1Institute of Marine Environment and Ecology, National Taiwan Ocean University, Keelung, Taiwan
- 2Center of Excellence for the Oceans, National Taiwan Ocean University, Keelung, Taiwan
The first investigations of seasonal N2O variations and water-to-air fluxes in the Tamsui River estuary and its adjacent sea were carried out in this study. In the Tamsui River estuary, the concentration of N2O decreased with increasing salinity. The seasonal variations of N2O concentrations in the estuary were 46.8–148.5 nM in autumn, 15.9–82.5 nM in spring, 11.0–42.0 nM in summer and 13.1–120.6 nM in winter. When salinity regressed to zero, N2O concentration was highest in autumn, followed by winter, spring, and summer, which might be influenced by the DO and NO3− concentrations as well as temperature. Because of mountains occlusion, the seasonal variations in wind speed were not large in the Tamsui River estuary. Seasonal variations of N2O fluxes in the estuary were 10.9–35.6 μmol m−2 d−1 in autumn, 2.8–15.1 μmol m−2 d−1 in spring, 2.4–9.5 μmol m−2 d−1 in summer and 2.7–26.8 μmol m−2 d−1 in winter. In the adjacent sea of Tamsui River estuary, seasonal average N2O concentrations in the surface seawater were 10.3 ± 0.2 nM in autumn, 11.6 ± 1.2 nM in spring, 11.4 ± 0.7 nM in summer and 13.8 ± 0.9 nM in winter, with no significantly seasonal changes while wind speed varied greatly seasonally. Seasonal variations of average N2O fluxes in Tamsui River estuary’s adjacent sea were 40.3 ± 0.7 μmol m−2 d−1 in autumn, 19.7 ± 2.1 μmol m−2 d−1 in spring, 20.9 ± 1.3 μmol m−2 d−1 in summer and 49.0 ± 3.3 μmol m−2 d−1 in winter. As a result, seasonal variations in N2O fluxes in the estuary were dominated by N2O concentrations in the water, whereas in the sea, it was dominated by wind speed. Overall, the Tamsui River estuary and its adjacent sea were net sources of atmospheric N2O with annual average fluxes 10.6 ± 6.7 and 32.5 ± 14.5 μmol m−2 d−1, respectively.
1 Introduction
Nitrous oxide (N2O), one of the most important greenhouse gases in the world, has a global warming potential approximately 300 times that of carbon dioxide (IPCC, 2013). It has also become the most important ozone-depleting substance since the restriction of chlorofluorocarbon (CFC) enforced by the Montreal Protocol (Ravishankara et al., 2009). Observational data noted that atmospheric N2O concentration has risen from 270 ppb in the year 1750 (pre-industrial level) to 332 ppb in 2019 (IPCC, 2021). Human activities have enhanced atmospheric N2O concentrations by approximately 23% compared to pre-industrial levels, and the growth rate has been higher in recent years (IPCC, 2021).
According to the Intergovernmental Panel on Climate Change (IPCC) Fifth Assessment Report (AR5), N2O is emitted from both anthropogenic and natural sources. Natural sources of N2O include microbial processes in land and ocean. The total flux of natural sources was about 11 TgN yr−1 and the ocean contributed about 30% of N2O (3.8 TgN yr−1) to the atmosphere (IPCC, 2013). In recent decades, emissions from natural sources have not changed much, but emissions resulting from anthropogenic activities have grown by 30% over the past three decades (Tian et al., 2020). Anthropogenic sources of N2O fluxes were about 6.9 TgN yr−1, which includes agriculture, rivers, estuaries, human excreta, fossil fuels and industry, biomass and biofuel burning, and atmospheric deposition on land and ocean. Rivers and estuaries are potentially substantial global sources of N2O (Seitzinger and Kroeze, 1998). As N2O emissions from estuaries and oceans could be significant and should not be disregarded, obtaining high-resolution data on these emissions is crucial to refine the calculation of nitrogen budget.
Urbanization around rivers and estuaries will increase the emissions of N2O (Reading et al., 2020). In addition, land-use changes not only affect water column N2O emissions but also have a considerable influence on benthic N2O production, and increasing land-use intensity could accelerate N2O emissions to the atmosphere (Chen et al., 2022). The Tamsui River is an urban river highly affected by anthropogenic activities. Here, we provide the first dataset of N2O studies in the Tamsui River estuary and its adjacent sea area.
2 Materials and methods
2.1 Study area
The Tamsui River is located in the northern part of Taiwan and is formed by the three tributaries of the Dahan, Xindian and Keelung Rivers. It has a total length of 159 km and a catchment area of approximately 2,726 km2. The regional climate is subtropical. The temperature in this region varies between 10°C and 35°C and annual precipitation ranges between 1500 and 2,500 mm (Wen et al., 2008). From November to April is the dry season with the average rainfall over past 25 years (1995–2020) 776 ± 269 mm, and from May to October is the wet season with the average rainfall over past 25 years (1995–2020) 1322 ± 440 mm (Central Weather Bureau: https://www.cwb.gov.tw/eng/). There were 7.13 million people, were about 30% population of Taiwan living in the Tamsui River catchment, and the regional population density can reach as high as 38,607 people per km2 (Tseng et al., 2021). In the past 10 years, pollution sources have been controlled, and the water quality of the river basin has improved remarkably (Tseng et al., 2021). However, Tamsui River is still polluted by both raw sewage and industrial pollution. According to the Tamsui River monitoring data in 2019, it was approximately 8.3% slightly polluted, 15.9% moderately polluted and 2.6% severely polluted (TEPA, 2021). Long-term observation is needed to maintain good conditions of the Tamsui River, the Tamsui River estuary, and its adjacent sea area.
2.2 Field sampling
In the Tamsui River estuary, surface water samples were collected at seven sampling stations in a small fishing boat using a plastic bucket with rope, in the same sampling month as its adjacent sea, in November 2019 May 2020, August 2020, and January 2021. Temperature data were measured onboard using a thermometer, whereas salinity values were determined by measuring conductivity using an AUTOSAL salinometer (8400B, Guildline Instruments Ltd., Canada) in the laboratory.
In the Tamsui River estuary adjacent sea area (Figure 1), four seasonal research cruises were conducted onboard R/V Ocean Researcher 2 and R/V New Ocean Researcher 2: OR2-2390 (November 2019), NOR2-0004 (May 2020), NOR2-0009 (August 2020), and NOR2-0027 (January 2021). Surface water samples were collected at 16 sampling stations in autumn (November 2019) and 20 sampling stations in spring (May 2020) and summer (August 2020). In winter (January 2021), because of adverse weather conditions, surface water samples were only taken at 10 sampling stations. Water samples were collected using a carousel water sampler (SBE32, Seabird Scientific, United States) fitted with 20 L Teflon-coated Go-Flo bottles (General Oceanic, United States) mounted on a conductivity–temperature–depth instrument (CTD; SBE 9/11 plus, Seabird Scientific, United States) assembly. Temperature and salinity data were obtained from CTD profiles.
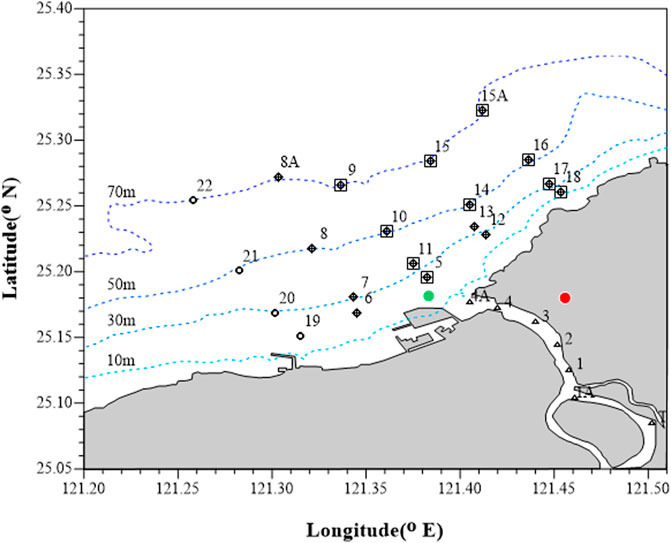
FIGURE 1. Study area and station locations. +: OR2-2390 (November 2019, Autumn); ○: NOR2-0004 (May 2020, Spring) and NOR2-0009 (August 2020, Summer); □: NOR2-0027 (January 2021, Winter). Δ: Stations in Tamsui River estuary. Green dot: Wind speed station of Institute of Harbor and Marine Technology (IHMT). Red dot: Tamsui Weather Station of Central Weather Bureau (CWB).
Water samples for nutrients analysis were filtered and placed in 100 mL polypropylene bottles and immediately frozen with liquid nitrogen. Water samples that were used to measure N2O concentrations were collected in 120 mL dark borosilicate serum bottles. The bottles were rinsed thrice using sampled water. After two-fold of the bottle was allowed to overflow, 0.2 mL saturated HgCl2 was then added. The sample bottles were immediately sealed with a butyl rubber stopper and an aluminum cap. The samples were stored in a dark box at 4°C. All water samples were transferred to the laboratory and analyzed within 3 months of collection.
2.3 Chemical analysis
Dissolved oxygen (DO) was measured using spectrophotometry (Pai et al., 1993) with a precision of approximately ±0.32% at the 190 μmol L−1 level. Nitrate (NO3−) and nitrite (NO2−) concentrations were measured by the pink azo dye method (Strickland and Parsons, 1972) using a flow injection analyzer and an online Cd coil. NO2− concentration was also determined by the pink azo dye method (Strickland and Parsons, 1972; Pai et al., 1990b) using a flow injection analyzer. The precisions of NO3− and NO2− were ±0.3 and ±0.02 μmol L−1, respectively. Phosphate (PO43−) was determined under the molybdenum blue method (Murphy and Riley, 1962; Pai et al., 1990a) using a flow injection analyzer. The precision of the measurements was approximately ±0.01 μmol L−1. NH4+ was measured using an improved indophenol blue method (Pai et al., 2001) with a precision of approximately 1% at the 5 μmol L−1 level.
N2O measurements were performed using the headspace technique (Weiss, 1981) and gas chromatography (GC; Agilent 7890) with an electron capture detector (ECD). The GC-ECD had a 3.6 m long stainless-steel column with a diameter of 3.2 mm, which was filled with 80/100 mesh Porapak Q. The temperature of ECD was set as 300°C and was calibrated with pure N2 (Yeong Her, Taiwan) and three commercial gas mixtures with N2O mixing ratios of 1.00 ppmv (MESA Specialty Gas, United States), 4.78 ppmv (Yeong Her, Taiwan) and 9.90 ppmv (Yeong Her, Taiwan). The reproducibility of measurements was ±3% for N2O.
2.4 N2O saturation ratio and fluxes
The saturation (R, %) and sea-to-air flux (F, μmol·m−2·d−1) of N2O were calculated using the following formula:
F (μmol·m−2·d−1) =k (Cobs–Ceq)
where Cobs is the observed concentration of N2O dissolved in water and Ceq is the expected equilibrium water N2O concentration. The expected equilibrium water concentration was calculated using the solubility equation of Weiss and Price (1980) together with the in situ temperature, salinity, and molar fraction of N2O in the air. Atmospheric N2O concentrations were obtained using the NOAA/ESRL in situ program (http://www.esrl.noaa.gov/gmd). The monthly average atmospheric N2O concentrations at Mauna (Hawaii, United States station) were 331.6, 334.0, 334.1, and 334.3 ppb in November 2019 May 2020, August 2020, and January 2021, respectively. The gas exchange coefficient k was calculated using the equation established by Wanninkhof (2014), where Sc is the Schmidt number of N2O and u represents the wind speed.
Monthly average wind speed data for calculating fluxes of N2O in the Tamsui River estuary were provided by the Central Weather Bureau: https://e-service.cwb.gov.tw/HistoryDataQuery/index.jsp and for the Tamsui River’s adjacent sea were obtained from the Institute of Harbor and Marine Technology: https://isohe.ihmt.gov.tw/docklands/reportR.aspx.
3 Results
Seasonal hydrographic and nutrient data, as well as N2O concentrations, were measured in the Tamsui River estuary and its adjacent sea. Detailed information on seasonal sampling in the Tamsui River estuary and its adjacent sea as well as the range of hydrographic data, nutrients, and N2O concentrations in the surface water are listed in Table 1.
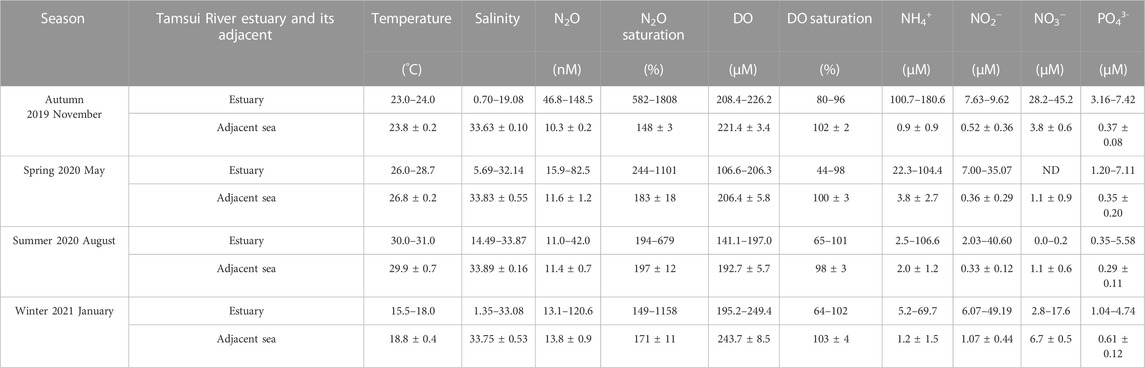
TABLE 1. Seasonal hydrographic data, nutrients and N2O concentrations in the surface water of both Tamsui River estuary and its adjacent sea.
3.1 Aquatic environmental conditions and N2O concentrations in autumn
In autumn, the surface temperature ranged between 23.0°C and 24.0°C in the Tamsui River estuary, and it was similar with the average surface temperature, 23.8°C ± 0.2°C (Table 1), in the adjacent sea (Figure 2A). The surface water salinity gradually increased from the estuary to the coast (Figure 2B). The range of surface salinity were between 0.70 and 19.08 in the Tamsui River estuary and it increased to the average of 33.63 ± 0.10 (Table 1) in the adjacent sea. The surface DO saturation was between 80% and 96% (Table 1) in the Tamsui River estuary and it increased from estuary to the coast (Figure 2C). The average DO saturation was 102% ± 2% (Table 1) in the adjacent sea. In the estuary, NO3−, NH4+, and PO43− concentrations ranged from 28.2 to 45.2 μM, 100.7–180.6 μM, and 3.16–7.42 μM (Table 1), respectively. The highest NO3−, NH4+, and PO43− concentrations were observed in the river tributaries and then gradually decreased in the estuary and adjacent sea (Figures 2D–F). The average concentrations of NO3−, NH4+, and PO43− in the surface water of the Tamsui River adjacent sea were 3.8 ± 0.6 μM, 0.9 ± 0.9 μM, and 0.37 ± 0.08 μM (Table 1), respectively. In the Tamsui River estuary, dissolved N2O concentrations, and saturations ranged from 46.8 to 148.5 nM and 582%–1808% (Table 1), respectively. The highest N2O concentration was in the confluence of river tributaries, where the highest NO3− concentration was observed, which then decreased from the estuary to the coast (Figure 2G). In the Tamsui River adjacent sea, dissolved N2O concentration in the surface water was distributed evenly and the average concentration was 10.3 ± 0.2 nM (Table 1). N2O was supersaturated in the Tamsui River estuary and then decreased from the estuary to the coast owing to physical mixing (Figure 2H). In the Tamsui River adjacent sea, N2O was slightly oversaturated, with average saturation 148% (Table 1).
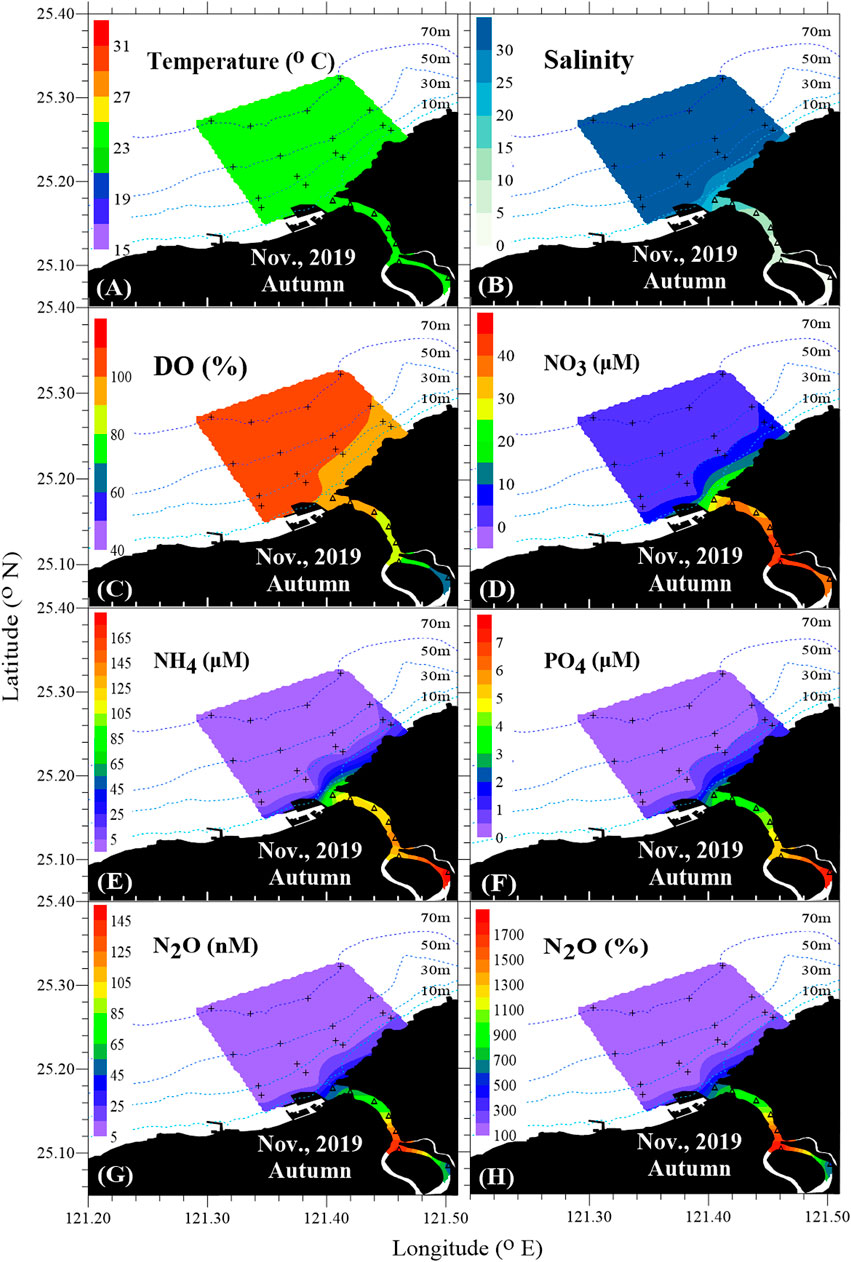
FIGURE 2. Horizontal distributions of the surface water in the Tamsui River estuary and its adjacent sea during autumn, including (A) Temperature, (B) Salinity, (C) DO%, (D) NO3−, (E) NH4+, (F) PO43-, (G) N2O, (H) N2O%.
3.2 Aquatic environmental conditions and N2O concentrations in spring
In spring, the range of surface temperature were between 26.0°C and 28.7°C in the Tamsui River estuary, and it was slightly higher than its adjacent sea (Figure 3A), with average surface temperature 26.8°C ± 0.2°C (Table 1). The surface water salinity gradually increased from the estuary to the coast (Figure 3B). The range of surface salinity was between 5.69 and 32.14 in the Tamsui River estuary and it increased to an average of 33.83 ± 0.55 (Table 1) in its adjacent sea. The surface DO saturation was between 44% and 98% (Table 1) in the Tamsui River estuary and it increased from estuary to the coast (Figure 3C). The average DO saturation was 100% ± 3% (Table 1) in the adjacent sea. Concentrations of NO3− were considered low in both the estuary and its adjacent sea (Figure 3D) and in the estuary were below the detection limit (Table 1). In the estuary, NH4+ and PO43− concentrations ranged from 22.3 to 104.4 μM and 1.20–7.11 μM (Table 1), respectively. The highest NH4+ and PO43− concentrations were observed in the river tributaries and then gradually decreased in the estuary and adjacent sea (Figures 3E,F). The average concentrations of NO3−, NH4+, and PO43− in the Tamsui River adjacent sea were 1.1 ± 0.9 μM, 3.8 ± 2.7 μM, and 0.35 ± 0.20 μM (Table 1), respectively. In the Tamsui River estuary, dissolved N2O concentrations and saturations ranged from 15.9 to 82.5 nM and 244%–1101% (Table1), respectively. Dissolved N2O concentration in the surface water decreased from estuary to the adjacent sea (Figure 3G) and the average dissolved N2O concentration in the adjacent sea was 11.6 ± 1.2 nM (Table 1). N2O was supersaturated in the Tamsui River estuary and decreased from the estuary to the coast (Figure 3H). In the Tamsui River adjacent sea, N2O was oversaturated, with average saturation 183% ± 18% (Table 1).
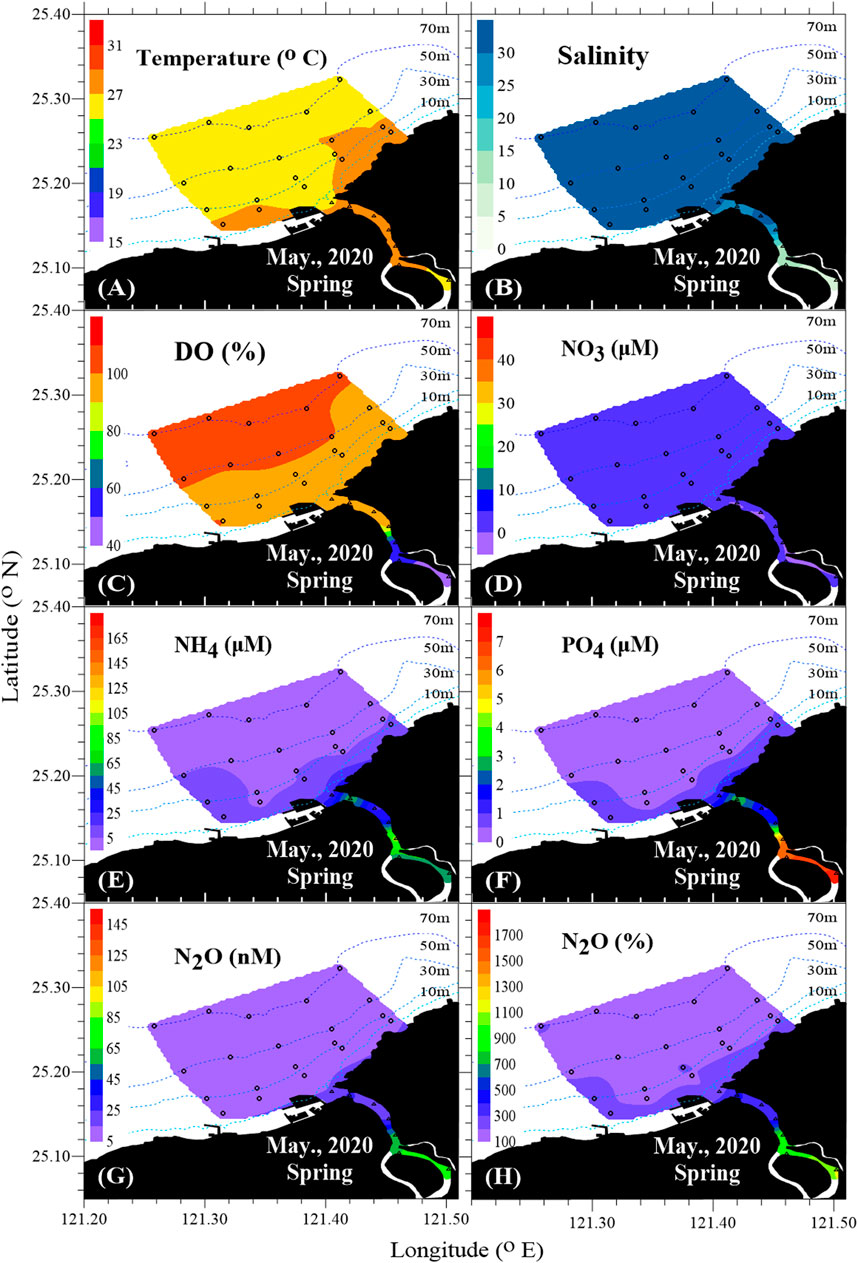
FIGURE 3. Horizontal distributions of the surface water in the Tamsui River estuary and its adjacent sea during spring, including (A) Temperature, (B) Salinity, (C) DO%, (D) NO3−, (E) NH4+, (F) PO43-, (G) N2O, (H) N2O%.
3.3 Aquatic environmental conditions and N2O concentrations in summer
In summer, the range of surface temperature was between 30.0°C and 31.0°C in the Tamsui River estuary, which was similar to the average surface temperature of 29.9°C ± 0.7°C in the adjacent sea (Figure 4A). The surface water salinity gradually increased from the estuary to the coast (Figure 4B). The range of surface salinity was between 14.49 and 33.87 in the Tamsui River estuary and it increased to an average of 33.89 ± 0.16 (Table 1) in the adjacent sea. The surface DO saturation was between 65% and 101% (Table 1) in the Tamsui River estuary and it increased from estuary to the coast (Figure 4C). The average DO saturation was 98% ± 3% (Table 1) in the adjacent sea. In the estuary, NO3−, NH4+, and PO43− concentrations ranged from 0.0 to 0.2 μM, 2.5–106.6 μM, and 0.35–5.58 μM (Table 1), respectively. The concentrations of NO3− were low throughout the estuary and adjacent sea (Figure 4D). The highest NH4+ and PO43− concentrations were observed in the river tributaries and then gradually decreased in the estuary and adjacent sea (Figures 4E,F). The average concentrations of NO3−, NH4+, and PO43− in the Tamsui River adjacent sea were 1.1 ± 0.6 μM, 2.0 ± 1.2 μM, and 0.29 ± 0.11 μM (Table 1), respectively. In the Tamsui River estuary, dissolved N2O concentrations and saturations were ranged from 11.0 to 42.0 nM and 194% to 679% (Table1). N2O decreased from estuary to the coastal area due to physical mixing (Figure 4H). In the Tamsui River adjacent sea, dissolved average surface N2O concentration was 11.4 ± 0.7 nM and saturation was 197% ± 12% (Table 1).
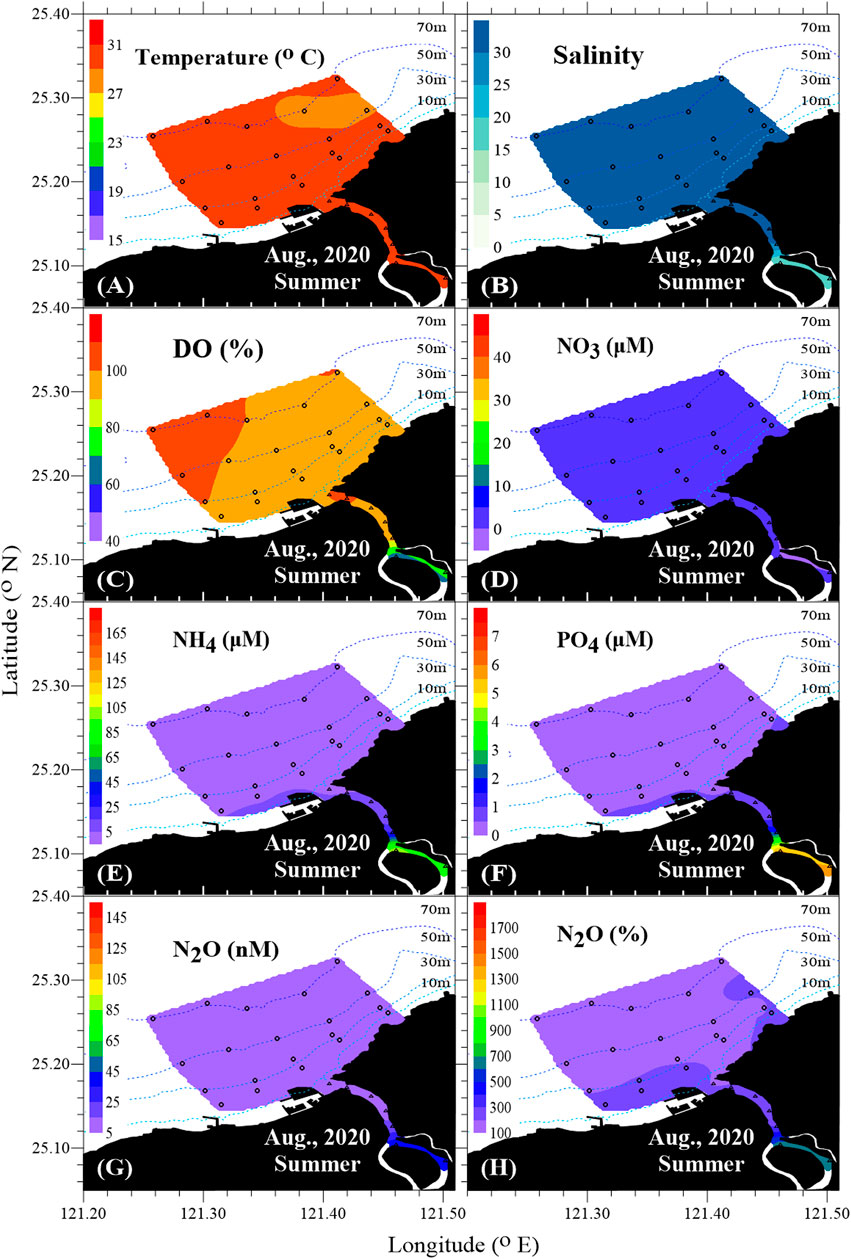
FIGURE 4. Horizontal distributions of the surface water in the Tamsui River estuary and its adjacent sea during summer, including (A) Temperature, (B) Salinity, (C) DO%, (D) NO3−, (E) NH4+, (F) PO43-, (G) N2O, (H) N2O%.
3.4 Aquatic environmental conditions and nitrous oxide concentrations in winter
In winter, owing to adverse weather conditions, only 10 stations were sampled. The surface temperature ranged between 15.5°C and 18.0°C in the Tamsui River estuary was slightly lower than the average surface temperature, 18.8°C ± 0.4°C, in the adjacent sea (Figure 5A). The surface salinity ranged between 1.35 and 33.08 in the Tamsui River estuary and the average surface salinity was 33.75 ± 0.53 (Table 1) in the adjacent sea. The surface DO saturation was between 64% and 102% (Table 1) in Tamsui River estuary and it increased from the estuary to the coast (Figure 5C). The average DO saturation was 103% ± 4% (Table 1) in the adjacent sea. In the estuary, NO3−, NH4+, and PO43− concentrations ranged from 2.8 to 17.6 μM, 5.2–69.7 μM, and 1.04–4.74 μM (Table 1), respectively. The highest NO3−, NH4+, and PO43− concentrations were observed in the river tributaries and then gradually decreased in the estuary and adjacent sea (Figures 5D–F). The average surface concentrations of NO3−, NH4+, and PO43− in the Tamsui River adjacent sea were 6.7 ± 0.5 μM, 1.2 ± 1.5 μM, and 0.61 ± 0.12 μM (Table 1), respectively. In the Tamsui River estuary, dissolved N2O concentrations and saturations were ranged from 13.1 to 120.6 nM and 149% to 1158% (Table 1), respectively. The highest N2O concentration was observed in the upper estuary (Figure 5G). In the Tamsui River adjacent sea, higher dissolved N2O concentration occurred at northern site and the average concentration was 13.8 ± 0.9 nM (Table 1). N2O was supersaturated in the Tamsui River estuary and decreased from the estuary to the coast (Figure 5H). In the Tamsui River adjacent sea, N2O was oversaturated, with average saturation 171% ± 11% (Table 1).
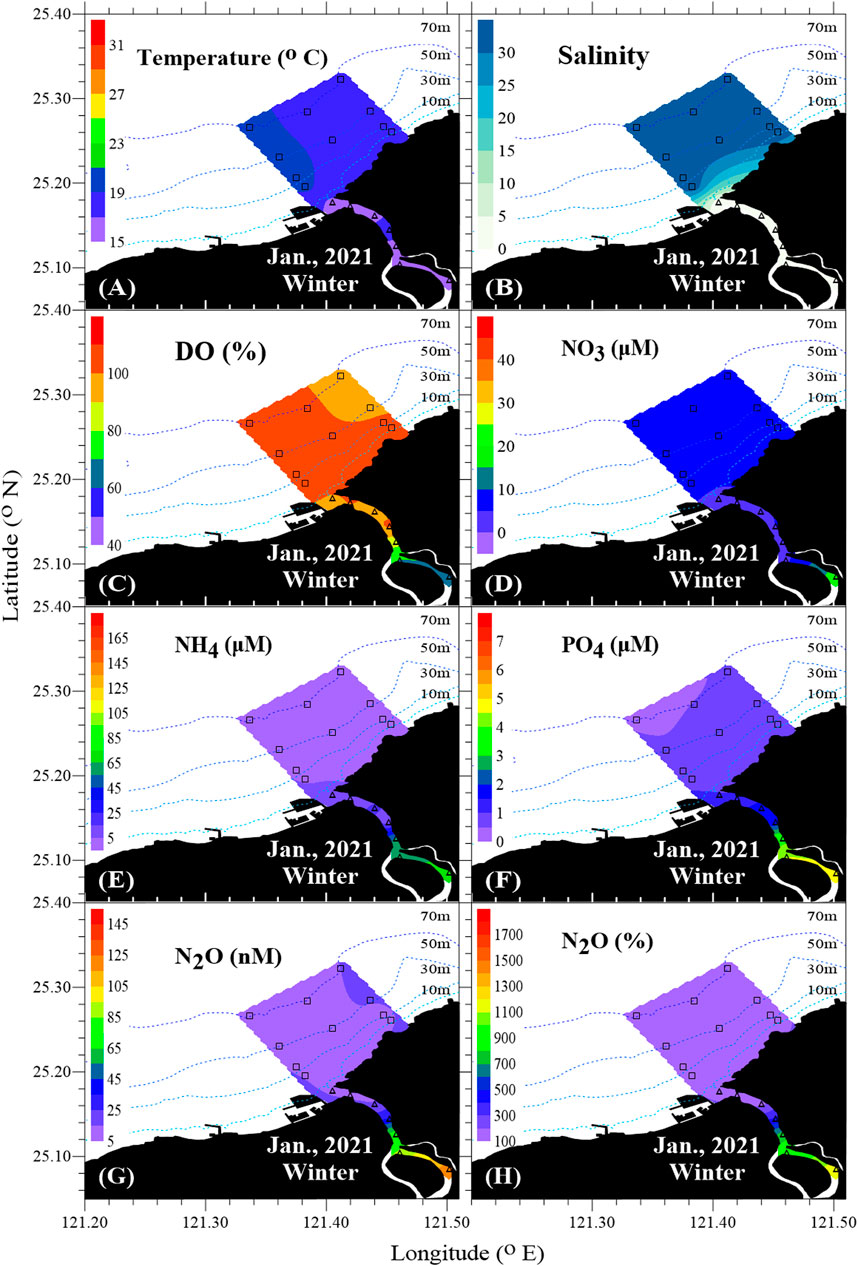
FIGURE 5. Horizontal distributions of the surface water in the Tamsui River estuary and its adjacent sea during winter, including (A) Temperature, (B) Salinity, (C) DO%, (D) NO3−, (E) NH4+, (F) PO43-, (G) N2O, (H) N2O%.
4 Discussion
4.1 Seasonal changes of water conditions in the Tamsui River estuary and its adjacent sea
The surface water temperature in the Tasmsui River estuary was highest in summer (30.0°C–31.0°C), followed by spring (26.0°C–28.7°C) and autumn (23.0°C–24.0°C), and lowest in winter (15.5°C–18.0°C; Table 1). The surface temperature in Tamsui River estuary’s adjacent sea during four seasons, in descending order, was summer (29.9°C ± 0.7°C), spring (26.8°C ± 0.2°C), autumn (23.8°C ± 0.2°C), and winter (18.8°C ± 0.4°C; Table 1). Seasonal changes in surface temperature were in both the estuary and adjacent sea. In estuaries, salinity typically represents tidal effects. As salinity in the estuary and its adjacent sea were mainly influenced by the physical mixing of freshwater and seawater, seasonal changes could not be distinguished here. DO concentrations were influenced by physical mixing, salinity, temperature, and biological status. DO concentration in the estuary was highest in winter (195.2–249.4 μM), followed by autumn (208.4–226.2 μM), summer (141.1–197.0 μM), and spring (106.6–206.3 μM; Table 1). DO saturations exclude the effects of temperature and salinity on gas solubility. It only represents biological conditions and physical mixing. DO saturation in the estuary were similar in autumn (80%–96%), summer (65%–101%), and winter (64%–102%), but lowest in spring (44%–98%; Table 1). In the Tamsui River estuary’s adjacent sea, seasonal differences were found in DO concentrations but DO saturations, which reflect the influences of salinity and temperature on DO concentrations.
4.2 Seasonal variations of nutrients and N2O concentrations in the Tamsui River’s adjacent sea
Average surface concentration of NO2− was the highest in winter (1.07 ± 0.44 μM), followed by autumn (0.52 ± 0.36 μM), spring (0.36 ± 0.29 μM) and summer (0.33 ± 0.12 μM). Average surface concentration of NO3− was the highest in winter (6.7 ± 0.5 μM) followed by autumn (3.8 ± 0.6 μM), spring (1.1 ± 0.9 μM) and summer (1.1 ± 0.6 μM). Seasonal changes in the average surface concentration of PO43− showed the same trend as that of NO3−. It was the highest in winter (0.61 ± 0.12 μM), followed by autumn (0.37 ± 0.08 μM), spring (0.35 ± 0.20 μM) and summer (0.29 ± 0.11 μM). As the wind was stronger in winter and autumn than in spring and summer (Table 2), vertical mixing would be more intense in winter and autumn than in spring and summer. Vertical mixing resulted in high concentrations of nutrients from the bottom to the surface water; therefore, the average nutrient concentrations in the surface water were higher in winter and autumn than in spring and summer. Surface average N2O concentrations in four seasons were 13.8 ± 0.9 nM in winter, 11.6 ± 1.2 nM in spring, 11.4 ± 0.7 nM in summer, and 10.3 ± 0.2 in autumn. The dissolved N2O concentrations in the adjacent sea showed non-significant seasonal variation (Table 1).
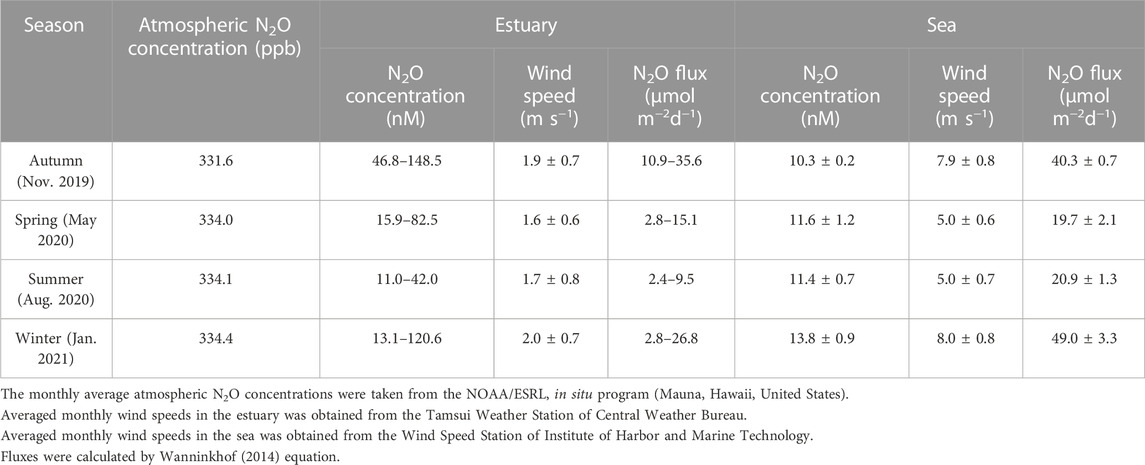
TABLE 2. Seasonal N2O concentrations, wind speed, N2O fluxes in surface water of both Tamsui River estuary and its adjacent sea.
4.3 Seasonal variations of nutrients and N2O concentrations in the Tamsui River estuary
In the estuary, the nutrient distribution was strongly influenced by tides. As salinity represents the tidal effect in the Tamsui River estuary, seasonal changes in nutrients should consider both concentration and salinity. The N2O concentrations followed a descending trend from low to high salinity (Figure 6A). A strong correlation observed in every season indicated that the N2O concentration in this area was highly influenced by physical mixing. When salinity regressed to zero, N2O concentration was highest in autumn, followed by winter, spring, and summer (Figure 6A). Hence, without physical mixing, there were seasonal changes in N2O concentrations in the Tamsui River estuary.
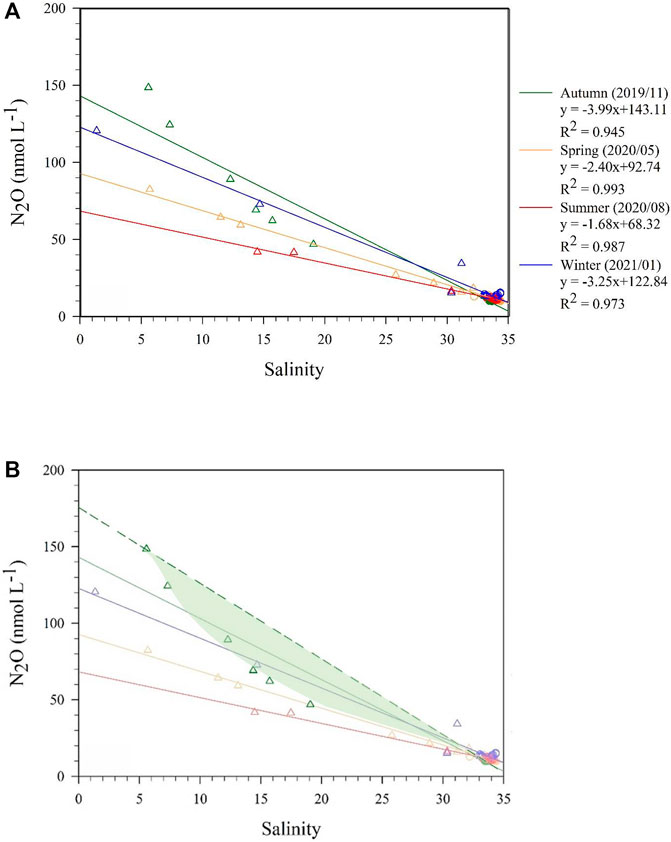
FIGURE 6. (A) Four seasonal surface N2O concentration versus salinity from Tamsui River estuary to adjacent sea. (B) In autumn, the shaded area showed N2O concentrations might be removed during transportation. (○: data from the adjacent sea, Δ: data from Tamsui River estuary).
During autumn and winter, DO and NO3− concentrations were comparative high among the four seasons. Turner et al. (2016) indicated that NO3− is the dominant control on N2O concentrations but that other environmental variables may limit NO3− processing. Many studies have shown that NO3− is a parameter that can be used to predict N2O production (Baulch et al., 2011; Turner et al., 2016), which might be able to explain why N2O concentrations were higher in autumn and winter when salinity regressed to zero (Figure 6A). Furthermore, the positive correlation between N2O and NO3− during autumn and winter (Figure 7) suggests that the production of N2O could be attributed to nitrification. (Tseng et al., 2016). A concave downward curve was found in the figure of N2O concentration versus salinity (Figure 6B). This implied that partial riverine N2O concentrations were removed during transporting to the estuary. In October and November 2019, it was particularly dry compared to other months of sampling in the study, according to the precipitation data from the Central Weather Bureau. As there was a long period of low precipitation before sampling, the water level was low, and the aquatic N2O concentrations were presumably hugely influenced by the sediment in the Tamsui River estuary. According to Chen et al. (2022), benthic habitats could be a net N2O sink in the estuary, we assume that the reduction of N2O concentrations in the water column was influenced by the sediment, however, more research should be done to clarify our hypothesis. The shaded area in Figure 6B shows that the reduction of N2O concentrations in the water column might be remove by the benthic sediments.
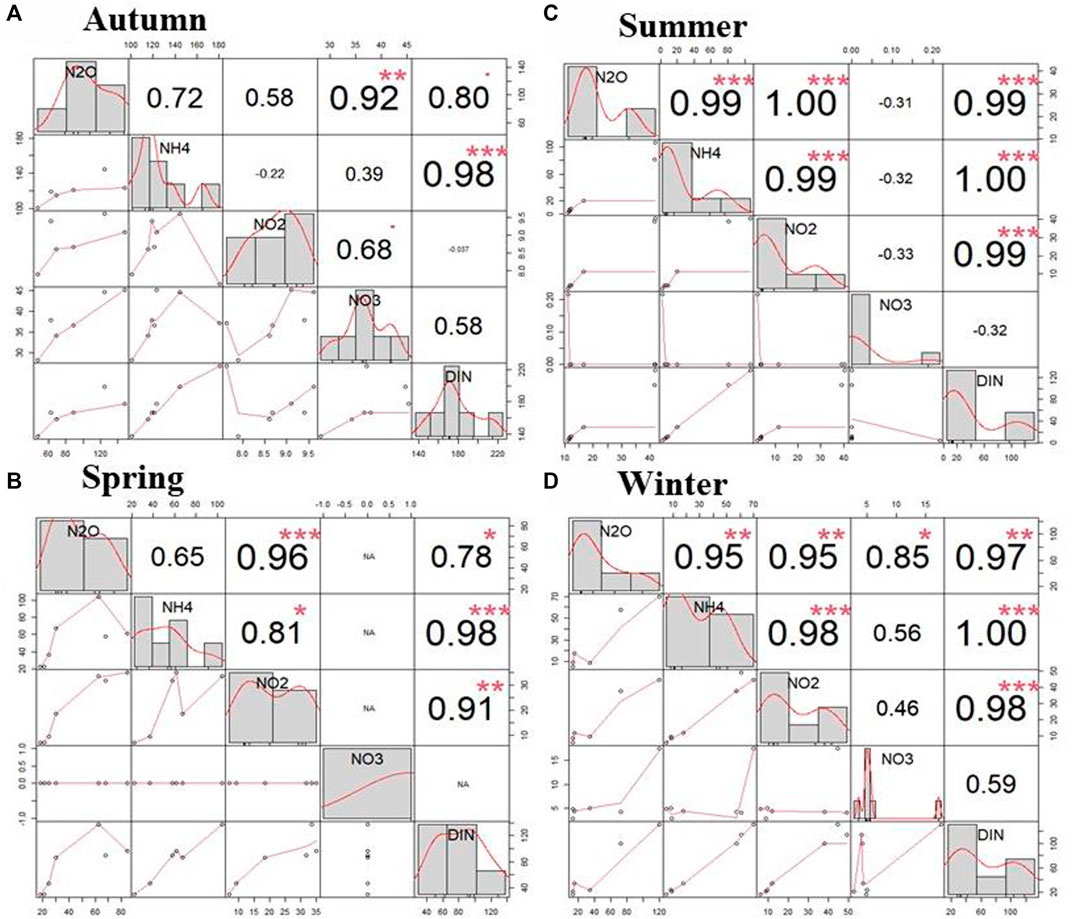
FIGURE 7. The Pearson correlations between N2O, NH4+, NO2−, NO3− and DIN in (A) autumn (B) spring (C) summer (D) winter. Diagonal shows the distribution of the variable. The upper triangle of the matrix shows correlation values (r values) and *, **, *** indicate statistical significance (p-values) at p< 0.05, p<0.01, p<0.001. The lower triangle of the matrix shows the scatter distribution of variables.
During spring and summer, in the salinity range of 5.69 and 33.87, the concentrations of NO3− were extremely low, while NO2− and NH4+ concentrations were comparably high. Zhang et al. (2020) indicated that NO3− and NH4+ concentrations were the most important explanatory variables of spatio-temporal variations of N2O concentration. In spring, NH4+ occupied approximately 73% of the DIN proportion with average DO concentration about 160.4 ± 41.9 μM (Figure 8). In summer, NH4+ occupied approximately 64% of the DIN proportion with average DO concentration about 178.2 ± 22.8 μM (Figure 8). N2O reduction has traditionally been considered active only under extremely low oxygen concentrations or in anoxic environments (Miller et al., 1986; Naqvi et al., 2000; Dalsgaard et al., 2014; Babbin et al., 2015). However, recent studies have found that N2O reduction may occur in oxygenated waters (Wyman et al., 2013; Raes et al., 2016; Sun et al., 2017; Rees et al., 2021; Sun et al., 2021; Tang et al., 2022). Based on the findings of Tang et al. (2022), it appears that reducing the DO concentration can trigger N2O reduction, and the rates of N2O reduction were observed to vary with the DO concentration levels. Despite the fact that the highest N2O reduction rates were observed when DO was depleted (DO concentrations were close to 0 μM), N2O reduction still occurred even when DO concentration was as high as 215 μM (Tang et al., 2022). Tang et al. (2022) also made the point that the steep gradient of oxygen and its dynamic changes in estuaries can expose microbes to varying oxygen conditions, promoting the survival and growth of N2O-reducing microbes that are adapted to different oxygen levels or tolerant of a range of oxygen levels. This implies that even though DO is never fully depleted, denitrification can still take place. According to Xiang et al. (2022), a warm environment is more conducive to denitrification. This could explain why, out of all seasons, N2O concentrations tend to be lower in summer and spring due to the warm temperatures that favor this loss pathway.
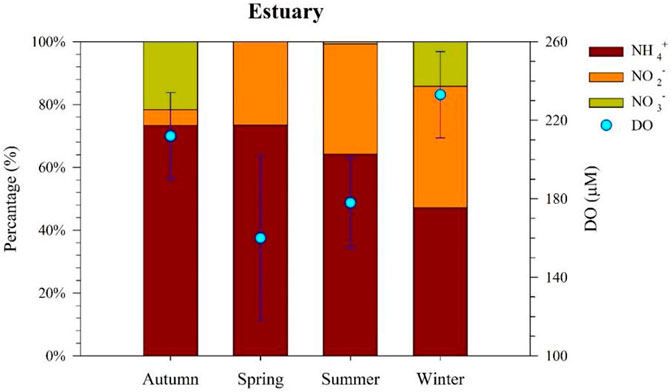
FIGURE 8. Seasonal variation of dissolved inorganic nitrogen (DIN) proportion (%) and DO (µM) in Tamsui River estuary. (*DIN = NO2− + NO3− + NH4+).
4.4 N2O fluxes in the Tamsui River estuary and its adjacent sea
Two important factors that might affect sea-to-air N2O fluxes are wind speed and dissolved N2O concentrations. In this study, monthly average wind speeds in Tamsui and Taipei Harbor were used to calculate sea-to-air N2O fluxes in the Tamsui River estuary and its adjacent sea, respectively. In both the Tamsui River estuary and its adjacent sea, wind speeds were higher in autumn and winter than in spring and summer (Table 2). Although sea-to-air N2O fluxes showed similar seasonal variation in both the Tamsui River estuary and its adjacent sea, the main factors that influenced sea-to-air N2O fluxes were different. We observe a greater seasonal variation of wind speed in adjacent sea (5.0–8.0 m/s) than in the estuary (1.6–2.0 m/s). Because of the occlusion of mountains, the seasonal wind speed varied less in the Tamsui River estuary than in the adjacent sea. In contrast, dissolved N2O concentrations showed greater seasonal variations in the Tamsui River estuary than in the adjacent sea. This implies that seasonal variations in N2O fluxes in the estuary were dominated by N2O concentrations in the water, whereas in the sea, it was dominated by wind speed. Overall, the Tamsui River estuary and its adjacent sea were net sources of atmospheric N2O with annual average fluxes 10.6 ± 6.7 and 32.5 ± 14.5 μmol m−2 d−1, respectively.
The area of the Tamsui River estuary (Figure 1) is about 10.3 km2. Assuming the highest seasonal N2O flux, the Tamsui River estuary would have emitted approximately 0.08 × 10⁶ mol of N2O into the atmosphere annually. The Tamsui River is shallow with an average annual flow rate of 6,968 × 106 m3 (Wang et al., 2014). According to the Hydrological Year Book of Taiwan (2021), 64% of water flow occurred between May and October (data between 1949–2021). The concentration of N2O in the estuary varied seasonally and was impacted by physical mixing with seawater. To estimate the N2O concentrations at a salinity of 0 for each season, we utilized a graph that depicts the concentration of N2O as a function of salinity. By factoring in the seasonal riverine N2O concentrations and river flow rates, we computed an annual advective transport of N2O of approximately 0.71 × 10⁶ mol. As a result, the annual advective transport of N2O to the sea was about 9 times more than the vertical transport of N2O to the atmosphere in the Tamsui River estuary. This implies that by reducing N2O loading in the river, we can not only minimize N2O emissions within the river and estuary, but also decrease the amount of residual riverine N2O that is transported to the sea, where it can escape into the atmosphere.
4.5 N2O concentrations and water-to-air fluxes in world estuaries and their adjacent sea
N2O showed higher concentrations upstream of the river or at tributary interchange site. In addition, urban rivers showed higher N2O fluxes than rural rivers, providing evidence that anthropogenic activities have increased emissions of N2O (Murray et al., 2020; Reading et al., 2020; Reading, 2022). According to previous research (Murray et al., 2020; Reading et al., 2020; Reading, 2022), N2O saturations varied over a range of 77.7%–677.7% and N2O fluxes varied over a range of −2.8–120.9 μmol m−2 d−1 in Australia’s rivers and estuaries. For rivers and estuaries near European country, N2O fluxes ranged between −3.2–130.0 μmol m−2 d−1 (Amouroux et al., 2002; Sánchez-Rodríguez et al., 2022). In India, studies on N2O fluxes are often discussed with regards to the effect of the southwest monsoon. In the Mandovi estuary, N2O fluxes were highest during the southwest monsoon (June to September) with a range of 1.94–176.75 μmol m−2 d−1. This shows that wind speed is a strong factor affecting fluxes of N2O (Manjrekar et al., 2020). N2O fluxes from rivers and estuaries in Asia ranged between 0.1 and 733 μmol m−2 d−1. The N2O fluxes from the Pearl River were the highest (Lin et al., 2016) among the studies considered in this research. Compared with other rivers and estuaries, N2O fluxes in the Tamsui River estuary were slightly higher than those of most estuaries (Table 3), especially those rivers and estuaries in Australia that remain undeveloped. N2O fluxes in the Tamsui River estuary (2.8–44.6 μmol m−2 d−1) were higher than those of most rural rivers, but lower than those of some urban rivers or rivers that are affected by the monsoon. Observed N2O saturations in Tamsui River estuary (149%–1808%) were higher than the mean value 602% for the global estuaries (Bange et al., 1996). Anthropogenic activities in the Tamsui River estuary increased N2O concentrations in the water and emissions from water to the atmosphere. As Tamsui River estuary is surrounding by mountains and high buildings, it blocks the wind to the estuary. Although the N2O concentrations were high in the Tamsui River estuary, the advective transport of N2O to the sea was much higher than the vertical transport of N2O to the atmosphere.
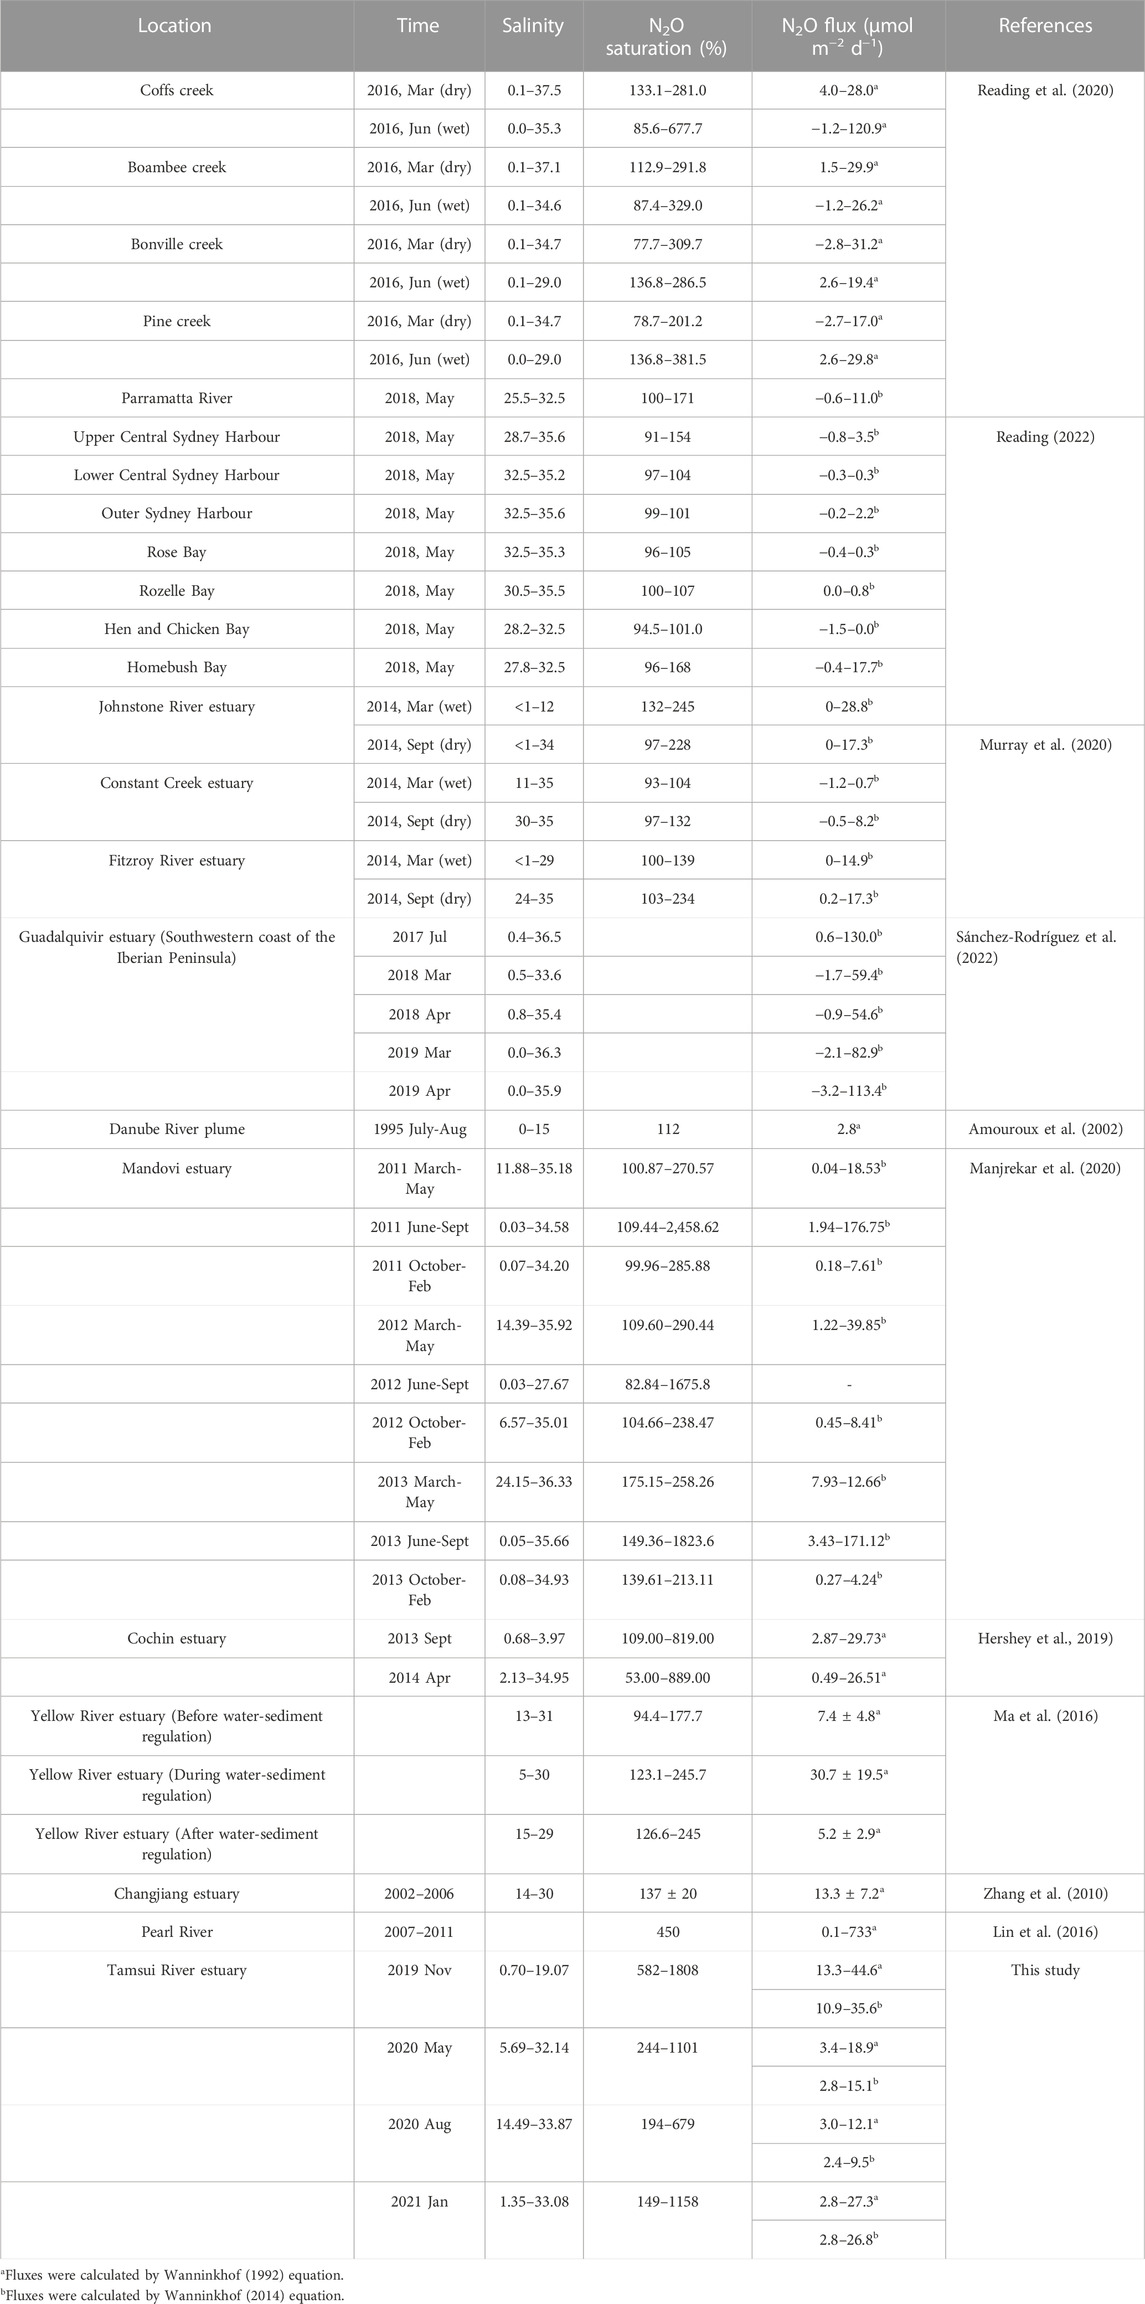
TABLE 3. N2O fluxes in rivers and estuaries.
Table 4 shows N2O fluxes from marine and coastal area. The lowest average N2O fluxes was −1.0 ± 1.2 μmol m−2 d−1 at eastern shelf of the Gulf of Cadiz and the highest average N2O fluxes was 25.4 ± 11.3 μmol m−2 d−1 at north-eastern shelf of the Gulf of Cadiz (Ferrón et al., 2010; Sierra et al., 2017). At Eastern shelf of the Gulf of Cadiz, the highest concentration of N2O was found at the shallower stations, indicating coastal input and benthic remineralization that are sources of N2O in coastal area (Sierra et al., 2017). Studies in Great Barrier Reef showed that it is a sink for atmospheric N2O with the flux of −0.2 ± 0.1 μmol m−2 d−1 (Reading, 2022). The West Philippines Sea is also a sink of N2O with an average N2O flux −1.7 ± 3.9 μmol m−2 d−1 (Tseng et al., 2016). N2O fluxes from Chinese coastal waters were sources to atmosphere. N2O high fluxes were observed in Jiaozhou Bay which usually average at 50.5 ± 27.4 μmol m−2 d−1 at its eastern coast (Zhang et al., 2006). N2O concentrations and fluxes of the Tamsui River estuary’s adjacent sea were higher than most of the marine and coastal areas. Anthropogenic activities in the urban estuary, coupled with the terrain geography of the basin, may be the underlying cause of this issue. The blocked wind movement in the basin has resulted in the majority of N2O being transferred to the sea, rather than the atmosphere. Overall, N2O saturations from our study (148% ± 3% to 197% ± 12%) were higher than the mean value 109% for the global coastal waters (Bange et al., 1996).
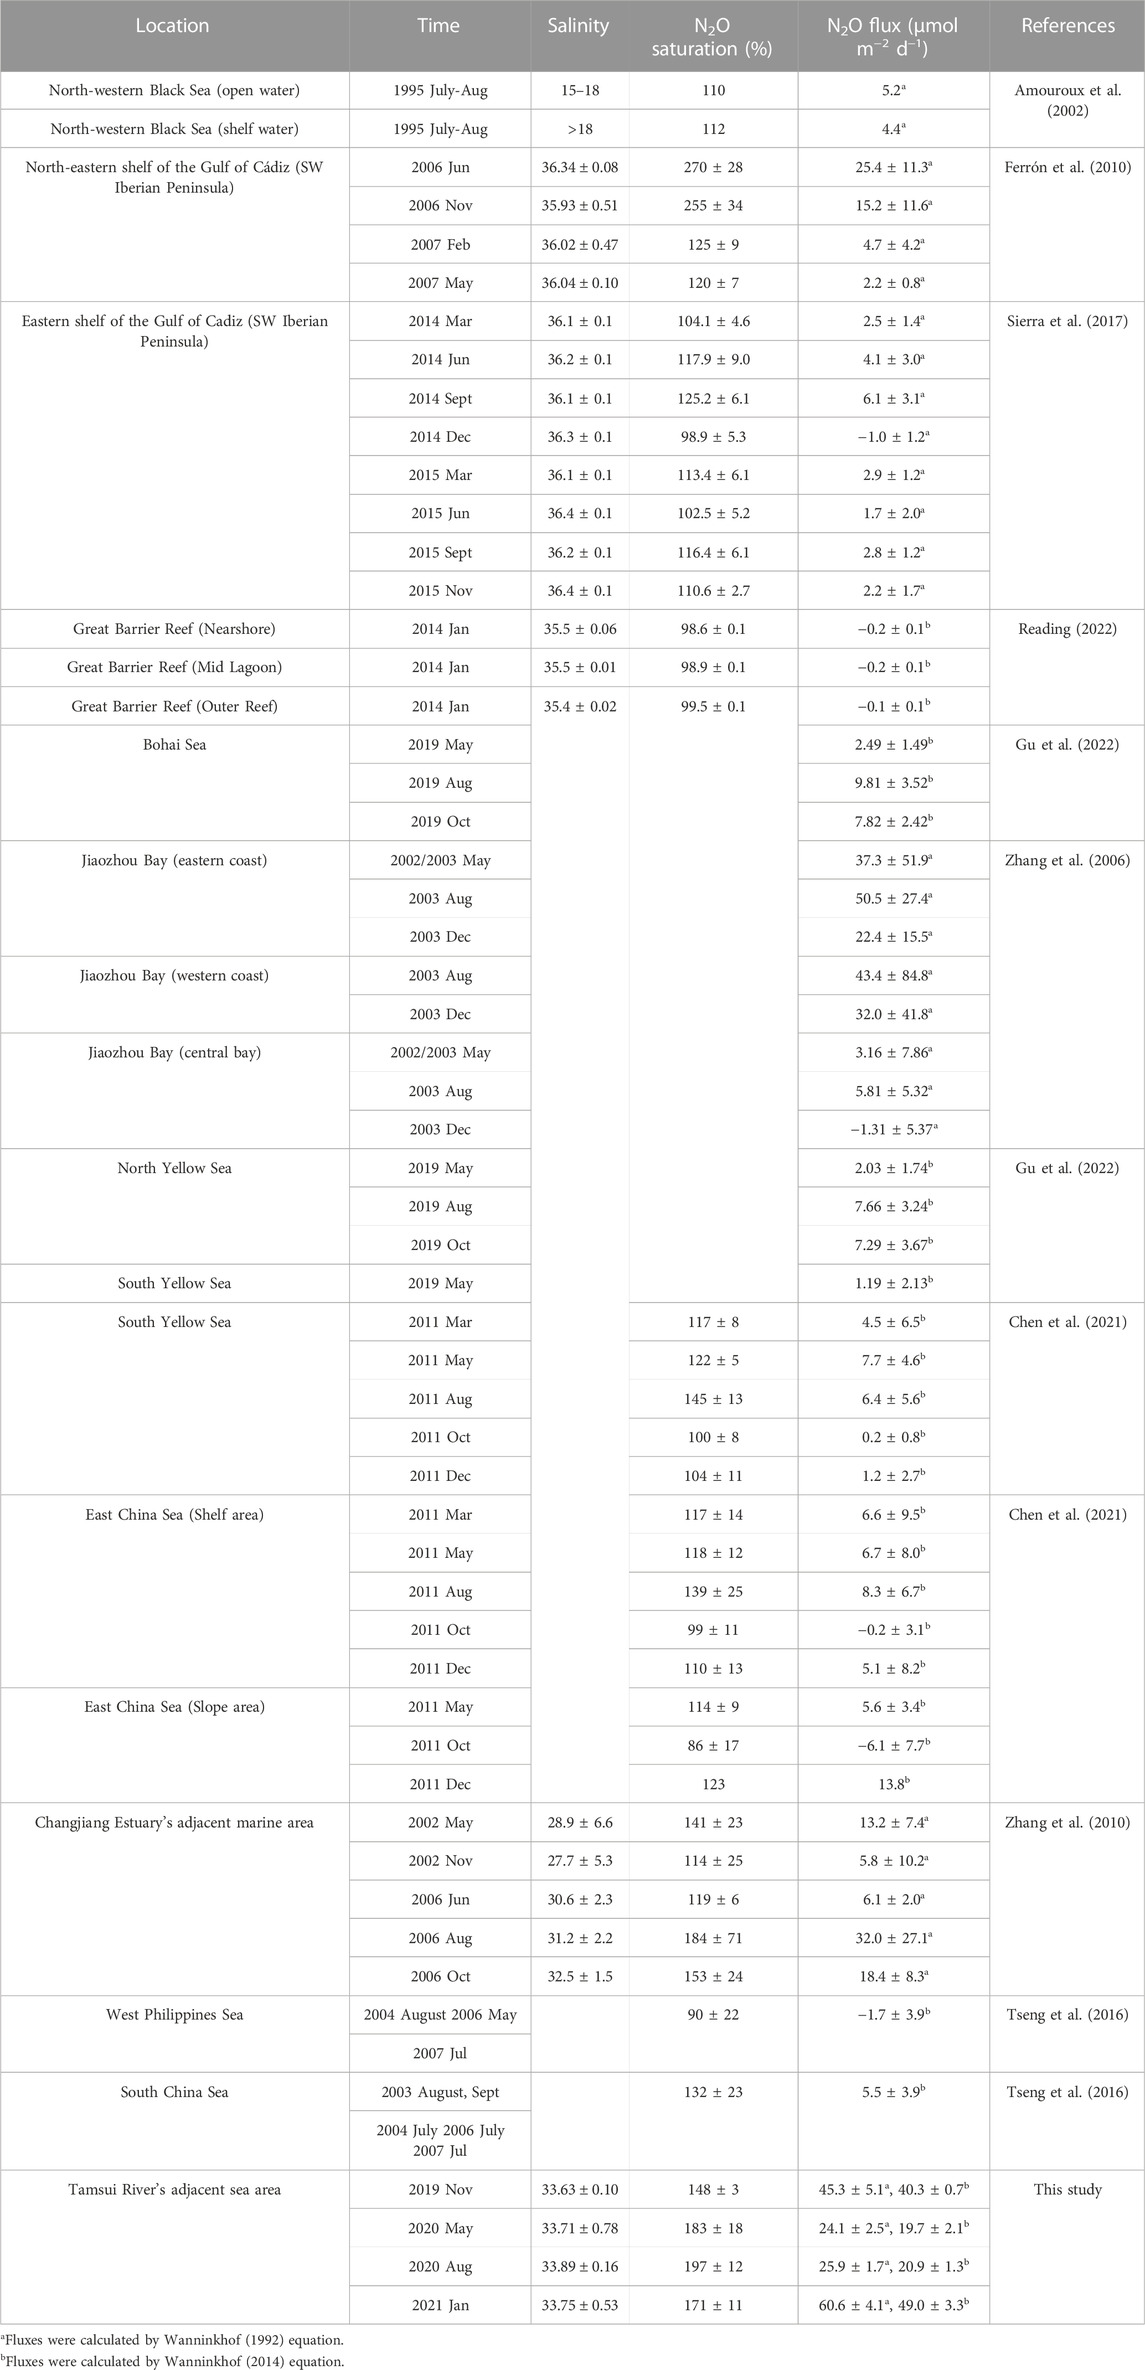
TABLE 4. N2O fluxes in marine and coastal areas.
5 Conclusion
A descending trend in N2O concentrations was observed in four seasons from the Tamsui River estuary to its adjacent sea, mainly due to physical mixing. During autumn and winter, higher DO and NO3− concentrations might result in higher N2O concentrations. In addition, there was a concave downward curve in the relationship between N2O concentration and salinity, which implied that partial N2O concentrations in the water column were removed during transportation. In spring and summer, lower DO and higher water temperatures might be more suitable for denitrification microbes, which results in lower N2O concentrations compared to those in autumn and winter. N2O concentrations showed greater seasonal variations in the Tamsui River estuary than in the adjacent sea. However, wind speeds varied less seasonally in the Tamsui River estuary than in the adjacent sea. As a result, seasonal variations in N2O fluxes in the estuary were dominated by N2O concentrations in the water, whereas in the sea, it was dominated by wind speed. Overall, the Tamsui River estuary and its adjacent sea were net sources of atmospheric N2O with annual average fluxes 10.6 ± 6.7 and 32.5 ± 14.5 μmol m−2 d−1, respectively.
Data availability statement
The datasets presented in this study can be found in online repositories. The names of the repository/repositories and accession number(s) can be found in the article/Supplementary material.
Author contributions
H-CT developed the idea of the study. H-CT leaded the research cruises and did the sampling. C-CL, YTYH and G-CG analyzed the samples and data. H-CT and YTYH wrote the first draft of the article and all authors contributed equally to the interpretation of the results and in writing the final manuscript.
Funding
This research was supported by the Ministry of Science and Technology of the ROC, Taiwan (MOST 108-2611-M-019-021-MY3).
Acknowledgments
The authors wish to thank the Ministry of Science and Technology of the ROC, Taiwan for supporting this research, and the captain and crews of Ocean Researcher 2 and New Ocean Researcher 2 for their assistance. We thank three reviewers for their constructive and detailed comments to strengthen the manuscript.
Conflict of interest
The authors declare that the research was conducted in the absence of any commercial or financial relationships that could be construed as a potential conflict of interest.
Publisher’s note
All claims expressed in this article are solely those of the authors and do not necessarily represent those of their affiliated organizations, or those of the publisher, the editors and the reviewers. Any product that may be evaluated in this article, or claim that may be made by its manufacturer, is not guaranteed or endorsed by the publisher.
References
Amouroux, D., Roberts, G., Rapsomanikis, S., and Andreae, M. O. (2002). Biogenic gas (CH4, N2O, DMS) emission to the atmosphere from near-shore and shelf waters of the north-Western black sea. Estuar. Coast. Shelf Sci. 54, 575–587. doi:10.1006/ecss.2000.0666
Babbin, A. R., Bianchi, D., Jayakumar, A., and Ward, B. B. (2015). Rapid nitrous oxide cycling in the suboxic ocean. Science 348, 1127–1129. doi:10.1126/science.aaa8380
Bange, H. W., Rapsomanikis, S., and Andreae, M. O. (1996). Nitrous oxide in coastal waters. Glob. Biogeochem. Cycles 10, 197–207. doi:10.1029/95gb03834
Baulch, H. M., Schiff, S. L., Maranger, R., and Dillon, P. J. (2011). Nitrogen enrichment and the emission of nitrous oxide from streams. Glob. Biogeochem. Cycles 25, n/a. doi:10.1029/2011gb004047
Chen, J. J., Wells, N. S., Erler, D. V., and Eyre, B. D. (2022). Land-use intensity increases benthic N2O emissions across three sub-tropical estuaries. J. Geophys. Res. Biogeosciences 127. doi:10.1029/2022jg006899
Chen, X., Ma, X., Gu, X., Liu, S., Song, G., Jin, H., et al. (2021). Seasonal and spatial variations of N2O distribution and emission in the east China sea and south yellow sea. Sci. Total Environ. 775, 145715. doi:10.1016/j.scitotenv.2021.145715
Dalsgaard, T., Stewart, F. J., Thamdrup, B., De Brabandere, L., Revsbech, N. P., Ulloa, O., et al. (2014). Oxygen at nanomolar levels reversibly suppresses process rates and gene expression in anammox and denitrification in the oxygen minimum zone off northern Chile. mBio 5, e01966. doi:10.1128/mbio.01966-14
Ferrón, S., Ortega, T., and Forja, J. M. (2010). Nitrous oxide distribution in the north-eastern shelf of the Gulf of Cádiz (SW Iberian Peninsula). Mar. Chem. 119, 22–32. doi:10.1016/j.marchem.2009.12.003
Gu, T., Jia, D., Wang, Z., Guo, Y., Xin, Y., Guo, C., et al. (2022). Regional distribution and environmental regulation mechanism of nitrous oxide in the Bohai sea and north yellow sea: A preliminary study. Sci. Total Environ. 818, 151718. doi:10.1016/j.scitotenv.2021.151718
Hydrological Year Book of Taiwan (2021). Water resources agency, ministry of economic affairs, June 2022, 1078. Taipei, Taiwan.
IPCC (2013). Carbon and other biogeochemical cycles. In Contribution of Working Group I to the Fifth Assessment Report of the Intergovernmental Panel on Climate Change. Editors T. F. Stocker, D. Qin, G.-K. Plattner, M. Tignor, S. K. Allen, J. Boschunget al. (Cambridge, United Kingdom and New York, NY, USA: Cambridge University Press).
IPCC (2021). Changing state of the climate system. In Climate change 2021: The physical science basis. Contribution of working group I to the sixth assessment Report of the intergovernmental Panel on climate change, V. masson-delmotte, P. Zhai, A. Pirani, S. L. Connors, C. Péan, S. Berger, N. Caudet al. (Cambridge, United Kingdom and New York, NY, USA: Cambridge University Press). 287–422.
Lin, H., Dai, M., Kao, S.-J., Wang, L., Roberts, E., Yang, J.-Y. T., et al. (2016). Spatiotemporal variability of nitrous oxide in a large eutrophic estuarine system: The Pearl River Estuary, China. Mar. Chem. 182, 14–24. doi:10.1016/j.marchem.2016.03.005
Ma, X., Zhang, G.-L., Liu, S.-M., Wang, L., Li, P.-P., Gu, P.-P., et al. (2016). Distributions and fluxes of nitrous oxide in lower reaches of Yellow River and its estuary: Impact of water-sediment regulation. Estuar. Coast. Shelf Sci. 168, 22–28. doi:10.1016/j.ecss.2015.10.001
Manjrekar, S., Uskaikar, H., and Morajkar, S. (2020). Seasonal production of nitrous oxide in a tropical estuary, off Western India. Regional Stud. Mar. Sci. 39, 101418. doi:10.1016/j.rsma.2020.101418
Miller, L. G., Oremland, R. S., and Paulsen, S. (1986). Measurement of nitrous oxide reductase activity in aquatic sediments. Appl. Environ. Microbiol. 51, 18–24. doi:10.1128/aem.51.1.18-24.1986
Murphy, J., and Riley, J. P. (1962). A modified single solution method for the determination of phosphate in natural waters. Anal. Chim. Acta 27, 31–36. doi:10.1016/s0003-2670(00)88444-5
Murray, R., Erler, D., Rosentreter, J., Wells, N., and Eyre, B. (2020). Seasonal and spatial controls on N2O concentrations and emissions in low-nitrogen estuaries: Evidence from three tropical systems. Mar. Chem. 221, 103779. doi:10.1016/j.marchem.2020.103779
Naqvi, S. W. A., Jayakumar, D. A., Narvekar, P. V., Naik, H., Sarma, V. V. S. S., D'Souza, W., et al. (2000). Increased marine production of N2O due to intensifying anoxia on the Indian continental shelf. Nature 408, 346–349. doi:10.1038/35042551
Pai, S.-C., Gong, G.-C., and Liu, K.-K. (1993). Determination of dissolved oxygen in seawater by direct spectrophotometry of total iodine. Mar. Chem. 41, 343–351. doi:10.1016/0304-4203(93)90266-q
Pai, S.-C., Tsau, Y.-J., and Yang, T.-I. (2001). pH and buffering capacity problems involved in the determination of ammonia in saline water using the indophenol blue spectrophotometric method. Anal. Chim. Acta 434, 209–216. doi:10.1016/s0003-2670(01)00851-0
Pai, S.-C., Yang, C.-C., and Riley, J. P. (1990a). Effects of acidity and molybdate concentration on the kinetics of the formation of the phosphoantimonylmolybdenum blue complex. Anal. Chim. Acta 229, 115–120. doi:10.1016/s0003-2670(00)85116-8
Pai, S.-C., Yang, C.-C., and Riley, J. P. (1990b). Formation kinetics of the pink azo dye in the determination of nitrite in natural waters. Anal. Chim. Acta 232, 345–349. doi:10.1016/s0003-2670(00)81252-0
Raes, E. J., Bodrossy, L., Van de Kamp, J., Holmes, B., Hardman-Mountford, N., Thompson, P. A., et al. (2016). Reduction of the powerful greenhouse gas N2O in the south-eastern Indian ocean. PLoS One 11, e0145996. doi:10.1371/journal.pone.0145996
Ravishankara, A. R., Daniel, J. S., and Portmann, R. W. (2009). Nitrous oxide (N2O): The dominant ozone-depleting substance emitted in the 21st century. Science 326, 123–125. doi:10.1126/science.1176985
Reading, M. J. (2022). Aquatic nitrous oxide dynamics from rivers to reefs. Southern Cross University.
Reading, M. J., Tait, D. R., Maher, D. T., Jeffrey, L. C., Looman, A., Holloway, C., et al. (2020). Land use drives nitrous oxide dynamics in estuaries on regional and global scales. Limnol. Oceanogr. 65, 1903–1920. doi:10.1002/lno.11426
Rees, A. P., Brown, I. J., Jayakumar, A., Lessin, G., Somerfield, P. J., and Ward, B. B. (2021). Biological nitrous oxide consumption in oxygenated waters of the high latitude Atlantic Ocean. Commun. Earth Environ. 2, 36. doi:10.1038/s43247-021-00104-y
Sánchez-Rodríguez, J., Sierra, A., Jiménez-López, D., Ortega, T., Gómez-Parra, A., and Forja, J. (2022). Dynamic of CO2, CH4 and N2O in the Guadalquivir estuary. Sci. Total Environ. 805, 150193. doi:10.1016/j.scitotenv.2021.150193
Seitzinger, S. P., and Kroeze, C. (1998). Global distribution of nitrous oxide production and N inputs in freshwater and coastal marine ecosystems. Glob. Biogeochem. Cycles 12, 93–113. doi:10.1029/97gb03657
Sierra, A., Jiménez-López, D., Ortega, T., Ponce, R., Bellanco, M. J., Sánchez-Leal, R., et al. (2017). Distribution of N2O in the eastern shelf of the Gulf of Cadiz (SW iberian peninsula). Sci. Total Environ. 593-594, 796–808. doi:10.1016/j.scitotenv.2017.03.189
Strickland, J. D. H., and Parsons, T. R. (1972). A practical handbook of seawater analysis. Ottawa, Canada: Fisheries Research Board of Canada, 310.
Sun, X., Jayakumar, A., Tracey, J. C., Wallace, E., Kelly, C. L., Casciotti, K. L., et al. (2021). Microbial N2O consumption in and above marine N2O production hotspots. ISME J. 15, 1434–1444. doi:10.1038/s41396-020-00861-2
Sun, X., Jayakumar, A., and Ward, B. B. (2017). Community composition of nitrous oxide consuming bacteria in the oxygen minimum zone of the eastern tropical south pacific. Front. Microbiol. 8, 1183. doi:10.3389/fmicb.2017.01183
Tang, W., Jayakumar, A., Sun, X., Tracey, J. C., Carroll, J., Wallace, E., et al. (2022). Nitrous oxide consumption in oxygenated and anoxic estuarine waters. Geophys. Res. Lett. 49. doi:10.1029/2022gl100657
Tian, H., Xu, R., Canadell, J. G., Thompson, R. L., Winiwarter, W., Suntharalingam, P., et al. (2020). A comprehensive quantification of global nitrous oxide sources and sinks. Nature 586, 248–256. doi:10.1038/s41586-020-2780-0
Tseng, H.-C., Chen, C.-T. A., Borges, A. V., DelValls, T. A., Lai, C.-M., and Chen, T.-Y. (2016). Distributions and seasea-to-air fluxes of nitrous oxide in the south China sea and the west Philippines sea. Deep Sea Res. Part I Oceanogr. Res. Pap. 115, 131–144. doi:10.1016/j.dsr.2016.06.006
Tseng, H.-C., Newton, A., Gong, G.-C., and Lin, C.-C. (2021). Social–environmental analysis of estuary water quality in a populous urban area. Elem. Sci. Anthropocene 9, 1. doi:10.1525/elementa.2020.00085
Turner, P. A., Griffis, T. J., Baker, J. M., Lee, X., Crawford, J. T., Loken, L. C., et al. (2016). Regional-scale controls on dissolved nitrous oxide in the Upper Mississippi River. Geophys. Res. Lett. 43, 4400–4407. doi:10.1002/2016gl068710
Wanninkhof, R. (2014). Relationship between wind speed and gas exchange over the ocean revisited. Limnol. Oceanogr. Methods 12, 351–362. doi:10.4319/lom.2014.12.351
Weiss, R. F. (1981). Determinations of carbon dioxide and methane by dual catalyst flame lonization chromatography and nitrous oxide by electron capture chromatography. J. Chromatogr. Sci. 91, 612–616. doi:10.1093/chromsci/19.12.611
Weiss, R. F., and Price, B. A. (1980). Nitrous oxide solubility in water and seawater. Mar. Chem. 8, 347–359. doi:10.1016/0304-4203(80)90024-9
Wen, L.-S., Jiann, K.-T., and Liu, K.-K. (2008). Seasonal variation and flux of dissolved nutrients in the danshuei estuary, taiwan: A hypoxic subtropical mountain river. Coast. Shelf Sci. 78, 694–704. doi:10.1016/j.ecss.2008.02.011
Wyman, M., Hodgson, S., and Bird, C. (2013). Denitrifying alphaproteobacteria from the Arabian Sea that express nosZ, the gene encoding nitrous oxide reductase, in oxic and suboxic waters. Appl. Environ. Microbiol. 79, 2670–2681. doi:10.1128/aem.03705-12
Xiang, H., Hong, Y., Wu, J., and Long, A. (2022). Ecological distribution and diversity of key functional genes for denitrification in surface sediments of the northern south China sea: Implications for potential N2O emissions. Front. Mar. Sci. 9. doi:10.3389/fmars.2022.912402
Zhang, G. L., Zhang, J., Liu, S. M., Ren, J. L., and Zhao, Y. C. (2010). Nitrous oxide in the Changjiang (Yangtze River) Estuary and its adjacent marine area: Riverine input, sediment release and atmospheric fluxes. Biogeosciences 7, 3505–3516. doi:10.5194/bg-7-3505-2010
Zhang, G., Zhang, J., Xu, J., and Zhang, F. (2006). Distributions, sources and atmospheric fluxes of nitrous oxide in Jiaozhou Bay. Estuar. Coast. Shelf Sci. 68, 557–566. doi:10.1016/j.ecss.2006.03.007
Zhang, W., Li, H., Xiao, Q., Jiang, S., and Li, X. (2020). Surface nitrous oxide (N2O) concentrations and fluxes from different rivers draining contrasting landscapes: Spatio-temporal variability, controls, and implications based on IPCC emission factor. Environ. Pollut. 263, 114457. doi:10.1016/j.envpol.2020.114457
Keywords: Tamsui River estuary, greenhouse gas, water-to-air fluxes, nitrous oxide, N2O, urban estuary
Citation: Tseng H-C, Yuh Han YT, Lin C-C and Gong G-C (2023) Seasonal variations of nitrous oxide in a populous urban estuary and its adjacent sea. Front. Earth Sci. 11:1112192. doi: 10.3389/feart.2023.1112192
Received: 11 January 2023; Accepted: 20 June 2023;
Published: 29 June 2023.
Edited by:
Chris Bradley, University of Birmingham, United KingdomReviewed by:
Bess B. Ward, Princeton University, United StatesXianbiao Lin, Ocean University of China, China
Tao Huang, Nanjing Normal University, China
Copyright © 2023 Tseng, Yuh Han, Lin and Gong. This is an open-access article distributed under the terms of the Creative Commons Attribution License (CC BY). The use, distribution or reproduction in other forums is permitted, provided the original author(s) and the copyright owner(s) are credited and that the original publication in this journal is cited, in accordance with accepted academic practice. No use, distribution or reproduction is permitted which does not comply with these terms.
*Correspondence: Hsiao-Chun Tseng, aGN0c2VuZ0BlbWFpbC5udG91LmVkdS50dw==
†These authors have contributed equally to this work