 Frédérique Oggier
 Christina Widiwijayanti
 Fidel Costa
94% of researchers rate our articles as excellent or good
Learn more about the work of our research integrity team to safeguard the quality of each article we publish.
Find out more
TECHNOLOGY AND CODE article
Front. Earth Sci. , 21 March 2023
Sec. Volcanology
Volume 11 - 2023 | https://doi.org/10.3389/feart.2023.1108056
The major element composition of volcanic rocks carries important information about the source and differentiation processes affecting the magma, the physical properties that allow it to erupt, and its eruptive style. Although global rock geochemical databases exist, these are not linked to volcanic eruption history which hampers our global understanding of the relationship between magma composition and eruption dynamics. Here, we integrate two global databases, the Geochemistry of Rocks of the Oceans and Continents (GEOROC) and the Holocene volcanoes of the world of the Global Volcanism Program (VOTW-GVP). The integration is based on matching the location name, geographic position and eruption time, which is automated by a tool called DashVolcano. The tool is open-source, accessible at https://github.com/feog/DashVolcano, and gives access to the integrated datasets via an interactive dashboard. DashVolcano is based on more than 138,000 volcanic rock samples and provides the basis for the identification of global relationships between eruption styles, volcano types, and rock composition for more than 700 volcanoes and their eruptions for the last 10,000 years. The combined record of the eruptive history and its corresponding geochemical rock composition that DashVolcano provides can be used for characterizing global geochemical differences between volcanoes, and should also prove useful for improved long-term hazard and risk evaluations.
The deposits of volcanic eruptions are a record of magmatic processes that reflect the physical and chemical changes of the erupted magma throughout its lifetime, from the source origin, during residency in the crustal plumbing system, until cooling at the Earth’s surface (Schmincke, 2008; Cashman et al., 2013). The variations in the geochemistry of the erupted magma are key factors for understanding its eruption processes (Cashman and Sparks, 2013) and styles (Yamamoto et al., 2021), and thus important for volcanic hazard mitigation. The magma major element composition has an important role in controlling the physical properties such as viscosity and density, that impede or facilitate eruption, and whether these are explosive or effusive (Gonnermann and Manga, 2012; National Academies of Sciences, Engineering, and Medicine, 2017; Cassidy, 2018). Thus, a comprehensive record of the eruptive histories and their corresponding geochemical rock compositions is critical for long-term evaluations of hazard and risk. The multifaceted and multiparametric nature of volcanic phenomena means that many different databases have been created, but each typically only targets one of the aspects of volcanology (Andrews et al., 2022). For instance, much of the information about the composition of volcanic rocks can be gathered from the Geochemistry of Rocks of the Oceans and Continents (GEOROC, https://georoc.eu; Sarbas and Nohl, 2008; DIGIS Team, 2022a; DIGIS Team, 2022b; DIGIS Team, 2022c; DIGIS Team, 2022d; DIGIS Team, 2022e; DIGIS Team, 2022f; DIGIS Team, 2022g; DIGIS Team, 2022h; DIGIS Team, 2022i; DIGIS Team, 2022j) of the Digital Geochemistry Infrastructure (DIGIS), and the Volcanoes of the World (VOTW) of the Smithsonian’s Global Volcanism Program (GVP, https://volcano.si.edu/; Global Volcanism Program, 2013) provides a wealth of background and eruption chronology data for Holocene events. However, much more could be learnt if the individual global volcanological datasets could be jointly explored, potentially unveiling correlations unseen so far. The GEOROC database contains more than 380,000 volcanic rock analyses, with the concentration of their major oxides. Linking the compositional information to their corresponding volcanic episode, would enrich the knowledge provided by GVP database, which includes over 1,400 volcanoes and around 9,800 eruptions.
In this paper, we present a tool that automates the integration of GVP and GEOROC databases. We describe 1) how the geochemical and volcanological data integration was done by matching parameters from both databases, and linking their data contents, 2) the complexity and challenges encountered in processing the available datasets, and in automating the linkage between the two resources, 3) data preparation and preconditioning, and 4) the type of information obtained from this integration and the complementarity that it offers. We created the interactive data exploration dashboard called DashVolcano which provides an intuitive way to visually explore, select, compare, and download datasets. DashVolcano gives access to both GVP and GEOROC datasets, allowing applications for exploring the data available for volcanoes of interest (addition of other datasets is also possible as discussed in Supplementary Appendix II), comparing the rock compositions and eruptive histories of volcanoes, and thus gather evidence of expected behaviors, or form new hypotheses. We also provide a prospective look at potential applications to utilize the integrated datasets, with selected case examples to illustrate how to perform data query, visualization, plot, and download.
We start by summarizing the features of interest from the GVP and GEOROC databases. The GVP database allows to query both volcano and eruption data (see https://volcano.si.edu/). We are using Holocene volcano datasets with known eruption data downloaded from the GVP volcano search URL (https://volcano.si.edu/search_volcano.cfm), including the volcano name, major and minor rocks types, the location, and the tectonic setting (Table 1). Hereafter, we only considered confirmed eruptions of GVP (https://volcano.si.edu/search_eruption.cfm) which typically include the eruption date(s), the volcanic explosivity index (VEI; Newhall and Self, 1982), among other data (Table 2). As classified by GVP. A detailed explanation of how eruption dates are handled depending on the different types of available data is provided in Supplementary Appendix I. Overall, GVP contains data for about 1,400 volcanoes and 9,800 confirmed eruptions.
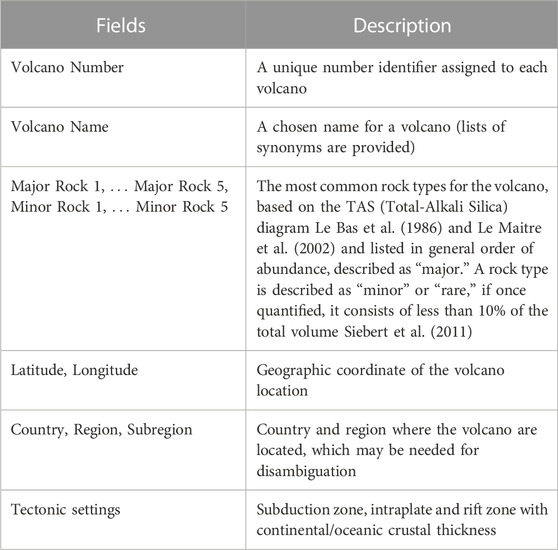
TABLE 1. GVP volcano datasets.
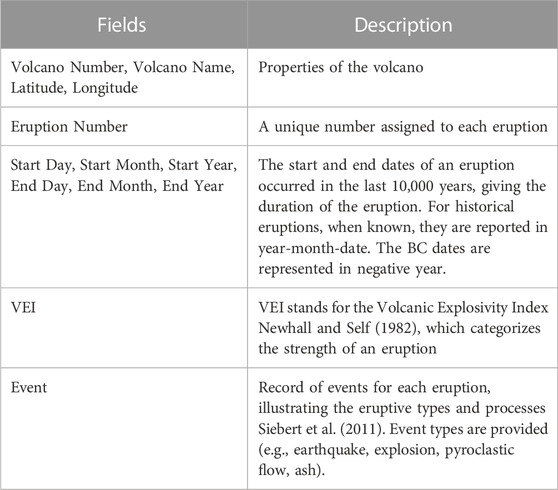
TABLE 2. GVP eruption datasets.
The GEOROC database contains rock compositional data, including major element oxides in mass % (wt%), trace elements, and a range of isotope compositions (https://georoc.eu/georoc/new-start.asp) of about 384,000 volcanic sample analyses. It is possible to query the database, or to download precompiled files by locations, which are categorized by tectonic settings. Hereafter we will identify the features in GEOROC in capital letters to make it easier to distinguish between GEOROC features from those from GVP. The features of a rock sample from a precompiled file can include sample name, rock type, eruption date, sample location, and the geochemical data (only a subset of the available chemicals is reported here; Table 3).
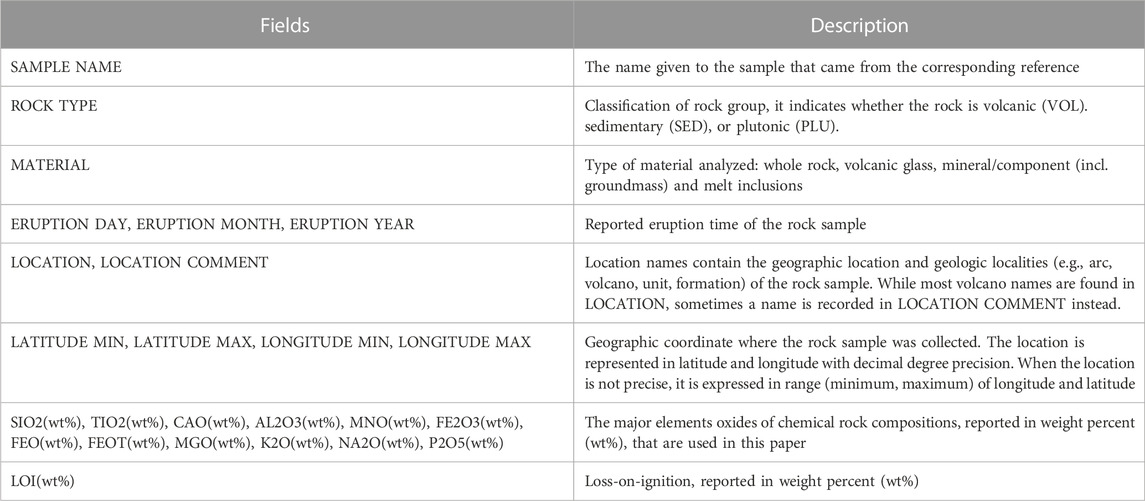
TABLE 3. GEOROC volcanic rock sample datasets.
We are only interested in volcanic rocks, so from the precompiled files only samples whose ROCK TYPE is VOL were considered. The precompiled files are grouped in 11 different folders that mainly reflect the tectonic settings: Archean cratons, complex volcanic settings, continental flood basalts, convergent margins, intraplate volcanics, ocean basin flood basalts, ocean island groups, oceanic plateaus, rift volcanics, seamounts and submarine ridges. The reported chemical compositions within those files are obtained from diverse types of material analysed: whole rock, melt inclusion, volcanic glass, and mineral. The melt inclusions analyses are reported in a separate precompiled fileMost mineral compositions are shown the plots because they are very different from the rest of the data, but when they do, their symbol is the same as whole rock.
To link the two databases we need to match GEOROC rock samples to GVP volcanoes and eruptions, for which we matched the geographical location and temporal features as described below (Figure 1).
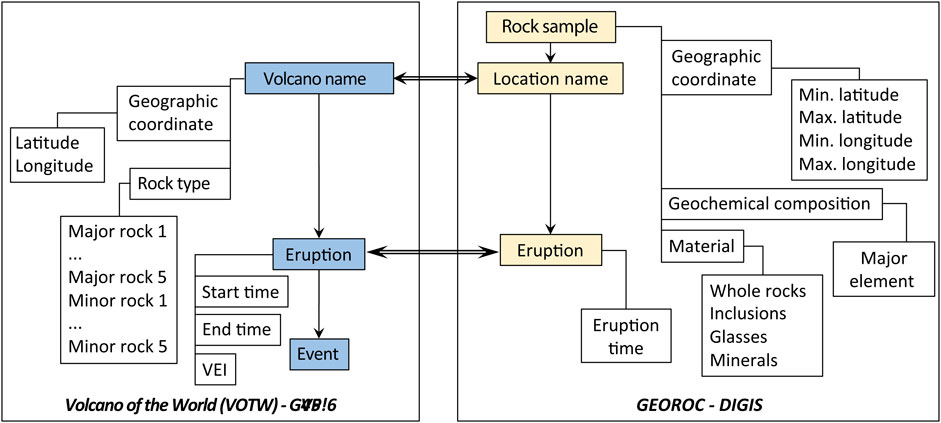
FIGURE 1. Illustration of the schematic relational data structure of the Holocene Volcano of the World (VOTW-GVP; Global Volcanism Program, 2013) database and GEOROC-DIGIS precompiled files. The flow diagram shows the combined information used in this study and linkage between fields.
In the GVP database, volcanoes are identified by their name and a volcano number. The volcano number is necessary because there are different volcanoes with the same name (e.g., Cerro Azul is the name of both a volcano in Chile, and also one in the Galapagos islands in Ecuador). Moreover, there are volcanoes which have several names (synonyms), or several spellings of the same name (e.g., Rinjani/Rindjani in Indonesia). A GVP volcano can contain multiple eruption records, but each eruption belongs to only one volcano.
In the GEOROC database, a sample has a LOCATION, a LOCATION COMMENT, a range of latitudes (LATITUDE MIN, LATITUDE MAX) and a range of longitudes (LONGITUDE MIN, LONGITUDE MAX). The ranges can be reduced to a single point, depending on the precision. The LOCATION is of the form REGION/SUBREGION/SUBSUBREGION; depending on the record, it can have from 1 to 9 (sub)region(s). The tectonic settings use different conventions in the two databases. There is no convention for regions and sub-regions either.
Linking the two databases requires matching the volcano names (or locations) in GVP with names appearing in the LOCATION field (or LOCATION COMMENT) of the GEOROC files. The overall process is summarized in Figure 2. Using only the names appearing in the LOCATION field gave too many errors, due to the same or similar names being present in separate places. We decided to use instead the latitude and longitude data first. We used the ranges provided by the GEOROC files, allowing a margin of error of 0.5°, and then retained only those GEOROC records whose range contains a latitude-longitude pair corresponding to a GVP volcano, and discarded the rest (Figure 2). We then automatically matched names by finding a GVP volcano name in the LOCATION field (or in the LOCATION COMMENT field) of shortlisted samples. Complications arise from 1) having different spellings for the same volcano [e.g., in the GEOROC records, the names TJERIMAI (TJAREME), CEREME, CIREMAI are found for the GVP name Cereme], 2) having different names used in both databases (e.g., the GEOROC name TERNATE corresponds to the GVP name Gamalama), 3) linking several GEOROC location names to the same GVP volcano, 4) identifying samples belonging to the same volcano even though they may appear in different GEOROC files.
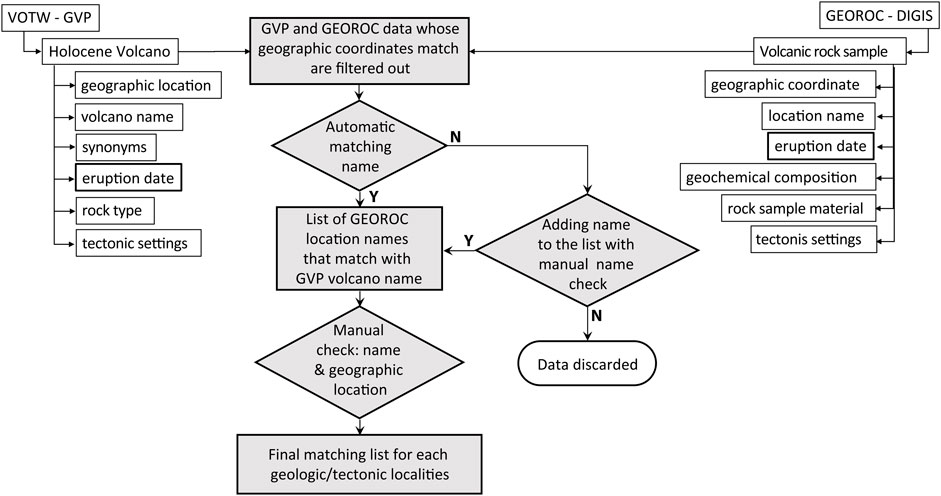
FIGURE 2. Flow diagram showing how the data mapping between GVP volcano name and GEOROC location name was done by matching name and geographical location.
Once the automatic matching was completed, part of the resulting data were checked manually. A completely reliable automatic matching without manual check is not possible in general: there are, for example, samples located in between volcanoes, requiring expert knowledge to accurately assign the sample analysis to a particular volcano. Sometimes, there may also be errors in the records. The DashVolcano provides a map of the sample locations to help decide on the attribution of a sample to a volcano when ambiguous, as will be detailed below.
The datasets of GVP and GEOROC were downloaded in 2021 (more precisely in June 2021 for GEOROC data). From GVP we accessed ∼1,400 Holocene volcanoes and ∼9,800 eruption records, with ∼860 volcanoes having known eruption date(s), and included some eruptions older than Holocene for Yellowstone caldera. GEOROC precompiled files provided ∼384,000 volcanic rock analyses, ∼138,000 of them matched and found around GVP Holocene volcanoes. Following the matching procedure described above, we obtained around 1000 GVP volcanoes that matched rock samples, around 700 among those have eruption date(s). We expect that most of the GVP Holocene are (at least partially) matched.
Once the GEOROC samples are matched with a GVP volcano, the correspondence of the samples to eruptions was done based on temporal data, more precisely on the ERUPTION YEAR field, and on the Start Year and End Year fields, respectively (if the GVP End Year is missing, the GVP Start Year is used). The algorithm worked as follows: 1) if the ERUPTION YEAR is in between the Start Year and End Year, a match is found; 2) otherwise, look for a Start Year before the ERUPTION YEAR, and an End Year which has not been identified in 1). If the Start Year and End Year are the same, and matching an ERUPTION YEAR, then we searched for a match at the month level. Many eruption dates in the GVP dataset are incomplete and only part of the start/end date is known. Moreover, for eruptions after 1,679 (the year 1,679 is used because of a programming viewpoint, not a volcanology one), many records also contain the start and end day, whereas for most older eruptions, only the year is known. To address the issue of missing dates we first discarded all eruptions for which the start date was not known. Then, to be able to plot the data for older eruptions the start and end dates were interpolated following the existing data. For eruptions older than 1,679 and where the end year is missing, we made it the same as the start year. These procedures were used to visualize eruption periods, the exact content of GVP dates is preserved, and the correct data are available when hovering the mouse above the data points. The exact methodology we used is detailed in the Supplementary Appendix I of the paper.
To make the integration of GVP and GEOROC databases easily accessible and explorable, we designed a dashboard which, given a volcano of interest, comprises five types of visualization of the joint data which are described in sequence below:
1. A map of the world (using ©OpenStreetMap), showing GVP volcanoes, and GEOROC samples around volcanoes,
2. TAS (total-alkalis versus silica) diagrams (Le Bas et al., 1986; Le Bas et al., 1992),
3. Harker diagrams (e.g., Winter, 2001) from the GEOROC oxide compositions, together with,
4. GVP bar plots, summarizing known VEI, and
5. A chronogram with GVP eruptive history and GEOROC silica and alkalis evolution.
The location of the samples is shown using a world map (Figure 3), which includes GVP volcanoes and GEOROC samples around the volcanoes. Rock sample locations are given with a range of latitude and longitude (LATITUDE MIN/MAX and LONGITUDE MIN/MAX). Only samples whose latitude-longitude range contain a volcano listed by GVP, with a variation of 0.5° are shown. We included volcanoes with known and unknown eruption dates. Some data samples have erroneous values for their latitude/longitude ranges, and these were discarded and not displayed. To display a sample, the mean of the latitude range (namely, [LATITUDE MIN + LATITUDE MAX]/2) and that of the longitude range are used. With the map tool, it is possible to zoom into a selected volcano from a drop-down menu, in which case GEOROC samples automatically attached to this volcano are highlighted in blue (Figure 4A). Two selection tools are available that allow to group GEOROC samples of interest together. The corresponding TAS diagram of either the chosen volcano or selected samples is also displayed (see also Figures 4B, 5B).
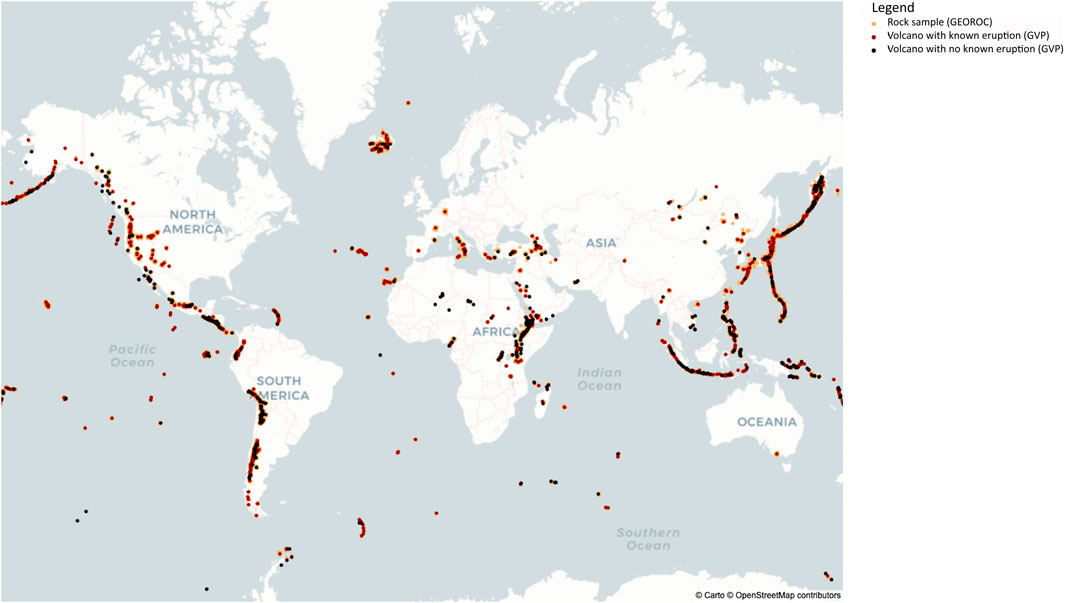
FIGURE 3. A world view of the GVP volcanoes. Red dots are for volcanoes with known dated eruption(s) and black dots for those without known eruption dates, and the matched GEOROC samples appear as yellow dots. Note that a sample location may represent many rock samples.
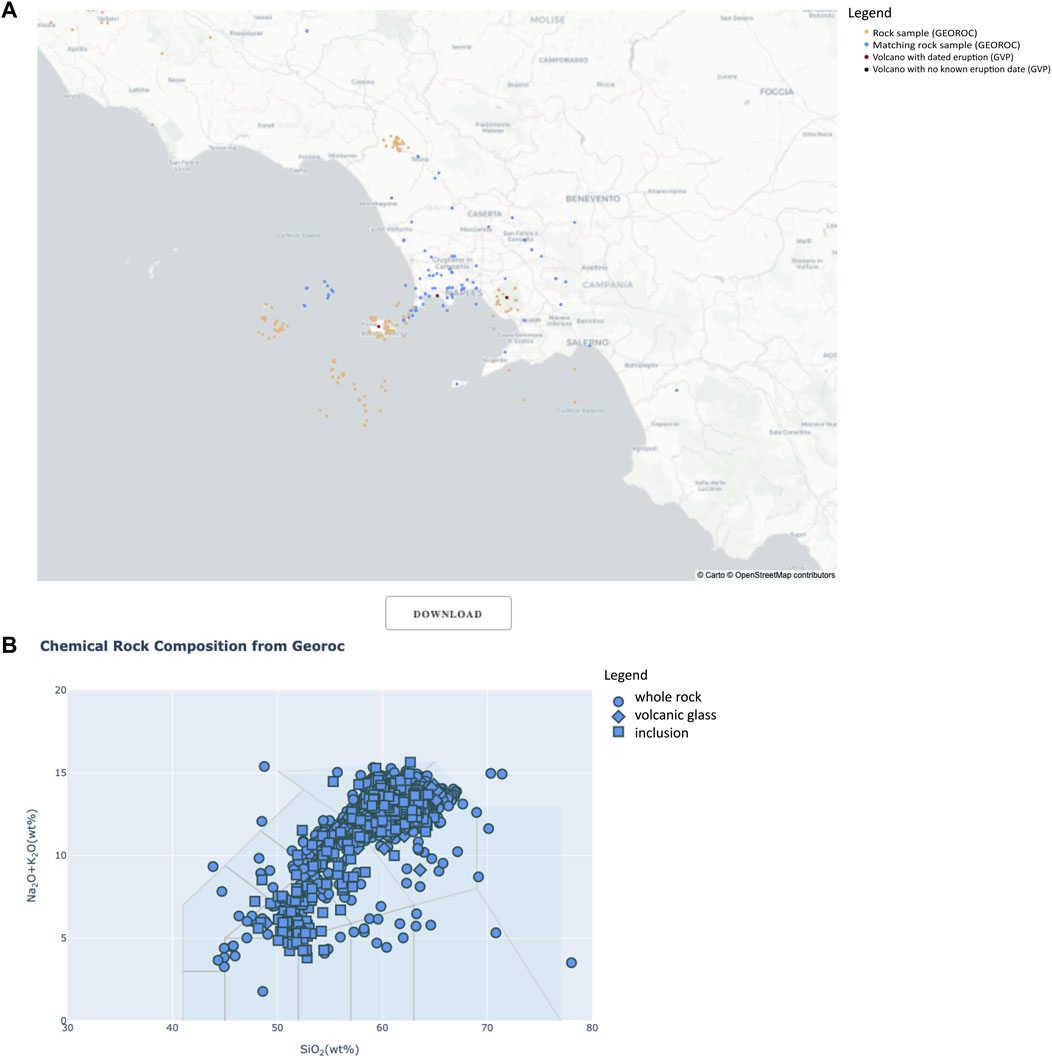
FIGURE 4. (A) Map view example of the Campi Flegrei volcano (shown as a red dot, since it is a GVP volcano with known eruptions). All the Campi Flegrei’s samples are represented by blue dots, which include samples belonging to the Neapolitan volcanic area, represented by yellow-orange dots. (B) The TAS diagram corresponding to Campi Flegrei’s matched samples (shown in blue) is automatically computed. The whole rock (circle), volcanic glass (diamond) and inclusion (square; this refers to melt inclusions) chemical composition of those matched samples (the blue dots) are plotted in the TAS diagram, noting that all data have been recalculated to 100% volatile-free and with total iron oxide as FeO* (see text for details). Different symbol corresponds to different material types, which can be deactivated when not needed. The datasets for Campi Flegrei, which consist of around 2,300 analyses, can be downloaded in CSV format file by clicking “DOWNLOAD” button located between the map and TAS diagram plot. The downloaded file, which stored all the data being plotted, will be stored under the DashVolcano.1.0 folder.
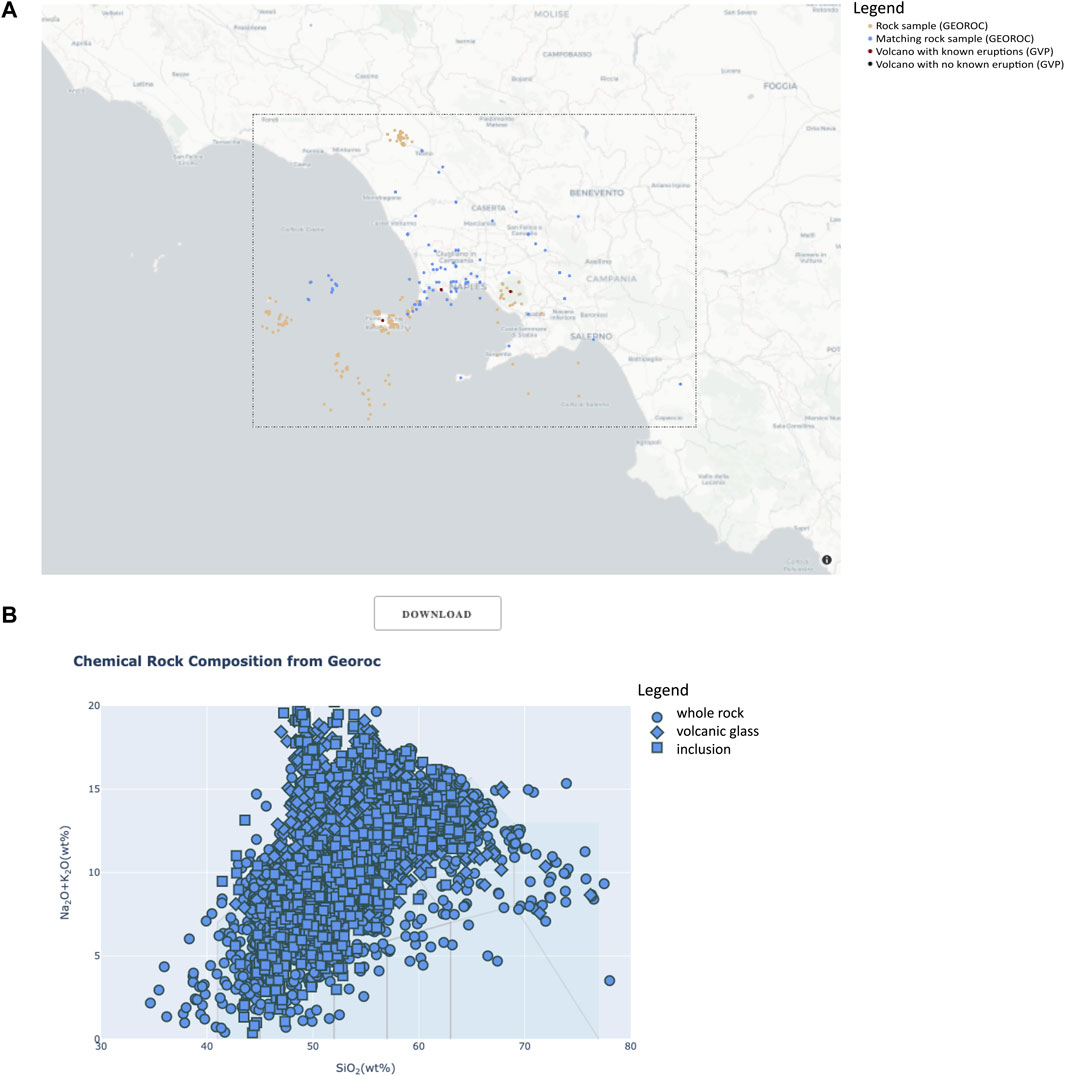
FIGURE 5. (A) The wider Neapolitan Volcanic area can also be selected to include more data around the volcano of interest, or when needed to cover many volcanoes at once using the box or lasso select tools provided. (B) The TAS diagram is automatically updated to plot the chemical compositions of the rock samples within the selected area.
The most abundant element oxide in volcanic rocks is silica (SiO2) and together with sodium (Na2O) and potassium (K2O), they are used to classify volcanic rocks with the Total-Alkali Silica (TAS) diagram described in detail by Le Bas et al., 1986 and Le Bas et al., 1992. If a sample has no data (or a 0 value) for all the three, then it is not displayed. Care should be taken with evaluating or interpreting the iron concentrations, as it is reported as FeO, Fe2O3, or both. Most researchers only determine the total iron and report it as FeOT (total iron as FeO). GEOROC contains data fields for FE2O3(wt%), FEO(wt%), and FEOT(wt%). For samples where only FEOT(wt%) is reported we used this value. For samples where FE2O3(wt%) and FEO(wt%) are reported, we recalculated Fe2O3 into FeO and added it to the reported FEO(wt%), so that for all samples we report FEOT(wt%) as
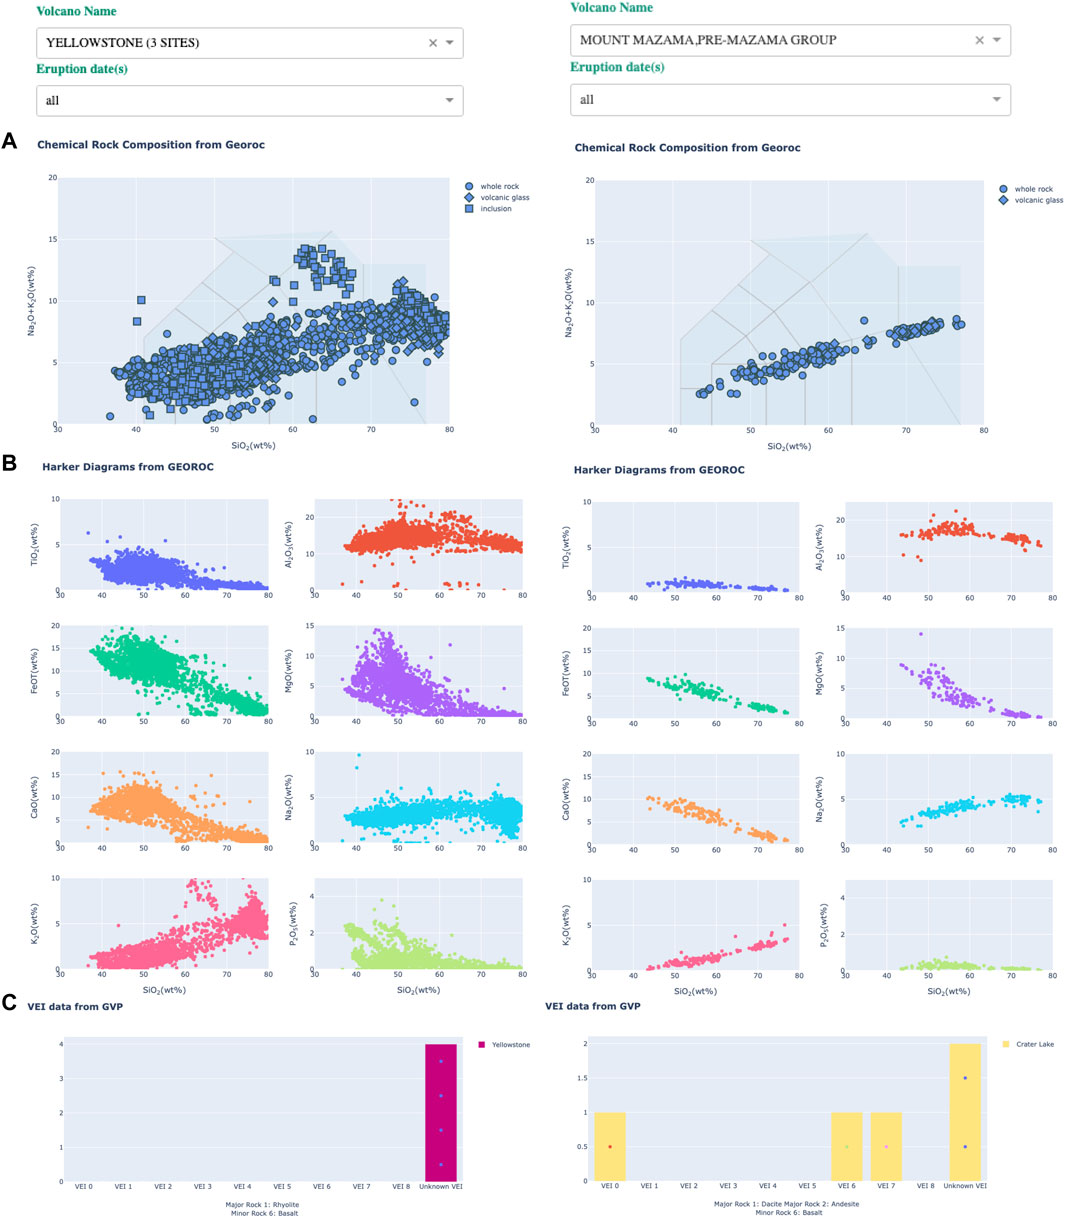
FIGURE 6. Side by side comparison of Yellowstone (left) and Mt. Mazama (right) datasets. The distribution of major elements oxides in wt% of the rock sample analyses expressed in (A) TAS, and (B) Harker variation diagrams. (C) The GVP information related to the VEI and rocks of matching volcanoes is integrated, whereas Mt. Mazama has good links between composition and eruptive history, Yellowstone does not, but the older than Holocene eruptions we report were found in the downloaded data in 2021.
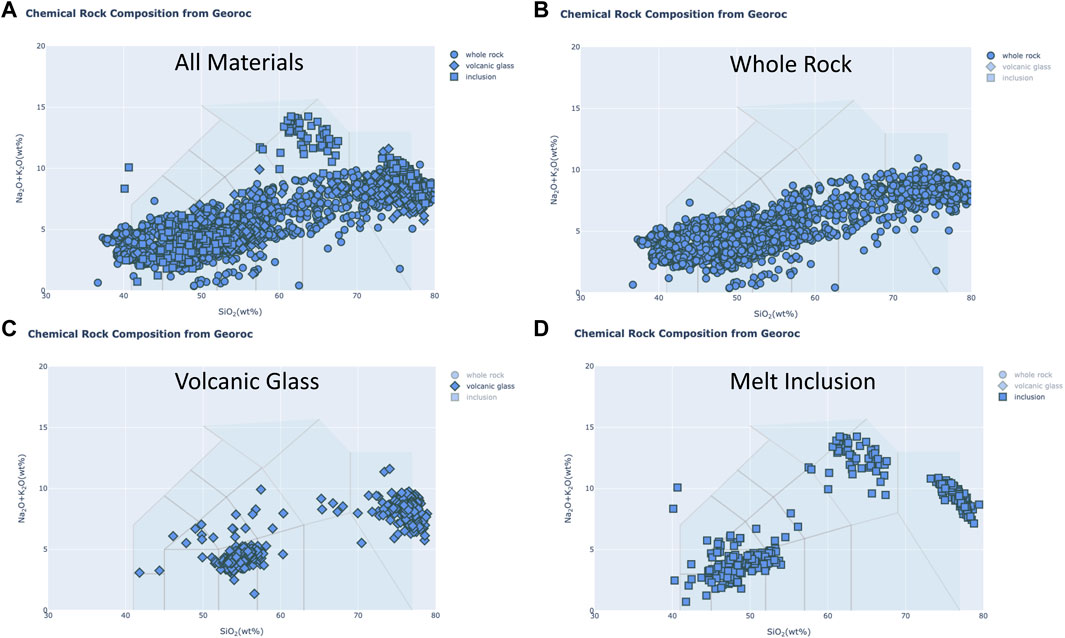
FIGURE 7. The TAS diagram can be customized to show the variability of silica and alkalis for different types of material analysed (whole rock, volcanic glass, and melt inclusion) by selecting/deactivating the respective symbol at the upper-right legend. Here we plotted: (A) all available type of materials available for Yellowstone in one TAS diagram, (B) only plots for whole rock analyses, (C) only for volcanic glasses, and (D) only for melt inclusions.
Harker diagrams, are classically used to show the variation of the amount of each of the chemical constituents of igneous rocks (e.g., Winter, 2001). They are 2-dimensional plots (Figure 6B), with SIO2(wt%) on the x-axis, and on the y-axis, respectively TIO2(wt%), AL2O3(wt%), FEOT(wt%), MGO(wt%), CAO(wt%), NA2O(wt%), K2O(wt%), P2O5%(wt%). The same normalization as for TAS diagrams is used (Figure 6).
We display the TAS diagram of a selected volcano using GEOROC data (Figure 6A), together with a bar plot of the values of VEI from eruptions in GVP (Figure 6C). The bar plot illustrates the volcanic explosivity history of a given volcano using the number of eruptions with a given VEI. Each VEI point is displayed with a date if provided by GVP. Unknown values of VEI are also indicated. The list of major and minor rocks (see description in Table 1) from the GVP dataset is given and reflected in the color of the histogram (from warmer red colors for felsic, towards colder blue colors for mafic). When a date is chosen from the GEOROC date menu, the corresponding eruption is reflected in the GVP histogram if an automatic match is found.
A chronogram is the eruption timeline of a volcano extracted from the GVP dataset. We distinguish three time periods: before common era (BC), before 1,679 (CE), and after 1,679 (we note that this year has no geological significance, it is related to the precision of the time recordings of Python). This was necessary because they have different levels of granularity: recent eruptions are often precise to the day, whereas BC data are generally less precise but may be known at the year level. All known eruptive history is displayed in chronological order; each colored bar represents the duration of an eruption based on the known start and end date, so short and long eruption periods are distinguishable. The actual dates in the GVP dataset are available upon hovering on the chronogram, so the user knows which dates are present in the dataset versus the dates used for plotting purposes.
The color of the bar reflects how many events an eruption had. The list of corresponding events which occurred during an eruption as reported by GVP can be seen when hovering on each bar. The different event types (e.g., explosion, earthquake, ash) are a record of the eruptive types and processes (Siebert et al., 2011). Dots connected with a line are superimposed for better visualizing the fluctuations of VEIs (see Figure 8).
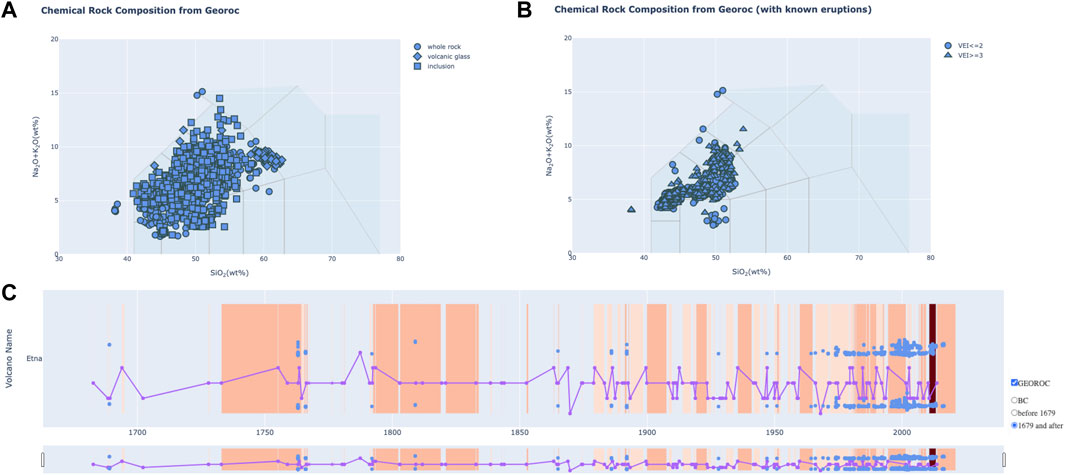
FIGURE 8. The major element oxide compositions of Mt. Etna (Italy) rock samples are shown in two TAS classification diagrams. (A) shows the variability of silica and alkalis of Etna samples with three types of material (whole rock, volcanic glass, and melt inclusion) shown as different symbols that can be selected/deactivated. (B) The TAS diagram that only plots GEOROC samples can be matched to GVP eruptions. Here the shapes are used to highlight the VEI of the eruption (unknown of low VEI vs. VEI at least 3); the y-axis remains the total alkali oxides. (C) A chronogram plot with time series variations of the rock composition throughout historical eruptions of Mt. Etna from 252AD to present can be explored interactively. The total alkali oxides (Na2O + K2O) and silica (SiO2) content of samples with known eruption time (blue dots) are plotted together with the GVP historical eruption records (coloured bars, the more eventful the eruption, the darker the bar) with the VEI data (purple dots, a line connects them to highlight the variations in VEI). All known eruptive history will be displayed in chronological order, each coloured bar represents duration of an eruption based on the known start and end date. A list of corresponding events (Global Volcanism Program, 2013) is shown on hover above the data point. We note that the date 1,679 has no geological significance, it is related to the precision of the time recordings of Python.
We display two views of the same TAS diagram (Figures 8A, B). The first contains all GEOROC data samples. In the second diagram, only GEOROC samples matching GVP eruptions are shown, and the symbols reflect the VEI. Moreover, the GEOROC data samples displayed in the overall TAS diagram are further superimposed on the chronogram, which can be deactivated if not needed (Figure 8C). The values of SIO2(wt%) and NA2O(wt%) + K2O(wt%) are plotted. The goal of the plot is to show the fluctuations of major chemical compositions over time as well as the ranges within an eruption.
The DashVolcano tool automates the integration of GEOROC and GVP datasets, it is not a new database that stores these data. It instead generates index files to cross-reference the volcanoes and rock samples. To link a GVP volcano to GEOROC rock samples, an indexing is used, which, given as input a GVP volcano name and GEOROC location names of interest, will dynamically provide a linking of the respective data so they can be combined, jointly visualized, and possibly jointly analyzed later. This indexing relies on mapping files. Each GEOROC precompiled file corresponds to a mapping file. Each line of a mapping line contains a volcano name from GVP, followed by a list of names that appear in the field LOCATION (or in the first entry of the field LOCATION COMMENT) of GEOROC. This is best illustrated with an example. Suppose we are interested in MOUNT MAZAMA volcano. It belongs to the Cascade Volcanic Range in western North America, archived in the GEOROC precompiled file PVFZCE_CASCADES.csv, itself part of the Convergent Margin tectonic setting. This file contains the samples from MOUNT MAZAMA, under two names: MOUNT MAZAMA, PRE-MAZAMA GROUP. In the GVP database, MOUNT MAZAMA is known as a synonym of Crater Lake. The index file for PVFZCE_CASCADES.csv thus contains one line of the form Crater Lake; MOUNT MAZAMA, PRE-MAZAMA GROUP. We note that if a user only wishes to study GEOROC data which do not correspond to any GVP volcanoes, it is also possible to use the above mechanism to link several GEOROC samples together, by tying them with a “GVP name” that is not present in the GVP volcano list. This can be done by adding a location-name in the mapping file, for example, by adding “Bayah Dome; BAYAH DOME” in the last line of the Sunda Arc mapping file (/GeorocGVPmapping/Convergent_Margins_comp/SUNDA_ARC.txt), will allow user to browse available GEOROC samples belong to Bayah Dome located in West Java (Indonesia).
Some users may want to include their own data collection, and combine it with the matched GEOROC datasets, to improve data coverage of a volcano of interest and enable data visualization using the DashVolcano tools. It is possible to do so, but it may be required to edit mapping files accordingly. The format of the manual data must follow the GEOROC Precompile File spreadsheet template with the compulsory fields SAMPLE NAME, LOCATION (name), geographic location (LATITUDE, LONGITUDE), MATERIAL, TECTONIC SETTING and the major element composition. Manual curation is also a way to check the performance and consistency of the code to link information between geochemical data (GEOROC or manual curation) and those from GVP. As examples of manual curation, we compiled geochemical analyses of volcanic rock samples (Widiwijayanti, 2022a; Widiwijayanti, 2022b; Widiwijayanti, 2022c) from Mt. Fuji (Takahashi et al., 2003; Yamamoto et al., 2007; Yamamoto et al., 2020; Miyaji et al., 2011; Yamamoto, 2011; Ishizuka et al., 2021), Rinjani (Vidal et al., 2015; Métrich et al., 2017) and Merapi (Costa et al., 2013) volcanoes. These manually curated datasets contain data that are not currently in the GEOROC database. We also provide detail explanation about the manual data curation including step-by-step how to add data manually and example of uses in the Supplementary Appendix II of the paper.
The geographic location of GEOROC volcanic samples does not always reflect the volcano they originated from, e.g., the latitude and longitude ranges are too wide. Therefore, by plotting both GVP volcanoes and GEOROC samples, the Map visualization tool allows to plot the spatial distribution of the GEOROC samples, and to relate both the unmatched and automatically matched GEOROC samples to their respective GVP volcano, if any. This can be seen when plotting samples from Campi Flegrei (Figure 4) and the Neapolitan Volcanic Area (Figure 5) in Italy. The user can check a) whether the sample positions shown blue dots (representing the samples automatically matched to Campi Flegrei) are correctly attributed to Campi Flegrei, and b) whether other GEOROC samples (displayed in yellow-orange) should have been attributed to Campi Flegrei. Any unexpected result may reflect an error or omission in the automatic matching, or an error in the GEOROC database. The map (Figure 5A) also shows two others active GVP volcanoes close by, which are Vesuvius and Ischia (red dots), and the distribution of the GEOROC rock samples for the three volcanoes in the Neapolitan Volcanic Area. Selecting Campi Flegrei from the drop-down menu in the Map visualization tool will generates its TAS diagram, in which all the corresponding plotted samples belong to Campi Flegrei, shown in blue on the map (Figure 4A).
Using the Mapview tool, a user may select the area of interest interactively from the map using box or lasso select tools depending on the desired shape. For example, a user wishes to include more GEOROC samples around Campi Flegrei or to select wider Neapolitan Volcanic area. A new TAS diagram will be automatically generated to include all the GEOROC samples in the area selected. The TAS diagram shown in Figure 5B can be compared to the Neapolitan Volcanic rock data plotted in Figure 2 of Pignatelli and Piochi (2021) for validation purposes. It is also interesting to compare the rock compositions of a given volcano (here Campi Flegrei volcano, in Figure 4B) with the rock compositions of a larger area to which it belongs (here the Neapolitan Volcanic area, in Figure 5B).
In order to facilitate comparative studies between two volcanoes, or two eruptions, side-by-side plots are provided, comprising TAS and Harker diagrams for analyzing geochemical variability, and bar plots to summarize the VEI’s of the historical eruptions. The bar plots show how many eruptions for each VEI and the eruption date will be shown when user mouseover the dots inside the bar. Below the bar plots, the GVP major and minor rock types are reported (Global Volcanism Program, 2013). Side-by-side plots allow to quickly visualize, for example, which volcano has the most continuous range in composition, what are the predominant rock types in each volcano, and more generally provides a comparison between the general trends of the GEOROC datasets. As an example (Figure 6), we compare two large caldera-forming volcanoes in the North American continent, Yellowstone and Crater Lake (Mount Mazama). Both feature a variety of well-studied volcanic rocks that originated from some of the most explosive eruption to have occurred within the last 2 million years (Bacon and Lowenstern, 2005; Bindeman et al., 2007) but the causes of their eruptive behavior are quite different and are closely linked to plate tectonic setting, Yellowstone in continental hotspot (Smith and Braile, 1994; Christiansen, 2001; Smith et al., 2009) and Crater Lake in convergent margin of Cascadia subduction zone (Bacon, 1983). The volcanism at Mt. Mazama and Yellowstone highlights these differences and forms the basis of comparative studies of diverse origins of two caldera forming volcanoes that are being used as exemplary teaching activities to explore compositional variations using GEOROC datasets (Ratajeski, 2004). There are two known large Holocene eruption records for Mt. Mazama, but Yellowstone does not have any, but the older than Holocene eruptions we report were found in the downloaded data in 2021.
The interactive visualization tools of DashVolcano allow to explore the variability of silica versus other major element oxides in Harker diagrams (Figure 6) and the variability of silica versus alkalis for different types of material analyzed, e.g., whole rock, volcanic glass or melt inclusion in TAS diagram (Figure 7).
The linked information between GEOROC and GVP data allows extraction of data to relate the volcanic rock samples composition to their eruption time and VEI, hereafter expressed as a pair of TAS diagrams and a chronogram (Figure 8). The GEOROC rock samples that matched a chosen volcano, or a specific eruption data for this volcano if available, are plotted in two TAS diagrams. The left side diagram contains only the GEOROC data and the right side are combined with GVP data but only shown eruptions that are matched in both databases (with VEI data if available). The eruption history of this volcano is illustrated in a chronogram. The chronogram summarizes the timeline of the historical eruptions, the events occurred during the eruption and VEI information as reported by GVP. The total alkali oxides (Na2O + K2O) and silica (SiO2) content of samples with known eruption time (blue dots) are plotted together with the GVP historical eruption records (red bars, the more event reported in an eruption, the redder the bar) with the VEI data (purple dots, a line connects them to highlight the variations in VEI). All known eruptive history will be displayed in chronological order; each coloured bar represents duration of an eruption based on the known start and end date. A list of corresponding events (Global Volcanism Program, 2013) is shown when hovering the mouse above the data point. We selected Mount Etna as a comprehensive example (Figure 8) as it erupts frequently (Tanguy et al., 2007), has well documented historical eruptions (with known start and end date, VEI, events), and many rock sample analyses that allow to illustrate the chemical composition variation along the eruption timeline.
The open-source DashVolcano app automatically integrates two global databases, the Geochemistry of Rocks of the Oceans and Continents (GEOROC) and the Holocene volcanoes of the world of the Global Volcanism Program (VOTW-GVP), with a graphical user interface (GUI). The app provides the user a dashboard to explore and compare the joint data for volcano(es) and/or eruption(s) in terms of chemical rock composition, analyzed rock’s material, eruption timeline, eruption events, and VEI information. DashVolcano can be used to find evidence to support known hypotheses or to articulate new ones based on the combined datasets, which are now widely accessible and available for the first time. This work is a significant contribution to the community, from the point of view of methodology on establishing interoperability between two global Earth science databases, helping the reuse of existing datasets, and providing new tools to explore the integrated datasets. The data and the code are publicly available without restriction. With this paper we provide an example of improving the findability, accessibility, interoperability, and reuse (FAIR) of global volcanological and geochemical data.
Publicly available datasets were analyzed in this study. This data can be found here: https://researchdata.ntu.edu.sg/dataset.xhtml?persistentId=doi:10.21979/N9/BJENCK.
FO was the primary author who wrote the manuscript and is responsible for the code, data linking and integration. CW also wrote the manuscript and is responsible for manual data check and manual curation. FC initiated this study and edited the manuscript.
FO research is supported by Nanyang Technological University, Singapore, Start-Up Grant and the grant “Mathematics and Applications.” CW is supported by Earth Observatory of Singapore. FC research was supported by “Chaire d’Excellence” Universite de Paris Cite.
We thank the reviewers for their constructive comments, and the editor for editoral handling of the paper.
The authors declare that the research was conducted in the absence of any commercial or financial relationships that could be construed as a potential conflict of interest.
All claims expressed in this article are solely those of the authors and do not necessarily represent those of their affiliated organizations, or those of the publisher, the editors and the reviewers. Any product that may be evaluated in this article, or claim that may be made by its manufacturer, is not guaranteed or endorsed by the publisher.
The Supplementary Material for this article can be found online at: https://www.frontiersin.org/articles/10.3389/feart.2023.1108056/full#supplementary-material
Andrews, B. J., Costa, F., Venzke, E., and Widiwijayanti, C. (2022). Databases in volcanology. Bull. Volcanol. 84, 92. doi:10.1007/s00445-022-01597-x
Bacon, C. R. (1983). Eruptive history of Mount Mazama and Crater Lake Caldera, Cascade Range, U.S.A. J. Volcanol. Geotherm. Res. 18 (1), 57–115. doi:10.1016/0377-0273(83)90004-5
Bacon, C. R., and Lowenstern, J. B. (2005). Late Pleistocene granodiorite source for recycled zircon and phenocrysts in rhyodacite lava at Crater Lake, Oregon. Earth Planet. Sci. Lett. 233 (3), 277–293. doi:10.1016/j.epsl.2005.02.012
Bindeman, I. N., Watts, K. E., Schmitt, A. K., Morgan, L. A., and Shanks, P. W. C. (2007). Voluminous low δ18O magmas in the late Miocene Heise volcanic field, Idaho: Implications for the fate of Yellowstone hotspot calderas. Geology 35 (11), 1019–1022. doi:10.1130/G24141A.1
Cassidy, M., Manga, M., Cashman, K., and Bachmann, O. (2018). Controls on explosive-effusive volcanic eruption styles. Nat. Commun. 9, 2839. doi:10.1038/s41467-018-05293-3
Cashman, K. V., Sparks, R. S. J., and Blundy, J. D. (2013). Vertically extensive and unstable magmatic systems: A unified view of igneous processes. Science 355 (6331), eaag3055. doi:10.1126/science.aag3055
Cashman, K. V., and Sparks, R. S. J. (2013). How volcanoes work: A 25 year perspective. GSA Bull. 125 (5–6), 664–690. doi:10.1130/B30720.1
Christiansen, R. L. (2001). The quaternary and pliocene Yellowstone plateau volcanic field of Wyoming, Idaho, and Montana. Washington, DC, USA: USGS Professional Paper 729-G, 120.
Costa, F., Andreastuti, S., de Maisonneuve, C. B., and Pallister, J. S. (2013). Petrological insights into the storage conditions, and magmatic processes that yielded the centennial 2010 Merapi explosive eruption. J. Volcanol. Geotherm. Res. 261, 209–235. doi:10.1016/j.jvolgeores.2012.12.025
Digis Team, (2022e). GEOROC compilation: Archaean cratons. Göttingen, Germany: GRO.data. doi:10.25625/1KRR1P
Digis Team, (2022b). GEOROC compilation: Complex volcanic settings. Göttingen, Germany: GRO.data. doi:10.25625/1VOFM5
Digis Team, (2022f). GEOROC compilation: Continental flood basalts. V3: GRO.data. doi:10.25625/WSTPOX
Digis Team, (2022h). GEOROC compilation: Convergent margins. Göttingen, Germany: GRO.data. doi:10.25625/PVFZCE
Digis Team, (2022i). GEOROC compilation: Intraplate volcanic rocks. Göttingen, Germany: GRO.data. doi:10.25625/RZZ9VM
Digis Team, (2022a). GEOROC compilation: Melt inclusions. Göttingen, Germany: GRO.data. doi:10.25625/7JW6XU
Digis Team, (2022c). GEOROC compilation: Ocean basin flood basalts. Göttingen, Germany: GRO.data. doi:10.25625/AVLFC2
Digis Team, (2022g). GEOROC compilation: Ocean island groups. Göttingen, Germany: GRO.data. doi:10.25625/WFJZKY
Digis Team, (2022d). GEOROC compilation: Oceanic plateaus. Göttingen, Germany: GRO.data. doi:10.25625/JRZIJF
Digis Team, (2022j). GEOROC compilation: Rift volcanics. Göttingen, Germany: GRO.data. doi:10.25625/KAIVCT
Global Volcanism Program, (2013). in Volcanoes of the world. Editor E. Venzke (Smithsonian Institution), 4.1. Downloaded 24 Feb 2021. doi:10.5479/si.GVP.VOTW4-2013
Gonnermann, H. M., and Manga, M. (2012). “Dynamics of magma ascent in the volcanic conduit,” in Modeling volcanic processes: The physics and mathematics of volcanism. Editors S. A. Fagents, T. K. P. Gregg, and R. M. C. Lopes (England, UK: Cambridge University Press), 55–84.
Ishizuka, Y., Yamamoto, T., Nakano, S., and Yoshimoto, M. (2021). Estimated eruption volume of the Subashiri-stage products during the last 7,000 years, Fuji Volcano, Japan. Volcano, Japan: Open-File Rep Geol Surv Japan AIST, 715.
Kress, V. C., and Carmichael, I. S. E. (1991). The compressibility of silicate liquids containing Fe2O3 and the effect of composition, temperature, oxygen fugacity and pressure on their redox states. Contr. Mineral. Pet 108, 82–92. doi:10.1007/BF00307328
Le Bas, M. J., Le Maitre, R. W., Streckeisen, A., and Zanettin, B. (1986). A Chemical Classification of Volcanic Rocks Based on the Total Alkali-Silica Diagram. J. Petrology 27 (3), 745–750. doi:10.1093/petrology/27.3.745
Le Bas, M. J., Le Maitre, R. W., and Woolley, A. R. (1992). The construction of the Total Alkali-Silica chemical classification of volcanic rocks. Mineralogy Petrology 46, 1–22. doi:10.1007/BF01160698
Métrich, N., Vidal, C. M., Komorowski, J.-C., Pratomo, I., Michel, A., Kartadinata, N., Prambada, O., et al. (2017). New Insights into Magma Differentiation and Storage in Holocene Crustal Reservoirs of the Lesser Sunda Arc: the Rinjani–Samalas Volcanic Complex (Lombok, Indonesia). J. Petrology 58 (11), 2257–2284. doi:10.1093/petrology/egy006
Miyaji, N., Kan’no, A., Kanamaru, T., and Mannen, K. (2011). High-resolution reconstruction of the Hoei eruption (AD 1707) of Fuji volcano, Japan. J. Volcanol. Geotherm. Res. 207, 113–129. doi:10.1016/j.jvolg.eores.2011.06.013
National Academies of Sciences, (2017). Volcanic eruptions and their repose, unrest, precursors, and timing. Washington, DC, USA: The National Academies Press. doi:10.17226/24650Engineering, and Medicine
Newhall, C. G., and Self, S. (1982). The volcanic explosivity index (VEI) an estimate of explosive magnitude for historical volcanism. J. Geophys. Res. 87 (C2), 1231–1238. doi:10.1029/JC087iC02p01231
Oggier, F. E. (2022). GEOROC data from 2021. DR-NTU (Data), V1, UNF:6:Mb8WgY7b6foCm0HnA7L35w== [fileUNF]. Singapore: DR-NTU. doi:10.21979/N9/BJENCK
Pignatelli, A., and Piochi, M. (2021). Machine learning applied to rock geochemistry for predictive outcomes: The Neapolitan volcanic history case. J. Volcanol. Geotherm. Res. 415, 107254. doi:10.1016/j.jvolgeores.2021.107254
Ratajeski, K. (2004). Compositional diversity in volcanic suites, integrating research and education, the science education resource center (serc) of carleton college. Retrieved Oct 3, 2022, from https://serc.carleton.edu/research_education/cyberinfrastructure/Harkers/index.html.
R. W. Le Maitre, A. Streckeisen, B. Zanettin, M. J. Le Bas, B. Bonin, and P. Bateman (Editors) (2002). “Igneous rocks: a classification and glossary of terms: recommendations of the international union of geological sciences,” Subcommission on the systematics of igneous rocks (Cambridge, UK: Cambridge University Press). doi:10.1017/CBO9780511535581
Sarbas, B., and Nohl, U. (2008). “The GEOROC database as part of a growing geoinformatics network,” in Geoinformatics 2008—Data to knowledge, proceedings: U.S. Geological survey scientific investigations report 2008-5172. Editors S. R. Brady, A. K. Sinha, and L. C. Gundersen (Reston, VA, USA: U.S. Geological Survey Scientific Investigations), 42–43.
Siebert, L., Simkin, T., and Kimberly, P. (2011). Volcanoes of the world. 3rd. Berkeley, CA, USA: University of California Press.
Smith, R. B., and Braile, L. W. (1994). The Yellowstone hotspot. J. Volcanol. Geotherm. Res. 61 (3), 121–187. doi:10.1016/0377-0273(94)90002-7
Smith, R. B., Jordan, M., Steinberger, B., Puskas, C. M., Farrell, J., Waite, G. P., et al. (2009). Geodynamics of the Yellowstone hotspot and mantle plume: Seismic and GPS imaging, kinematics, and mantle flow. J. Volcanol. Geotherm. Res. 188 (1), 26–56. doi:10.1016/j.jvolgeores.2009.08.020
Takahashi, M., Kominami, M., Nemoto, Y., Hasegawa, Y., Nagai, T., Tanaka, H., et al. (2003). Whole-rock chemistry for eruptive products of Fuji Volcano, Central Japan: summary of analytical data of 847 samples. Proc. Inst. Nat. Sci. Nihon Univ. 38, 117–166.
Tanguy, J. C., Condomines, M., Le Goff, M., Chillemi, V., La Delfa, S., and Patanè, G. (2007). Mount Etna eruptions of the last 2,750 years: revised chronology and location through archeomagnetic and 226Ra-230Th dating. Bull. Volcanol. 70, 55–83. doi:10.1007/s00445-007-0121-x
Vidal, C. M., Komorowski, J.-C., Metrich, N., Pratomo, I., Kartadinata, N., Prambada, O., et al. (2015). Dynamics of the major plinian eruption of Samalas in 1257 A.D. (Lombok, Indonesia). Bull. Volcanol. 77, 73. doi:10.1007/s00445-015-0960-9
Widiwijayanti, C. (2022a). Manual input for Fuji volcano. Singapore: DR-NTU. (Data), V1, UNF:6:HzRR1iLsKqFU8riTqx+WGQ== [fileUNF]. doi:10.21979/N9/U6ITDJ
Widiwijayanti, C. (2022c).Singapore: DR-NTU. (Data), V1, UNF:6:6rthx6JRG1SToxgtM/WQpQ== [fileUNF]. doi:10.21979/N9/PC4H7WManual Input for Merapi volcano, Indonesia
Widiwijayanti, C. (2022b). Singapore: DR-NTU. (Data), V1, UNF:6:20XjBFj/3kxHOqgiNdGqkw== [fileUNF]. doi:10.21979/N9/O9J9LCManual Input for Rinjani (Samalas) volcano, Indonesia
Winter, J. (2001). An introduction to igneous and metamorphic petrology. Upper Saddle River, NJ, USA: Prentice-Hall, 697.
Yamamoto, T. (2011). Origin of the sequential Shirakawa ignimbrite magmas from the Aizu caldera cluster, northeast Japan: evidence for renewal of magma system involving a crustal hot zone. J. Volcanol. Geotherm. Res. 204, 91–106. doi:10.1016/j.jvolgeores.2011.01.009
Yamamoto, T., Ishizuka, Y., and Takada, A. (2007). “Surface and subsurface geology at the southwestern foot of Fuji volcano,” in Japan: New stratigraphy and chemical variations of the products. Editors S. Aramaki, T. Fujii, S. Nakada, and N. Miyaji (Volcano, Japan: Yamanashi Instit. Environ. Sci.), 97–118. Fuji Volcano.
Yamamoto, T., Nakano, S., and Ishizuka, Y. (2021). Temporal variations of magma composition, eruption style and rate at Fuji Volcano, Japan. Earth Planets Space 73, 169. doi:10.1186/s40623-021-01505-1
Keywords: geochemical composition, major elements, volcanic rocks, eruption, data integration, interactive tools
Citation: Oggier F, Widiwijayanti C and Costa F (2023) Integrating global geochemical volcano rock composition with eruption history datasets. Front. Earth Sci. 11:1108056. doi: 10.3389/feart.2023.1108056
Received: 25 November 2022; Accepted: 24 February 2023;
Published: 21 March 2023.
Edited by:
Pablo Samaniego, UMR6524 Laboratoire Magmas et Volcans (LMV), FranceReviewed by:
Diego F. Narváez, Escuela Politécnica Nacional, EcuadorCopyright © 2023 Oggier, Widiwijayanti and Costa. This is an open-access article distributed under the terms of the Creative Commons Attribution License (CC BY). The use, distribution or reproduction in other forums is permitted, provided the original author(s) and the copyright owner(s) are credited and that the original publication in this journal is cited, in accordance with accepted academic practice. No use, distribution or reproduction is permitted which does not comply with these terms.
*Correspondence: Frédérique Oggier, ZnJlZGVyaXF1ZUBudHUuZWR1LnNn
Disclaimer: All claims expressed in this article are solely those of the authors and do not necessarily represent those of their affiliated organizations, or those of the publisher, the editors and the reviewers. Any product that may be evaluated in this article or claim that may be made by its manufacturer is not guaranteed or endorsed by the publisher.
Research integrity at Frontiers
Learn more about the work of our research integrity team to safeguard the quality of each article we publish.