- 1College of Ocean and Meteorology, Guangdong Ocean University, Zhanjiang, China
- 2South China Sea Institute of Marine Meteorology, Guangdong Ocean University, Zhanjiang, China
Using reanalysis data from the ECMWF and Hadley Centre of the UK Meteorological Office, the present study analyzes the relationship between Indian Ocean Dipole (IOD) in the previous autumn (September–November) and South China Sea Summer (June–August) Monsoon (SCSSM) from 1951 to 2021. It is found that the relationship between the two indices was significantly enhanced from the late 1970s to the beginning of the 21st century, with a significant resonance cycle of 2–4a. The previous autumn IOD forced the Gill pattern in the upper troposphere by changing the Sea Surface Temperature Anomaly (SSTA) of the following summer in the Tropical Indian Ocean (TIO), resulting in the anticyclonic circulation anomaly in the Philippine Sea. It eventually alters the southwest monsoon near the South China Sea and the Philippine Sea. However, for a decade or more, as the Pacific Decadal Oscillation (PDO) phase turns from warm to cold and the relationship between El Niño–Southern Oscillation (ENSO) and IOD weakens, the impact of the previous autumn IOD on Indian Ocean SSTA in the summer of the following year weakens, resulting in a decrease in the correlation between the previous autumn IOD and SCSSM. The impact of the previous autumn’s Indian Ocean SSTA on the following year’s SCSSM is more considered in terms of the eastern Bay of Bengal and the Somali Sea basin. In addition, during the warm phase of PDO, the IOD of the previous autumn can cause abnormal summer precipitation in South China by strengthening or weakening the Western Pacific Subtropical High (WPSH) of the following summer, but there is no significant effect in the cold phase of PDO.
1 Introduction
Since Saji et al. (1999) first proposed Indian Ocean Dipole (IOD), its climate effects have attracted more and more attention from researchers (Xiao et al., 2009; Jiang et al., 2021). The Sea Surface Temperature Anomaly (SSTA) at the east and west poles of IOD will not only cause abnormally land temperature and precipitation in countries west and east of the Indian Ocean but also affect climatic factors in many parts of Asia through teleconnection pattern (Saji and Yamagata, 2003). For example, in 1994, the positive IOD event caused climate anomalies in East Asia through Rossby waves (Guan and Yamagata, 2003). Extreme positive IOD in 2019 led to extreme warm anomalies in East Asia in the boreal winter and extreme plum rains in East Asia in the early boreal summer of 2020 (Doi et al., 2020; Takaya et al., 2020; Zhou et al., 2021).
IOD and the Asian monsoon interact with each. The Asian monsoon circulation provides a favorable state for the development of IOD (Xiang et al., 2011). IOD can directly affect the Asian summer monsoon by affecting the lower tropospheric wind, and can also indirectly affect the Asian summer monsoon by affecting the Tibetan high in the upper troposphere and the Northwest Pacific subtropical high (Li and Mu, 2001).
The South China Sea is located in the center of the Asian-Australian monsoon zone. The South China Sea summer monsoon (SCSSM) is the link between the four monsoon subsystems of subtropical East Asia (EA) monsoon, tropical Indian monsoon, Northwest Pacific (WNP) monsoon, and Australian monsoon (Wang et al., 2009). The onset of the SCSSM marks the transition of atmospheric circulation in Asia from a winter to a summer one and the onset of a massive summer monsoon on the EA and WNP at the same time (Tao and Chen 1987; Lau and Yang, 1997). El Niño–Southern Oscillation (ENSO) is critical to SCSSM as the strongest interannual variation signal in a sea-air coupling system. In the warm phase of ENSO, the onset of SCSSM in this year and the next year was late, while in the cold phase, the onset of SCSSM was earlier (Tao and Zhang, 1998; Chen et al., 2018). In recent years, Ding et al. (2016) found that the decadal shift in the onset date of SCSSM is affected by the decadal difference between the eastern Pacific (EP) type and the central Pacific (CP) type ENSO. Although the interannual variability of Sea Surface Temperature (SST) in the tropical Indian Ocean (TIO) is much smaller than in the Pacific Ocean, its impact on the SCSSM is also crucial. IOD and SCSSM are closely related, and their physical connection has been extensively studied. Yan et al. (2005) used the IAP AGCM-II, an atmospheric circulation model, to show that in the absence of the influence of SSTA in the equatorial eastern Pacific Ocean during the simple positive IOD phase, the southwest summer monsoon in East Asia broke out late, and there was a clear westerly wind response from the eastern Bay of Bengal to the South China Sea, which strengthened the Indian summer monsoon and the SCSSM. From the perspective of SCSSM onset pentad, Yuan et al. (2008a) pointed out that the SCSSM onset was late in the next year of the negative IOD year, and there was no obvious abnormality in the positive IOD year. In addition, if the extreme positive IOD event reaches a strong intensity before the onset of the SCSSM of the same year, positive IOD can weaken the Indian Ocean summer monsoon circulation and the upper South China Sea monsoon flow, and develop an abnormal anticyclone in the TIO, thereby hindering the advance of the southwest monsoon in the Indian Ocean to the South China Sea, making the SCSSM onset late in the year (Yuan and Li, 2009). However, under normal circumstances, IOD begins to develop in summer and matures in autumn, so the strength of the Asian summer monsoon may determine the phase and intensity of IOD in that year. The IOD in the early stage may affect the intensity of the SCSSM. As pointed out by Li et al. (2007) study, the intensity of the SCSSM is weakened (enhanced) when positive (negative) IOD mode exists in the TIO in the previous autumn. When the intensity of the SCSSM increases (decreases), a positive (negative) IOD mode appears in the TIO in the autumn of that year.
Several articles have revealed the relationship between IOD and SCSSM and the mechanism of its influence, but in the context of global warming, the mean climate of the TIO will undergo considerable changes. These changes are likely to affect the IOD, e.g., stronger SST warming in the western part of the TIO than in the eastern part, leading to a shift of the convective zone to the west, favoring the westward development of the equatorial easterly wind anomaly, and stimulating non-linear processes that contribute significantly to strong positive IOD events, leading to an increase in the probability of strong positive IOD events (Cai et al., 2013; Cai et al., 2020). Along with the change of climate variability in the Indian Ocean, how will the relationship between the previous autumn IOD and SCSSM change? In this paper, the decadal changes of the influence of the previous autumn IOD on SST and atmospheric circulation in the following summer will be used to explain the reasons for the change in their relationship and their climatic effects.
2 Data and methods
The reanalysis data used in this paper include: 1) monthly mean reanalysis dataset ERA5 from the European Centre for Medium-Range Weather Forecasts (ECMWF) (Hersbach et al., 2020), with a horizontal resolution of 0.25° × 0.25°; 2) monthly mean sea surface temperature dataset HadISST from the Hadley Centre of the UK Meteorological Office (Rayner et al., 2003), horizontal resolution 1.0° × 1.0°. The length of the data used above is 1950–2021, a total of 72 years. The seasons mentioned in the text are relative to the northern hemisphere.
This paper adopts the SCSSM intensity index defined by Wu et al. (2002). It is defined as the normalized southwest wind component of 850 hPa in the South China Sea (5°N–20°N, 105°E–120°E) area in the summer (June—August), with the following formula:
Specifically,
The IOD index is expressed by the difference of the mean SSTA between the tropical West Indian Ocean (10° S-10°N, 50° −70°E) and the tropical Southeast Indian Ocean (10°S-0°, 90°−110°E) in autumn (September-November) as defined by Saji et al. (1999).
The anomalies of all variables in this paper are defined as the deviation from the multi-year average after removing the long-term linear trend. 9a Butterworth high-pass filtering is applied to each dataset to focus on the interannual variability of the SCSSM and previous autumn IOD. The research methods in this paper mainly include wavelet analysis, singular value decomposition (SVD), regression analysis, correlation analysis, and composite analysis. The level of statistical significance in statistical analysis is determined based on the two-tailed p-value of the Student’s t-test.
3 Decadal variation of the correlation between previous autumn IOD and SCSSM
The interannual variation of the time series of the SCSSM index and the previous autumn IOD index is obvious (Figure 1A). To examine the decadal variation of the relationship between the previous autumn IOD and SCSSM, the 21a sliding correlation between SCSSM and the previous autumn IOD index was calculated in this paper for the period 1951–2021. As can be seen from (Figure 1B), the correlation was low (did not pass the 0.05 reliability test) until the 1970s, and after the late 1970s, the correlation value between the two indexes increased to greater than 0.43, showing a significant negative correlation. With the decadal change of the two indices, their 21a sliding correlation coefficients first increased and then decreased. In the early 1990s, the correlation was the strongest. After the late 2000s, the correlation coefficient between the two indices decreased and was not statistically significant. Therefore, according to whether the 21a sliding correlation between the two indexes can pass the 0.05 confidence test, this paper divides the period from 1951 to 2021 into three periods: P1 (1951–1977), P2 (1978–2007) and P3 (2008–2021) to discuss the causes of decadal changes in the correlation between the two indices.
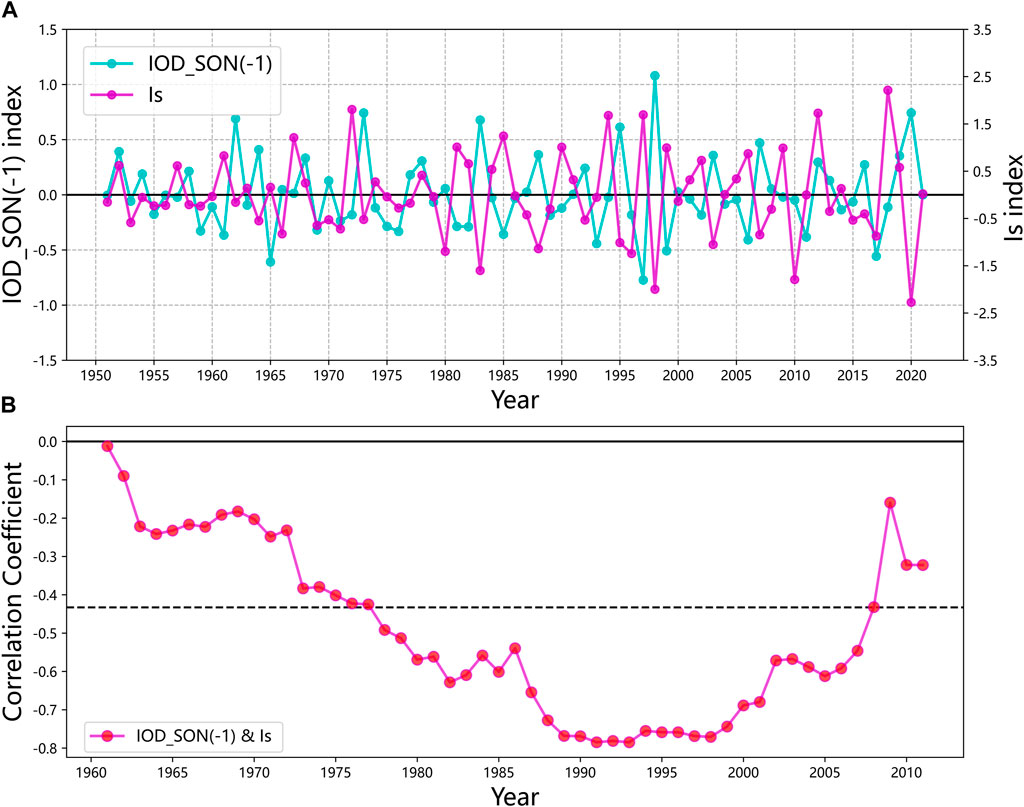
FIGURE 1. (A) Time series of Is and the previous autumn IOD index from 1951 to 2021. (B) The 21a sliding correlation coefficient of the SCSSM index with the previous autumn IOD index (the year in the figure represents the center of the sliding window. The dashed black line indicates the statistical significance level of 0.05 reliability).
4 Possible mechanism analysis
4.1 Periodic analysis
The change in the correlation is determined by the main periodic characteristics of the two-time series and the corresponding bit-phase differences. As can be seen from Figure 2A, the IOD index exhibits mainly a 4-7a cycle from the 1960s to the 1980s, and the cycle was significantly shortened to a 2-5a cycle in the 1990s, with no significant cycle after the 21st century. The SCSSM index had a short quasi-6a cycle from the late 1960s to the early 1970s (Figure 2B), and it mainly exhibited a 2-7a cycle from the late 1970s to the early 2000s, and a 2-4a cycle existed from the late 2000s to the mid-2010s. During the P2, the two indices are closer to each other in the main cycle, and from the wavelet coherence spectrum analysis of the two indices looking at (Figure 3A), in the late 1970s to the early 21st century, there existed a significant resonance cycle of 2-4a opposite bits between the previous autumn IOD and SCSSM. In contrast, during the P1 and P3, there is no significant resonance cycle for the two indices.
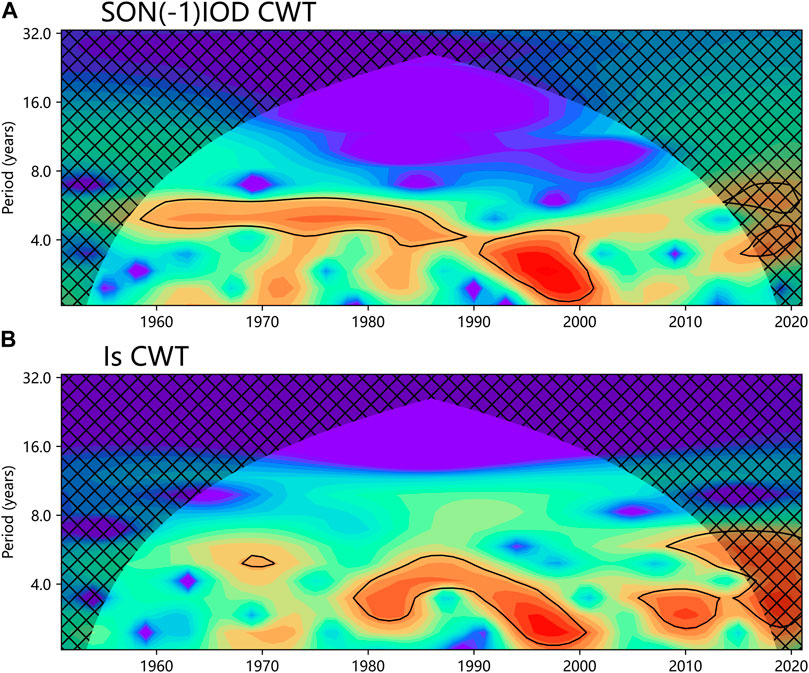
FIGURE 2. Wavelet power spectrum analysis of (A)the previous autumn IOD index (B) the SCSSM index; The range surrounded by a thick solid line is tested by the standard spectrum of red noise at a significance level of 0.05; the inverted U-shape is an influence cone curve (COI), and the power spectrum outside this curve is not considered due to boundary effects.
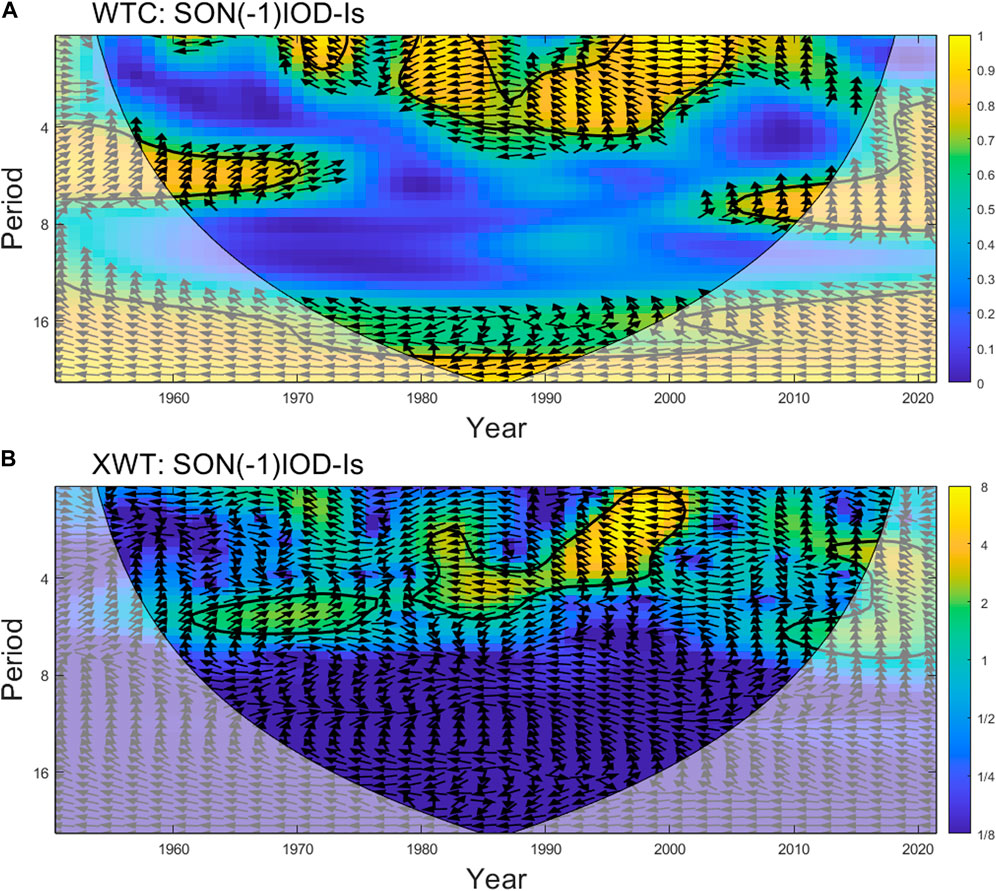
FIGURE 3. (A) Wavelet coherence spectrum (B) cross-wavelet spectrum of the previous autumn IOD and SCSSM index; In the figure, the arrow indicates the relative bit difference, the right arrow indicates that the two change bits are consistent, and the left arrow indicates that the change bits are opposite (The others are the same as Figure 2).
Previous studies have shown that when the Pacific Decadal Oscillation (PDO) is in a warm phase, stronger El Niño events are induced by SSTA in the North Pacific, and the Walker circulation and anticyclonic circulation associated with El Niño events are also strengthened, thus making the ENSO-SCSSM relationship stronger, while in the cold phase of the PDO, stronger La Nina events often cannot be induced (Fan and Fan, 2017). The asymmetric response of the PDO to El Niño and La Niña events leads to a strengthening of the ENSO-SCSSM relationship during the warm PDO phase (P2). The SCSSM with a strengthened relationship with ENSO exhibits a 2-7a cycle similar to ENSO. The period of SCSSM is close to the period of 4-7a and 2-5a of IOD during P2, and they show a resonance period of 2-4a. On the cross-wavelet spectrum (Figure 3B), the period range and time scale of the occurrence of energy extremes also correspond well to the wavelet coherent spectrum.
4.2 SST and atmospheric circulation analysis
To examine the decadal variation of the synergistic relationship between the previous autumn Indian Ocean SSTA and the summer South China Sea 850 hPa wind, the singular value decomposition (SVD) is performed for the summer 850 hPa wind in the South China Sea (5°N–20°N, 105°E–120°E) and the previous autumn Indian Ocean SSTA (30°S–30°N, 30°E–110°E) during the three periods of 1951–1977, 1978–2007 and 2008–2021, respectively. The previous autumn SSTA in the southeastern Arabian Sea and southwestern Bay of Bengal (eastern Bay of Bengal and the Somali Sea basin) in the Indian Ocean have a significant impact on SCSSM during P1 (P3), with a variance contribution of 39.7% (69.1%) (Figures 4A, C). The difference is that the IOD mode in the previous autumn plays a key role for SCSSM during P2 (Figure 4B). The variance contribution rate was as high as 92.2%, which also explained why the correlation between the previous autumn IOD and the SCSSM during P2 was significantly enhanced.
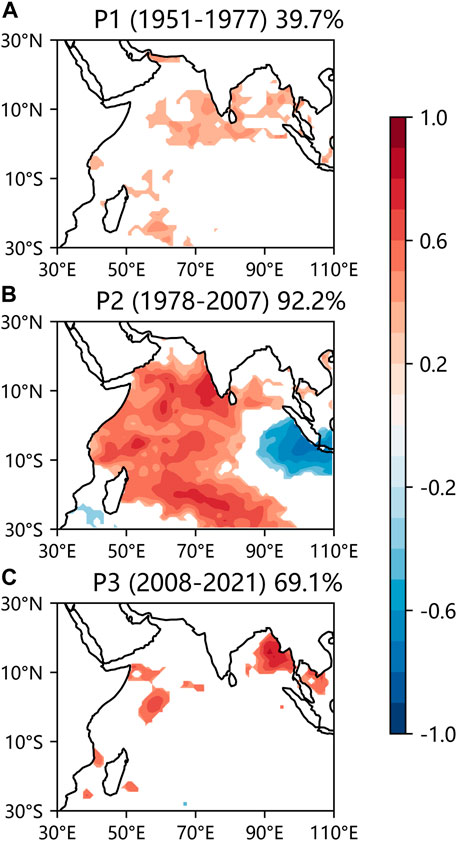
FIGURE 4. The correlation coefficient of the previous autumn Indian Ocean SSTA with the right-field time series of SVD-PC1 during. (A) P1, (B) P2, and (C) P3. The left field used for SVD is: SSTA in the TIO (30°S–30°N, 30°E–110°E) in the previous autumn; The right field is: the 850 hPa wind field anomalies in the summer of the South China Sea (5°N–20°N, 105°E–120°E), only showing the area that passed the 90% significance test (Figures 6–10 is also the same).
There was no significant correlation signal between SCSSM and the TIO( Pacific Ocean) SSTA in the previous autumn during P1 (Figure 5A). During P2 the SCSSM is positively (negatively) correlated with the East (West) Indian Ocean SSTA and negatively (positive) with the East (West) Pacific SSTA. SCSSM was influenced by both IOD and ENSO in the previous autumn (Figure 5B). During P3, the relationship between SCSSM and the Indian Ocean SSTA was not obvious, but the relationship between SCSSM and the Pacific Ocean SSTA was similar to that in P2. It is noteworthy that the largest negative correlation occurs in the central tropical Pacific rather than the eastern tropical Pacific (Figure 5C). The frequency of CP-type El Niño events has been increasing in recent decades (Yu et al., 2012). It reminds us that the influence of CP-type El Niño on SCSSM predominates in two types of El Niño events during P3.
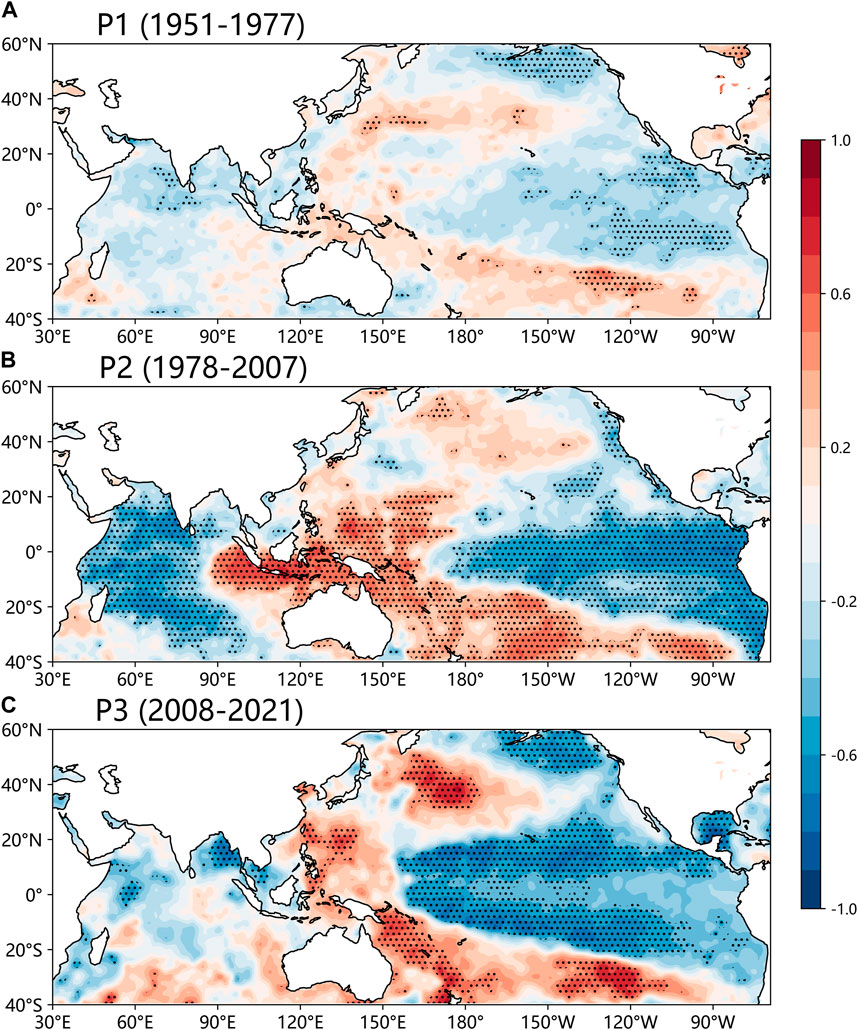
FIGURE 5. Spatial distribution of the correlation coefficients between SCSSM index and SSTA in the previous autumn during (A) P1, (B) P2, and (C) P3. The dotted area indicates that it can pass the 90% significance test.
The positive IOD in the previous autumn during P2 is associated with a significant warm SSTA in the TIO in the following summer. The TIO SST warming will excite an easterly wind anomaly at the low level in the western Pacific and the South China Sea through a remote Gill-type response (Figure 6B) (Gill, 1980). In addition, a warmer TIO SSTA will induce an anomalous reversed Walker circulation over the tropical Indo–Pacific Ocean, which leads to descending motion and hence suppressed convection in the western Pacific. Subsequently, the strengthened Philippine anticyclone pushed westward, obstructing the extension of the Indian Ocean westerly winds to the South China Sea area, and not conducive to the development of the SCSSM (Figure 7B) (Yuan et al., 2008b). A southwesterly wind anomaly at the upper level originates in the maritime continent and crosses the South China Sea and the western Pacific, which favors the maintenance of easterly winds at the low level (Figure 8B). The northeast-southwest trending sea level pressure meridional gradient also contributes to the anticyclonic circulation anomaly at a low level, which further strengthens the low-level easterly wind anomaly (Figure 8B) (Chakravorty et al., 2013). In contrast, during P1 and P3 the effect of the previous autumn IOD on SST and atmospheric circulation in the following summer is not as significant as in P2 (Figures 6A, C–8A, C). The significant difference between P2 and P1 (P3) in the previous autumn IOD was the effect on the SSTA in the TIO. The impact of the previous autumn IOD on TIO SSTA during P2 can continue in the following summer. However, during P1 and P3, the correlation between them has descended rapidly in spring, and has been not significant in summer (Figure 9). TIO SSTA warming has a great impact on the Asian monsoon circulation. Positive precipitation anomalies occur in much of the Indian Ocean basin when TIO SSTA warms (Figure 10B), forcing Gill patterns in the upper troposphere and weakening of the southwest monsoon near the South China Sea and the Philippine Sea. Abnormal anticyclonic circulation was formed over the subtropical northwest Pacific Ocean in coordination with the negative precipitation anomaly in the Northwest Pacific Ocean, and finally weakened the South China Sea summer monsoon (Yang et al., 2007; Xie et al., 2009; Xie et al., 2010).
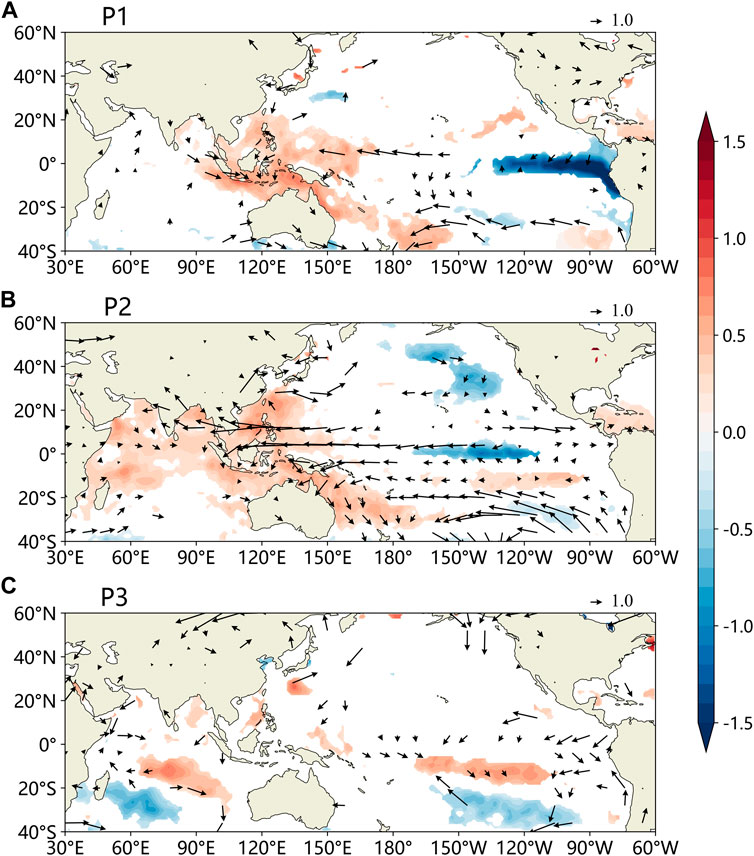
FIGURE 6. Regression coefficient of the previous autumn IOD index projected to the SSTA (shadows; Unit: °C) and 850 hPa wind anomalies (vector; Unit: m/s) in the summer during (A) P1, (B) P2 and (C) P3.
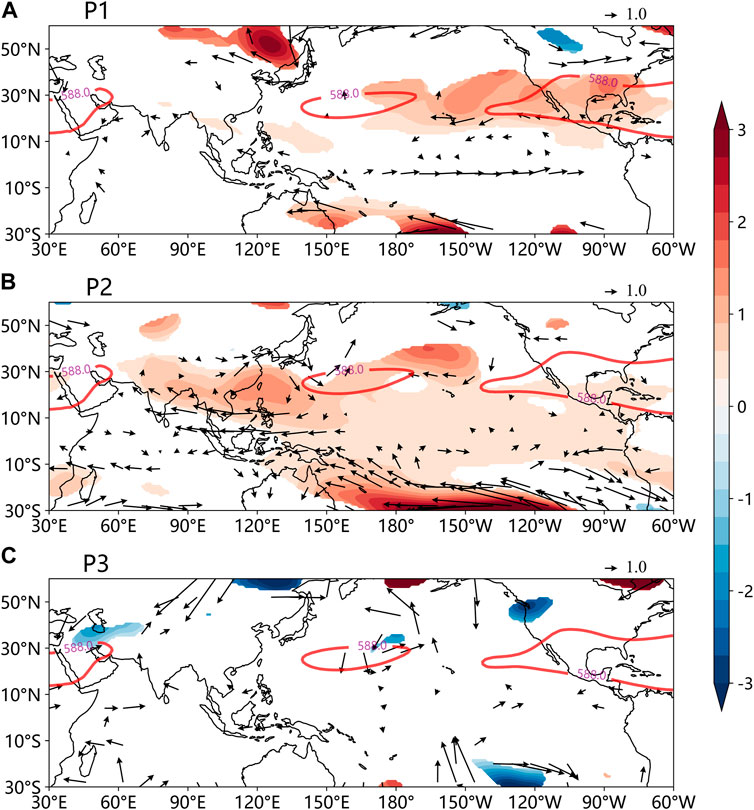
FIGURE 7. Regression coefficient of the previous autumn IOD index projected to the 500 hPa potential height anomalies (shadow; Unit: 10gpm) and 500 hPa wind anomalies (vector; Unit: m/s) in the summer during (A) P1, (B) P2 and (C) P3. (The red contours show the 588gpm contours of the multi-year average).
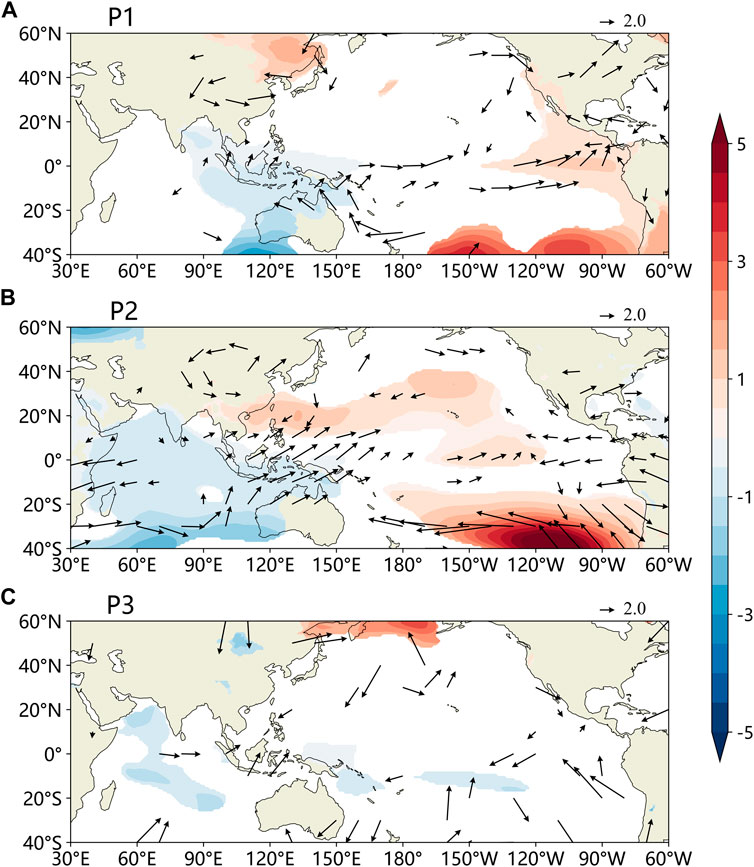
FIGURE 8. Regression coefficient of the previous autumn IOD index projected to the sea level pressure anomalies (shadows; Unit: hPa) and 200 hPa wind anomalies (vector; Unit: m/s) in the summer during (A) P1, (B) P2 and (C) P3.
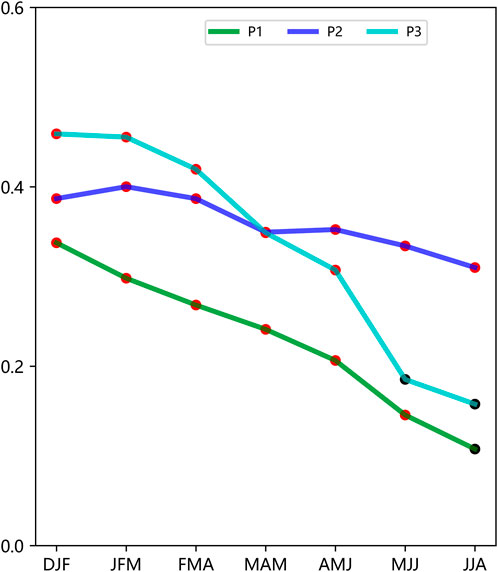
FIGURE 9. Regression coefficient of the previous autumn IOD index projected to the regional mean SSTA in the TIO (10°S–20°N, 30°–110°E) from the previous winter to the following summer. A red dot indicates a pass of the 90% significance test, and a black dot indicates a failure.
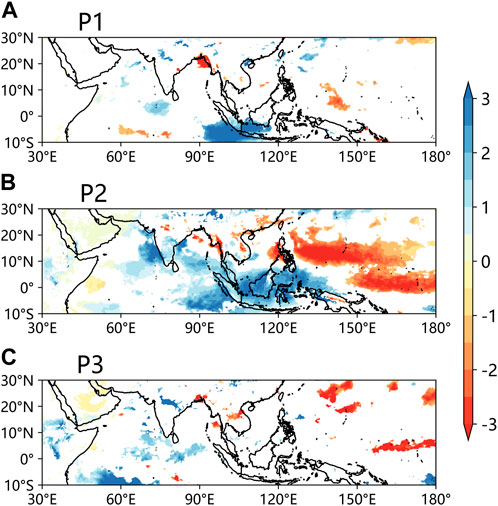
FIGURE 10. Regression coefficient of the previous autumn IOD index projected to the precipitation anomalies (shadows; Unit: mm) in the summer during (A) P1, (B) P2, and (C) P3.
There are two reasons for the decadal shift in the relationship between the previous autumn IOD and SCSSM. On the one hand, it has been shown that the Indian Ocean does not have an independent decadal mode. PDO is one of the sources of its decadal variability (Krishnamurthy and Krishnamurthy, 2016; Xie et al., 2021), which changed from a cold to a warm phase in the late 70s of the 20th century, and to a cold phase in the early 21st century (Mantua and Hare, 2002; Grassi et al., 2012). To examine the difference in the atmospheric circulation of the summer of the following year of IOD under different phases of the PDO, the IOD index of 71a (1950–2020) greater than (less than) 0.6 standard deviations was selected as positive (negative) IOD years (Table 1). To maintain the coordination of positive and negative IOD event ratios, the event samples from the cold phase of PDO are combined and discussed. Under the cold phase of PDO, there are no significant wind anomalies in the western Pacific and South China Sea (Figures 11A, B). In the summer following the positive (negative) IOD of the warm phase of the PDO, the western Pacific and South China Sea regions showed significant easterly (westerly) wind anomalies(Figures 11C, D), weakening (strengthening) the SCSSM. Under different PDO phases, the summer zonal wind anomalies of 850 hPa following positive (negative) IOD events differed significantly in the Western Pacific and South China Sea regions (Figures 11E, F). The warm phase of PDO strengthened the relationship between the previous autumn IOD and the SCSSM.

TABLE 1. The positive and negative IOD years of the previous year for P1(1951–1977), P2 (1978–2007), and P3 (2008–2021).
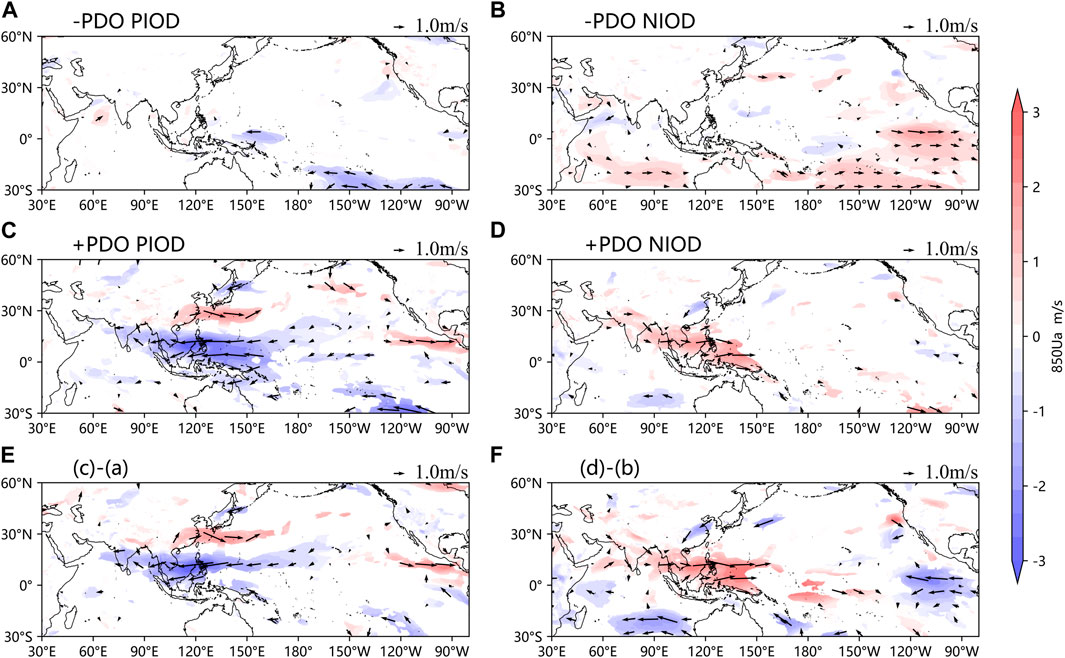
FIGURE 11. (A,B) Under the PDO cold phase, (C,D) PDO warm phase (A,C) positive IOD, (B,D) negative IOD 850 hPa wind anomaly in the following summer (vector; Unit: m/s); PDO cold and warm phase (E) positive IOD (F) negative IOD 850 hPa wind anomaly difference in the following summer (vector; Unit: m/s); Colour shade indicates latitudinal wind anomalies.
On the other hand, the decadal variation of the relationship between SCSSM and IOD in the autumn of the previous year is influenced by the relationship between IOD and ENSO. Although the Indian Ocean Dipole Model (IODM) and Indian Ocean Basin Model (IOBM) have different spatial distributions and life histories, they are not independent of each other, there is a process of transformation from IODM to IOBM (Du, 2006). The process of the transition from IODM to IOBM is influenced by the decadal transition of the relationship between IOD and ENSO. In the period of high correlation between IOD and ENSO, the transition is significant, while in the period of low correlation, there is almost no transition phenomenon (Guo and Wu, 2022). During P2, the Walker circulation on the Maritime Continent was enhanced and the rising motion increased, which further increased the SST connection between the eastern Indian Ocean and the Western Pacific Ocean, resulting in the enhanced IOD-ENSO relationship, the correlation coefficient between the previous autumn IOD index and the previous winter Nino3.4 index was 0.78, which could pass the 99% significance test (Yuan and Li, 2008). Therefore, during P2, the transition process from autumn IODM to spring-summer IOBM is also more significant, strengthening the relationship between the previous autumn IOD and SCSSM. However, during P1(P3) the correlation coefficient between the previous autumn IOD index and the previous winter Nino 3.4 index was 0.49 (0.51), which could pass the 99% (90%) significance test. The conversion from IODM to IOBM was not significant, and the correlation between IOD and SCSSM decreased.
5 Conclusion and discussion
In the past 71 years, with the phase conversion of PDO and the change of the relationship between IOD and ENSO, the relationship between the previous autumn IOD and SCSSM has changed decadal. It strengthened in the late 1970s and weakened in the late 2000s. The decadal changes in their relationship may be related to the decadal changes in their cycles and the effects of the previous autumn IOD on TIO SSTA and atmospheric circulation in the following summer. From the late 1970s to the beginning of the 21st century, under the coordination of the warm PDO phase and El Niño, the main period of the two indices was similar. There existed a significant resonance cycle of 2-4a opposite bits between the previous autumn IOD and SCSSM. The previous autumn IOD forced the Gill pattern in the upper troposphere by altering the SSTA of TIO of the following summer, resulting an anomaly anticyclonic circulation in the Philippine Sea and eventually altering the southwest monsoon near the surface of the South China Sea and the Philippine Sea. In addition, the previous autumn IOD also induced a northeast-southwest trend sea level pressure meridional gradient over the tropical Indian Ocean and the northwest Pacific Ocean in the following summer, thus promoting low-level anticyclonic circulation anomalies and further strengthening the low-level easterly wind anomaly. In such a circulation configuration, the correlation between the previous autumn IOD and SCSSM is strengthened during P2. However, for a decade or more, with the phase conversion of PDO and the change of the relationship between IOD and ENSO, the influence of the previous autumn IOD on the TIO SSTA of the next summer has weakened, and the atmospheric circulation anomalies affected by TIO SST are not as significant as in the P2, resulting in a decrease in the correlation between the previous autumn IOD and SCSSM. The impact of the previous autumn’s Indian Ocean SSTA on the SCSSM is more considered in terms of the eastern Bay of Bengal and the Somali Sea basin.
It is worth mentioning that the previous autumn IOD had a significant impact on the precipitation in South China in summer of the following year during P2. It can be explained by the two-stage thermal adaptation theory proposed by Wu et al. (2000). According to the first level of thermal adaptation: sensible heat heating adaptation, the SSTA of the central equatorial Indian Ocean (Figure 6B) increases the evaporation of water vapor and the sea-air temperature difference, resulting in an abnormal increase in sensible heat heating, and a cyclonic circulation appears in the near strata whose eastern region developing abnormal southerly winds carried large amounts of water vapor to the north. Finally, a positive precipitation anomaly was produced in the eastern Bay of Bengal (Figure 10B). According to the secondary thermal adaptation: latent heat heating adaptation, abnormal precipitation in the eastern Bay of Bengal extends northeast with deep convective latent heat heating. At this time, in the lower and middle troposphere, due to the increase of heating with height, southerly winds develop. Eventually, the 500 hPa Western Pacific Subtropical High (WPSH) strengthened to the east of the heating zone, namely, the South China Sea and the Western Pacific region (Figure 7B). Previous studies have suggested that the longitudinal position of the 500 hPa WPSH has an important impact on summer precipitation in China, when the high ridge extends westward (retreats eastward), South China will have less (more) rainfall (Yang and Sun, 2003). The westward push of the WPSH during P2 controlled South China, and the easterly wind in the south of it abnormally blocked the water vapor transported from the Bay of Bengal to South China, combined with the diverging flow in the mid- and low-level troposphere (Yuan et al., 2008a). As a result, South China has less rainfall (Figure 10B). Therefore, in the warm phase of PDO, IOD in the previous autumn can cause summer precipitation anomalies in South China by strengthening or weakening the 500 hPa WPSH in the following summer, but in the cold phase of PDO, there is no significant effect.
Li et al. (2007) showed that in the warm phase of PDO, the effect of the previous autumn IOD on SCSSM was achieved by affecting anomalous trans-equatorial airflow west of Sumatra. The results of this study further show that in the warm phase of PDO, the influence of the previous autumn IOD on SCSSM can also be realized by influencing the abnormal zonal winds in the western Pacific and South China Seas caused by TIO SSTA. From previous studies, it can be seen that IOD events interact with ENSO, and ENSO and IOD interact mainly through the Walker circulation anomaly coupled between the TIO and the tropical Pacific Ocean and the associated ocean fluctuation processes (Zhang and Tan, 2003; Luo et al., 2010; Wang, 2019; Yue et al., 2021). ENSO affects SCSSM through Walker circulation and WPSH anomalies (Zhou and Chan, 2007; Hu et al., 2020). Although we reveal the possible mechanism by which the previous autumn IOD affects SCSSM and its decadal variation, our results are not independent effects of IOD on SCSSM. In the next step, the removal of ENSO signals can be considered to study the influence mechanism of pure IOD on SCSSM and its decadal changes. In addition, the results of this study are based on a statistical analysis of reanalysis data, and the results can be further verified by climate models in future studies.
Data availability statement
Publicly available datasets were analyzed in this study. This data can be found here: https://cds.climate.copernicus.eu/cdsapp#!/search?type=dataset https://www.metoffice.gov.uk/hadobs/index.html.
Author contributions
MZ was responsible for the study conception, manuscript writing,and figure development. FX provided guidance and funding support. SL were responsible for discussion and manuscript revision. YL, JY, and SZ were contributed to the conception and design of the work.
Funding
This study was supported by the Special Project for Research and Development in Key area of Guangdong Province (Grant 2020B0101130021) and the National Key Research and Development Program of China (Grant 2018YFC1506902).
Acknowledgments
The authors would like to thank the funding agencies and the team of ECMWF/ Hadley Centre of the UK Meteorological Office for making this study possible. We would also like to thank the editors and the reviewers for their valuable suggestions.
Conflict of interest
The authors declare that the research was conducted in the absence of any commercial or financial relationships that could be construed as a potential conflict of interest.
Publisher’s note
All claims expressed in this article are solely those of the authors and do not necessarily represent those of their affiliated organizations, or those of the publisher, the editors and the reviewers. Any product that may be evaluated in this article, or claim that may be made by its manufacturer, is not guaranteed or endorsed by the publisher.
References
Cai, W., Yang, K., Wu, L., Huang, G., Santoso, A., Ng, B., et al. (2020). Opposite response of strong and moderate positive Indian Ocean Dipole to global warming. Nat. Clim. Change 11, 27–32. doi:10.1038/s41558-020-00943-1
Cai, W., Zheng, X.-T., Weller, E., Collins, M., Cowan, T., Lengaigne, M., et al. (2013). Projected response of the Indian Ocean Dipole to greenhouse warming. Nat. Geosci. 6, 999–1007. doi:10.1038/ngeo2009
Chakravorty, S., Chowdary, J. S., and Gnanaseelan, C. (2013). Spring asymmetric mode in the tropical Indian ocean: Role of El Niño and IOD. Clim. Dyn. 40, 1467–1481. doi:10.1007/s00382-012-1340-1
Chen, W., Ding, S., Feng, J., Chen, S., Xue, X., and Zhou, Q. (2018). Progress in the study of impacts of different types of ENSO on the East Asian monsoon and their mechanisms. Chin. J. Atmos. Sci. 42 (3), 640–655. (in Chinese). doi:10.3878/j.issn.1006-9895.1801.17248
Ding, S., Wen, Z., and Chen, W. (2016). Interdecadal change in the relationship between the South China Sea summer monsoon onset and two types of Pacific sea surface temperature anomaly. Chin. J. Atmos. Sci. 40 (2), 243–256. (in Chinese). doi:10.3878/j.issn.1006-9895.1507.15102
Doi, T., Behera, S. K., and Yamagata, T. (2020). Wintertime impacts of the 2019 super IOD on East Asia. Geophys. Res. Lett. 47, e2020GL089456. doi:10.1029/2020GL089456
Du, Z., Tan, Y., Zhang, R., He, J., and Liu, H. (2006). Two modes of Sea Surface temperature anomalies in the tropical Indian ocean: Monopole, dipole and their interactions. Chin. J. of Atmos. Sci. 30 (1), 11–24. (in Chinese).
Fan, Y., and Fan, K. (2017). Pacific decadal oscillation and the decadal change in the intensity of the interannual variability of the South China Sea summer monsoon. Atmos. Ocean. Sci. Lett. 10, 162–167. doi:10.1080/16742834.2016.1256189
Gill, A. E. (1980). Some simple solutions for heat-induced tropical circulation. Q. J. R. Meteorological Soc. 106 (449), 447–462. doi:10.1002/qj.49710644905
Grassi, B., Redaelli, G., Canziani, P. O., and Visconti, G. (2012). Effects of the PDO phase on the tropical belt width. J. Clim. 25, 3282–3290. doi:10.1175/JCLI-D-11-00244.1
Guan, Z., and Yamagata, T. (2003). The unusual summer of 1994 in East Asia: IOD teleconnections. Geophys. Res. Lett. 30. doi:10.1029/2002GL016831
Guo, P., and Wu, Q. (2022). Interdecadal variation of transition from Indian Ocean Dipole to Indian Ocean Basin mode and its causes. Trans. Atmos. Sci. 45, 562–572. (in Chinese). doi:10.13878/j.cnki.dqkxxb.20200113009
Hersbach, H., Bell, B., Berrisford, P., Hirahara, S., Horányi, A., Muñoz-Sabater, J., et al. (2020). The ERA5 global reanalysis. Q. J. R. Meteorological Soc. 146, 1999–2049. doi:10.1002/qj.3803
Hu, P., Chen, W., Chen, S., Liu, Y., and Huang, R. (2020). Extremely early summer monsoon onset in the South China Sea in 2019 following an El Niño event. Mon. Weather Rev. 148, 1877–1890. doi:10.1175/MWR-D-19-0317.1
Jiang, J., Liu, Y., and Li, J. (2021). Indian Ocean Dipole:a review and perspective. Adv. Earth Sci. 36, 579–591. (in Chinese). doi:10.11867/j.issn.1001-8166.2021.066
Krishnamurthy, L., and Krishnamurthy, V. (2016). Decadal and interannual variability of the Indian Ocean SST. Clim. Dyn. 46, 57–70. doi:10.1007/s00382-015-2568-3
Lau, K. M., and Yang, S. (1997). Climatology and interannual variability of the southeast Asian summer monsoon. Adv. Atmos. Sci. 14, 141–162. doi:10.1007/s00376-997-0016-y
Li, C., and Mu, M. (2001). The dipole in the equatorial Indian Ocean and its impacts on climate. Chin. J. of Atmos. Sci. 25, 433–443. (in Chinese).
Li, D., Zhang, G., Zhu, Y., Tan, Y., and Wang, X. (2007). Relationships between autumn Indian Ocean Dipole Mode and the strength of SCS summer monsoon. J. Trop. Meteorology 13 (1), 29–32.
Luo, J.-J., Zhang, R., Behera, S. K., Masumoto, Y., Jin, F.-F., Lukas, R., et al. (2010). Interaction between El Niño and extreme Indian Ocean Dipole. J. Clim. 23, 726–742. doi:10.1175/2009JCLI3104.1
Mantua, N. J., and Hare, S. R. (2002). The pacific decadal oscillation. J. Oceanogr. 58, 35–44. doi:10.1023/A:1015820616384
Rayner, N. A., Parker, D. E., Horton, E. B., Folland, C. K., Alexander, L. V., Rowell, D. P., et al. (2003). Global analyses of sea surface temperature, sea ice, and night marine air temperature since the late nineteenth century. J. Geophys. Res. Atmos. 108, 4407. doi:10.1029/2002JD002670
Saji, N. H., Goswami, B. N., Vinayachandran, P. N., and Yamagata, T. (1999). A dipole mode in the tropical Indian Ocean. Nature 401, 360–363. doi:10.1038/43854
Saji, N. H., and Yamagata, T. (2003). Possible impacts of Indian Ocean Dipole mode events on global climate. Clim. Res. 25, 151–169. doi:10.3354/cr025151
Takaya, Y., Ishikawa, I., Kobayashi, C., Endo, H., and Ose, T. (2020). Enhanced meiyu-baiu rainfall in early summer 2020: Aftermath of the 2019 super IOD event. Geophys. Res. Lett. 47, e2020GL090671. doi:10.1029/2020GL090671
Tao, S., and Chen, L. (1987). A review of recent research on the East Asian summer monsoon in China. Monsoon Meteorol., 60–92.
Tao, S., and Zhang, Q. (1998). Response of the asian winter and summer monsoon to ENSO events. Sci. Atmos. Sin. 22 (4), 300–407. (in Chinese).
Wang, B., Huang, F., Wu, Z., Yang, J., Fu, X., and Kikuchi, K. (2009). Multi-scale climate variability of the South China sea monsoon: A review. Dyn. Atmos. Oceans 47, 15–37. doi:10.1016/j.dynatmoce.2008.09.004
Wang, C. (2019). Three-ocean interactions and climate variability: A review and perspective. Clim. Dyn. 53, 5119–5136. doi:10.1007/s00382-019-04930-x
Wu, G., Liu, P., Liu, Y., and Li, W. (2000). Impacts of the sea surface temperature anomaly in the Indian ocean on the subtropical anticyclone over the Western Pacific—Two stage thermal adaptation in the atmosphere. Acta Meteorol. Sin. 58 (5), 513–522. (in Chinese).
Wu, S., and Liang, J. (2002). Intensity index of South China Sea monsoon and its variation characteristics. J.of Trop. Meteorology 9.
Xiang, B., Yu, W., Li, T., and Wang, B. (2011). The critical role of the boreal summer mean state in the development of the IOD. Geophys. Res. Lett. 38. doi:10.1029/2010GL045851
Xiao, Y., Zhang, Z., and He, J. (2009). Progresses in the studies on Indian ocean dipoles. J. Trop. Meteorology 25 (5), 621–627. (in Chinese).
Xie, S.-P., Du, Y., Huang, G., Zheng, X.-T., Tokinaga, H., Hu, K., et al. (2010). Decadal shift in El Niño influences on indo–western pacific and east asian climate in the 1970s. J. Clim. 23, 3352–3368. doi:10.1175/2010JCLI3429.1
Xie, S.-P., Hu, K., Hafner, J., Tokinaga, H., Du, Y., Huang, G., et al. (2009). Indian ocean capacitor effect on indo–western pacific climate during the summer following El Niño. J. Clim. 22, 730–747. doi:10.1175/2008JCLI2544.1
Xie, T., Li, J., Chen, K., Zhang, Y., and Sun, C. (2021). Origin of Indian ocean multidecadal climate variability: Role of the North atlantic oscillation. Clim. Dyn. 56, 3277–3294. doi:10.1007/s00382-021-05643-w
Yan, X.-Y., and Zhang, M. (2005). Numerical simulation of the influence of Indian Ocean Dipole on climate variations over east Asian monsoon region during equatorial east Pacific Ocean SSTA. J. Trop. Meteorology 11 (1), 60–66.
Yang, H., and Sun, S. (2003). Longitudinal displacement of the subtropical high in the Western Pacific in summer and its influence. Adv. Atmos. Sci. 20, 921–933. doi:10.1007/BF02915515
Yang, J., Liu, Q., Xie, S.-P., Liu, Z., and Wu, L. (2007). Impact of the Indian Ocean SST basin mode on the Asian summer monsoon. Geophys. Res. Lett. 34, L02708. doi:10.1029/2006GL028571
Yu, J.-Y., Lu, M.-M., and Kim, S. T. (2012). A change in the relationship between tropical central Pacific SST variability and the extratropical atmosphere around 1990. Environ. Res. Lett. 7, 034025. doi:10.1088/1748-9326/7/3/034025
Yuan, Y., and Li, C. (2008). Decadal variability of the IOD-ENSO relationship. Chin. Sci. Bull. 53, 1745–1752. doi:10.1007/s11434-008-0196-6
Yuan, Y., and Li, C. (2009). Possible impacts of the tropical Indian Ocean SST anomaly modes on the South China Sea summer monsoon onset. Chin. J. Atmos. Sci. 33 (2), 325–336. (in Chinese).
Yuan, Y., Yang, H., Zhou, W., and Li, C. (2008a). Influences of the Indian Ocean Dipole on the Asian summer monsoon in the following year. Int. J. Climatol. 28, 1849–1859. doi:10.1002/joc.1678
Yuan, Y., Zhou, W., Chan, J. C. L., and Li, C. (2008b). Impacts of the basin-wide Indian Ocean SSTA on the South China Sea summer monsoon onset. Int. J. Climatol. 28, 1579–1587. doi:10.1002/joc.1671
Yue, Z., Zhou, W., and Li, T. (2021). Impact of the Indian Ocean Dipole on evolution of the subsequent ENSO: Relative roles of dynamic and thermodynamic processes. J. Clim. 34, 3591–3607. doi:10.1175/JCLI-D-20-0487.1
Zhang, R., and Tan, Y. (2003). “El Nino and interannual variation of the sea surface temperature in the tropical Indian Ocean,” in Atmospheric and oceanic processes, Dynamics, and climate change (SPIE) (Munich, Germany: European Geosciences Union), 11–17. doi:10.1117/12.466694
Zhou, W., and Chan, J. C. L. (2007). ENSO and the South China Sea summer monsoon onset. Int. J. Climatol. 27, 157–167. doi:10.1002/joc.1380
Keywords: South China Sea summer monsoon (SCSSM), Indian Ocean dipole (IOD), El Niño–Southern oscillation (ENSO), pacific decadal oscillation (PDO), Western Pacific subtropical high (WPSH), tropical Indian Ocean (TIO)
Citation: Zheng M, Xu F, Liu S, Li Y, Zhang S and Yang J (2023) Decadal variation of the relationship between the previous autumn IOD and the South China Sea summer monsoon. Front. Earth Sci. 11:1102887. doi: 10.3389/feart.2023.1102887
Received: 19 November 2022; Accepted: 24 February 2023;
Published: 16 March 2023.
Edited by:
Xing Yuan, Nanjing University of Information Science and Technology, ChinaReviewed by:
Chunsong Lu, Nanjing University of Information Science and Technology, ChinaShengping He, University of Bergen, Norway
Copyright © 2023 Zheng, Xu, Liu, Li, Zhang and Yang. This is an open-access article distributed under the terms of the Creative Commons Attribution License (CC BY). The use, distribution or reproduction in other forums is permitted, provided the original author(s) and the copyright owner(s) are credited and that the original publication in this journal is cited, in accordance with accepted academic practice. No use, distribution or reproduction is permitted which does not comply with these terms.
*Correspondence: Feng Xu, gdouxufeng@126.com
 Meiying Zheng