 Meng Gao
 Gongwen Wang
 Yunchou Xu
 Nini Mou
 Leilei Huang1
 Ling Zuo
- 1School of Earth Sciences and Resources, China University of Geosciences, Beijing, China
- 2MNR Key Laboratory for Exploration Theory & Technology of Critical Mineral Resources, China University of Geosciences, Beijing, China
- 3Beijing Key Laboratory of Land and Resources Information Research and Development, Beijing, China
The Weilasituo-bairendaba district is located at the eastern end of the Central Asian Orogenic Belt, which is an important component of the Cu-Pb-Zn polymetallic metallogenic belt on the Western slope of the Greater Xing’an Range in Inner Mongolia, China. The known Cu-Zn deposits such as the Weilasituo Cu-Zn deposit and the Bairendaba Ag-Pb-Zn deposit are the same tectonic-magmatic product. The district’s structure framework consists of the NE-trending regional faults, while the secondary faults provide channels and space for mineralization. The ore-bearing rocks are either Baoyintu Group gneisses or quartz diorites. The typical Cu-Zn deposits exhibit obvious Cu, Pb, Zn geochemical anomaly as well as obvious magnetic anomaly. The district-scale two-dimensional (2D) mineral prospectivity modeling has been reported. Nowadays, three-dimensional (3D) mineral prospectivity modeling is necessary and urgent. Integrated deposit geology and accumulated exploration data, the above four exploration criteria (regional fault, secondary fault, geochemical anomaly and magnetic susceptibility) are used for 3D mineral prospectivity modeling. Filtering (upward continuation, low pass filtering, two-dimensional empirical mode decomposition), magnetic inversion and 3D modeling techniques were used to construct geological models. Excellent machine learning algorithms such as random forest (RF) and XGBoost are applied. The two machine learning methods confirm each other to improve the accuracy of 3D mineral prospectivity modeling. In this paper, repeated random sampling and Bayesian optimization are combined to construct and tune models. This joint method can avoid the contingency caused by random sampling of negative samples, and can also realize automatic optimization of hyperparameters. The optimal models (RF28 and XGBoost11) were selected among thirty repeated training models for mineral prospectivity modeling. The obtained areas under the ROC curves of RF28 and XGBoost11 were 0.987 and 0.986, respectively. The prediction-area (P-A) plot and C-A fractal were used to delineate targets and grade targets. The targets were divided into Ⅰ-level targets and Ⅱ-level targets. The I- and II-targets are not only highly consistent with the known Cu-Zn deposits, but also exhibit obvious ore-forming geological features. The 3D targets are beneficial for Cu-Zn exploration in the Weilasituo-bairendaba district.
1 Introduction
With the development of computational technology and the continuous accumulation of geosciences datasets, mineral exploration has developed from near-surface to subsurface, from 2D to 3D, from qualitative to quantitative (Yuan et al., 2019; Zhang Z Q et al., 2021). 3D mineral prospectivity modeling is developed based on the 3D geological modeling and they are both widely applied in the mineral exploration (Houlding, 1994; Li et al., 2015; Xiao et al., 2015; Li et al., 2016; Wang G W et al., 2017; Yang et al., 2017; Mao et al., 2019; Wang et al., 2021; Zhang Z Q et al., 2021; Gao et al., 2023). Since the 1990s, various knowledge- and data-driven learning models have been applied to conduct mineral prospectivity modeling. Knowledge-driven methods include evidential belief functions (An et al., 1992) and fuzzy logic (Bonham-Carter, 1994). Data-driven learning methods include the WofE model, the fuzzy WofE model, neural networks, random forests (RF), logistic regression, support vector machines, the certainty factor model, evidence theory and the prospecting cost–benefit strategy (Zuo and Carranza, 2011; Li et al., 2015; Xiao et al., 2015; Li et al., 2016; Zhang et al., 2016; Hariharan et al., 2017; Yang et al., 2017; Wang et al., 2021; Zhang C J et al., 2021). Based on the supervised algorithms, some derivative algorithms such as the semi-supervised random forests, one-class support vector machine and isolation forest have occurred (Chen and Wu, 2017; Chen and Wu, 2019; Wang et al., 2020). RF and XGBoost (Chen and Guestrin, 2016) with excellent performance were used as the base learners of bagging-based positive–unlabeled learning algorithm (Zhang Z Q et al., 2021; Gao et al., 2023). In addition, deep learning is outstanding in the field of 2D mineral exploration (Zuo et al., 2019; Yang et al., 2023) and has been applied to 3D mineral exploration (Li et al., 2021).
Machine learning algorithms can be widely used in deposit-, camp- and district-scale 3D mineral prospectivity modeling (Wang G W et al., 2017; Wang et al., 2021; Zhang C J et al., 2021; Gao et al., 2023). RF and XGBoost performs better in district-scale 3D mineral prospectivity modeling (Zhang Z Q et al., 2021; Gao et al., 2023). The key steps of mineral prospectivity modeling by machine learning algorithms are negative sample selection and hyperparameter tuning. The barren drilling locations and with little metallogenic potential judge by geologists can be selected as the negative training samples (Zuo et al., 2019). However, considering the depth beyond the control of drilling and the variability of geological conditions in deep space, it is obvious that the above methods also have subjective factors in 3D mineral exploration. The optimization methods of parameters include grid search, random search and Bayesian optimization (Jia et al., 2021). Bayesian optimization is widely used in hyperparameter tuning because of its excellent performance (Jia et al., 2021; Zhang Z Q et al., 2021; Gao et al., 2023). In order to realize the automation of negative sample selection and hyperparameter tuning, bagging method and bayesian optimization algorithm have been applied to mineral prospectivity modeling (Zhang Z Q et al., 2021; Gao et al., 2023).
Random forest (RF) is a typical supervised classification algorithm (Zhang Z Q et al., 2021). RF has been widely used in data classification (Wang et al., 2022), particularly in mineral prospectivity modeling (Carranza and Laborte, 2015a; Carranza and Laborte, 2015b; Gao et al., 2016; Zhang et al., 2016; Wang et al., 2021; Zhang Z Q et al., 2021). XGBoost is an ensemble learning algorithm, which belongs to boosting algorithm (Chen and Guestrin, 2016). It has stable performance (Chen and Guestrin, 2016; Jia et al., 2021). At present, the algorithm has been applied in the field of geoscience, such as lithology classification, mineral prospectivity modeling, slope stability analysis (Merembayev et al., 2018; Bharti et al., 2021; Jia et al., 2021; Zhang et al., 2022).
The previous district-scale mineral prospectivity modeling studies were mainly 2D, but not 3D. Zhang (2017) and Yang (2017) conducted mineral prospectivity modeling for the Pb-Zn polymetallic deposits in the western slope of the southern section of the Greater Xing’an Range (GXAR), and the results show that the Weilasituo-bairendaba district is important to explore Cu-Pb-Zn polymetallic deposits. In this paper, four geological information such as regional faults, secondary faults, magnetic susceptibility, and geochemical anomaly were selected based on the metallogenic geological characteristics and obtained their distribution in 3D space. RF and XGBoost were used for 3D mineral prospectivity modeling. The P-A plot and C-A fractal were used to delineate and grade targets, which are critical in indicating potential Cu-Zn deposits in the district, particularly in deep space.
2 Methodology
2.1 Machine learning
Random forest (RF) is a typical ensemble, which consists of diversified decision trees (Carranza and Laborte, 2015a; Carranza and Laborte, 2015b; Wang et al., 2022). It is also known as a set of hierarchically organized restrictions or conditions based on geological conditions. The first algorithm was proposed by Ho (1995). The bagging method and the Gini index were then used to improve the original RF algorithm (Breiman, 1996; Gini, 1997). The RF algorithm splits the parent node into binary pieces as specific performance. As a result, child nodes are “purer” than parent nodes. The goal is to discover the optimal result to maximize the “purity”. The improved algorithm was used to make repeated predictions from aforementioned parent nodes to child nodes, and the information represented by training data was obtained (Carranza and Laborte, 2015a; Carranza and Laborte, 2015b). RF was developed from bagging (Breiman, 2001). It is notable for its combination of random feature selection (Jia et al., 2021). RF, as a data-driven machine learning method, was used to train data and obtain predictive models. The training data consists of deposit locations and non-deposit locations, which was represented by 1s and 0s (Rodriguez-Galiano et al., 2014). As a result, the predictions produce floating values ranging from 0 to 1. The closer it is to 1, the more potential to prospect (Carranza and Laborte, 2015a; Carranza and Laborte, 2015b).
There are three main ensemble algorithms, namely, bagging, boosting, and stacking. XGBoost belongs to boosting, which uses a set of algorithms to boost machine learners from weak to strong (Freund and Schapire, 1997). The process of XGBoost performance improvement is essentially the introduction and combination of optimization algorithms. XGBoost is optimized by GBDTs algorithm (Jia et al., 2021; Zhang et al., 2022). GBDT is constituted by gradient boosting and decision tree to make the residual gradient drop so as to realize the model performance gradient improvement (Jia et al., 2021). The classification and regression trees (CART) utilizes the decision tree to handle regression and classification issues with each specific and continuous variable (Bharti et al., 2021). Both XGBoost and GBDT follow the principle of gradient enhancement, but XGBoost performance is enhanced to effectively prevent over-fitting (Chen and Guestrin, 2016; Zhang et al., 2022).
The known ore bodies of Weilasituo Cu-Zn deposit and Bairendaba Ag-Pb-Zn deposit are positive samples. An equal number of samples were randomly selected from the remaining geological bodies as negative samples. Positive samples and randomly selected negative samples were used to construct a new dataset. Divide the training dataset and validation dataset from the above constructed dataset in a ratio of seven to three. To reduce the uncertainty of randomly selecting negative samples, the training process was repeated thirty times. Based on the precision, recall and ROC (AUC) values, the optimal model was determined to conduct mineral prospectivity modeling.
The appropriate selection of hyperparameters is critical for ensuring the learning model’s performance. In this paper, the Bayesian optimization was introduced and cooperated with RF and XGBoost, repectively. In machine learning, the Bayesian optimization technique can be used to automatically tune hyperparameters (Bergstra et al., 2011; Bergstra et al., 2013; Zhang Z Q et al., 2021). Sequential model-based optimization (SMBO) is a kernel program in point of the Bayesian optimization algorithm (Bergstra et al., 2011; Bergstra et al., 2013). Table 1 shows the algorithm of the SMBO method. Firstly, based on the objective function, the SMBO constructs a surrogate model M0 with hyperparameter setting x and the loss function F. Secondly, the SMBO constructs trails H, which is used to update the surrogate model after storing and analysing the x and its corresponding loss pairs (Bergstra et al., 2011). Then, the SMBO perfroms an iteratative process (Zhang Z Q et al., 2021) as follows:
(1) search the local optimal hyperparameters x* by the current surrogate model Mt-1
(2) according to x*, calculate the corresponding loss y
(3) store x* and y in the updated H
(4) find a new surrogate model by the updated H
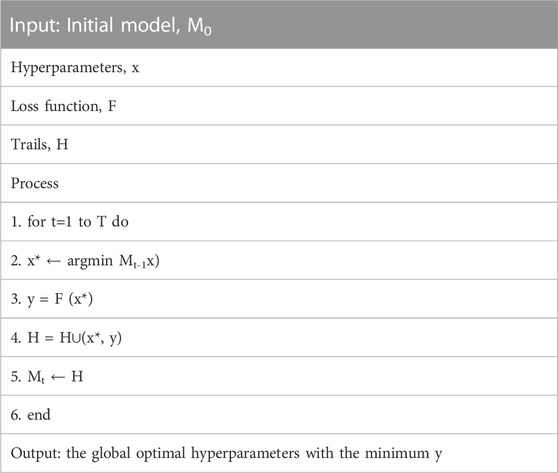
TABLE 1. Algorithm: Sequential model-based optimization (SMBO).
The SMBO ends when the process iterated to the pre-defined T iterations and it will output the global optimal hyperparameters with minimum y (Bergstra et al., 2011; Bergstra et al., 2013; Zhang Z Q et al., 2021).
The surrogate function and the acquisition function are two key functions in SMBO (Bergstra et al., 2011; Bergstra et al., 2013). In this paper, we propose a Python bayesian optimization package called hyperopt to perform hyperparameter tuning. The surrogate function and acquisition function is tree-structured Parzen estimator and expected improvement, respectively. The pre-defined number of iterations is fifty.
2.2 Model evaluation
The key step is to assess the efficacy of the machine learning model when applied to mineral prospectivity modeling. Model evaluation consists of four main components: True Positive, True Negative, False Positive, and False Negative. They form precision and recollection, which demonstrate their interdependence (Jia et al., 2021). Precision and recall are combined to generate the F1 score (Powers, 2011), which is then used to evaluate the model. The bigger the F1 score is, the better the model performance and the closer the prediction result is to the actual geological conditions. Recall, precision and F1 score are following formulas:
In addition to the F1 score, receiver operator characteristic (ROC) curves are essential evaluation approaches that are used in mineral prospectivity modeling or lithology categorization (Gao et al., 2016; Chen and Wu, 2017; 2019; Bharti et al., 2021; Jia et al., 2021; Zhang Z Q et al., 2021). The ROC curve analyzes whether positive and negative samples are accurately identified, as well as the corresponding number of samples (Jia et al., 2021). When compared to the old evaluation approach, the ROC curve avoids the rigid categorization of test outcomes into two groups. The ROC curve allows for an intermediate state and produces a set of ordered categories. The area under the curve (AUC) is an important parameter to evaluate the ROC curve’s strengths. In general, the closer the value of AUC is to 1, the better the model performance is.
In mineral prospectivity modeling, the prediction-area (P-A) plot has been widely employed (Yousefi and Carranza, 2015; Yousefi and Carranza, 2016; Mao et al., 2019; Zhang Z Q et al., 2021). The P-A plot is made up of two curves and their intersection point. They represent the relationship among the study area, the targets and the known orebody. That is, within the limited target area, there are as many known ore bodies as possible (Yousefi and Carranza, 2015; Zhang Z Q et al., 2021). The intersection point can reflect the predictive models’ performance (Yousefi and Carranza, 2015; Mao et al., 2019; Zhang Z Q et al., 2021). The intersection point is the balanced point for evaluating the models and delineating targets. The greater the Y value, the more ore bodies are concentrated in a smaller space (Zhang Z Q et al., 2021). As a result, the higher the P-A plot intersection point, the better predictive models perform (Zhang Z Q et al., 2021). The probability of the intersection point can be used as the confirmation threshold. Furthermore, discovering new Cu-Zn mineralization in a target with a smaller area is easy (Yousefi and Carranza, 2015).
2.3 Magnetic filtering and geophysical inversion
2.3.1 Magnetic filtering
In order to interpret the regional faults in 3D space, we used three filtering methods such as up continuation, low pass filtering and bi-empirical mode decomposition (BEMD). Continuation is a commonly used magnetic processing method, which is classified into upward continuation and downward continuation according to the velocity of abnormal weakening or increasing. Upward continuation is mainly applied to the extraction of deep anomaly features and is often used in the exploration of deep structures (Zhang et al., 2019; Han et al., 2020). The low pass filtering method allows only low frequencies to pass. According to the wave velocity = wavelength × frequency, we can set different cutoff wavelength to obtain magnetic anomalies of different low frequency values.
The empirical mode decomposition (EMD) is a non-linear data analysis method (Huang et al., 1998). After scientific research, EMD was developed into BEMD. BEMD is widely used in the decomposition of geophysical data and geochemical data (Xu et al., 2015; Chen et al., 2016; Tao et al., 2018; Zhang et al., 2019; Gao et al., 2023). The gravity and magnetic data decomposed by BEMD are often used in the interpretation of structures and concealed intrusions.
The entire decomposed process that aims to extract different frequency features mainly includes two procedures: 1) sifting bi-dimensional intrinsic mode functions (BIMFs); 2) determination of ending the sifting (Tao et al., 2018). First, local maxima and local minima should be extracted and interpolated to yield the upper enveloping surface and the lower enveloping surface. Second, calculate mean value of the enveloping surface, and subtract it from the previous sifted potential field data. Third, according to the Cauchy Criterion (Nunes et al., 2003; Nunes et al., 2005), judge the sifted component whether appropriate or not to be BIMFs and the formula is:
Where
The BIMFs and RES with different frequency characteristic means it is possible to transform them into frequency domain (Tao et al., 2018). Thus, BIMFs and RES images as field source can reflect the specific depth and power spectrum analysis can be used to estimate the corresponding depth quantitatively (Zhu and Liu, 2016; Tao et al., 2018). Nowadays, a radically average logarithmic power spectrum was developed (Tao et al., 2018; Zhang et al., 2019). Fitting linearly measured values and relatively minimal wavenumbers can calculate the estimated depth (Eq. 2).
Where
2.3.2 Geophysical inversion
3D inversion is an effective method to obtain petrophysical properties such as magnetic susceptibility (Li and Oldenburg, 1996). 3D inversion has been widely applied to mineral exploration (Zhang et al., 2019; Zhang Z Q et al., 2021). In this paper, 3D inversion of magnetic data was carried out by UBC-GIF software (Li and Oldenburg, 1996). The size of the inversion mesh is 100 m×100 m×100 m. The study area was discretized along fixed directions (x-, y-, z-) into 260×179×30 cubic mesh. The total number of mesh cells is 1396200.
3 Data acquisition and preprocessing
This work adopted 1:50,000 magnetic data covering a 470 km2 area. The survey grid was 500 m×100 m in size. The magnetic measurement instrument was HC-95A helium optical pump magnetometer. Diurnal correction, normal field correction, and height correction are applied to the magnetic data. Geosoft software from Oasis montaj was used to perform magnetic data preprocessing and filtering, including reduced to pole (RTP), upward continuation, and low pass filtering. The total magnetic field intensity was calculated using data from the IGRF 2010. In the study area, the geomagnetic field declination and inclination were −8.2° and 63.3°, respectively.
The petrophysical properties of the rocks (Table 2) related to mineralization are obtained. The magnetic susceptibility of biotite plagiogneiss is 65 (4π×10-6 SI) and the remanent magnetization is 9×10⁻³A/m. The magnetic susceptibility of quartz diorite is 176 (4π×10-6 SI) and the remanent magnetization is 237× 10-3A/m. The magnetic susceptibility of the sulfide ore is 892 (4π×10-6 SI) and the remanent magnetization is 510×10-3A/m. The metamorphic rock of Baoyintu Group is characterized by low magnetic susceptibility, while quartz diorite and sulfide ore body are characterized by high magnetic susceptibility (IMGECL, 2018; Wang Z L et al., 2019).
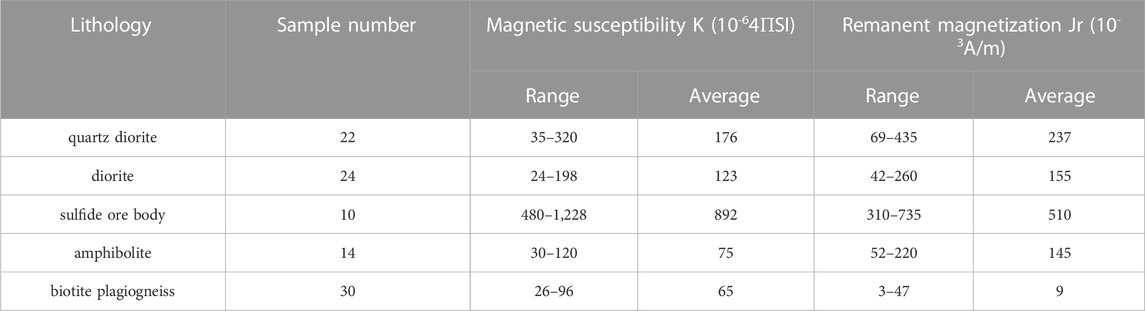
TABLE 2. The range and average values of susceptibilities of different lithologies in the Weilasituo-bairendaba district (after IMGECL (2018)).
The geochemical anomalies are from regional geochemical soil survey. The lower limits of geochemical anomalies are calculated and the formula (IMGECL, 2018) is:
where x is the mean value. S is standard deviation. K is an empirical parameter and the range is from one to three. The interpolation method is Kriging. According to the lower limit value, the geochemical single element anomalies can be obtained. There are thirty-one Cu geochemical element anomalies and the lower limit is 50 ppm. There are twenty-seven Pb geochemical element anomalies and the lower limit is 150 ppm. There are thirty-six Zn geochemical element anomalies and the lower limit is 500 ppm. Generally, the higher the overlap degree of single element anomaly, the greater the indication significance to minerals. The two anomaly combinations in the district are Cu-Pb-Zn-Ag-As and Sn-Li-W-Mo-Bi (IMGECL, 2018). The high value area of Cu, Pb and Zn elements is obviously controlled by faults and intrusions, especially NE-trending faults (IMGECL, 2018). Cu-Pb-Zn element geochemical anomalies are good indicators for the Cu, Zn mineralization in the district (IMGECL, 2018). Geochemical data are from 1:50,000 Ag, Cu, Pb, Zn, and As combination anomaly maps compiled by Inner Mongolia Geological Exploration Co., LTD in 2020.
4 Geological setting and exploration criteria
4.1 Regional geology
The Greater Xing’an Range (GXAR) metallogenic belt is located in Central Asian Orogenic Belt (Figure 1A), which is one of the nineteen important metallogenic belts in China (Yang, 2017). Metallogenic elements such as Sn, Fe, Pb, Zn, Au, Cu, Ag, and Mo are associated with or zoned (Zhang et al., 2013; Liu et al., 2016; Zhou et al., 2019). It is an important Ag-Pb-Zn-Cu metallogenic belt between Xilinhot and Xilingol on the western slope of the Southern section of GXAR (Liu et al., 2004; Wang et al., 2006). The geological tectonic evolution was controlled jointly by Paleo-Asian ocean, Mongol-Okhotsk ocean and Paleo-Pacific plate (Ouyang, 2013; Xu et al., 2013; Wang F X et al., 2017; Chen et al., 2021). During the early Cretaceous, the lithosphere in Northeast China and its adjacent areas was thinned and extended on a large scale due to the subduction of the Paleo-Pacific plate into the Eurasian plate, and the asthenosphere material upwelled, resulting in a strong crust-mantle interaction (Hua and Mao, 1999; Lin et al., 1999; Mao and Wang, 2000; Mao et al., 2005; Mao et al., 2013; Ouyang, 2013; Zeng et al., 2016). The Mesozoic Pb-Zn-Ag-Cu mineralization is associated with the extensional environment by both the Mongol-Okhotsk ocean closure and the subduction of the Paleo-Pacific plate (Mao et al., 2013; Ouyang, 2013; Zhang, 2017; Liu et al., 2018). The typical Cu-Zn deposits are closely related to Yanshanian magmatic hydrothermal deposits, particularly the Beidashan intrusions (Tang et al., 2014). Different deposits with different major ore-forming elements result from magmatic hydrothermal evolution differentiation (Ouyang, et al., 2014; Liu et al., 2016; Wang F X et al., 20177; Li et al., 2018). The specific performance is that as the temperature drops, the elements appear as Sn-W-Mo, Cu-Zn, and Pb-Zn-Ag horizontal zoning (Liu et al., 2016; Gao et al., 2019; Zhou et al., 2019). NE- and NW-trending faults are important ore-controlling structures (Zhang et al., 2013).
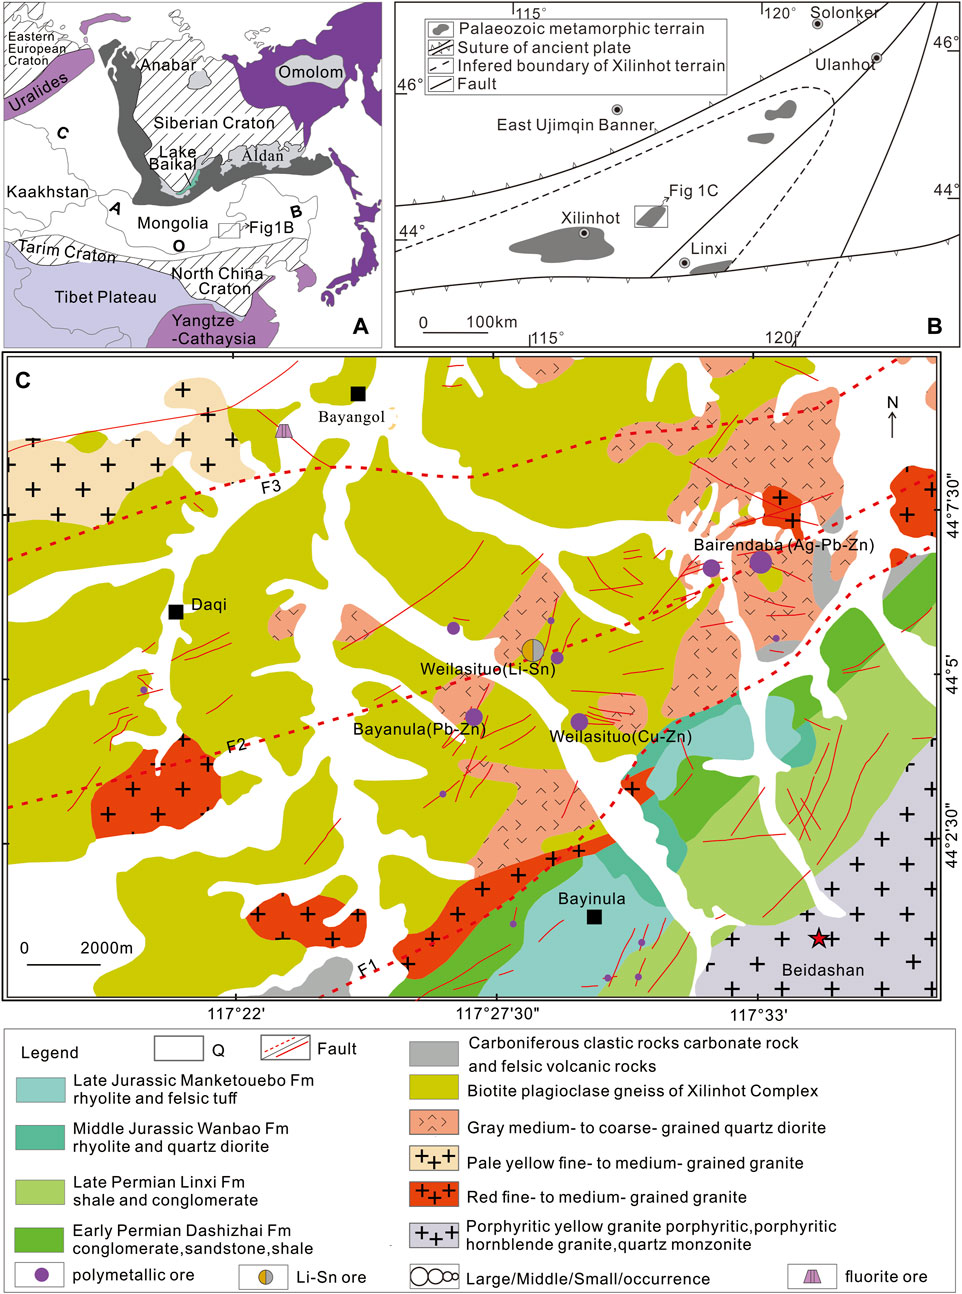
FIGURE 1. (A) Major tectonic units of central Asia, showing the location of the Great Xing’an Range in the Central Asian Orogenic Belt (after Wang F X et al. (2017)). (B) regional structure distribution map in the Weilasituo-bairendaba polymetallic metallogenic belt (modified after Jiang et al. (2010)). (C) The simplified geological map of the Weilasituo-bairendaba district (after Wang F X et al. (2017); IMGECL (2018)). Abbreviations: Fm, Formation.
The Weilasituo-bairendaba district is located at the western slope of the southern section of GXAR in Inner Mongolia, China (Wang et al., 2006). The structural framework is constrained by NEE- and NE-trending regional faults (Figure 1B) (Ouyang et al., 2014; Liu et al., 2016). The district is confined between the Erlian-Hegenshan Fault and the Xra Moron River Fault (Zeng et al., 2016; Wang F X et al., 2017; Chen et al., 2021). The Xilinhot Complex, which dates from the Neoproterozoic to the Early Phanerozoic and is composed of schists, gneisses, granulitites, and amphibolites, is the oldest formation (Shi et al., 2003). The Baoyintu Group that evolved from Xilinhot Complex is the primary body of the strata (Figure 1B). The lithology is mainly biotite plagioclase gneiss and hornblende plagioclase gneiss. The south of F1 in the district is Carboniferous and Permian (Figure 1C). The Carboniferous is composed of clastic rock, carbonate rock and felsic volcanic rock. The Permian includes Dashizhai Formation, Linxi Formation, Wanbao Formation and Manketouebo Formation. Dashizhai Formation and Linxi Formation are mainly composed of clastic rocks (Liu et al., 2010). Wanbao Formation and Manketouebo Formation are mainly composed of volcanic rocks with some quartz diorites. The regional faults constitute the district’s structural framework, and the secondary faults provide specific migration channels and storage space for ore-forming fluids (Sun et al., 2011; Liu et al., 2014). The majority of mineralization-related faults were developed during the Yanshanian epoch (Sun et al., 2011). The intermediate-acid intrusions are primarily pale yellow fine-to medium-grained granite, gray medium-to coarse-grained quartz diorite, and red fine-to medium-grained granite that intruded into the Baoyintu Group gneiss. The zircon U-Pb ages of quartz diorite and diorite in the district are at ca. 300 Ma (Liu et al., 2010; Xue et al., 2010; Wang et al., 2013; Zhang Y F et al., 2021). Furthermore, the Beidashan intrusions is composed of porphyritic hornblende granite, porphyritic yellow granite, and quartz monzonite (Figure 1C) and the LA-ICP-MS zircon U-Pb age is 140 ± 2 Ma (Liu et al., 2018).
According to the existing reports, the Weilasituo-bairendaba district is an important component of the Cu-Pb-Zn metallogenic belt (Yang, 2017; Zhang, 2017). The known Weilasituo Cu-Zn deposit and Bairendaba Ag-Pb-Zn deposit have many similarities in stratigraphy, intrusions, structure, geophysics, and geochemistry (Tang et al., 2014; Zhang, 2017; IMGECL, 2018). They are the same tectonic-magmatic product as the Weilasituo Li polymetallic deposit (Guo, 2016; Zhou et al., 2019).
4.2 Tectonic history and Cu-Zn mineralization
From Paleozoic to Triassic, orogenic processes of GXAR such as collision orogenesis, uplift, denudation, planation were completed (Pan et al., 2009). Before Mesozoic, the southern section of GXAR was mainly controlled by the Paleo-Asian ocean tectonic domain (Ren et al., 1997; Hong et al., 2003; Wang et al., 2013; Zhang, 2017; Zhang Y F et al., 2021). The Hercynian fault was formed (Sun et al., 2011). In the Mesozoic era, the diagenetic and metallogenic geological events in northeast China and its adjacent areas have been divided into five periods, and including 140-120 Ma, the extension environment under the joint action of the Mongol-Okhotsk ocean closure and the subduction of the Paleo-Pacific plate (Ouyang, 2013). The tectonic age of the extension environment based on zircon U-Pb dating and petrogeochemical analysis of Mesozoic volcanic rocks in northeast China, 106-133 Ma is reported (Xu et al., 2013; Zhang, 2017). The magmatic activity in the middle-southern part of GXAR is mainly concentrated at 150-120 Ma, and the granite emplacement is concentrated at 140-120 Ma (Shao et al., 1998). At 140-120 Ma, magmatic emplacement and volcanic eruption provided the heat source and provenance for (Cu-Zn) mineralization (Pan et al., 2009). As a result, Cu-Pb-Zn-Ag polymetallic deposits related to Yanshanian granitic rocks on the western slope of the southern Section of GXAR are associated with the low angle or plate subduction of Paleo-Pacific plate (Mao et al., 2013). The 40Ar-39Ar dating of Muscovite in Bairendaba Ag-Pb-Zn deposit shows that the mineralization age is 135 ± 3 Ma and that of the Weilasituo Cu-Zn deposit is 133.4 ±0.8 Ma (Pan et al., 2009; Chang and Lai, 2010). The two known deposits as the same tectonic-magmatic products formed in different space because of the magmatic evolution (Mao et al., 2013; Mei et al., 2015; Zhou et al., 2019). The Yanshanian secondary faults are mainly NE-, EW- and NW- trending, which are important rock-controlling and ore-controlling faults (Sun et al., 2011).
4.3 Deposit geology
The large and medium-sized deposits in the district are Weilasituo Li polymetallic deposit, Weilasituo Cu-Zn deposit and Bairendaba Ag-Pb-Zn deposit. There are also several small polymetallic ore deposits or occurrences such as Bayangol Fluorite deposit, Bayanula Pb-Zn deposit and Weilasituo W deposit (Figure 1C). As the evolution, the temperature changed from high to low and the ore-forming elements are characterized by the horizontal zonation of Sn-W-Mo, Cu-Zn, Pb-Zn-Ag, rare earth (Fluorite) deposit (Figure 2A) (Ouyang, 2013; Liu et al., 2014; Zhou et al., 2019).
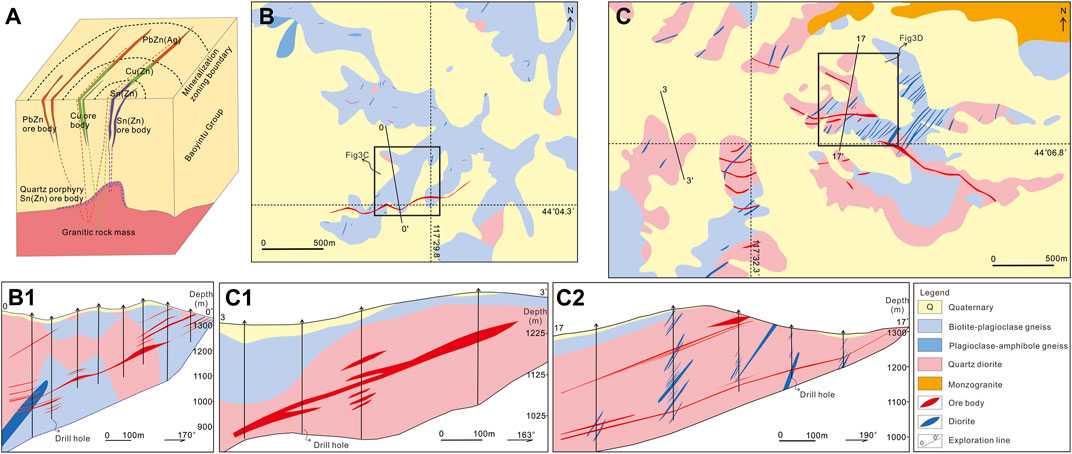
FIGURE 2. (A) The simplified metallogenic model of typical polymetallic deposits (modified after Guo, 2016). (B) and (B1) The geological map and cross-section map of 0-0′ exploration line of the Weilasituo Cu-Zn deposit (modified after Liu et al. (2016); IMGECL (2018)). (C), (C1) and (C2) The geological map and cross-section map of 3-3′ and 17-17′ exploration line of the Bairendaba Ag-Pb-Zn deposit (modified after Xi et al. (2014); Liu et al. (2016)).
The two typical deposits have many geological similarities (Figures 2B,C) (Tang et al., 2014; Mei et al., 2015). The lithology is mainly Baoyintu Group gneiss, and the structure is mainly NE-trending faults (Figure 1C) (Liu et al., 2014). The secondary faults are the main ore-controlling structures (Sun et al., 2011). Quartz diorite is an important part of the ore-bearing intrusion, and the mineralization is closely related to Yanshanian magmatic activity (Figure 2B1C1C2) (Guo et al., 2009; Liu et al., 2012; Wang et al., 2014; Guo et al., 2018; Wang Y et al., 2019).
However, there are also some differences in terms of deposit geology. The main ore bodies hosted in metamorphic complex and quartz diorite in the Weilasituo Cu-Zn deposit (Yi et al., 2020). The faults strictly constrain ore bodies, whose shapes are vein, lamellar or lenticular. The alteration of surrounding rock mainly includes silicification, sericitization, fluorination, carbonation and kaolinization, which are beneficial to discover new ore bodies (Wang et al., 2010). The total resource of Weilasituo deposit is 8811400t with average Zn grades of 4.29% and Cu grades of 0.79% (Tang et al., 2014). Bairendaba deposit is divided into east part and west part, and silver reserves up to 8000t, lead and zinc up to 3000000t (Sun et al., 2011). The grades of Cu in the west part and Zn in the east part are 0.28% and 5.14%, respectively (Tang et al., 2014). Sporadic Yanshanian granites and dikes are exposed in the ore mine (Wang Y et al., 2019). The main ore-controlling structures are EW- and NW- trending faults (Sun et al., 2011; Xi et al., 2014; Wang Y et al., 2019). The alteration types are silicification, fluorophysis, sericitization, chloritization (Guo et al., 2009; Liu et al., 2012; Wang et al., 2014; Wang Y et al., 2019).
The two typical deposits exhibit high magnetic anomalies and strong related geochemical anomalies, indicating the existence of concealed ore-bearing geological bodies underground. The detailed deposit geology of known deposits in the district is showed in Table 3. In this paper, 3D ore bodies of Weilasituo Cu-Zn deposit and Bairendaba Ag-Pb-Zn deposit were built (Figures 3A, B). And 3D intrusion model and strata model were built in the key zones (Figures 3C, D).
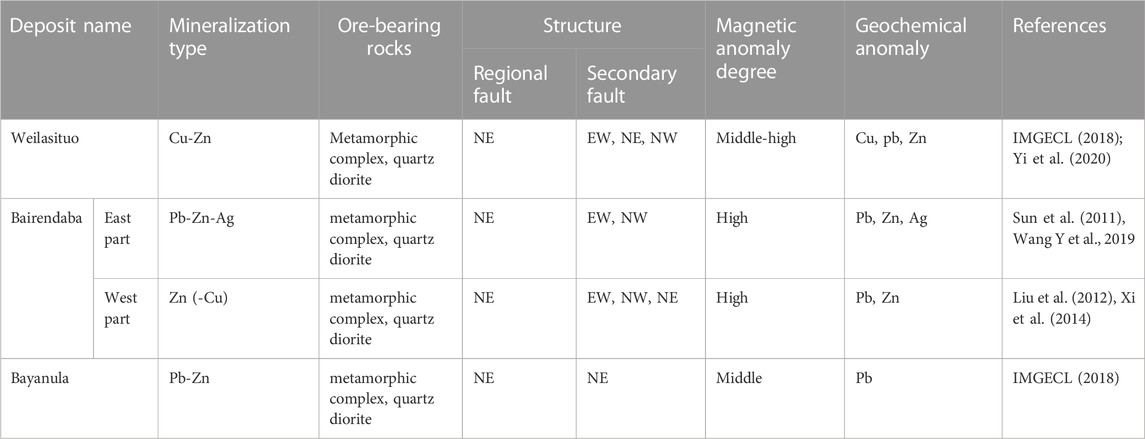
TABLE 3. The deposit geology of typical deposits in the district.
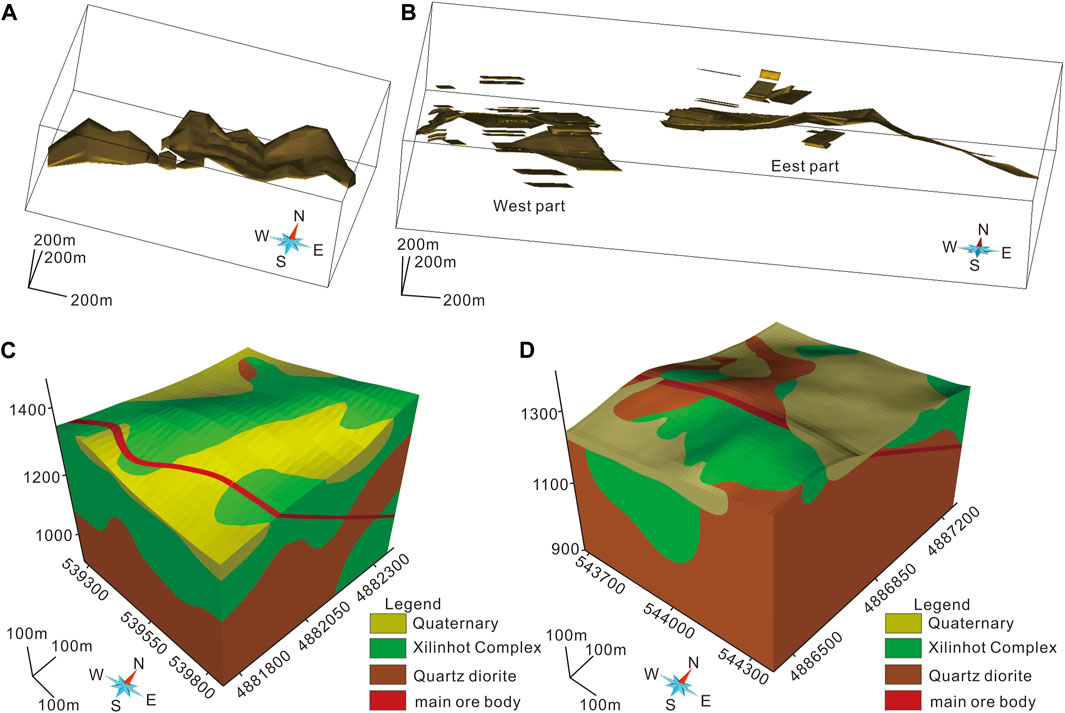
FIGURE 3. 3D model of the major orebodies of (A) the Weilasituo Cu-Zn deposit; (B) the Bairendaba Ag-Pb-Zn deposit. 3D geological model of key zones of (C) the Weilasituo Cu-Zn deposit (D) the Bairendaba Ag-Pb-Zn deposit.
4.4 Exploration criteria
4.4.1 Orebody model
Drill hole data, mine plan maps and 1: 1,000 geological cross-section maps of Weilasituo Cu-Zn deposit and Bairendaba Ag-Pb-Zn deposit were collected. Based on the above, 3D orebody models were constructed in SKUA-GOCAD. The models are showed in Figures 3A,B. The orebodies from known deposits were used as positive samples (Zhang Z Q et al., 2021).
4.4.2 Regional faults
The upward continuation height is 500 m, 1000 m, 2000 m, and 3000 m, respectively. The results are showed in Figure 4A. Low frequency anomalies were retained by low pass filtering. The cutoff wavelength is 2000 m, 3000 m, 5000 m, and 7000m, respectively (Figure 4B). The BEMD was used to decompose magnetic data and yielded three BIMFs images (BIMFM1, BIMFM2, BIMFM3) and one residue (RES) image (RESM) (Figure 5) and the depth of them was estimated (Figure 6). According to the result of filtering, three regional faults (F1, F2, F3) were interpreted.
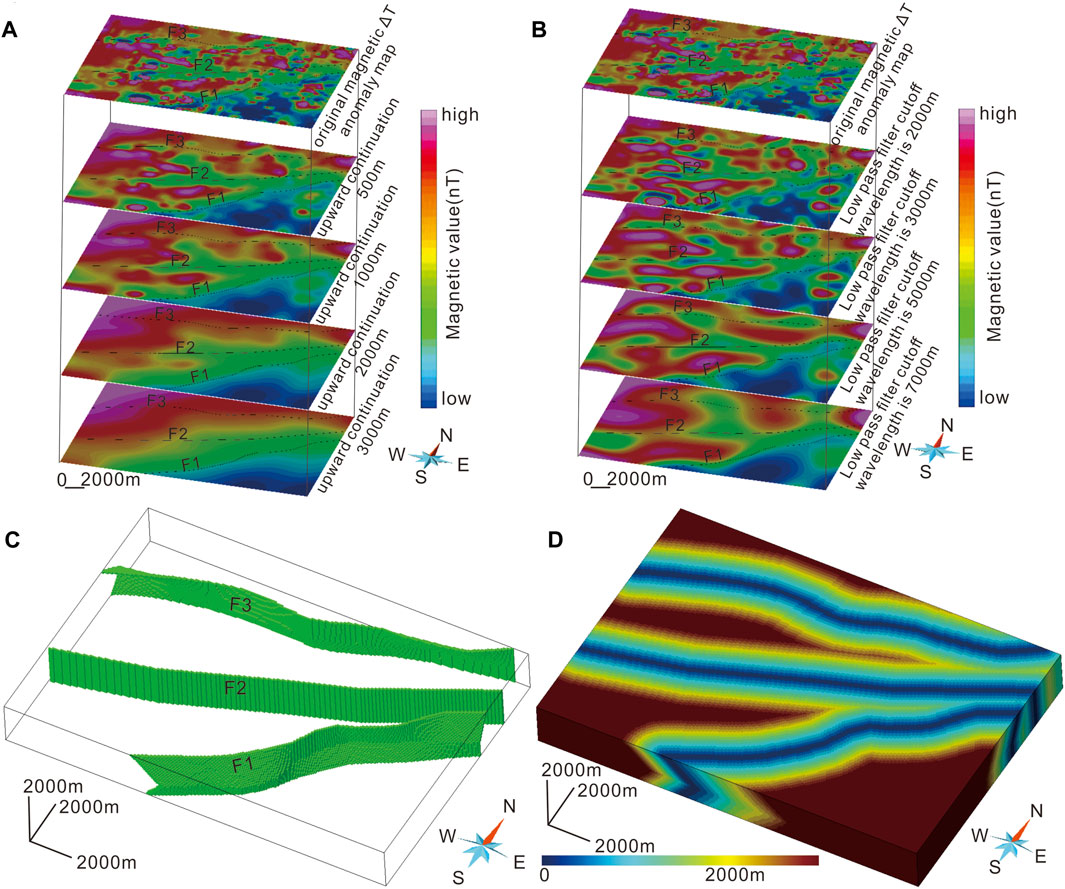
FIGURE 4. Regional fault model of (A) the different depth of upward continuation of magnetic anomaly; (B) low pass filtering of magnetic anomaly (C) the 3D regional fault solid model (D) the 3D regional fault buffer model.
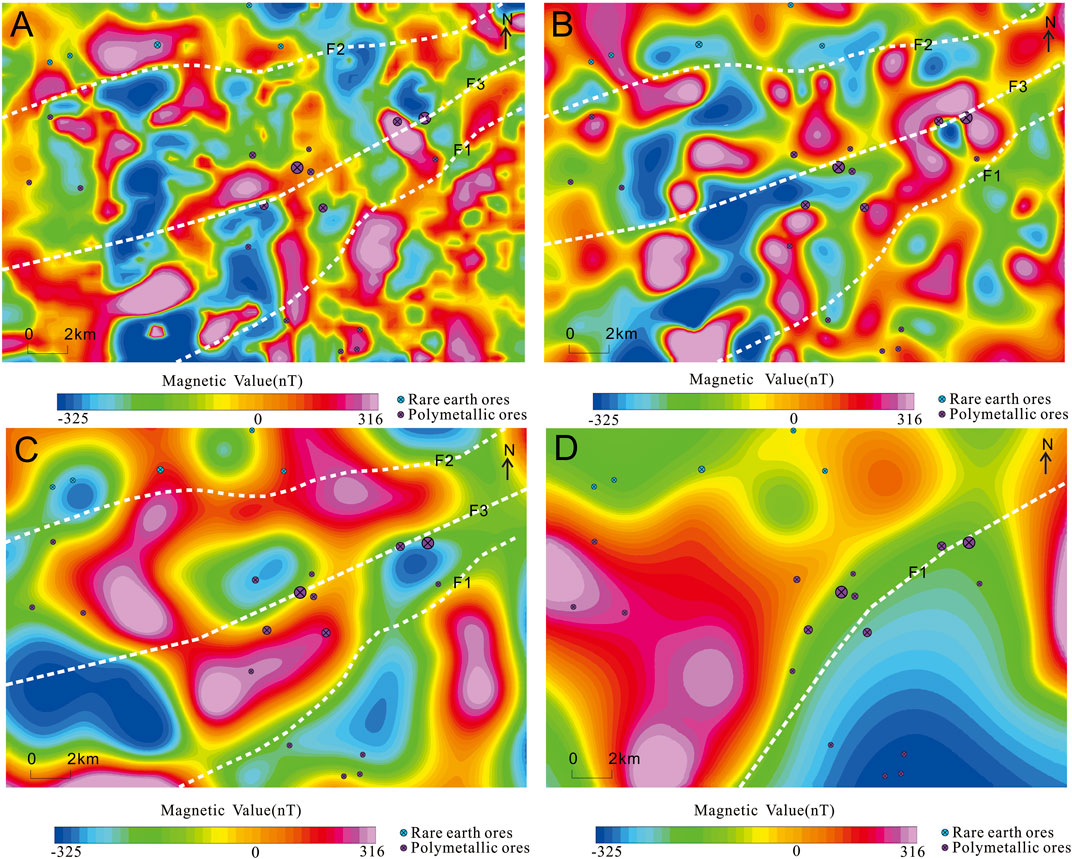
FIGURE 5. BIMFs and RES decomposed from RTP anomaly: (A) BIMFM1 image (B) BIMFM2 image; (C) BIMFM3 image (D) RESM image. White lines are faults interpreted by BIMFs and RES.
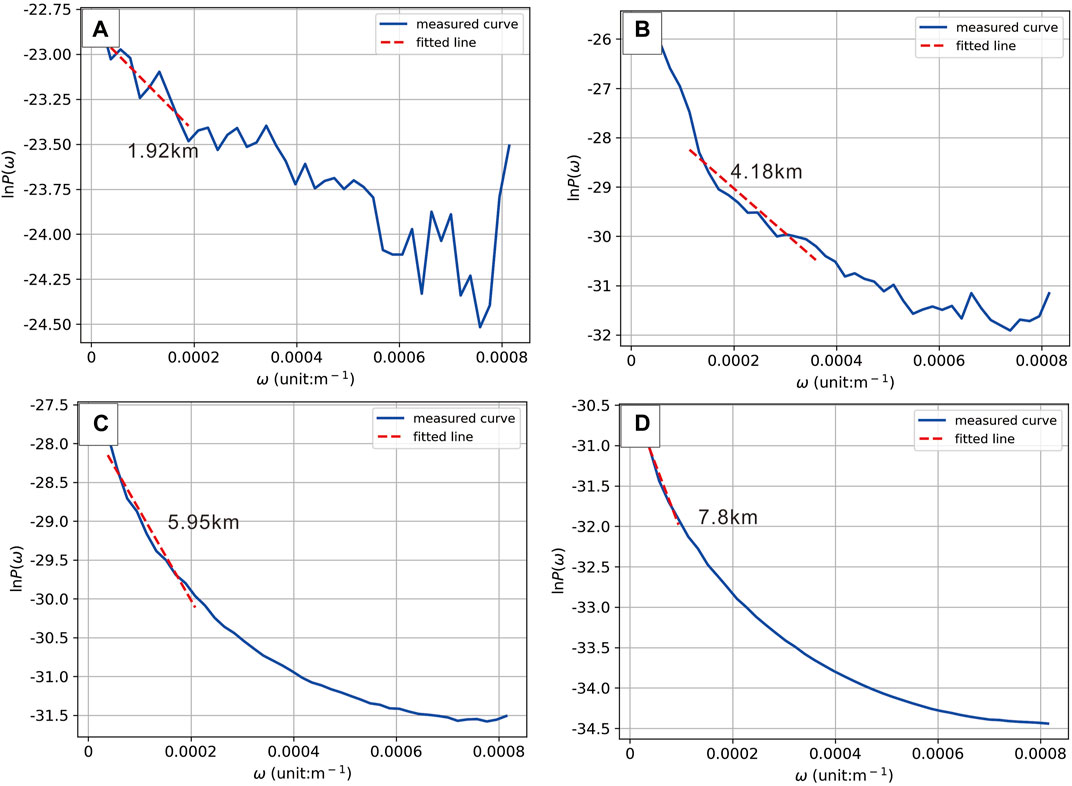
FIGURE 6. Estimated depths of BIMFs and RES decomposed from RTP anomaly: (A) BIMFM1 (B) BIMFM2; (C) BIMFM3 (D) RESM.
F1, F2 and F3 showed beaded negative anomalies (Figure 4B). F1 makes a good distinction between Xilinhot metamorphic complex and its southern Jurassic-Permian (J-P) strata, which correspond to positive anomalies and negative anomalies of magnetic data (Figures 4A, B). When the upward continuation height is 500m, small magnetic anomalies are erased, indicating that some small abnormal geological bodies are concealed shallow, small in scale and weak in causing anomalies. When the upward continuation height is 1,000 m or 2,000 m, F1, F2, and F3 are obvious, but small magnetic anomalies are almost invisible. When the upward continuation height is 3000m, the characteristic of F1 is more obvious than F2 and F3, indicating that F1 extends deeper and longer.
BIMFM1 image mainly reflects faults (Figure 5A) and the depth is 1.92 km (Figure 6A). The F1 is the geological boundary between the Baoyintu Group and the J-P strata and the extended depth is 7.8 km (Figure 6D). The F2 mainly controls the distribution of Weilasituo polymetallic deposits and Bairendaba Ag polymetallic deposit. BIMFM2 image mainly reflects the regional faults (Figure 5B) and the depth is 4.18 km (Figure 6B). Magnetic anomalies are beaded and distributed along faults and ductile shear zones. BIMFM3 image mainly reflects the regional faults and circular structures (Figure 5C) and the depth is 5.95 km (Figure 6C). The distribution of high magnetic anomalies is more concentrated, and the characteristic arc edge of the intrusions can be discovered. RES image reflects the regional background geological information (Figure 5D) and the depth is 7.8 km (Figure 6D). At the boundary between the Baoyintu group and J-P strata, a metallogenic belt is formed, where the typical and key polymetallic deposits are located.
According to the results of interpretation, 3D regional faults was built and the regional fault solid model was obtained by meshing (Figure 4C). Buffer was carried out with the distance of 200 m interval, and the 3D regional fault buffer model was obtained (Figure 4D).
4.4.3 Secondary faults
The secondary faults are main deposit-scale ore-controlling faults in the district. “Structural Outline map of Weilasituo-bairendaba district, Inner Mongolia” was collected. The information of secondary faults was obtained through geological maps. The process of drawing the structural outline map is divided into three steps (IMGECL, 2018): 1) collect related geological reports and scientific articles and integrate existing faults in 2D GIS platform (i.e., ArcGIS) (Bonham-Carter et al., 1989); 2) record the information of occurrence and age of faults; 3) conduct field investigation and error correction and draw structural outline map.
Fault attributes include length, strike, inclination, dip angle, cutting depth, mechanical properties, formation age and so on. According to the aforementioned information, the 3D secondary fault model can be established. The secondary fault solid model was obtained by meshing (Figure 7A). Buffer was carried out according to the distance of 200 m interval, and the 3D secondary fault buffer model was obtained (Figure 7B).
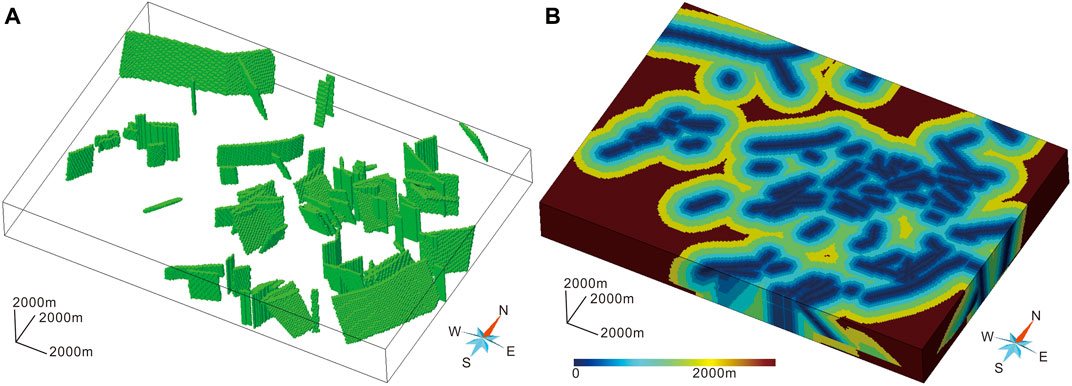
FIGURE 7. Secondary fault model of (A) the 3D secondary fault solid model (B) the 3D secondary fault buffer model.
4.4.4 Magnetic susceptibility model
Magnetic inversion is aimed to obtain magnetic susceptibility. The typical Cu-Zn deposits show high magnetic anomalies (Figure 8A), indicating that there are concealed high magnetic susceptibility geological bodies, which may be large sulfide minerals in the deep space, or shallow high magnetic thick quartz diorite (Li and Zhang, 2013). The 3D magnetic susceptibility model is showed in Figure 8B. High magnetic susceptibility geological bodies have been extracted when the susceptibility is more than 0.001SI (Figure 8C). The strike of the high magnetic susceptibility geological bodies is mainly NE, which is consistent with the magnetic anomaly (Chen et al., 2021).
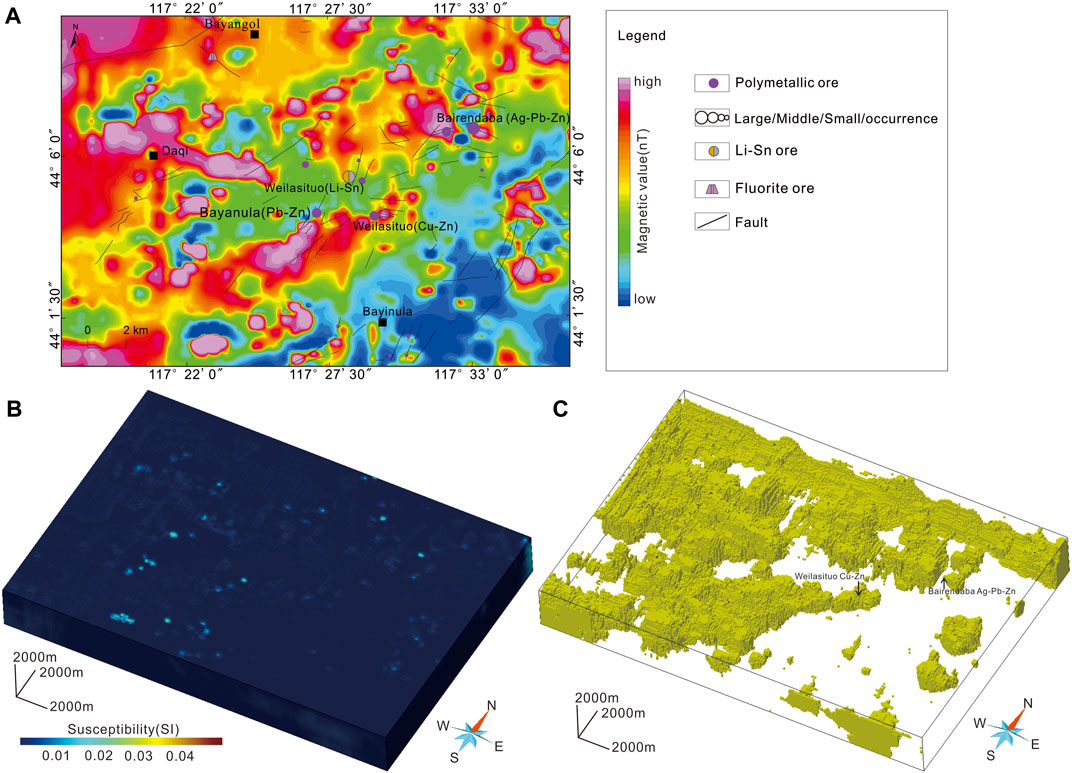
FIGURE 8. Magnetic susceptibility model of (A) 1:50000 magnetic anomaly distribution map; (B) the 3D susceptibility model (C) the high susceptibility geological bodies.
4.4.5 Geochemical anomaly model
Geochemical elements such as Cu, Pb and Zn are important to indicate Cu-Zn mineralization in the district. Cu, Pb and Zn geochemical anomalies are extracted, and their distribution is shown in Figure 9A. The faults are important ore-controlling structures (Sun et al., 2011; Zhang et al., 2013). Both geochemical anomalies and known deposits are controlled by regional faults (IMGECL, 2018). And secondary faults pass through most of the areas with obvious geochemical anomalies (Figure 9A). The occurrence of the faults can be regarded as the occurrence of the penetrating or the adjacent geochemical anomalies. Thus, the geochemical anomalies can extend to a depth of 3 km. The geochemical element coincidence degree of Cu, Pb and Zn in 3D space is showed in Figure 9B. The indication degree of geochemical anomaly to mineralization in 3D space is showed in Figure 9C.
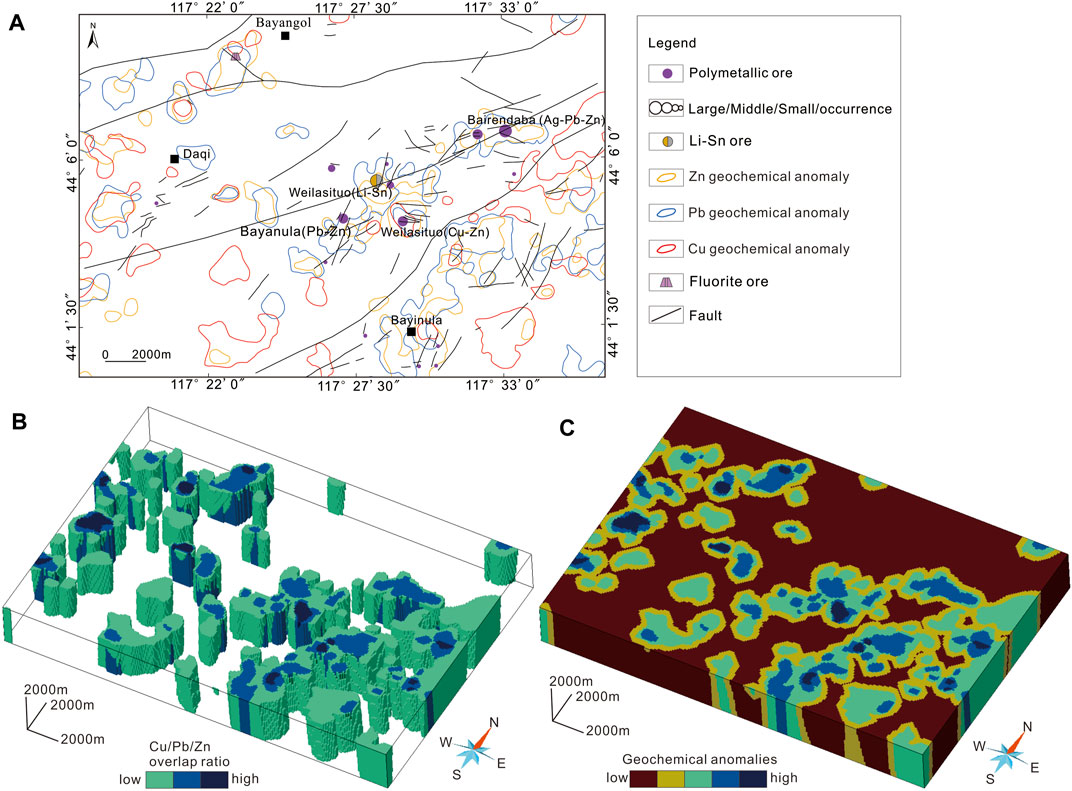
FIGURE 9. Geochemical anomaly model of (A) the geochemical anomaly distribution map; (B) the 3D geochemical anomaly (Cu, Pb, Zn) overlap ratio model (C) the 3D geochemical anomaly model.
4.4.6 Exploration criteria integration
The regional fault, secondary fault, magnetic susceptibility and geochemical anomaly were integrated for 3D mineral prospectivity modeling. The district was divided along fixed directions (x, y, z) into 260×179×30 mesh. The number of cells of the mesh is 1396200. The number of cells of the ore bodies is 734. The depth of 3D modeling is 3 km underground. All exploration criteria are integrated in SKUA-GOCAD software to obtain datasets that can be used for machine learning.
5 Results
In this paper, the spatial distribution characteristics and extension depth of F1, F2, F3 regional faults were interpreted, and the 3D fault model of the district was built. The strike of the three regional faults is NE. The F1 extends up to 7.8km, and the F2 and F3 extend up to 5.95 km. The scale of secondary faults derived from regional faults is small. The typical deposits in the district show obvious magnetic anomalies. According to the petrophysical properties, an appropriate magnetic susceptibility threshold (>0.001SI) was set to extract the high magnetic susceptibility geological bodies, and the scale was found to decrease gradually from west to east along F2 (Figure 8C). Based on regional faults, secondary faults, magnetic susceptibility and geochemical anomalies as exploration criteria (Table 3), district-scale 3D mineral prospectivity modeling was carried out.
In the process of mineral prospectivity modeling, the Bayesian optimization was introduced to tune hyperparameters of RF model and XGBoost model. After thirty repeated experiments, thirty models were obtained. The F1 scores and AUC values of thirty models were showed in Figures 10A, B. The randomness of each experiment leads to the fluctuation of the final model evaluation parameters. As mentioned above, the closer the AUC value is to 1, the better the model performance. The RF28 and XGBoost11 have the biggest AUC values, and they are 0.987 and 0.986, respectively (Figures 10C, D). The recall and precision of the RF28 is 0.993 and 0.921, respectively. The F1 score of the RF28 is 0.956 (Table 4). The recall and precision of the XGBoost11 is 0.988 and 0.937, respectively. The F1 score of the XGBoost11 is 0.962 (Table 4). According to these parameters, RF28 and XGBoost11 models perform better. The RF28 and XGBoost11 models can be used for mineral probability modelling in the district, and the results are highly reliable.
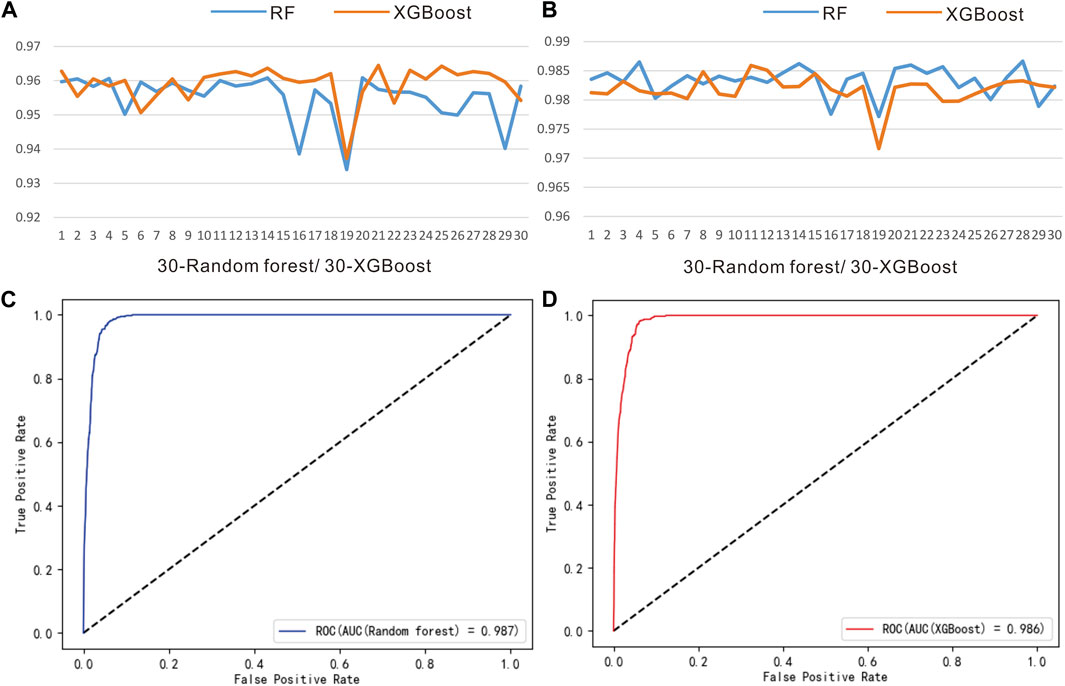
FIGURE 10. (A) F1 score and (B) ROC(AUC) of the 30 sets of XGBoost/RF predictive models; ROC curves of the (C) RF28 and (D) XGBoost11.
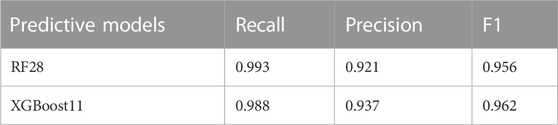
TABLE 4. Result of the RF28 and XGBoost11 predictive models.
Another function of the P-A plot is to conduct predictive model evaluation (Zhang Z Q et al., 2021). The P-A plots of RF28 and XGBoost11 are showed in Figures 11A, B. The X value of the intersection point can be a threshold to delineate targets (Table 5). The threshold of the RF28 to delineate potential targets is 0.77 and the threshold of the XGBoost11 is 0.75. The final targets from RF28 occupied the smallest area of study area (5%) and contained most known ore bodies (95%) and the parameters of XGBoost11 are 6% and 94% (Table 5). The spatial correlation between delineated targets and known Cu-Zn orebody is very high. According to the F1 scores, AUC values and P-A plot, the RF and XGBoost exhibited well in this paper, although the thresholds of the RF28 and XGBoost11 for delineating the targets are different. The mineral potential maps of RF28 and XGBoost11 and the targets extracted by P-A plot are showed in Figures 12A, B and Figures 13A, B, respectively.
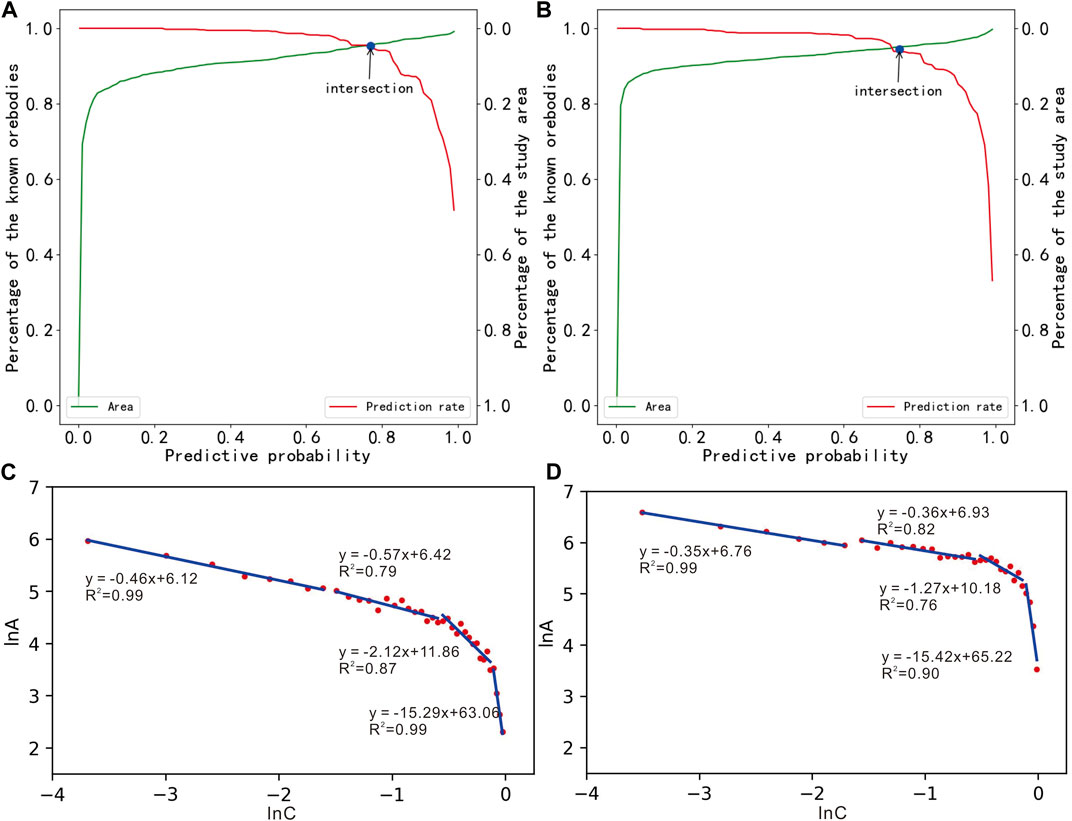
FIGURE 11. P-A plot of (A) RF28; (B) XGBoost11. C-A fractal of (C) RF28 (D) XGBoost11.
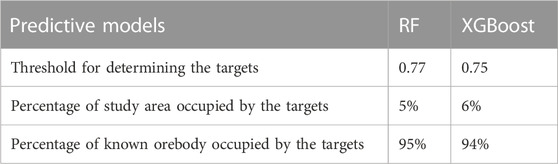
TABLE 5. P-A plot parameters of the RF28 and XGBoost11 predictive models.

FIGURE 12. (A) 3D mineral probability map of the RF28 predictive model; and (B) targets by P-A plot; (C) Ⅰ-level targets and (D) Ⅱ-level targets by C-A fractal.
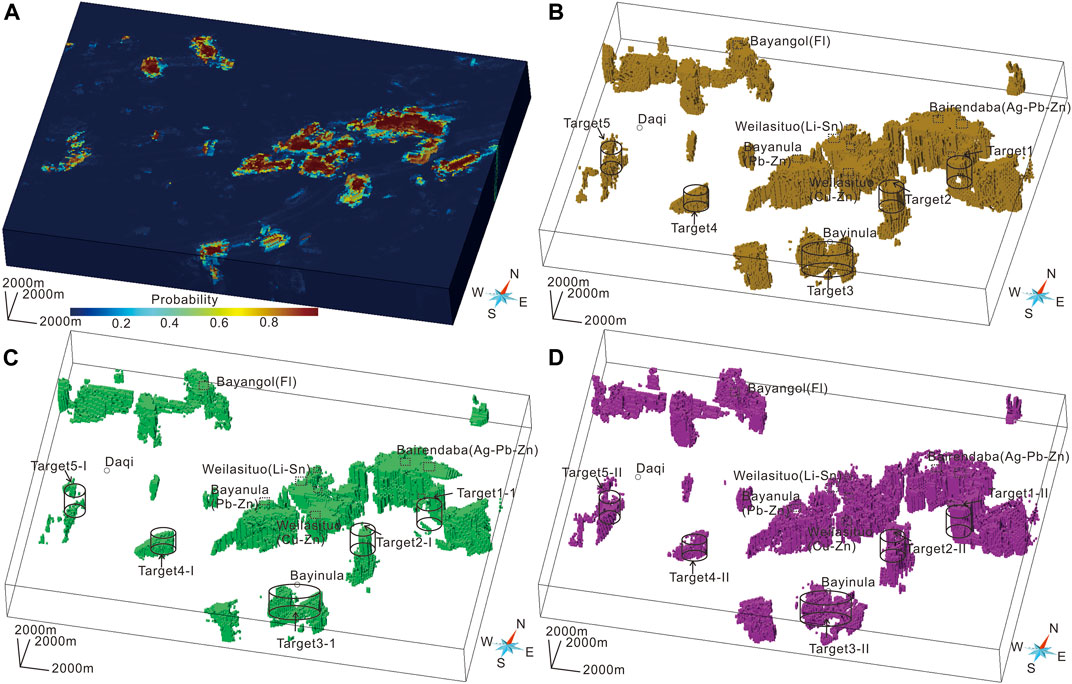
FIGURE 13. (A) 3D mineral probability map of the XGBoost11 predictive model; and (B) targets by P-A plot; (C) Ⅰ-level targets and (D) Ⅱ-level targets by C-A fractal.
According to metallogenic geological conditions, high probability zones and known small ore occurrences, five prospecting targets (Target1, Target2, Target3, Target4, Target5) are delineated. Target 1 with a discovered Cu ore occurrence is located in the South side of Bairendaba Ag-Pb-Zn deposit and the north side of F1 (Tang et al., 2014). The scale of the high probability zone of Target 1 is large, and the probability of the existence of Cu-Pb-Zn deposits in the deep and periphery space is large. Target 2 shows obvious Cu-Pb-Zn geochemical anomaly and there is a high probability of Cu-Pb-Zn polymetallic deposit in deep space. Target 3 is located in Bayanula area, south of F1, with obvious Pb-Zn anomalies and developed secondary faults. There are four polymetallic ore occurrences in the vicinity (Figure 1C). The probability of discovering polymetallic deposits in deep space is high. Target 4 is located in the southwest of Bayanula Pb-Zn deposit, which is controlled by F2 and shows obvious Cu geochemical anomaly. There are no obvious secondary faults in the surface because of sedimentary coverage, and there is a high probability of concealed polymetallic ore bodies. Target 5 is located in the south of Daqi, where secondary faults are developed and Ag polymetallic ore occurrences existed.
In order to further grade the targets and verify the effectiveness of targets obtained by P-A plot. The C-A fractal (Cheng et al., 1994) model was used to grade the targets. According to the fitted line formula, the corresponding probability value of intersection points can be inverted (Figures 11C,D). Based on the above obtained probability value, the four levels of classification were carried out. Traditionally, a probability value greater than 0.5 is more worthy of further exploration, so two levels of targets were extracted. The probability value of Ⅰ-level targets of RF28 is greater than 0.89 and the range of Ⅱ-level targets is 0.57–0.89. The probability value of Ⅰ-level targets of XGBoost11 is greater than 0.90 and the range of Ⅱ-level targets is 0.60–0.90.
Targets graded by C-A fractal were showed in Figures 12C, D and Figures 13C, D. High probability zones of RF28 and XGBoost11 have the similar distribution position. P-A plot considers the proportion of known ore bodies in the targets and the proportion of the targets in the district. The smallest targets contain the most known ore bodies and the corresponding threshold is the best for delineating targets. The main purpose of C-A fractal is to grade the targets. According to the thresholds of the two methods, the targets extracted by P-A plot are included in the Ⅰ-level targets by C-A fractal, while they are included in the Ⅱ-level targets by C-A fractal. The overall targets delineated by C-A fractal are slightly expanded, but the position of the Ⅰ-level targets is more accurate. In order to further delineate the targets for further exploration, the two methods can be used in combination.
6 Discussion
Two models, RF28 and XGBoost11, were used for mineral probability modelling in the district. The prediction results of the two methods confirm each other to avoid the contingency of single method. The positions of Weilasituo Cu-Zn deposit and Bairendaba Ag-Pb-Zn deposit are consistent with the high probability zones. Bayanula Pb-Zn deposit is in the strike direction of the Weilasituo Cu-Zn deposit and the Bairendaba Ag-Pb-Zn deposit, which are both controlled by F2. In addition, it is worth noting that the Weilasituo Li polymetallic deposit and nearby small W deposit are consistent with the high probability zones (Figure 12B; Figure 13B). There is no Cu-Zn polymetallic deposit in the high probability zones on the north side of F3, but Bayangol small Fluorite deposit exists, and the prospecting potential is still very large.
The C-A fractal was used to grade the probability values of RF28 and XGBoost11 and Ⅰ-level targets and Ⅱ-level targets were obtained. The potential of exploring minerals is greater in the Ⅰ-level targets than in the Ⅱ-level targets. Compared with known deposits, the targets with large prospecting potential are relatively large, and there are still certain exploration risks. However, targets around known deposits are more likely to discover ore body than those of the same level. In order to better show the relationship between the two-level targets and each exploration criteria, they are superimposed in Figure 14.
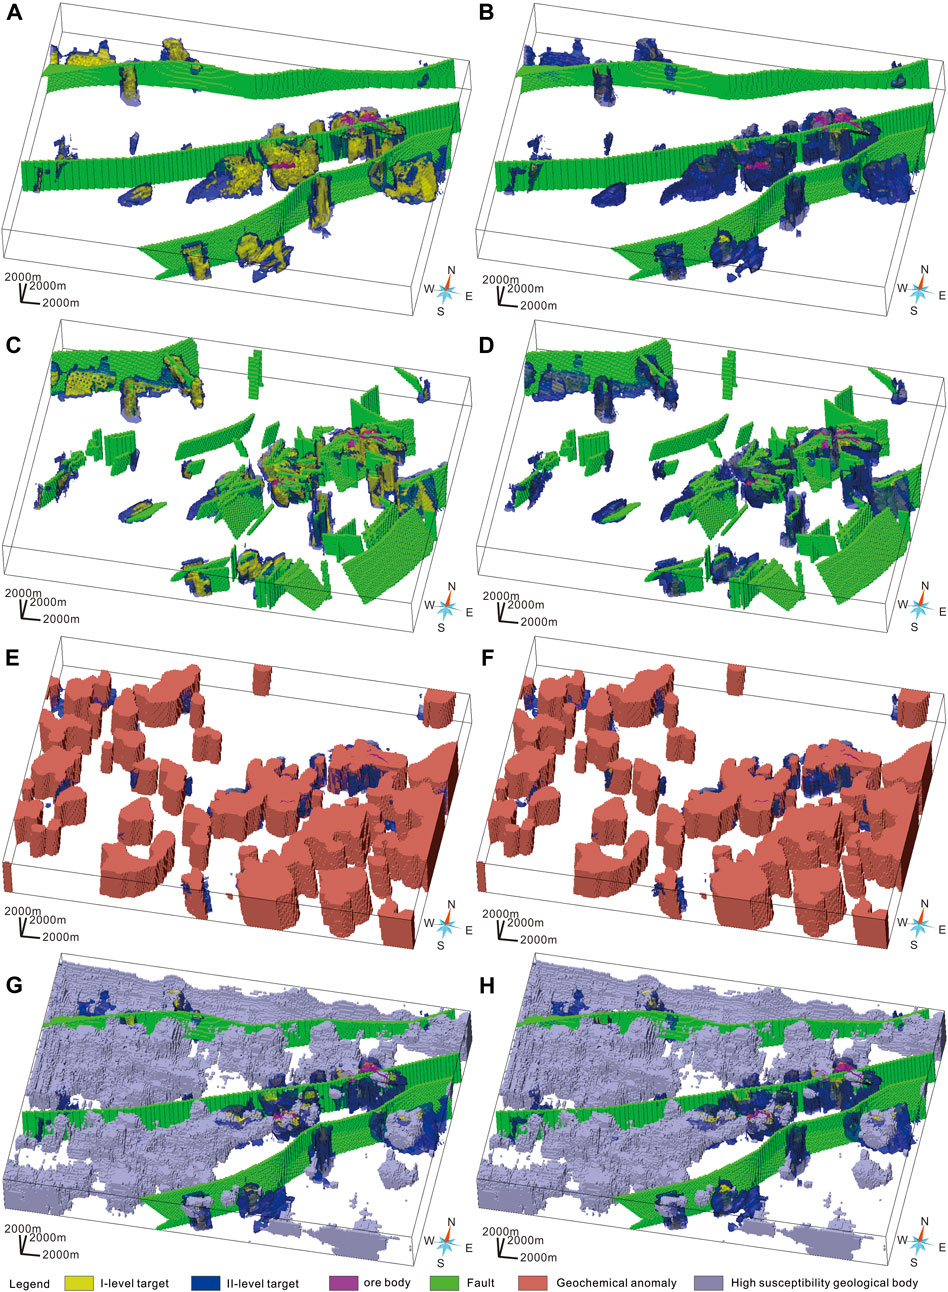
FIGURE 14. The Ⅰ-level targets and Ⅱ-level targets of RF28 and XGBoost11 superimpose exploration criteria: (A) and (B) regional fault; (C) and (D) secondary fault; (E) and (F) geochemical anomaly; (G) and (H) high magnetic susceptibility geological body.
Three regional faults control the delineated targets (Figures 14A, B). The targets are distributed in a NE-trending and extends to a depth of 3 km underground. The typical deposits (Weilasituo Cu-Zn deposit and Bairendaba Ag-Pb-Zn deposit) have large scale targets in the deep space (Figures 14A, B). The ore-bearing hydrothermal fluid required for mineralization migrates upward along regional faults. Regional faults control the distribution of major deposits in the district, such as the Weilasituo Cu-Zn deposit and Bairendaba Ag-Pb-Zn deposit along F2. More deposits are distributed on both sides of F1. Regional faults play a role of channel in the process of ore-bearing hydrothermal migration. The targets are mainly distributed where the secondary faults density is large (Figures 14C, D). According to the deposit geology, secondary faults as derivatives of regional faults, are specific ore-guiding and ore-bearing structures (Sun et al., 2011). Secondary faults are very developed in the Weilasituo Cu-Zn deposit mine and Bairendaba Ag-Pb-Zn deposit mine (Figures 14C, D), which provide a channel and space for mineralization. The targets developed near secondary faults are more worthy of further exploration. Further attention should be paid to the investigation of secondary faults. Geochemical anomalies such as Cu, Pb, Zn reflect zones with high value of metallogenic elements. The known deposits show Cu-Pb-Zn geochemical anomalies (Figure 9A). The targets are almost completely covered by geological bodies with geochemical anomaly (Figures 14E, F). The geochemical anomalies in the district are controlled by regional faults and spread in a NE-trending. Larger scale geochemical exploration should be carried out in the district. The Weilasituo Cu-Zn deposit and Bairendaba Ag-Pb-Zn deposit exhibit obvious magnetic anomalies (Figure 8A; Table3). The magnetic susceptibility of quartz diorite, ore-bearing diorite, ore-bearing complex or ore body are large. High magnetic susceptibility geological bodies with a larger extension depth are distributed along regional faults and they are in or around the targets (Figures 14G, H). According to magnetic susceptibility, they are considered to be concealed intrusions such as quartz diorite.
In terms of the geological feature, the known deposits and delineated targets are closely related to faults. The formation of NE-trending structure is related to the subduction of the Paleo-Pacific plate in Yanshanian (Mao et al., 2005). Three regional NE-trending faults (F1, F2, F3) constitute the structural framework system in the study area (Figure 1C). Regional faults provide channels for the transport of metallogenic materials in the deep space, and the known deposits are densely distributed on both sides of regional faults (Figure 1C). The secondary faults in the district are related to the specific mineralization (Sun et al., 2011). The orebodies of the known ore mines are NEE- and NW- trending (Figures 2B,C), which are related to the distribution of secondary faults (Sun et al., 2011). The copper and zinc mineralization in the western slope of the southern section of GXAR is mainly concentrated in 140-120 Ma, which is closely related to the subduction of the Paleo-Pacific plate (Mao et al., 2013). The age of the ore bodies is about 130 Ma (Pan et al., 2009; Chang and Lai, 2010), located in this tectonic environment, and intense magmatic activity provides metallogenic materials and heat sources (Pan et al., 2009). By analyzing the existing metallogenic geological characteristics, the known deposits show obvious magnetic anomaly and Cu-Zn related geochemical anomaly (Figure 8A; Figure 9A). The obvious magnetic anomalies are mainly produced by ore-bearing rocks (e.g., quartz diorite), and the copper and zinc geochemical anomalies are direct indicator elements for prospecting. The above metallogenic geological characteristics can integrate geological data, which is not only used to select the exploration criteria for mineral prospectivity modeling, but also to delineate the targets.
The exploration criteria and targets have important spatial associations. The relationship can reflect the importance of exploration criteria in mineral prospectivity modeling. According to special parameters of the RF and XGBoost, the feature importance of the predictive models can be obtained. It can connect the results of predictive models and the geological information (Zhang Z Q et al., 2021). The impurity of the RF algorithm and XGBoost can estimate the feature importance. According to the impurity, secondary faults and geochemical anomalies are two most important exploration criteria (Table 6). Secondary faults represent the pathways and the storage space for mineralization (Sun et al., 2011). Therefore, the new discovery of secondary faults is one of the important geological works in mineral exploration. Geochemical anomalies can indicate the location and scale of Cu, Zn and their associated elements. As mentioned above, ore bodies or mineralization can cause geochemical anomalies and thus provide important indications for mineral exploration. The impurity of magnetic susceptibility is relatively small, mainly due to the incomplete occurrence of ore bodies in the quartz diorite, and some of them in the metamorphic complex (Figures 3C, D; Table3). The metamorphic complex shows low magnetic susceptibility, while quartz diorite has high magnetic susceptibility, which leads to a small impurity of magnetic susceptibility. However, the variation of the distribution of ore body in magnetic susceptibility corresponds to the actual occurrence state of ore body. For the targets delineated in this paper, a large scale geological, geophysical, geochemical exploration and even drilling holes should be carried out.
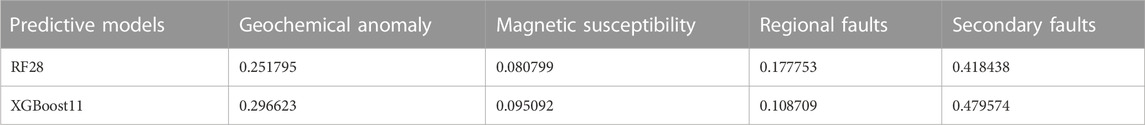
TABLE 6. The spatial associations between targets and exploration criteria reflected by the impurity of the RF28 and XGBoost11 predictive models.
7 Conclusion
Regional faults, secondary faults, magnetic susceptibility and geochemical anomalies (Cu-Pb-Zn) were determined as exploration criteria of Cu-Zn deposits in the Weilasituo-bairendaba district. RF and XGBoost algorithms with better performance were used for 3D mineral prospectivity modeling. The ROC(AUC), F1 score and P-A plot proved the reliability of the prediction results. RF28 model and XGBoost11 model were the optimal models. Five targets were delineated and graded by P-A plot and C-A fractal. They were divided into Ⅰ-level targets and Ⅱ-level targets. Target 1, target 2 and target 3 are controlled by F1. Target 1 and Target 2 are located in the periphery of the known deposits. Polymetallic ore occurrences have been found in Target 1 and Target 3. Target 4 and Target 5 are controlled by F2 and are located on the strike of the main ore-forming line of the Weilasituo Cu-Zn deposit and Bairendaba Ag-Pb-Zn deposit. Each target has great potential for prospecting in deep space. The potential of exploring deposits is greater in the Ⅰ-level targets than in the Ⅱ-level targets. The Ⅰ-level targets showing obvious geochemical anomaly and magnetic anomaly were controlled by regional and secondary faults. The importance of exploration criteria is also reflected by the impurity of the RF and XGBoost. The secondary faults and geochemical anomalies are important exploration criteria for Cu-Zn exploration. Thus, the Ⅰ-level targets are of great significance for future exploration of Cu-Zn deposits in the Weilasituo-bairendaba district.
Data availability statement
The raw data supporting the conclusion of this article will be made available by the authors, without undue reservation.
Author contributions
MG: Writing-original draft, methodology, formal analysis, visualization. GW: Supervision, project administration, funding acquisition. YX, NM, LH, LZ, and RW: Data processing, resources. All authors have read and agreed to the published version of the manuscript.
Funding
This research was supported by the China Central Budget project (Grant No. WKZB2011BJM300170/008) and 2021 Graduate Innovation Fund Project of China University of Geosciences, Beijing (Grant No. ZD2021YC008).
Acknowledgments
The authors appreciate Inner Mongolia Geology and Mineral Exploration Co., Ltd. for the data support. The authors thank our research group members who are helpful to this study.
Conflict of interest
The authors declare that the research was conducted in the absence of any commercial or financial relationships that could be construed as a potential conflict of interest.
Publisher’s note
All claims expressed in this article are solely those of the authors and do not necessarily represent those of their affiliated organizations, or those of the publisher, the editors and the reviewers. Any product that may be evaluated in this article, or claim that may be made by its manufacturer, is not guaranteed or endorsed by the publisher.
References
An, P., Moon, W. M., and Bonham-Carter, G. F. (1992). “On knowledge-based approach on integrating remote sensing, geophysical and geological information,” in Proceedings of International Geoscience and Remote Sensing Symposium (IGARSS), Houston, TX, USA, 26-29 May 1992, 34–38.
Bergstra, J., Bardenet, R., Bengio, Y., and K´egl, B. (2011). Algorithms for hyper-parameter optimization. Adv. Neural Inf. Process. Syst. 2011, 2546–2554. doi:10.5555/2986459.2986743
Bergstra, J., Yamins, D., and Cox, D. D. (2013). “Hyperopt: A python library for optimizing the hyperparameters of machine learning algorithms,” in Proceedings of the 12th Python in Science Conference, Citeseer, 20.
Bharti, J. P., Mishra, P., Moorthy, U., Sathishkumar, V. E., Cho, Y. Y., and Samui, P. (2021). Slope stability analysis using Rf, gbm, cart, bt and xgboost. Geotech. Geol. Eng. 39, 3741–3752. doi:10.1007/s10706-021-01721-2
Bonham-Carter, G. F., Agterberg, F. P., and Wright, D. F. (1989). “Weights of evidence modelling: A new approach to mapping mineral potential,” in Statistical applications in the earth sciences geological survey of Canada. Editors F. P. Agterberg, and G. F. Bonham-Carter (Ottawa: Ca- nadian Government Publishing Centre). 171–183.
Bonham-Carter, G. F. (1994). Geographic information systems for geoscientists: Modelling with GIS. Ontario: Pergamon, 398.
Carranza, E. J. M., and Laborte, A. G. (2015a). Data-driven predictive mapping of gold prospectivity, Baguio district, Philippines: Application of Random Forests algorithm. Ore Geol. Rev. 71, 777–787. doi:10.1016/j.oregeorev.2014.08.010
Carranza, E. J. M., and Laborte, A. G. (2015b). Random forest predictive modeling of mineral prospectivity with small number of prospects and data with missing values in Abra (Philippines). Comput. Geosciences 74, 60–70. doi:10.1016/j.cageo.2014.10.004
Chang, Y., and Lai, Y. (2010). Study on characteristics of ore-forming fluid and chronology in the Yindu Ag-Pb-Zn polymetallic ore deposit, Inner Mongolia. Acta Sci. Nat. Univ. Pekin. 46 (4), 581–593.
Chen, S. J., Hu, X. Y., and Liu, S. (2021). Application study on high precision aeromagnetic survey in Weilasituo, Inner Mongolia, China. Earth Science. Available at: https://kns.cnki.net/kcms/detail/42.1874.P.20211223.0953.004.html.
Chen, T., and Guestrin, C. (2016). “Xgboost: A scalable tree boosting system,” in Proc. 22nd ACM SIGKDD International Conference on Knowledge Discovery and Data Mining, California, San Francisco, USA, August 13 - 17, 2016, 785–794. doi:10.1145/2939672.2939785
Chen, Y. L., and Wu, W. (2019). Isolation forest as an alternative data-driven mineral prospectivity mapping method with a higher data-processing efficiency. Nat. Resour. Res. 28, 31–46. doi:10.1007/s11053-018-9375-6
Chen, Y. L., and Wu, W. (2017). Mapping mineral prospectivity by using one-class support vector machine to identify multivariate geological anomalies from digital geological survey data. Aust. J. Earth Sci. 64, 639–651. doi:10.1080/08120099.2017.1328705
Chen, Y. Q., Zhang, L. N., and Zhao, B. B. (2016). Application of Bi-dimensional empirical mode decomposition (BEMD) modeling for extracting gravity anomaly indicating the ore-controlling geological architectures and granites in the Gejiu tin-copper polymetallic ore field, southwestern China. Ore Geol. Rev. 88, 832–840. doi:10.1016/j.oregeorev.2016.06.031
Cheng, Q. M., Agterberg, F. P., and Ballantyne, S. B. (1994). The separation of geochemical anomalies from background by fractal methods. J. Geochem. Explor. 51, 109–130. doi:10.1016/0375-6742(94)90013-2
Freund, Y., and Schapire, R. E. (1997). A decision-theoretic generalization of on-line learning and an application to boosting. J.Comput. Syst. Sci. 55, 119–139. doi:10.1006/jcss.1997.1504
Gao, M., Wang, G. W., Yang, W. D., Zhang, Z. Q., Cai, D. Z., Xu, Y. C., et al. (2023). Bagging-based positive–unlabeled data learning algorithm with base learners random forest and XGBoost for 3D exploration targeting in the kalatongke district, xinjiang, China. Nat. Resour. Res. 32, 437–459. doi:10.1007/s11053-023-10170-y
Gao, X., Zhou, Z. H., Breiter, K., Ouyang, H. G., and Liu, J. (2019). Ore-formation mechanism of the Weilasituo tin–polymetallic deposit, NE China: Constraints from bulk-rock and mica chemistry, He–Ar isotopes, and Re–Os dating. Ore Geol. Rev. 109, 163–183. doi:10.1016/j.oregeorev.2019.04.007
Gao, Y., Zhang, Z. J., Xiong, Y. H., and Zuo, R. G. (2016). Mapping mineral prospectivity for Cu polymetallic mineralization in southwest Fujian Province, China. Ore Geol. Rev. 75, 16–28. doi:10.1016/j.oregeorev.2015.12.005
Gini, C. (1997). Concentration and dependency ratios (in Italian). Engl. Transl. Rivista di Politica Econ. 87, 769–789.
Guo, G. J. (2016). Discussion on geological characteristics and metallogenic origin of Weilasituo Sn polymetal deposit in Inner Mongolia. Beijing: China University of Geosciences, 1–69. (in Chinese with English abstract).
Guo, L. J., Xie, Y. L., Hou, Z. Q., Wang, S., Chen, W., Li, Z., et al. (2009). Geology and ore fluid characteristics of the Bairendaba silver polymetallic deposit in Inner Mongolia. Acta Petrologica Mineralogica 28 (1), 26–36. (in Chinese with English abstract).
Guo, L. X., Liu, J. M., Zeng, Q. D., Jiang, H. C., and Liu, H. T. (2018). Fluid inclusion characteristics of the Weilasituo Sn polymetallic ore deposit, Inner Mongolia, China. Earth Sci. Front. 25 (1), 168–181. (in Chinese with English abstract).
Han, S. L., Wang, S., Tang, Z. P., Tan, K. X., Duan, X. Z., He, H. Y., et al. (2020). Integrated geophysical exploration of the coupling of a concealed rock body and metallogenic structures—Ag-Pb-Zn mining area case study in jilinbaolige, inner Mongolia, China. J. Appl. Geophys. 178, 104048. doi:10.1016/j.jappgeo.2020.104048
Hariharan, S., Tirodkar, S., Porwal, A., Bhattacharya, A., and Joly, A. (2017). Random forest-based prospectivity modelling of greenfield terrains using sparse deposit data: An example from the tanami region, western Australia. Nat. Resour. Res. 26 (4), 489–507. doi:10.1007/s11053-017-9335-6
Ho, T. K. (1995). “Random decision forests,” in Proceedings of the 3rd International Conference on Document Analysis and Recognition, Montreal, QC, Canada, 14-16 August 1995, 14–16.
Hong, D. W., Wang, S. G., Xie, X. L., Zhang, J. S., and Wang, T. (2003). Metallogenic province derived from mantle sources: A case study of central asian orogenic belt. Mineral. Deposits 22 (1), 41–55.
Houlding, S. W. (1994). 3D geoscience mdeling: Computer techniques for geological charaterization. Berlin, Germany: Springer-Verlag, 1–304.
Hua, R. M., and Mao, J. W. (1999). A preliminary discussion on the Mesozoic metallogenic explosion in east China. Mineral. Deposits 18 (4), 300–307.
Huang, N. E., Shen, Z., Long, S. R., Wu, M. L. C., Shih, H. H., Zheng, Q. N., et al. (1998). The empirical mode decomposition and the Hilbert spectrum for nonlinear and non-stationary time series analysis. Proc. R. Soc. A-Math. Phys. Eng. Sci. 454 (1971), 903–995. doi:10.1098/rspa.1998.0193
IMGECL (Inner Mongolia Geological Exploration Co. LTD) (2018). Report on the sub-project of deep resources investigation in weilasto region. Inn. Mong. 2018, 1–255. (in Chinese).
Jia, R., Lv, Y. K., Wang, G. W., Carranza, E. J. M., Chen, Y. Q., Wei, C., et al. (2021). A stacking methodology of machine learning for 3D geological modeling with geological-geophysical datasets, Laochang Sn camp, Gejiu (China). Comput. Geosciences 151, 104754. doi:10.1016/j.cageo.2021.104754
Jiang, S. H., Nie, F. J., Liu, Y. F., and Yun, F. (2010). Sulfur and lead isotopic compositions of Bairendaba and Weilasituo silver-polymetallic deposits, Inner Mongolia. Mineral. Deposits 28 (1), 101–112. (in Chinese with English abstract).
Li, B. Y., Jiang, D. W., Fu, X., Wang, L., Gao, S. Q., Fan, Z. Y., et al. (2018). Geological characteristics and prospecting significance of Weilasituo li polymetallic deposit, Inner Mongolia. Mineral. Explor. 9 (6), 1185–1191. (in Chinese with English abstract).
Li, R. X., Wang, G. W., and Carranza, E. J. M. (2016). GeoCube: A 3D mineral resources quantitative prediction and assessment system. Comput. Geosciences 89, 161–173. doi:10.1016/j.cageo.2016.01.012
Li, S., Chen, J. P., Liu, C., and Wang, Y. (2021). Mineral prospectivity prediction via convolutional neural networks based on geological big data. J. Earth Sci. 32 (2), 327–347. doi:10.1007/s12583-020-1365-z
Li, W. Y., and Zhang, J. (2013). The geophysical study of the southern section of the greater hinggan range metallogenic belt: A case study of the bairendaba Ag-Pb-Zn deposit. Acta Mineral. Sin. 33 (2), 788–789. (in Chinese).
Li, X. H., Yuan, F., Zhang, M. M., Jia, C., Jowitt, S. M., Ord, A., et al. (2015). Three-dimensional mineral prospectivity modeling for targeting of concealed mineralization within the zhonggu iron orefield, Ningwu Basin, China. Ore Geol. Rev. 71, 633–654. doi:10.1016/j.oregeorev.2015.06.001
Li, Y., and Oldenburg, D. (1996). 3-D inversion of magnetic data. Geophysics 61, 394–408. doi:10.1190/1.1443968
Lin, Q., Ge, W. C., Sun, D. Y., and Wu, F. Y. (1999). Geomechanical significance of the Mesozoic volcanics in northeast Asia. Chin. J. Geophys. 42, 75–84.
Liu, J. M., Zhang, R., and Zhang, Q. Z. (2004). The regional metallogeny of da hinggan ling, China. Earth science Frontiers. Beijing): China University of Geosciences, 269–277. (in Chinese with English abstract).
Liu, R. L., Wu, G., Li, T. G., Chen, G. Z., Wu, L. W., Zhang, P. C., et al. (2018). LA-ICP-MS cassiterite and zircon U-Pb ages of the Weilasituo tin-polymetallic deposit in the southern Great Xing’an Range and their geological significance. Earth Sci. Front. 25 (5), 183–201. doi:10.13745/j.esf.sf.2018.4.1
Liu, Y. F., Fan, Z. Y., Jiang, H. C., Nie, F. J., Jiang, S. H., Ding, C. W., et al. (2014). Genesis of the Weilasituo-Bairendaba porphyry-hydrothermal vein type system in Inner Mongolia, China. Acta Geol. Sin. 88 (12), 2373–2385. (in Chinese with English abstract).
Liu, Y. F., Jiang, S. H., and Bagas, L. (2016). The Genesis of metal zonation in the Weilasituo and Bairendaba Ag-Zn-Pb-Cu-(Sn-W) deposits in the shallow part of a porphyry Sn-W-Rb system, Inner Mongolia, China. Ore Geol. Rev. 75, 150–173. doi:10.1016/j.oregeorev.2015.12.006
Liu, Y. F., Jiang, S. H., and Zhang, Y. (2010). The SHRIMP zircon U-Pb dating and geological features of Bairendaba diorite in the Xilinhaote area, Inner Mongolia, China. Geol. Bull. China 29 (5), 688–696.
Liu, Y. F., Nie, F. J., Jiang, S. H., Liu, Y., and Liang, Q. L. (2012). Bairendaba Pb-Zn-Ag polymetallic deposit in inner Mongolia: The mineralization zoning and its origin. J. Jilin Univ. (Earth Sci. Ed. 42 (4), 1055–1068. (in Chinese with English abstract).
Mao, J. W., and Wang, Z. L. (2000). A preliminary study on time limits and geodynamic setting of large-scale metallogeny in east China. Mineral. Deposits 19 (4), 289–296.
Mao, J. W., Xie, G. Q., Zhang, Z. H., Li, X. F., Wang, Y. T., Zhang, C. Q., et al. (2005). Mesozoic large-scale metallogenic pulses in North China and corresponding geodynamic settings. Acta Petrol. Sin. 21 (1), 169–188. (in Chinese with English abstract).
Mao, J. W., Zhou, Z. H., Wu, G., Jiang, S. H., Liu, C. L., Li, H. M., et al. (2013). Metallogenic regularity and minerogenetic series of ore deposits in Inner Mongolia and adjacent areas. Mineral. Deposits 32 (4), 715–729. (in Chinese with English abstract).
Mao, X., Ren, J., Liu, Z., Chen, J., Tang, L., Deng, H., et al. (2019). Three-dimensional prospectivity modeling of the jiaojia-type gold deposit, jiaodong peninsula, eastern China: A case study of the dayingezhuang deposit. J. Geochem. Explor. 203, 27–44. doi:10.1016/j.gexplo.2019.04.002
Mei, W., Lv, X. B., Tang, R. K., Wang, X. D., and Zhao, Y. (2015). Ore-forming fluid and its evolution of Bairendaba-Weilasituo deposits in west slope of southern Great Xing’an Range. Earth Science-Journal China Univ. Geosciences 40 (1), 145–162. doi:10.3799/dqkx.2015.010
Merembayev, T., Yunussov, R., and Yedilkhan, A. (2018). “Machine learning algorithms for classification geology data from well logging,” in 2018 14th International Conference on Electronics Computer and Computation (ICECCO), Kaskelen, Kazakhstan, 29 November 2018 - 01 December 2018. doi:10.1109/ICECCO.2018.8634775
Nunes, J. C., Bouaoune, Y., Delechelle, E., Niang, O., and Bunel, P. (2003). Image analysis by bi-dimensional empirical mode decomposition. Image Vis. Comput. 21, 1019–1026. doi:10.1016/s0262-8856(03)00094-5
Nunes, J. C., Guyot, S., and Delechelle, E. (2005). Texture analysis based on local analysis of the bidimensional empirical mode decomposition. Mach. Vis. Appl. 16, 177–188. doi:10.1007/s00138-004-0170-5
Ouyang, H. G., Mao, J. W., Santosh, M., Wu, Y., Hou, L., and Wang, X. F. (2014). The early Cretaceous Weilasituo Zn-Cu-Ag vein deposit in the southern Great Xing’an Range, northeast China: Fluid inclusions, H, O, S, Pb isotope geochemistry and genetic implications. Ore Geol. Rev. 56, 503–515. doi:10.1016/j.oregeorev.2013.06.015
Ouyang, H. G. (2013). “Metallogenesis of Bairendaba-Weilasituo silver-polymetallic deposit and its geodynamic setting,” in The southern segment of great xing’an range, NE China (Beijing): China University of Geosciences), 1–178. (in Chinese with English abstract).
Pan, X. F., Guo, L. J., Wang, S., Xue, H. M., Hou, Z. Q., Tong, Y., et al. (2009). Laser microprobe Ar-Ar dating of biotite from the Weilasituo Cu-Zn polymetallic deposit in Inner Mongolia. Acta Petrologica Mineralogica 28 (5), 473–479. (in Chinese with English abstract).
Powers, D. M. W. (2011). Evaluation: From precision, recall and f-measure to roc, informedness, markedness & correlation. J. Mach. Learn. Technol. 2 (1), 37–63. doi:10.48550/arXiv.2010.16061
Ren, J. S., Niu, B. G., He, Z. J., Xie, G. L., and Liu, Z. G. (1997). Tectonic framework and geodynamic evolution of eastern China. DiXue YanJiu 6 (29-30), 43–55.
Rodriguez-Galiano, V. F., Chica-Olmo, M., and Chica-Rivas, M. (2014). Predictive modelling of gold potential with the integration of multisource information based on random forest: A case study on the rodalquilar area, southern Spain. Int. J. Geogr. Inf. Sci. 28, 1336–1354. doi:10.1080/13658816.2014.885527
Shao, J. A., Zhang, L. Q., and Mou, B. L. (1998). Tectonic thermal evolution of Mesocene in the middle-central section of Daxing’anling. Sci. China (Series D) 28 (3), 390–394. (in Chinese with English abstract).
Shi, G. H., Liu, D. Y., Zhang, F. Q., Jiang, P., Miao, L. C., Shi, Y. R., et al. (2003). SHRIMP U-Pb zircon geochronology and its implications on the xilin gol complex, inner Mongolia, China. Chin. Sci. Bull. 48 (24), 2742–2748. doi:10.1360/03wd0191
Sun, A. Q., Niu, S. Y., Ma, B. J., Nie, F. J., Jiang, S. H., Zhang, J. Z., et al. (2011). A comparative study of ore-forming structures in Bairendaba and Weilasituo Silver-polymetallic deposits of Inner Mongolia. J. Jilin Univ. (Earth Sci. Ed. 41 (6), 1784–1793. (in Chinese with English abstract).
Tang, R. K., Lv, X. B., Cao, X. F., Mei, W., Shang, S. C., Wu, J. L., et al. (2014). Mineralogy and metallogenic mechanism of Weilasituo and bairendaba deposits, inner Mongolia, China. Earth Science-Journal China Univ. Geosciences 39 (6), 671–686. (in Chinese with English abstract).
Tao, G. S., Wang, G. W., and Zhang, Z. Q. (2018). Extraction of mineralization-related anomalies from gravity and magnetic potential fields for mineral exploration targeting: Tongling Cu (-Au) district, China. Nat. Resour. Res. 28 (2), 461–486. doi:10.1007/s11053-018-9397-0
Wang, C. M., Zhang, S. T., and Deng, J. (2006). The metallogenic space-time structure of copper-polymetallic deposits in the southern segment of Da Hinggan Mountains, China. J. Chengdu Univ. Technol. Sci. Technol. Ed. 33 (5), 478–484.
Wang, F. X., Bagas, L., Jiang, S. H., and Liu, Y. F. (2017). Geological, geochemical, and geochronological characteristics of Weilasituo Sn-polymetal deposit, Inner Mongolia, China. Ore Geol. Rev. 80, 1206–1229. doi:10.1016/j.oregeorev.2016.09.021
Wang G W, G. W., Ma, Z. B., Li, R. X., Song, Y. W., Qu, J. N., Zhang, S. T., et al. (2017). Integration of multi-source and multi-scale datasets for 3D structural modeling for subsurface exploration targeting, Luanchuan Mo-polymetallic district, China. J. Appl. Geophys. 139, 269–290. doi:10.1016/j.jappgeo.2017.02.027
Wang, G. W., Zhang, Z. Q., Li, R. X., Li, J. J., Sha, D. M., Zeng, Q. D., et al. (2021). Resource prediction and assessment based on 3D/4D big data modeling and deep integration in key ore districts of North China. Sci. China Earth Sci. 64 (9), 1590–1606. doi:10.1007/s11430-020-9791-4
Wang, J., Hou, Q. Y., Chen, Y. L., Liu, J. B., Wang, Z., and Leng, F. R. (2010). Fluid inclusion study of the Weilasituo Cu polymetal deposit in Inner Mongolia. Geoscience 24 (5), 847–855. (in Chinese with English abstract).
Wang, J., Zuo, R. G., and Xiong, Y. H. (2020). Mapping mineral prospectivity via semi-supervised random forest. Nat. Resour. Res. 29, 189–202. doi:10.1007/s11053-019-09510-8
Wang, S. S., Zhou, K. F., Wang, J. L., and Zhao, J. (2022). Identifying and mapping alteration minerals using HySpex airborne hyperspectral data and random forest Algorithm. Front. Earth Sci. 10, 871529. doi:10.3389/feart.2022.871529
Wang, X. D., Lv, X. B., Mei, W., Tang, R. K., and Li, C. C. (2014). Characteristics and evolution of ore-forming fluids in Bairendaba Ag-Pb-Zn polymetallic deposit, Inner Mongolia. Mineral. Deposits 33 (2), 406–418. (in Chinese with English abstract).
Wang, X. Y., Hou, Q. Y., Wang, J., Chen, Y. L., Liu, J. B., Wang, Z., et al. (2013). SHRIMP geochronology and Hf isotope of zircons from granitoids of the Weilasituo deposit in Inner Mongolia. Geoscience 27 (1), 67–78.
Wang Y, Y., Xie, Y. L., Chen, W., Zhong, R. C., and Wu, H. R. (2019). Study on metallogenic mechanism of Bairendaba Ag polymetallic deposit in Inner Mongolia. J. Hefei Univ. Technol. Nat. Sci. 42 (3), 315–320. (in Chinese with English abstract).
Wang, Z. L., Deng, Y. M., Meng, Y. S., and Liu, R. D. (2019). The application of integrated geophysical prospecting method to the prospecting for concealed orebodies in the northern area of the Weilasituo copper polymetallic deposit. Geophys. Geochem. Explor. 43 (5), 958–965. doi:10.11720/wtyht.2019.0293
Xi, M. J., Zhu, L. X., Ma, S. M., Hu, S. Q., Liu, C. M., and Wang, H. Y. (2014). The primary geochemical pattern of the west Bairendaba zinc polymetallic ore district in Inner Mongolia. Geophys. Geochem. Explor. 38 (2), 239–247. doi:10.11720/j.issn.1000-8918.2014.2.09
Xiao, K. Y., Li, N., Alok, P., Jung, H. E., Leon, B., and Lu, Y. J. (2015). GIS-based 3D prospectivity mapping: A case study of jiama copper-polymetallic deposit in tibet, China. Ore Geol. Rev. 71, 611–632. doi:10.1016/j.oregeorev.2015.03.001
Xu, G. M., Cheng, Q. M., Zuo, R. G., and Wang, H. C. (2015). Application of improved bi-dimensional empirical mode decomposition (BEMD) based on Perona-Malik to identify copper anomaly association in the southwestern Fujian (China). J. Geochem. Explor. 164, 65–74. doi:10.1016/j.gexplo.2015.09.013
Xu, W. L., Wang, F., Pei, F. P., Meng, E., Tang, J., Xu, M. J., et al. (2013). Mesozoic tectonic regimes and regional ore-forming background in NE China: Constraints from spatial and temporal variations of Mesozoic volcanic rock associations. Acta Petrol. Sin. 29 (2), 339–353.
Xue, H. M., Guo, L. J., Hou, Z. Q., Tong, Y., Pan, X. F., and Zhou, X. W. (2010). SHRIMP zircon U-Pb ages of the middle Neopaleozoic unmetamorphosed magmatic rocks in the southwestern slope of the Da Hinggan Mountains, Inner Mongolia. Acta Petrologica Mineralogica 29 (6), 811–823.
Yang, F. F., Wang, Z. Y., Zuo, R. G., Sun, S. Q., and Zhou, B. (2023). Quantification of uncertainty associated with evidence layers in mineral prospectivity mapping using direct sampling and convolutional neural network. Nat. Resour. Res. 32 (1), 79–98. doi:10.1007/s11053-022-10144-6
Yang, F. (2017). Geochemical quantitative assessment of mineral resource potential in the central and southern Da Hinggan Mountains in Inner Mongolia. Beijing): China University of Geosciences, 1–147. (in Chinese with English abstract).
Yang, F., Wang, G. W., Santosh, M., Li, R. X., Tang, L., Cao, H. W., et al. (2017). Delineation of potential exploration targets based on 3D geological modeling: A case study from the laoangou Pb-Zn-Ag polymetallic ore deposit, China. Ore Geol. Rev. 89, 228–252. doi:10.1016/j.oregeorev.2017.06.013
Yi, Z. B., Cao, J. J., Jiang, T., and Wang, Z. Y. (2020). Characterization of metal-bearing particles in groundwater from the Weilasituo Zn-Cu-Ag deposit, Inner Mongolia, China: Implications for mineral exploration. Ore Geol. Rev. 117, 103270. doi:10.1016/j.oregeorev.2019.103270
Yousefi, M., and Carranza, E. J. M. (2016). Data-driven index overlay and Boolean logic mineral prospectivity modeling in greenfields exploration. Nat. Resour. Res. 25, 3–18. doi:10.1007/s11053-014-9261-9
Yousefi, M., and Carranza, E. J. M. (2015). Prediction-area (P-A) plot and C-A fractal analysis to classify and evaluate evidential maps for mineral prospectivity modeling. Comput. Geosci. 79, 69–81. doi:10.1016/j.cageo.2015.03.007
Yuan, F., Zhang, M. M., Li, X. H., Ge, C., Lu, S. M., Li, J. S., et al. (2019). Prospectivity modeling: From two-dimension to three-dimension. Acta Petrol. Sin. 35 (12), 3863–3874. (in Chinese with English abstract). doi:10.18654/1000-0569/2019.12.18
Zeng, Q. D., Liu, J. M., Chu, S. X., Guo, Y. P., Gao, S., Guo, L. X., et al. (2016). Poly-metal mineralization and exploration potential in southern segment of the Da Hinggan Mountains. J. Jilin Univ. (Earth Sci. Ed. 46 (4), 1100–1123.
Zhang, C. J., Zuo, R. G., and Xiong, Y. H. (2021). Detection of the multivariate geochemical anomalies associated with mineralization using a deep convolutional neural network and a pixel-pair feature method. Appl. Geochem. 130, 104994. doi:10.1016/j.apgeochem.2021.104994
Zhang, Q. P., Chen, J. P., Xu, H., Jia, Y. L., Chen, X. W., Jia, Z., et al. (2022). Three-dimensional mineral prospectivity mapping by XGBoost modeling: A case study of the lannigou gold deposit, China. Nat. Resour. Res. 31, 1135–1156. doi:10.1007/s11053-022-10054-7
Zhang, W. Y., Nie, F. J., Liu, S. W., Zuo, L. Y., Shan, L., and Yao, X. F. (2013). Characteristics and metallogenic regularity of ore deposits on the Western slope of the southern section of the Da Hinggan Mountains metallogenic belt. Geol. China 40 (5), 1583–1599. (in Chinese with English abstract).
Zhang, X. B. (2017). Pb-Zn polymetallic deposits metallogenic series and prospecting direction of the west slope of southern Great Xing’an Range. Jilin: Jilin University, 1–167. (in Chinese with English abstract).
Zhang, Y. F., Zhou, Y. H., Dong, Y., Li, C., and Wang, G. (2021). Geochronological, geochemical and Sr-Nd isotopic characteristics of carboniferous rock mass in bayern daba area, inner Mongolia and its constraints on the central asian orogenic belt. Earth Sci. 47, 1234. doi:10.3799/dqkx.2021.059
Zhang, Z. J., Zuo, R. G., and Xiong, Y. H. (2016). A comparative study of fuzzy weights of evidence and random forests for mapping mineral prospectivity for skarn-type Fe deposits in the southwestern Fujian metallogenic belt, China. Sci. China Earth Sci. 59 (3), 556–572. doi:10.1007/s11430-015-5178-3
Zhang, Z. Q., Wang, G. W., Carranza, E. J. M., Zhang, J. J., Tao, G. S., Zeng, Q. D., et al. (2019). Metallogenic model of the Wulong gold district, China, and associated assessment of exploration criteria based on multi-scale geoscience datasets. Ore Geol. Rev. 114, 103138. doi:10.1016/j.oregeorev.2019.103138
Zhang, Z. Q., Wang, G. W., Liu, C., Cheng, L. Z., and Sha, D. M. (2021). Bagging-based positive-unlabeled learning algorithm with Bayesian hyperparameter optimization for three-dimensional mineral potential mapping. Comput. Geosciences 154, 104817. doi:10.1016/j.cageo.2021.104817
Zhou, Z. H., Gao, X., Ouyang, H. G., Liu, J., and Zhao, J. Q. (2019). Formation mechanism and intrinsic genetic relationship between tin-tungsten-lithium mineralization and peripheral lead-zinc-silver-copper mineralization: Exemplified by Weilasituo tin-tungsten-lithium polymetallic deposit, Inner Mongolia. Mineral. Deposits 38 (5), 1004–1022. (in Chinese with English abstract). doi:10.16111/j.0258-7106.2019.05.004
Zhu, Z. Y., and Liu, G. F. (2016). Analysis of potential field data and its application based on bidimensional empirical mode decomposition. Prog. Geophys. 31 (2), 882–892.
Zuo, R. G., and Carranza, E. J. M. (2011). Support vector machine: A tool for mapping mineral prospectivity. Comput. Geosciences 37, 1967–1975. doi:10.1016/j.cageo.2010.09.014
Keywords: 3D mineral exploration Cu-Zn targeting, multi-source geoscience datasets, random forest, XGBoost, Weilasituo-bairendaba district
Citation: Gao M, Wang G, Xu Y, Mou N, Huang L, Zuo L and Wu R (2023) 3D mineral exploration Cu-Zn targeting with multi-source geoscience datasets in the Weilasituo-bairendaba district, Inner Mongolia, China. Front. Earth Sci. 11:1102640. doi: 10.3389/feart.2023.1102640
Received: 19 November 2022; Accepted: 28 March 2023;
Published: 10 April 2023.
Edited by:
Alok Porwal, Indian Institute of Technology Bombay, IndiaReviewed by:
Xiaohui Li, Hefei University of Technology, ChinaFan Xiao, Sun Yat-sen University, China
Copyright © 2023 Gao, Wang, Xu, Mou, Huang, Zuo and Wu. This is an open-access article distributed under the terms of the Creative Commons Attribution License (CC BY). The use, distribution or reproduction in other forums is permitted, provided the original author(s) and the copyright owner(s) are credited and that the original publication in this journal is cited, in accordance with accepted academic practice. No use, distribution or reproduction is permitted which does not comply with these terms.
*Correspondence: Gongwen Wang, Z3d3YW5nQGN1Z2IuZWR1LmNu