 Shimin Liu
 Lu Zhou1,2
- 1Southwest Petroleum University a. School of Geoscience and Technology; b Sichuan Province Key Laboratory of Natural Gas Geology, Southwest Petroleum University, Chengdu, Sichuan, China
- 2State Key Laboratory of Oil and Gas Reservoir Geology and Exploration, Southwest Petroleum University, Chengdu, China
- 3Research Institute of Exploration and Development, Petro China Southwest Oil and Gas Field Company, Chengdu, China
- 4BGP Southwest Geophysical Company, Chengdu, China
In conventional sequence stratigraphy research, owing to the limitation of the resolution of seismic data, strata can only be divided into third order sequences at most on the seismic profile. In this study, the vertical fourth order sequence is divided using the high vertical resolutions of gamma ray (GR), uranium (U), thorium (Th), and potassium (K) curves in the logging curves, and the sequence divided in the depth system is then accurately superimposed on the seismic profile through one dimensional forward modelling. Subsequently, through three dimensional Fourier transform technology, the dip angle and azimuth information of the seismic data in the entire region are scanned to obtain the horizons. Through the progradation and retrogradation characteristics of sediments in the Wheeler system, guided by the sequence framework, the horizontal interpretation of the fourth order sequence system tract is conducted in the entire region. Finally, through attribute optimisation, the root mean square amplitude attribute, with the highest degree of coincidence with well data, is selected to study the evolution characteristics of sedimentary microfacies in different periods in the four system tracts. Notably, the strata of Qixia Formation in the study area can be divided into two-fourth order sequences, wherein SQ1 comprised transgressive systems tract 1 (TST1) and high stand systems tract 1 (HST1), and SQ2 comprised TST2 and HST2. With the change in the relative sea level cycle, the strata of Qixia Formation in the study area are developed by overlapping the sedimentary microfacies of the interbank depression, interbank sea, and intraplatform shoal from bottom to top.
1 Introduction
In recent years, many studies have been conducted on the sedimentary facies and reservoir prediction of Qixia Formation in the Sichuan Basin. For example, DAI Danshen suggested that the gas producing beds of the Permian system were concentrated in areas with dense fractures. With in-depth study, gas reservoirs with huge geological reserves were also found in the dolomite reservoirs of the shoal area. Since then, the study on the sedimentation and sequence of the Sichuan Basin has begun. For example, FengZengzhao stated that the Sichuan Basin, as a whole, belongs to the carbonate platform facies (Feng et al., 1996). On this basis, Huangxianping et al. further identified the marginal shoals, and considered that the marginal shoals were closely distributed in an arc along the basin margin from West Sichuan to South Sichuan (Huang et al., 2004). On this basis, Chenzongqing further identified the inner shoal and the gentle slope of the inner platform in the basin (Chen, 2007). Thus far, the beach facies gas reservoir of Qixia Formation in the Sichuan Basin has been well established, which is mainly located in the platform margin beach and intraplatform shoal facies zone.
However, most of the previous studies described the overall phenomenon and did not conduct a detailed investigation of sedimentary microfacies in local specific areas under the high-precision sequence framework (Huang, et al., 2014; Jiang et al., 2014; Dai et al., 2017; Xiao et al., 2020; Li et al., 2021; Zhang, et al., 2022c). Among the controlling factors of the gas bearing reservoir of Qixia Formation, beach facies sedimentation is the material basis for reservoir development, the carrier of primary pores and soluble minerals, and will affect all diagenetic transformation after sedimentation (Hu et al., 2018). Therefore, the detailed description of sedimentary microfacies in the study area is of great significance for oil and gas reservoir prediction, exploration, and development.
Based on previous studies (Jorgson, 1981; Sheu and Burke, 1982; Sheu, 1990; Mei et al., 2007; Elisa et al., 2011; Zhang, et al., 2014; Zhang, et al., 2019) and the newly obtained drilling cores and logging and seismic data, combined with new mining achievements in the Permian strata in recent years, we conduct a detailed sequence and sedimentary analysis of the Gaomo block in the middle of Sichuan Basin. We aim to reveal the relationship between the distribution of sedimentary facies and relative sea level change cycles of Qixia Formation in the study area, and study the distribution law of beach facies in Qixia Formation.
2 Geological setting
2.1 Geological background of the study area
The lower Permian in the Sichuan Basin comprises the Liangshan Formation, whereas the Middle Permian comprises the Qixia and Maokou formations (Li H et al., 2019; Fan et al., 2020; Li, 2022). Before the Permian sedimentation, the late Caledonian structure in the Sichuan Basin mainly comprised vertical uplift, forming a pattern of great uplift and depression. The overall sedimentation is high in the southwest and low in the north and east. In the early Hercynian period, namely, the early Soochow movement, the largescale uplift and palaeouplift of the Sichuan Basin were ‘flattened’, resulting in “peneplanarisation” (Li R et al., 2019). After these two periods of uplift, denudation, and planation, the Permian sedimentary environment gradually developed with high and low sedimentation in southwest and northeast Sichuan Basin, respectively. In the early Permian, the Sichuan Basin sank completely due to the Yunnan movement, and the ancient land was completely submerged. The large-area transgressive systems tract ensured that the middle and lower Permian covered the upper part of the Carboniferous, Silurian, and Ordovician. In the early stage (Liangshan formation period), the sediments are thin coal bearing terrigenous clastic rock, shale, and aluminous mudstone deposited on the upper part of the weathering crust. Subsequently (during the Qixia Formation), the large-scale transgressive systems tract occurred, mainly developing stable shallow water carbonate basin sediments (Li, 2018), namely, the marine carbonate platform. Finally, the platform margin beach high zone and the high band in the platform shown in Figure 1A are formed in the high sedimentary parts of the basin (western and eastern Sichuan).
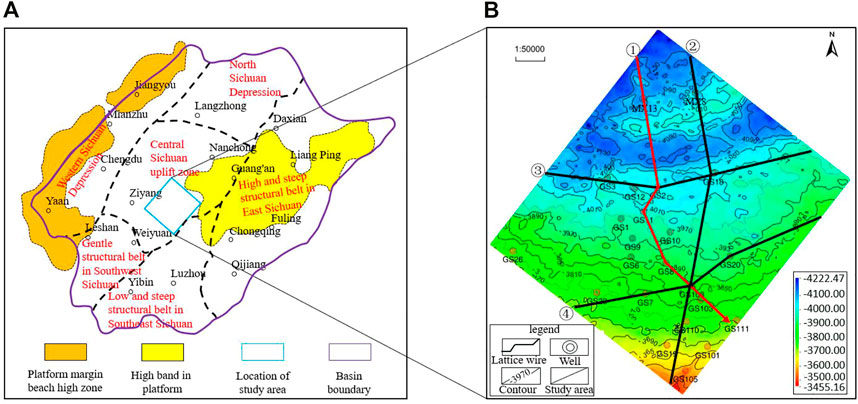
FIGURE 1. Geological background of Qixia Formation and location map of the study area in the (A) Sichuan Basin and (B) Qixia structure map.
2.2 Lithological characteristics
The Qixia Formation in the study area is generally characterised by marine carbonate basin sedimentation (Wu et al., 2010). The lithology mainly comprises limestone and dolomite. The dolomite layer is thin and shows superimposed distribution. It is composed of P1q1b, P1q1a and P1q2 members from bottom to top. The sequence boundary marks are the physical manifestation of the rise and fall of relative sea level during sedimentation (Wu et al., 2013). The lithology and lithofacies transition surface indicate the absence and mutation of lithology and lithofacies in the vertical sequence, and obvious abrupt signs of the lithology and sedimentary environment are observed above and below the boundary (Wen et al., 2020). As the lithology and lithofacies near the top and bottom of Qixia Formation are obviously different from those of the overlying Maokou Formation and the underlying Liangshan Formation (as shown in Figure 2), the top and bottom interfaces of Qixia Formation are considered to be the lithology and lithofacies conversion surfaces. Additionally, the bottom of Qixia Formation acts as an unconformity interface, eroding the strata of Liangshan and Meitan formations in some areas; thus, the top and bottom interfaces of Qixia Formation are considered as sequence boundaries.
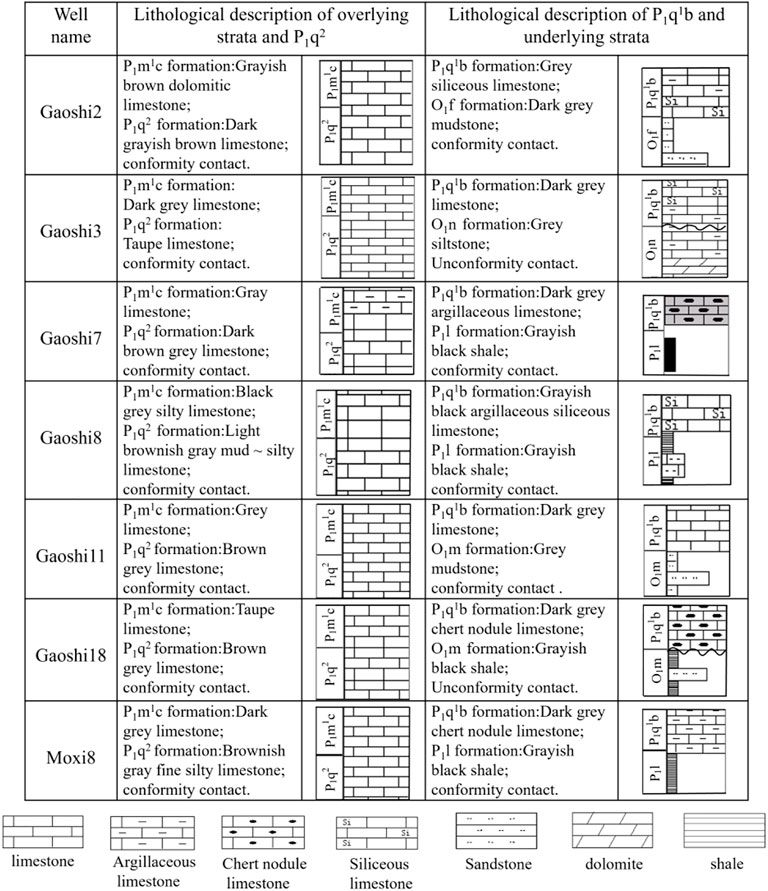
FIGURE 2. Lithological characteristics of underground Qixia Formation and surrounding rock in the study area.
Figure 2 shows the statistical lithologic distribution map at the top and bottom interfaces of Qixia Formation according to the logging data (Zhang, et al., 2022a; Li H et al., 2022). The first transgressive systems tract occurred during the q1b sub member period. Its lithology mainly comprises argillaceous limestone, siliceous limestone, and dark grey limestone. Chert blocks are also observed in some areas, and this lithology is characteristic of deep-water open platform subfacies. The underlying Liangshan formation and other strata mainly include shale (Li J et al., 2022; Wu et al., 2022), sandstone (Abraham-A et al., 2022; Xia et al., 2022), and other lithology, showing the lithological characteristics of coastal swamp subfacies.
The second member of the Qixia Formation is basically in the late stage of high stand systems tract, and the lithology mainly comprises light grey and greyish brown limestone, belonging to shallow open platform (Zhang et al., 2020). A new transgressive systems tract started during the Maokou Formation, subsequently followed by sea level rise. The lithology mainly comprises dark grey and black grey limestone, argillaceous limestone, and others, which is characteristic of a deep-water reduction environment. Thus, it belongs to the deep-water open platform subfacies.
3 Materials and methods
3.1 Data
The study area is located in the Moxi Gaoshiti area (Figure 1A). The terrain of the entire area is high in the south and low in the north. It is located in the central Sichuan uplift zone, adjacent to the high band in the platform. The study area is approximately 2844.65 km2.
3.2 Methods
The three dimensional seismic data volume not only contains the waveform, frequency, amplitude, and other information, but also contains the dip and azimuth information, which is of great significance for studying the sequence geology. Through the three dimensional Fourier transform technology, the seismic data of the target layer in the whole area are scanned, and the dip guide body under different parameters is compared. We then calculated the horizon body, and selected the horizon body that can best reflect the logging sequence interpretation scheme according to its coincidence with the event axis and the previously divided sequence and system tract boundaries; this was followed by the levelling in the Wheeler system. The levelled horizon body is then converted from the traditional time system to the relative geological age. This can satisfactorily show the progradation and retrogradation characteristics of sediments in the same geological age, and can explain the cyclic changes in the relative sea level.
In this study, firstly, by establishing the sequence stratigraphic framework, four well connection frame lines covering the whole area are established through the existing well locations in the study area. Through the calculation of the steering cube, horizon cube, and Wheeler system conversion, and combined with the well logging sequence division scheme, the system tracts of well connection frame lines are divided and mutually verified. Subsequently, as a guide, the main survey lines and liaison lines are interpreted to realise the fourth order sequence division on the seismic profile. Thereafter, we studied the evolution of sedimentary microfacies in each system tract.
3.2.1 Establishment of the sequence stratigraphic framework
3.2.1.1 Single well division sequence boundary
Owing to its high vertical resolution (Liu et al., 2020), the logging curve can sensitively reflect the stratification and cyclicity of the strata (Serra, 1984; Li, J et al., 2022; Zhang, et al., 2022b), and plays an important role in sequence division. According to previous research, the maximum flooding surface is characterised by high gamma ray (GR) values (Ji et al., 2012), namely, high GR values in transgressive systems tract and low GR values in high stand systems tract. As the GR logging curve can approximately reflect the vertical change of shale content, the higher the shale content, the stronger the is radioactivity, and the higher is the GR value. During the transgressive systems tract, owing to the deepening of the water body, the hydrodynamic force became weaker, which was more conducive to the formation of argillaceous sediments. During the high stand systems tract, the sea level dropped, the hydrodynamic force was strengthened, and the shallow and warm environment was more conducive to the deposition of carbonate rocks, and was not conducive to the deposition of mudstone.
Simultaneously, uranium (U), thorium (Th), and potassium (K) of natural GR spectrometry logging also play an important role in sequence boundary identification and system tract division because of their high sensitivity to formation lithology; namely, they have high K values, low U values, and high Th values at the maximum flooding surface. According to previous research results, a corresponding relationship was observed between the U content and organic carbon content. The organic carbon content is controlled by the depth of the water body. Generally, U can be used as a characterisation parameter of the palaeo sedimentary environment (Chao et al., 2021). The organic carbon content is denoted by δ 13C because it can effectively indicate the changes in the ancient sea level and is not easily affected by late diagenesis; δ 13C data is commonly used to verify the accuracy of sequence division. Simultaneously, K in sedimentary rocks is mainly positively correlated with the mass fraction of clay and potassium salt. A high K value is observed during the transgressive systems tract, especially at the maximum flooding surface; thus, the K value can be used to reflect the change in the relative sea level.
Th/U and Th/K ratio curves can also reflect the changes in the relative sea level. The Th/U ratio can indicate the oxidation or reduction degree of the palaeoenvironment. High Th/U values indicate the presence of oxidation conditions in the stratum. With the decrease in the relative sea level, the U content decreases, corresponding to a high-level system. Similarly, low Th/U values can reflect the increase in the relative sea level, and the stratum is deposited in a reduction environment, corresponding to the transgressive systems tract. Th/K can also reflect the change of water depth. High Th/K values indicate that this period has experienced weathering, corresponding to the high-level system period, and that the relative sea level decreased. Low Th/K values indicate that this period was dominated by a reducing environment, the base level decreased, and was in a transgressive systems tract period.
According to the afore mentioned carbonate sequence division principles, and combined with the classic sequence stratigraphy theory of Vail (Vail and Mithum, 1979), the strata of Qixia Formation in the study area are divided into two-fourth order sequences (SQ1 and SQ2) by considering the example of the Gaoshi 2 well. This division was mainly based on GR curves, combined with U, Th, and K values, and Th/U and Th/K ratio curves. SQ1 comprises transgressive systems tract 1 (TST1) and high stand systems tract 1 (HST1), and SQ2 comprises transgressive systems tract 2 (TST2) and high stand systems tract 2 (HST2).
Figure 3A shows that during the TST1 period, the relative sea level rose, the water body deepened, and the shale content increased. The logging curve showed high GR values, increased clay and potassium salt content, high K values, high Th values, and decreased organic carbon and U content. The logging curve showed the characteristics of low U, low Th/U, and low Th/K values, and obvious mutation points were observed on the maximum flooding surface.
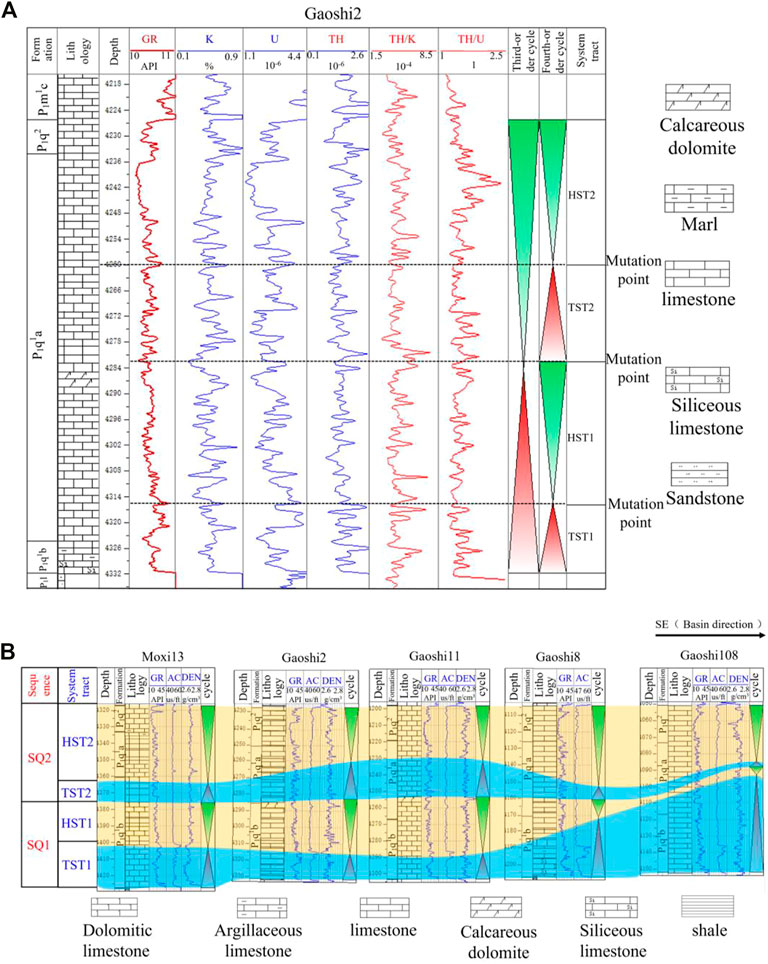
FIGURE 3. (A) Well logging sequence division of well Gaoshi2; (B) Correlation diagram of Qixia Formation systems tract of Moxi13-Gaoshi2-Gaoshi11-Gaoshi8-Gaoshi108 (①) well connection profile. See Figure 1B for the plane position of the well connection correlation diagram.
During the HST1 period, the relative sea level decreased, the water body became shallower, the content of argillaceous matter decreased, the content of clay and potassium salt decreased, the content of organic carbon and uranium increased, and some areas were even exposed to the water surface. This period showed the characteristics of low GR, low K, low Th, high U, high Th/U, and high Th/K values on the logging curve. Similarly, the characteristics of TST2 and HST2 were similar to those of TST1 and HST1; thus, they have not been described further.
3.2.1.2 Division of the well connection sequence
According to the aforementioned sequence division principles, the 12 wells in the entire area are divided into system tracts. Subsequently, by selecting representative well locations, combined with the understanding of the stratigraphy of the whole region, four well connection frame lines were established in the study area; namely, Gaoshi3-Gaoshi2-Gaoshi18 (③),Gaoshi7-Gaoshi108-Gaoshi 20 (④) well connection lines in the east-west direction, and Moxi13-Gaoshi2-Gaoshi11-Gaoshi8-Gaoshi108 (①) and Moxi 8- Gaoshi18- Gaoshi108- Gaoshi110 (②) well connection lines in the north-south direction. Thus, they can be used to guide the sequence interpretation in the entire region as well as the mutual verification. The Moxi13-Gaoshi2-Gaoshi11-Gaoshi8-Gaoshi108 (①) well connection line is shown below as an example.
As shown in Figure 3B, vertically, all wells generally show the following characteristics: the well section of the high stand systems tract is thicker than that of the low stand system (except for wells Gaoshi 108 and Gaoshi 8 near the seaward side), indicating that the sea level changes experienced twice by the study area are a result of rapid transgressive systems tract and slow regression. The reason for the absence of a low stand system in the Vail classic sequence stratigraphy is that this period is considered to be dominated by a rapid transgressive systems tract (Mei, 2010), and the sea level increased rapidly. The deep water environment hindered the deposition of carbonate rocks in the low stand system and formed sedimentary discontinuities. However, wells Gaoshi 108 and Gaoshi 8 are located near the seaward side, resulting in thick sediments in the TST1 period.
Laterally, during TST1, the sediments in study area were thick in the southeast and thin in the northwest, indicating that the main sedimentary position during TST1 was southeast of the study area, and the lithology mainly comprised dark grey limestone, argillaceous limestone, and siliceous limestone. In HST1, the sedimentary thickness in the northwest is much greater than that in the southeast. In particular, the sedimentary thickness was the largest at well Gaoshi11, namely, the northwest region was the main sedimentary part in HST1, and the lithology mainly comprised dolomitic limestone and light limestone. Similarly, in the TST2 period, the sediments were thick in the northwest and thin in the southeast. The sedimentary parts were more concentrated in the north of the study area, and the lithology was mainly brown limestone and dark grey limestone. During high stand systems tract 2, the sediments were still mainly thick in the northwest and thin in the southeast. The main sedimentary area was in the west. The lithology mainly comprises grey limestone and dolomitic limestone.
3.2.1.3 Well seismic joint calibration
Through the one dimensional forward modelling method, the density and acoustic curves are used to obtain synthetic seismic records. This provided time significance to the depth data of the logging curve (Li, 2017) to study the distribution and waveform characteristics of the divided sequence on the seismic profile, and then conduct the horizontal prediction of the sequence in the whole region.
As shown in Figure 4, considering well Gaoshi 2 as an example, through the comparison between synthetic seismic records and seismic traces near the well, Longtan Formation, as the marker coal seam, is characterized by strong amplitude, low frequency, and strong continuous wave peak reflection, which is continuously reflected in the whole area. The bottom of Maokou Formation (Qixiading) shows moderately strong amplitude wave peak reflection, and a bifurcation phenomenon is observed near the Gaoshi 2 well. The two reflection events with medium amplitudes on the left begin to merge into a medium strong reflection axis with greater amplitude. We considered that this mainly occurs because the Maokou Formation (Qixiading) is the sequence boundary, and the existence of a local unconformity leads to such seismic reflection characteristics. The bottom of Qixia Formation is characterised by low frequency trough reflection. As the bottom boundary of the sequence, it shows continuous reflection characteristics in the whole region.
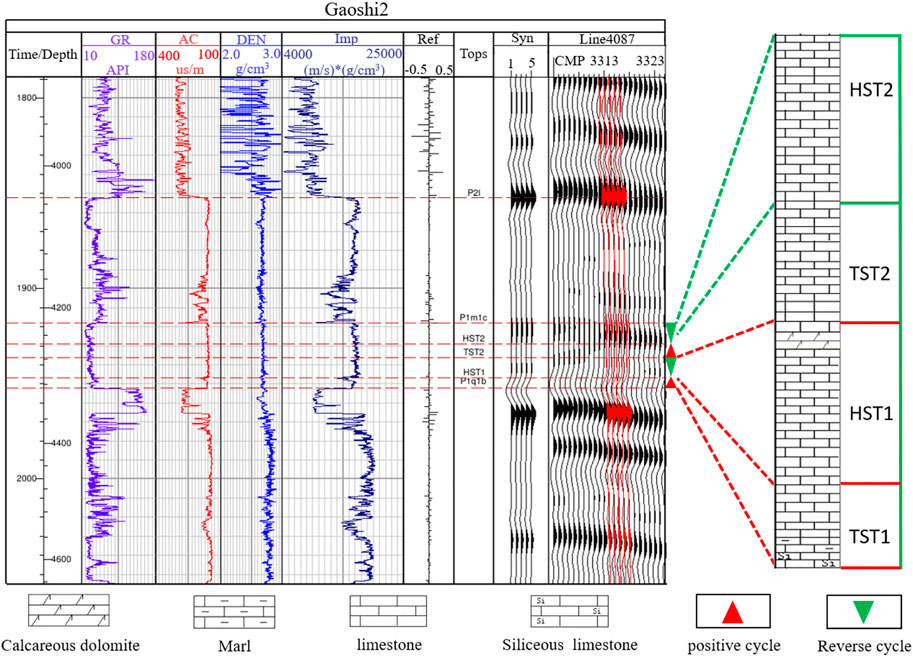
FIGURE 4. Seismic calibration profile of the Gaoshi 2 well of the Qixia Formation.
The thickness of the target layer of Qixia Formation in the whole area is small. In conventional sequence stratigraphy research, owing to the limitation of resolution, the strata can only be divided into third order sequences on the seismic profile. However, with the help of the high vertical resolution of the logging curve, the strata can be divided into fourth order sequences. Although their waveform characteristics are not obvious, the distribution range and overall waveform characteristics of the fourth order sequences can be roughly divided according to the logging curve. As shown in the Figure 4, the reflection amplitudes of TST1 and HST1 are weak, but their continuity is good. The reflection amplitudes of TST2 and HST2 are strong, but their continuity is poor.
3.2.2 The principle of predicting the planar distribution of the system tract
3.2.2.1 Steering cube
Every seismic sampling point contains dip and azimuth information in the direction of the main survey line and connecting survey line. As shown in Figure 5A, the role of the dip angle guider is to scan the information in the line and trace directions of each sampling point in the three dimensional range using the three dimensional Fourier transform technology. This is done to generate a guider containing the dip angle and azimuth angle, automatically track the pre-calculated dip field from the starting position, and integrate the sampling points with similar dip angle information to track the seismic reflection.
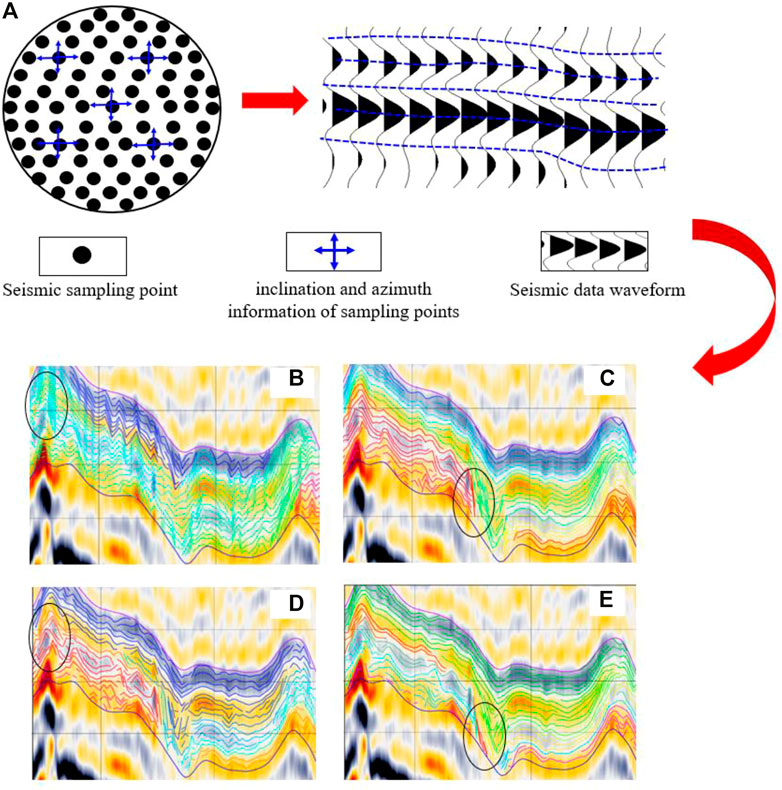
FIGURE 5. (A) Calculation and tracking model of the horizon; and Comparison of lower levels with different parameters; (B) FFF111_: the horizon volume calculated by 333 algorithms (the horizon volume passes through the layer); (C) PCA111_: the horizon volume calculated by 333 algorithms (the degree of coincidence with the event axis is inadequate); (D) PCA111_ 11: horizons calculated by the algorithm (poor continuity of horizons); and (E) PCA111_: horizon volume calculated by 662 algorithms (the best coincidence effect).
3.2.2.2 Horizon cube
According to the previously calculated steering cube, the Qixia Formation interval is calculated with various parameters. The horizon cube of different interpretation schemes (as shown in Figure 5 b、c、d、e) are compared with the coincidence degree between the horizon body and the event axis. We found that the PCA111_662 parameter is the best. Here, PCA is the main component analysis algorithm; FFT represents the fast Fourier algorithm; 111 represents the calculation step size, namely, every other sampling point is scanned in the direction of the line, trace, and time; 662 is the median filtering parameter, namely, every six sampling points are filtered in the direction of the line and trace, and every two sampling points are filtered in the direction of time to ensure the best coincidence effect of the horizon. Thus, PCA111 is finally selected and _662 is used as the calculation parameter of the horizon body.
3.2.3 Establishing the sequence framework of the whole region
Through the calculation of the four well connection frame line horizons covering the whole region, the subsequent Wheeler conversion-interpretation system can be employed. This system can be considered as a guide to conduct the system interpretation of the main survey line and connecting survey line in the whole region. We then calculated the Gaoshi3-Gaoshi2-Gaoshi18 (③),Gaoshi7-Gaoshi108-Gaoshi 20 (④), Moxi13-Gaoshi2-Gaoshi11-Gaoshi8-Gaoshi108 (①), and Moxi 8- Gaoshi18- Gaoshi108- Gaoshi110 (②) well frames, respectively. Subsequently, we considered the Moxi13-Gaoshi2-Gaoshi11-Gaoshi8-Gaoshi108 (①) well frame as an example, As shown in Figure 6A, and calculated its horizons for subsequent sequence stratigraphic analysis, as shown below.
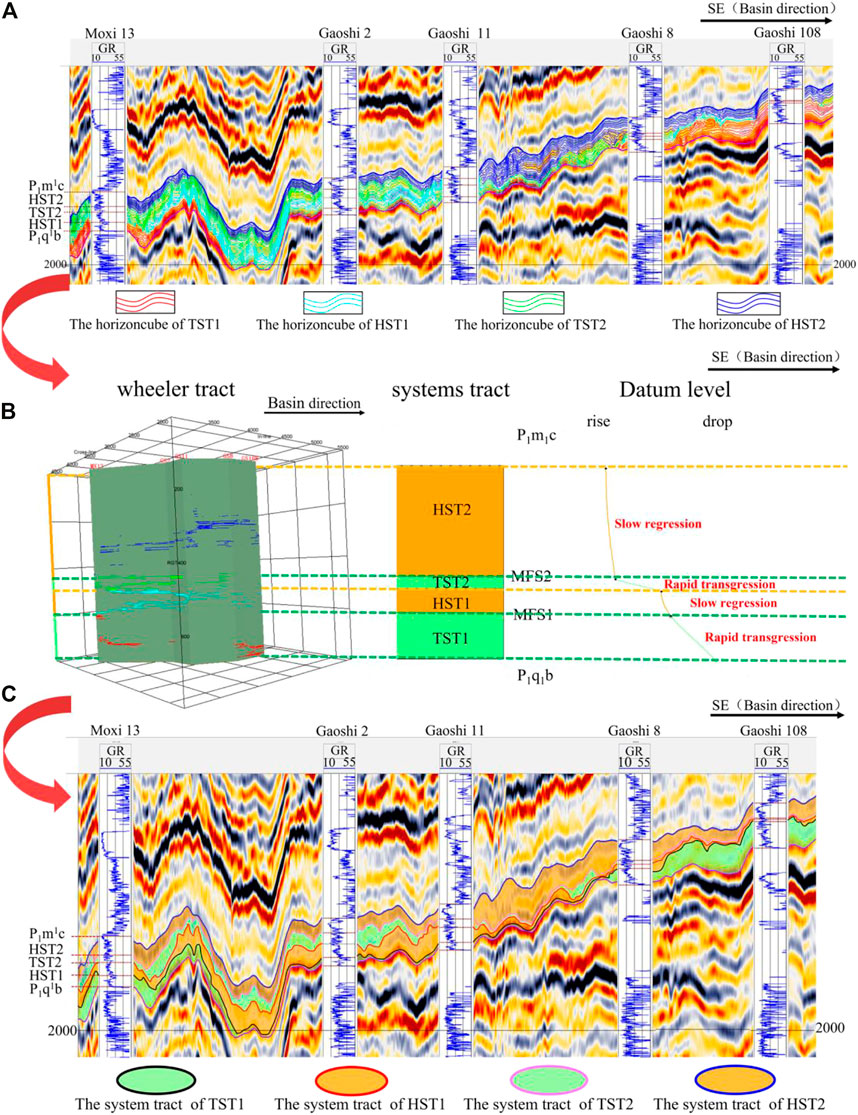
FIGURE 6. (A) Comparison of Moxi13-Gaoshi2-Gaoshi11-Gaoshi8-Gaoshi108 (①) well connection seismic profile of the Qixia Formation horizon. See Figure 1B for the plane position of the profile shown in the figure; (B)Diagram explaining the Moxi13-Gaoshi2-Gaoshi11-Gaoshi8-Gaoshi108 (①) well frame system; (C) System comparison of the Moxi13-Gaoshi2-Gaoshi11-Gaoshi8-Gaoshi108 (①) well frame seismic profile. See Figure 1B for the plane position of the profile shown in the figure.
3.2.4 Frame wheeler tract interpretation
Wheeler domain transformation is conducted for each horizon, and the time series is transformed into a relative geological time series, namely, the Wheeler domain. According to the levelled horizon cube converted by the Wheeler system, the distribution form of sediments can be clearly displayed. With the help of its progradation and retrogradation characteristics, the system interpretation and relative sea level change analysis can be conducted (Yan, 2019).
Obvious progradation and retrogradation features can be found in the Wheeler system layout of the Moxi13-Gaoshi2-Gaoshi11-Gaoshi8-Gaoshi108 (①) well connection line. As shown in Figure 6B, during the TST1 period, the relative sea level rose rapidly, and the sediments were retrograded and migrated from the sea to the shore. During the HST1 period, the relative sea level decreased slowly, and the sediments migrated to the sea, showing the characteristics of progradation at the maximum flooding surface. During the TST2 period, the sea water subsequently rose rapidly, the sediments retrograded to the shore and were mainly deposited in the shore direction, and the transgressive systems tract stopped at the maximum flooding surface. During the HST2 period, the sea level subsequently decreased slowly, and the sediments migrated to the sea.
3.2.5 Well seismic joint correlation interpretation system tract boundary
The interpreted system tracts are projected onto the seismic profile (as shown in Figure 6C), and the boundaries of each system tract are traced according to the interpretation scope of the system tracts, which are TST1, HST1, TST2, and HST2 from bottom to top. According to the logging curve, lithology interpretation data, and other information, combined with author’s understanding of the study area, the fourth order sequence division of a single well is conducted for 12 wells in the study area (as shown in Figure 6A), and the sequence framework of connected wells is then established on this basis. Finally, the system tract interpretation results from the seismic profile are used for the joint comparison of the well seismic data with the system tract of logging interpretation. We found that the result of the Wheeler system interpretation (Figure 3B) is basically consistent with that of the logging interpretation (Figure 6C).
3.2.6 Planar distribution characteristics of system tracts
According to the sequence boundary traced by the frame line, the system tracts of the main survey line and the connecting survey line are interpreted for the whole region. Thereafter, the thickness map of the whole region is drawn for the sequence top boundary interpreted by TST1, HST1, TST2, and HST2 to study the main distribution range and palaeogeomorphology of each system tract. In the Figure 7, the cold colour indicates that the system tract is a major sedimentary area with a large sedimentary thickness, and that it was in the low part of the palaeogeomorphology before deposition. In contrast, the warm colour indicates that the sedimentary thickness is small and the pre-sedimentary palaeogeomorphology is high. In the next period of relative sea level change, the intraplatform shoal reservoir could easily be developed in the high part of the palaeogeomorphology.
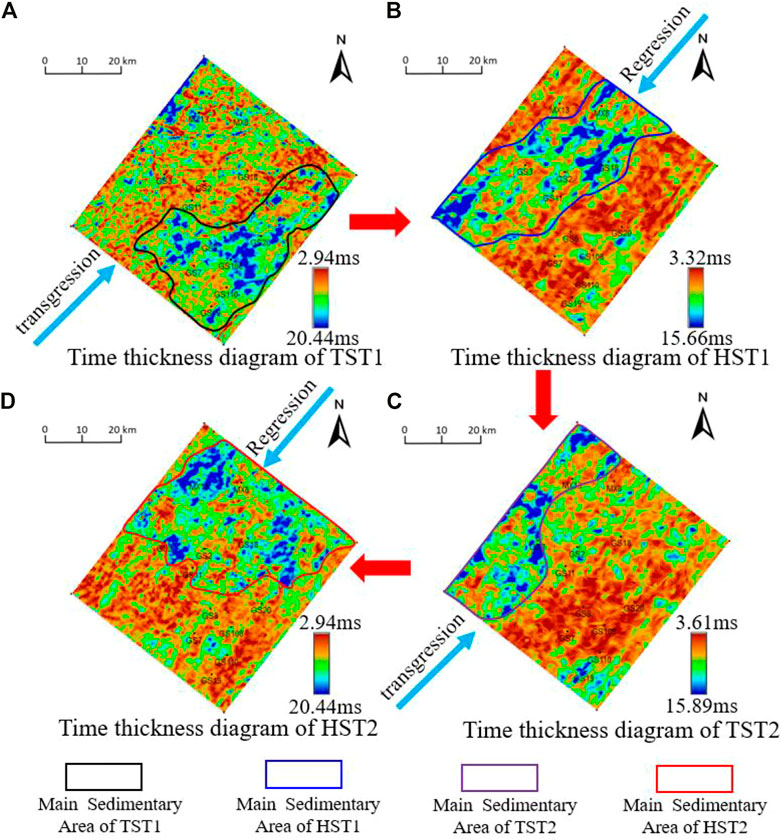
FIGURE 7. Time thickness diagram of each system tract (A) Time thickness diagram of TST1; (B) Time thickness diagram of HST1; (C) Time thickness diagram of TST2; (D) Time thickness diagram of HST2.
Owing to the limitation of various factors, when the relative sea level changes, the production rates of carbonate rocks differ in different parts, which also results in different main depositional areas of each system tract. During the TST1 period, seawater influx from the southwest direction occurred to result in the transgressive systems tract. At this stage, the main sedimentary area is southeast of the study area (as shown in Figure 7A); During HST1, the relative sea level began to decline after a short rise, mainly in the middle part of the study area (see Figure 7B). During the TST2 period, when the relative sea level rose, seawater subsequently flowed in from the southwest to result in the transgressive systems tract. At this stage, the main sedimentary area was northwest of the study area (as shown in Figure 7C). During HST2, the relative sea level rose briefly and then fell thereafter. The main sedimentary area is northern of the study area (as shown in Figure 7D).
4 Results and discussion
4.1 Sedimentary facies analysis of a single well
System tracts are the aggregation of a series of contemporaneous sedimentary systems. With the change in the relative sea level, the sedimentary microfacies of different system tracts and even the same system tract are different. Owing to the high vertical resolution of logging data and complete data, the sedimentary microfacies of each well in the study area are divided according to the interpreted lithology and sedimentary environment in combination with logging, drilling, core and other data. This facilitates the subsequent study of the evolution process of sedimentary facies in the same geological age (Li, H et al., 2019).
As the lithology and lithofacies of well Gaoshi 18 change more obviously, the sedimentary microfacies of a single well are divided by considering the example of well Gaoshi 18. As shown in Figure 8, from bottom to top, the sedimentary mode of well Gaoshi 18 is as follows: the sedimentary microfacies of deep-water interbank depression, interbank sea, and intraplatform shoal overlap each other. Among them, the deep-water interbank depression is marked by the discovery of brachiopods and dragonfly mud crystal bioclastic sediments. The lithology mainly comprises dark grey chert nodule limestone. The logging curve shows low density, low acoustic wave time difference, and high GR; thus, it belongs to the poor reservoir facies zone. The dark grey chert nodule limestone indicates that the sedimentary environment was the deep water reduction environment. The relatively high interbank sea mainly comprises argillaceous limestone. At this time, the sea water depth was still deep and the hydrodynamic force was weak. There are more argillaceous sediments when the limestone was produced. With the gradual decrease of the relative sea level and the gradual enhancement of hydrodynamic force, the shallow environment was conducive to the survival of reef building organisms and the formation of carbonate rocks. The microfacies of the inner platform beach mainly comprise meso-crystalline dolomite, saddle dolomite, greyish brown limestone, grey limestone, and other light coloured limestone. The logging curve of dolomite shows the characteristics of high density, high acoustic time difference, and low GR. It is a good oil and gas reservoir facies zone (Hu et al., 2010). The light colour indicates that it was deposited in a shallow water oxidation environment. With the cyclic change of relative sea level, the sedimentary microfacies of the interbank depression, interbank sea, and intraplatform shoal also overlap with each other.
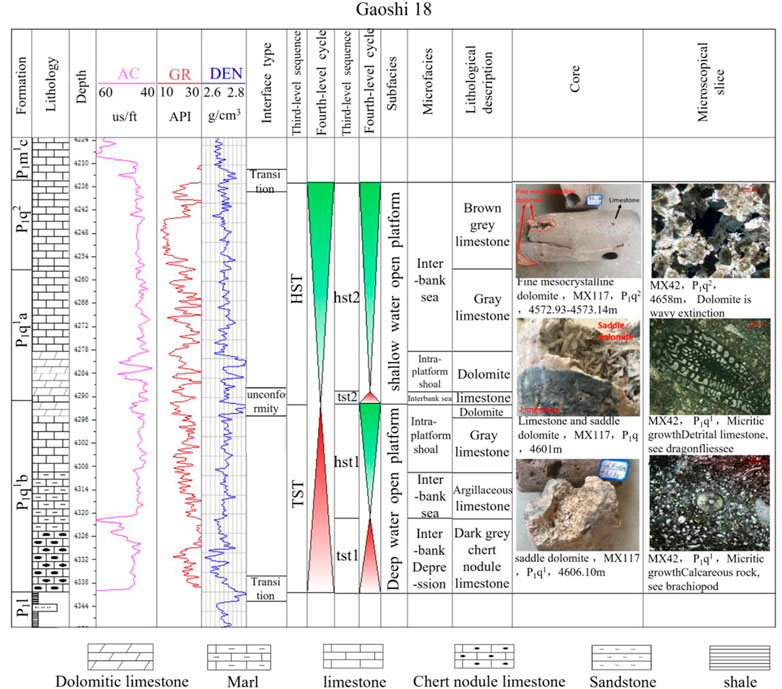
FIGURE 8. Comprehensive histogram of well Gaoshi 18 in Gaomo block of the Qixia Formation, Sichuan Basin.
4.2 Optimisation of seismic attributes and division of sedimentary facies
Different seismic attributes have different sensitivities to sedimentary facies, and seismic attributes do not have clear geological significance (Chen and Sidney, 1997; Liu et al., 2009; Deng and Chen, 2021). Therefore, the identification and optimisation of different attributes are of great significance for the detailed interpretation of sedimentary microfacies in the study area. By calculating various seismic attributes (Ngene et al., 2022), combined with thin section, core, drilling, and other data and results of previous studies, the seismic attributes that can best reflect the sedimentary microfacies in the study area are optimised. Considering the example of the HST1 period, six conventional seismic attributes are calculated.
According to the interpretation and core drilling, a dolomite reservoir was encountered in wells Moxi 8, Moxi13, Gaoshi 2, Gaoshi 11, and Gaoshi 18 during the HST1 period (as shown in Figure 11A. The single well sedimentary facies was interpreted as the sedimentary microfacies of the inner platform beach. As shown in Figure 9, the prediction results of instantaneous amplitude, instantaneous frequency, instantaneous phase, and dessert attributes were poor, and the curvature attributes were in good agreement. The root mean square amplitude attribute has the best prediction effect. Among them, the sedimentary microfacies of the intraplatform beach have high root mean square amplitude, which is in the warm region, and the sedimentary microfacies of the inter beach sea have low root mean square amplitude, which is in the cold region.
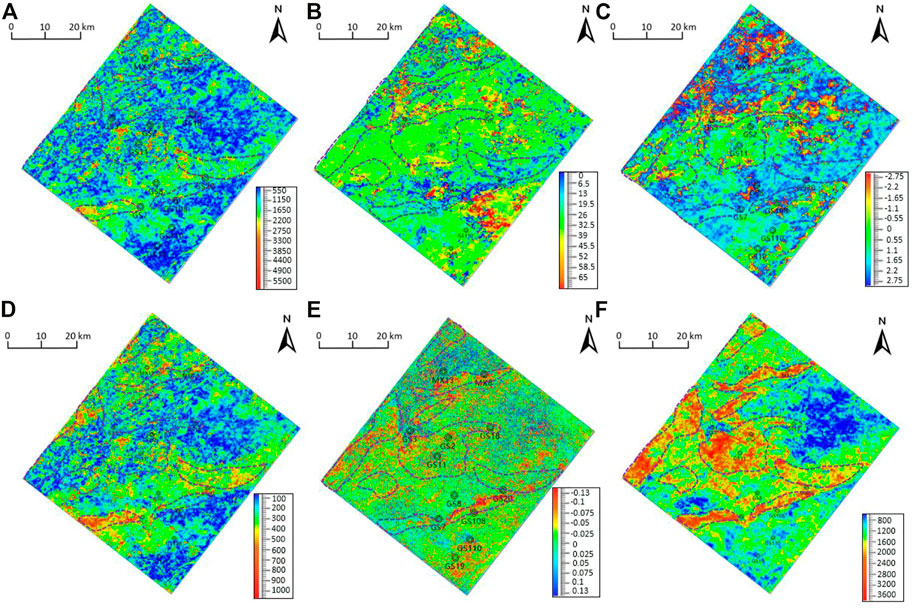
FIGURE 9. Comparison chart of attribute optimisation slices during HST1 in the study area: (A) instantaneous amplitude attribute; (B) instantaneous frequency attribute; (C) instantaneous phase attribute; (D) dessert attribute; (E) curvature attribute; and (F) root mean square amplitude attribute.
4.3 Qualitative and optimal division of sedimentary microfacies using attribute slice
Through qualitative analysis and optimisation of seismic attributes, reasonable seismic attributes are determined. 22 attribute slices are cut from each of the four system tracts. Combined with logging data, the slices with the highest degree of coincidence with the well divided sedimentary facies are selected to study the distribution rules of the sedimentary microfacies in different periods. The well locations of dolomite reservoirs drilled in the study area mainly include Moxi 13, Moxi 8, Gaoshi 18, Gaoshi 2, and Gaoshi 11. As the root mean square attribute is one that can reflect the continuity of the stratum, the more stable the local layer, the more uniform is the lithology, the greater the is root mean square amplitude, and the smaller is the reverse. Additionally, the sedimentary microfacies divided in combination with the root mean square amplitude attribute slice have a high degree of coincidence with the lithology and sedimentary facies divided by the well data. Therefore, the sedimentary evolution process of each system tract is studied along with the logging data (Figure 10).
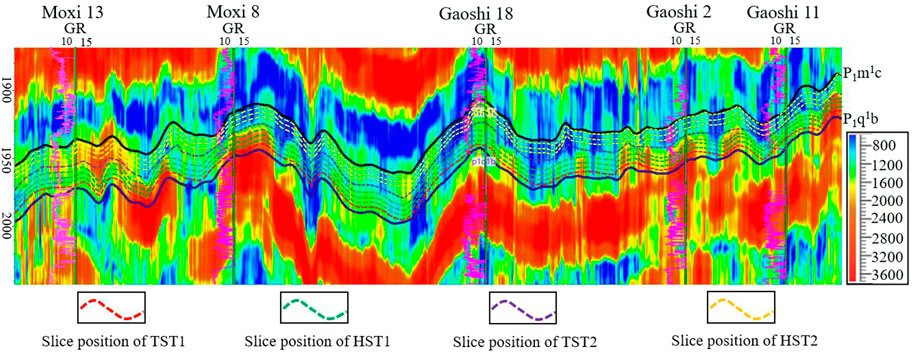
FIGURE 10. Root mean square amplitude attribute profile and slice location.
4.3.1 Study on the sedimentary microfacies of TST1
According to the lithology statistics of 12 wells in the study area, during TST1, dark grey chert nodule limestone (such as in Gaoshi 18), siliceous limestone (such as in Gaoshi 19), argillaceous limestone (such as in Moxi 8), and grey limestone (Moxi 13) are mainly used. Among them, the first three lithologies are dark in colour and high in density, as they are the product of deep water sedimentation, and are classified as the sedimentary microfacies of interbank depressions. Alternatively, the grey limestone area, which is light in colour and was deposited in relatively shallow water, is classified as the sedimentary microfacies of interbank seas. As the sedimentary microfacies in the interbank depression are located below the wave base (with weak hydrodynamic force and high shale content), together with chert and siliceous sediments, the overall sedimentary lithology of the facies zone is complex. Thus, the root mean square amplitude attribute is low. However, the intertidal marine microfacies dominated by grey limestone have high root mean square amplitude owing to their single lithology and stable sedimentation. Subsequently, we selected the appropriate threshold value, combined the distribution characteristics of sedimentary facies determined by well data, and divided the sedimentary microfacies on the plane attribute slice.
As shown in Figure 11B, the interbank depression microfacies are mainly developed during TST1. When seawater flows in from the southwest, the interbank depression was formed in relatively low places with the deepening of the water body. As it is located below the wave base, the hydrodynamic force is weak, which is conducive to the deposition of fine grained argillaceous sediments. Therefore, the lithology mainly comprises argillaceous limestone, and the logging curve shows low density, low acoustic wave time difference, and high GR, indicating that the sediments belong to poor reservoir facies zone, as shown in Figure 11A. Conversely, the inter beach marine sedimentary microfacies granular shoals are formed at relatively high positions, forming grey limestone bands distributed in the southwest-northeast direction, as shown in Figures 11A–D. The direction of extension is consistent with that of the transgressive systems tract, and the sediments are more concentrated in area C of the central region, thereby laying a foundation for the formation of intraplatform shoals during HST1.
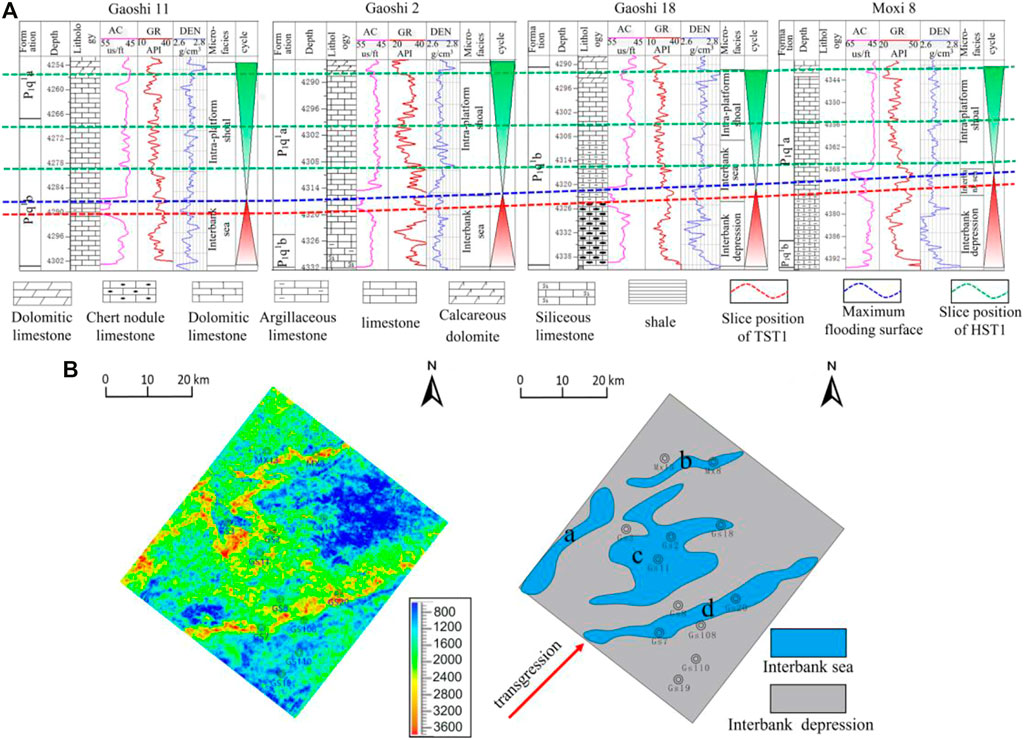
FIGURE 11. (A) log curve and sedimentary microfacies interpretation diagram of representative well location in SQ1 period; (B) Typical root mean square amplitude attribute slice and corresponding sedimentary microfacies interpretation during TST1.
4.3.2 Study on the sedimentary microfacies of HST1
During the HST1 period, the lithology mainly comprised argillaceous limestone, grey limestone, calcareous dolomite, and dolomite. The area containing the distribution of calcareous dolomite and dolomite is classified as intraplatform shoal sedimentary microfacies, and that containing argillaceous limestone and limestone is classified as interbank sea microfacies. Similarly, the lithology of the inner platform beach area containing dolomite is more uniform and has high root mean square amplitude. The sedimentary facies of the interbank sea were deposited in a deeper water body and have more complex lithology, and belong to the area of low root mean square amplitude. Based on the sedimentary facies preliminarily divided by well data, the following divisions are made on attribute slices, as shown below.
As shown in Figure 12, during the HST1 period, the relative sea level began to decline after a short rise. In the TST1 period, the interbank depression began to gradually evolve into interbank sea microfacies. The original interbank sea zones, with higher structures, gradually evolved into intraplatform shoals. Their root mean square amplitudes are high. The logging curves indicate that they have the characteristics of high density, high acoustic time difference, and low GR. They are good oil and gas reservoir facies zones, which are mainly distributed in the central and western regions of the study area. For example, the interbank sea zone a evolved into two intraplatform shoal facies zones ① and ②, and the zone B is preserved well and perfectly transited to the intraplatform shoal ③. The differentiation of the C band is the most obvious. Along the regression direction, intraplatform shoal bands ④, ⑤, and ⑥ were formed with thick middle and slender sides, and band D evolved into intraplatform shoals ⑦, ⑧, and ⑨. Among them, well Moxi 18 has been drilled in beach ③, and wells Gaoshi 18, Gaoshi 11 and Gaoshi 2 have been drilled in beach ⑤. The well data show that the dolomite reservoir, and the remaining areas ①, ②, ④, ⑥, ⑦, ⑧, and ⑨ are the development facies zones of the predicted intraplatform beach.
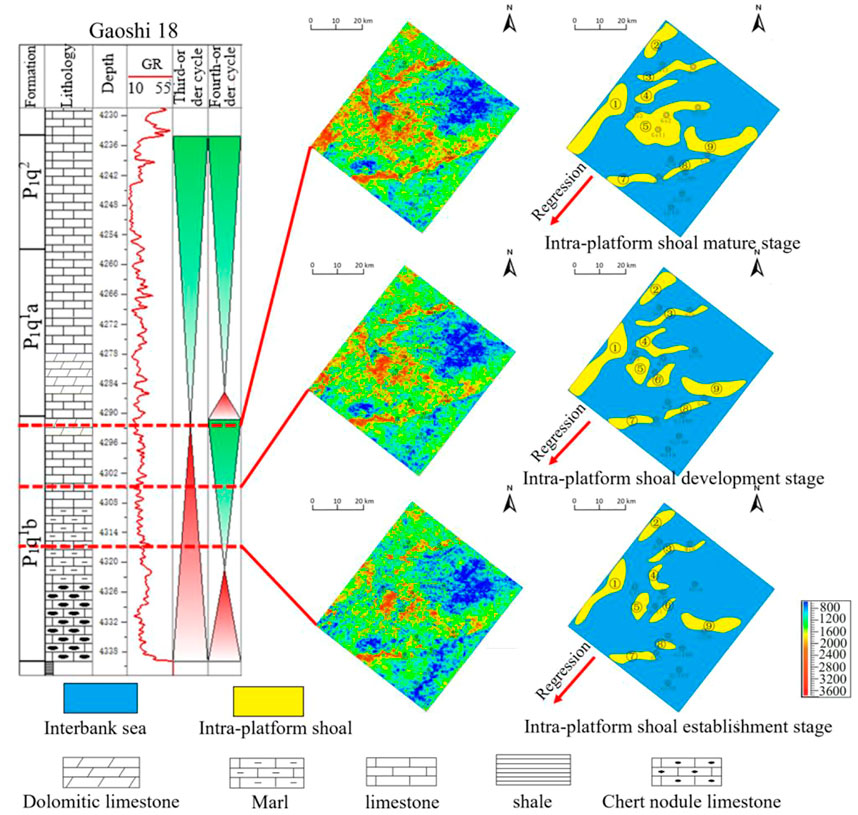
FIGURE 12. Typical root mean square amplitude attribute slice and corresponding sedimentary microfacies interpretation in HST1.
4.3.3 Study on the sedimentary microfacies of TST2
As shown in Figure 13A, during TST2, the sea level rose again, forming a depositional system dominated by interbank depressions and interbank seas. As TST1 and HST1 belong to deep-water open platform subfacies, and TST2 and HST2 belong to shallow-water open platform subfacies, compared to the interbank sea strip formed in the TST1 period, because the water body is shallower, the interbank sea microfacies can form more easily. Thus, the interbank sea distribution area at this stage progressively became wider. The distribution characteristics in the southwest-northeast direction are consistent with the direction of the transgressive systems tract, mainly forming four interbank sea strips e, f, g, and h, As shown in Figure 13B.
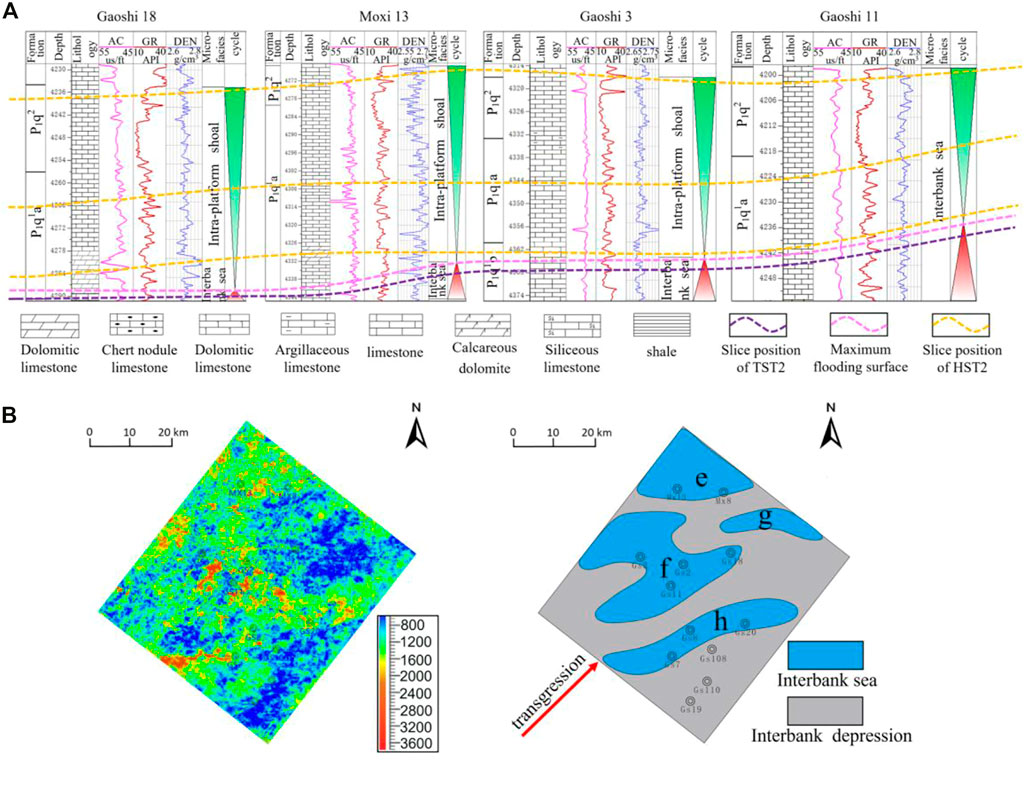
FIGURE 13. (A) Log curve and sedimentary microfacies interpretation diagram of representative well location in SQ2 period;;(B)log curve of surface well location and sedimentary microfacies interpretation diagram in SQ2 period.
4.3.4 Study on the sedimentary microfacies of HST2
As shown in Figure 14, during the HST2 period, the relative sea level began to decline, forming the inter beach sea and intra platform beach depositional systems. The interbank sea zone at the high part of the structure in the TST2 period subsequently evolved into the intraplatform shoal microfacies, and still extended in the southwest-northeast direction e. Strip G is basically transformed into inner Taiwan shoals ⑩ and ⑪; a portion of the high part of the sea strip between beach f is transformed into inner Taiwan shoals ⑪ and ⑫; and strip h is evolved into inner Taiwan shoals ⑭ and ⑮. Among them, the well location of MX 13 has been drilled for intraplatform shoal system ⑩, that of Gaoshi 3 has been drilled for beach body ⑪, and that of Gaoshi 18 well location has been drilled for beach body ⑫. The interpretation results indicate the presence of a dolomite reservoir, and the remaining areas ⑬, ⑭, and ⑮ are the predicted intraplatform shoal development facies zones.
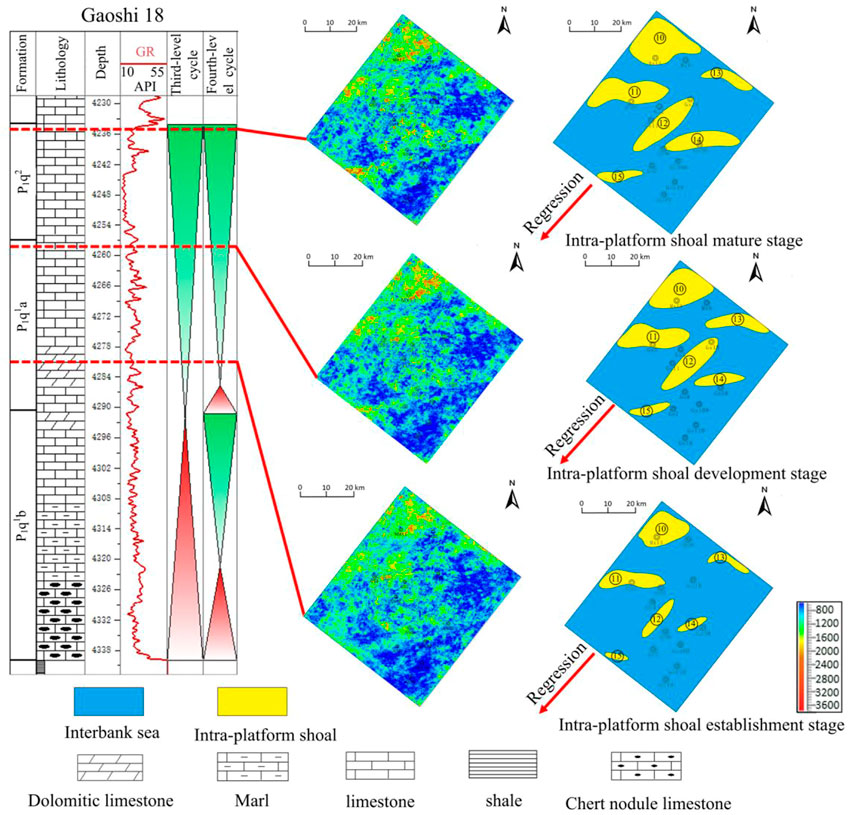
FIGURE 14. Typical root mean square amplitude attribute slice and corresponding sedimentary microfacies interpretation in HST2.
4.4 Evolution analysis of sedimentary microfacies
To study the sedimentary evolution process between and within the fourth order sequences, the interbank sea microfacies at the top of TST1 and the intraplatform shoal microfacies at the top of HST1, TST2, and HST2 are superimposed (as shown in Figure 15) Through comparison, we found that the interbank sea microfacies and intraplatform shoal microfacies are highly consistent.
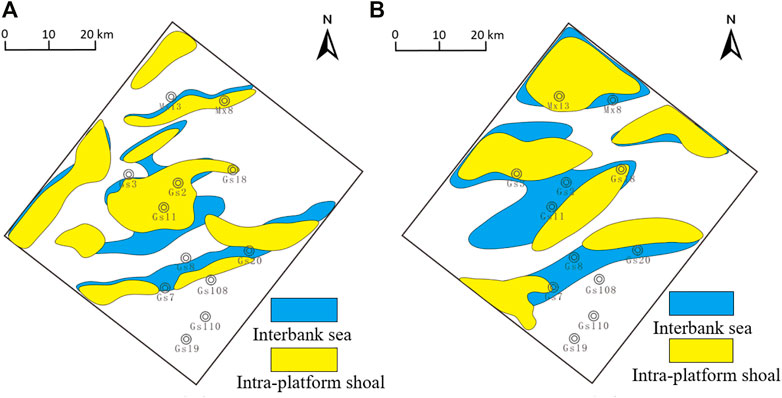
FIGURE 15. Evolution diagram of sedimentary microfacies in each fourth order sequence: (A) evolution diagram of the sedimentary microfacies in the SQ1 period (interbank sea microfacies in TST1 period gradually evolved into intraplatform shoal microfacies in the HST1 period); (B) evolution map of the interbank sea to intraplatform beach in the SQ2 period (interbank sea microfacies in the TST2 period gradually evolved into intraplatform beach microfacies in the HST2 period).
During the Qixia Formation, with the rise of sea level, a large number of marine organisms began to multiply, and the study area changed from a terrigenous clastic sedimentary environment to carbonate open platform sedimentary environment. In the SQ1 period, the water body was relatively deep, and the whole area was a relatively deep-water open platform, which can be divided into TST1 and HST1. During the TST1 period, the interbank depressions are mainly developed, and the interbank sea microfacies are locally high, as shown in Figure 15A. With the decrease in sea level, the interbank sea microfacies with high terrain during the TST1 period gradually evolved into intraplatform shoal microfacies. During SQ2, the water level decreased on the whole, and resulted in the formation of a shallow water open platform subfacies, which can be divided into TST2 and HST2. The sea level in TST2 began to rise again and developed interbank depressions and interbank sea microfacies, as shown in Figure 15B. As the entirety of the water body was shallow, the interbank sea microfacies during TST2 were more widely distributed. With the decrease in the relative sea level, some interbank sea microfacies began to evolve into intraplatform shoal microfacies. Its distribution is also wider than that of the HST1 period.
5 Conclusion
(1) According to the carbonate sequence division principle, the Qixia Formation in the study area is divided into one-third order sequence and two-fourth order sequences: SQ1 and SQ2. SQ1 comprises TST1 and HST1, and SQ2 comprises TST2 and HST2. Owing to the two rapid transgressive systems tracts, the relative sea level rose rapidly, and the deep water environment hindered the deposition of carbonate rocks during the low stand system, forming sedimentary discontinuities; thus, the low stand system was missing.
(2) The Qixia Formation in the study area generally comprises the open platform sedimentary facies, which can be further divided into deep water open platform subfacies and shallow water open platform subfacies according to the water depth. From bottom to top, it is composed of inter beach depression microfacies, inter beach sea microfacies, and intraplatform beach microfacies. The dolomite reservoir with good porosity and permeability is located in the beach facies zone within the platform.
(3) The change in the sedimentary microfacies in the study area corresponds to the change in the relative sea level, and the favourable reservoir facies will also migrate accordingly. In the low stand system, the interbank depressions in the lower part of the structure will evolve into interbank seas in the high stand systems tract with the decrease in sea level, whereas the interbank seas in the higher part of the structure will also partially evolve into intraplatform shoal microfacies. With the changes in multi-stage relative sea level, the spatial distribution of the intraplatform beach facies zone will also migrate.
Data availability statement
Raw data supporting the conclusions of this paper will be provided by the author without any improper reservation.
Author contributions
SL, LZ contributed to the conception and design of the design and modification of experimental ideas. SL wrote the first draft of the manuscript. XG, XC, and YW Provide initial data and make suggestions on research progress, LT, ZQ, YQ, and JZ conducted some statistical analysis and data collation.
Funding
This research was supported by the national major science and technology project “Establishment of deep oil and gas transport framework and analysis of oil and gas accumulation in typical basins” (No: 2017ZX05008-004-008).
Conflict of interest
Authors XG and XC were employed by Petro China Southwest Oil and Gas Field Company. LF was employed by the company BGP Southwest Geophysical Company.
The remaining authors declare that the research was conducted in the absence of any commercial or financial relationships that could be construed as a potential conflict of interest.
Publisher’s note
All claims expressed in this article are solely those of the authors and do not necessarily represent those of their affiliated organizations, or those of the publisher, the editors and the reviewers. Any product that may be evaluated in this article, or claim that may be made by its manufacturer, is not guaranteed or endorsed by the publisher.
References
Abraham-A, , R. M., Taioli, F., and Nzekwu, A. I. (2022). Physical properties of sandstone reservoirs: Implication for fluid mobility. Energy Geosci. 3 (4), 349–359. doi:10.1016/j.engeos.2022.06.001
Chao, Q. C., Bai, Z. Z., Li, H. W., and Zhang, L. L. (2021). Application of wavelet transform of logging data in sequence stratigraphic division of Cambrian xixiangchi group in Central Sichuan. Bull. Geol. Sci. Technol. 40 (04), 242–251. doi:10.19509/j.cnki.dzkq.2021.0418
Chen, Q., and Sidney, S. (1997). Seismic attribute technology for reservoir forecasting and monitoring. Lead. Edge 16 (5), 445–448. doi:10.1190/1.1437657
Chen, Z. Q. (2007). Exploration for natural gas in middle permian Maokou Formation of Sichuan Basin. China Pet. Explor. 12 (5), 1–11. doi:10.3969/j.issn.1672-7703.2007.05.001
Dai, X. F., Zhang, M., Jiang, Q. C., and Feng, Z. (2017). Karst reservoirs seismic prediction of lower permian Maokou Formation in central Sichuan Basin, SW China. Petroleum Explor. Dev. 44 (1), 79–88. doi:10.1016/s1876-3804(17)30010-1
Deng, R. B., and Chen, Q. (2021). Forward modeling of fracture prediction based on seismic attribute modeling. Earthq. Res. Adv. 2021, 57–58. doi:10.1017/cbo9780511843655.003
Elisa, F. D., Peter, H., Luc, S., David, K., Antoni, C., Gustavo, T., et al. (2011). Insights into fluid flow and water-rock interaction during deformation of carbonate sequences in the Mexican fold-thrust belt. J. Struct. Geol. 33 (8), 1237–1253. doi:10.1016/j.jsg.2011.05.009
Fan, C. H., Li, H., Qin, Q. R., He, S., and Zhong, C. (2020). Geological conditions and exploration potential of shale gas reservoir in Wufeng and Longmaxi Formation of southeastern Sichuan. Basin, China. J. Petrol. Sci. Eng. 191, 107138. doi:10.1016/j.petrol.2020.107138
Feng, Z. Z., Yang, Y. Q., Jin, Z. K., and Zhidong, B. (1996). Lithofacies paleogeography of the permian of south China. Acta Sedimentol. Sin. 14 (2), 3–12. CNKI:SUN:CJXB.0.1996-02-000.
Hu, A. P., Pan, L. Y., and Hao, Y. (2018). Origin,character isticsand distribution of dolostone reservoir in Qixia Formation and Maokou Formation,Sichuan Basin,China. Mar. Orig. Pet. Geol. 23 (02), 39–52. CNKI:SUN:HXYQ.0.2018-02-006.
Hu, M. Y., Wei, G. Q., and Hu, Z. G. (2010). Sequence lithofacies palaeogeography of the middle Permian Qixia formation in Sichuan basin. J. Palaeogeogr. 12 (5), 515–526. doi:10.1017/S0004972710001772
Huang, S. J., Huang, K. K., Lu, J., and Lan, Y. F. (2014). The relationship between dolomite textures and their formation temperature: A case study from the permian-triassic of the Sichuan Basin and the lower paleozoic of the tarim basin. Petroleum Sci. 11 (01), 39–51. doi:10.1007/s12182-014-0316-7
Huang, X. P., Yang, T. Q., and Zhang, H. M. (2004). Research on the sedimentary facies and exploration potential areas of Lower Permian in Sichuan Basin. Nat. Gas. Ind. 24 (1), 10–12. doi:10.3321/j.issn:1000-0976.2004.01.004
Ji, X., Zhang, Y., Zang, D., and Shen, P. (2012). Carbonate reef-shoal reservoir identification in Western longgang, Sichuan Basin. Oil Geophys. Prospect. 47 (2), 309–314. CNKI:SUN:SYDQ.0.2012-02-022.
Jiang, L., Richard, H. W., Cai, C. F., Li, K. K., Xiang, L., Cai, L. L., et al. (2014). Dolomitization of gas reservoirs: The upper permian changxing and lower triassic feixianguan formations, northeast Sichuan basin, China. J. Sediment. Res. 84 (10), 792–815. doi:10.2110/jsr.2014.65
Jorgnson, N. O. (1981). Mg and Sr distribution in carbonate rocks from the Maastrichtian/Danian boundary of the Danish subbasin and the North Sea Central Graben. Sediment. Geol. 30 (4), 311–325. doi:10.1016/0037-0738(81)90027-0
Li, H. (2022). Research progress on evaluation methods and factors influencing shale brittleness: A review. Energy Rep. 8, 4344–4358. doi:10.1016/j.egyr.2022.03.120
Li, H., Tang, H. M., Qin, Q. R., Zhou, J. L., Qin, Z. J., Fan, C. H., et al. (2019). Characteristics, formation periods and genetic mechanisms of tectonic fractures in the tight gas sandstones reservoir: A case study of xujiahe Formation in YB area, Sichuan Basin, China. J. Petrol. Sci. Eng. 178, 723–735. doi:10.1016/j.petrol.2019.04.007
Li, H., Zhou, J. L., Mou, X. Y., Guo, H. X., Wang, X. X., An, H. Y., et al. (2022). Pore structure and fractal characteristics of the marine shale of the Longmaxi Formation in the changning area, southern Sichuan Basin, China. Front. Earth Sci. 10, 1018274. doi:10.3389/feart.2022.1018274
Li, J., Chen, L. W., Hao, C. M., Zhang, J., Chen, S., and Gui, H. R. (2021). Geochemical characteristics and geological significance of chert nodules in Qixia formation, Pingding Mountain, lower Yangtze Plate. J. Mt. Sci. 18 (01), 88–100. doi:10.1007/s11629-020-5982-x
Li, J., Li, H., Yang, C., Wu, Y. J., Gao, Z., and Jiang, S. L. (2022). Geological characteristics and controlling factors of deep shale gas enrichment of the Wufeng-Longmaxi Formation in the southern Sichuan Basin, China. Lithosphere 2022, 4737801. doi:10.2113/2022/4737801
Li, Q. (2018). Characteristics of sedimentary system of Maokou Formation of middle permian in northwest sichuan. Chengdu, China: Chengdu University of Technology. CNKI: CDMD: 2.1018.258776.
Li, X. F. (2017). Research and application of forward modeling response characteristics of carbonate gas reservoirs. Jingzhou, China: Yangtze University, 170970. CNKI:CDMD:2.1017.
Li, R, R., Hu, M. Y., Yang, W., and Mankong, L. (2019). Sedimenta-ryfacies model and favorable reservoir distribution of the Middle Permianin Sichuan Basin. Oil&Gas Geol. 40 (2), 369–379. doi:10.11743/ogg20190215
Liu, L. f., Sun, Z. D., and Yang, H. J. (2009). Seismic attribute optimization method and its application for fractured-vuggy carbonate reservoir. Oil Geophys. Prospect. 44 (6), 747–754. doi:10.1287/mksc.1080.0385
Liu, X. C., Lu, Y. C., Du, X. B., Xiangquan, L., Weibing, L., Jingyu, Z., et al. (2020). Application of geostatistical in-version constrained by sequence framework in thin bedded sandbody prediction. Bull. Geol. Sci. Technol-ogy 39 (3), 99–109. CNKI:SUN:DZKQ.0.2020-03-014.
Mei, M. X. (2010). Correlation of sequence boundaries according to discerning between normal and forced regressions: The first advance in sequence stratigraphy. J. Palaeogeogr. 12 (5), 549–564. doi:10.7605/gdlxb.2010.05.005
Mei, M. X., Ma, Y. S., Zhang, H., Xiaoqing, M., and Yonghong, C. (2007). From Basin black shales to platform carbonate rocks:A study on sequence stratigraphy for the lower cambrian of the upper-yangtze region in south China. Acta Geol. Sin. Ed. 81 (05), 739–755. doi:10.1111/j.1755-6724.2007.tb00999.x
Ngene, T., Mukhopadhyay, M., and Ampana, S. (2022). Reconnaissance investigation of geothermal resources in parts of the Middle Benue Trough, Nigeria using remote sensing and geophysical methods. Energy Geosci. 3 (4), 360–371. doi:10.1016/j.engeos.2022.06.002
Serra, O. (1984). “Foundamentals of well-log interpretation:The acquisition of logging data,” in Development in petroleum science (Amsterdam, Netherlands: Elsevier). doi:10.1016/s0376-7361(08)x7023-2
Sheu, D.-D. (1990). 13C and 18O compositions of carbonates from a cyclic carbonate-evaporite rock sequence: Evidences for meteoric water input. Chem. Geol. 81 (1–2), 157–162. doi:10.1016/0009-2541(90)90045-9
Sheu, D.-D., and Burke, B. (1982). Inferred paleosalinity and phosphate content of carbonate rocks from a cyclic evaporite-carbonate rock sequence. J. Sediment. Res. 52 (3), 897–903. doi:10.1130/0091-7613(1982)10<666
Vail, P. R., and Mitchum, R. M. (1979). Global cycles of relative change of sea level. AAPG Bull. l977, 83–98. doi:10.1306/M29405C32
Wen, J., Peng, J., and Chen, Y. L. (2020). Study on sequence stratigraphy of canglangpu Formation in the central-northern Sichuan Basin. Fault-Block Oil Gas Field 27 (4), 424–431. doi:10.3969/j.issn.1671-1815.2013.19.029
Wu, J., Wang, Y,Z., and Gao, Z. Q. (2013). Using carbon and oxygen isotopes to identify carbonatestrata sequence interface. Sci. Technol. Eng. 13 (19), 5579–5585. doi:10.1155/2011/410621
Wu, L. Q., Hu, M. Y., and Hu, Z. G. (2010). Study on the middle permian sequence stratigraphy of Sichuan Basin. Petroleum Geol. Eng. 24 (6), 10–13. doi:10.3969/j.issn.1673-8217.2010.06.003
Wu, Z. H., Tang, M. T., Zuo, Y. J., Lou, Y. L., Wang, W. T., Liu, H., et al. (2022). Acoustic emission-based numerical simulation of tectonic stress field for tectoclase prediction in shale reservoirs of the northern Guizhou area, China. Energy Geosci. 3 (4), 436–443. doi:10.1016/j.engeos.2021.10.005
Xia, D. L., Wu, Y., Zou, M., Xia, D. D., and Pang, W. (2022). Quality characterization of tight sandstone reservoirs in the yanchang formation of the honghe oilfield, ordos basin, central China. Energy Geosci. 3 (4), 444–452. doi:10.1016/j.engeos.2021.07.001
Xiao, Dai., Cao, J., Luo, B., Tan, X. C., Liu, H., Zhang, B. J., et al. (2020). On the dolomite reservoirs formed by dissolution: Differential eogenetic versus hydrothermal in the lower Permian Sichuan Basin, southwestern China. AAPG Bull. 104 (7), 1405–1438. doi:10.1306/02262018242
Zhang, K., Jiang, S., Zhao, R., Wang, P., Jia, C., and Song, Y. (2022a). Connectivity of organic matter pores in the Lower Silurian Longmaxi Formation shale, Sichuan Basin, Southern China: Analyses from helium ion microscope and focused ion beam scanning electron microscope. Geol. J. 57 (5), 1912–1924. doi:10.1002/gj.4387
Zhang, K., Jiang, Z. X., Song, Y., Jia, C., Yuan, X., Wang, X., et al. (2022b). Quantitative characterization for pore connectivity, pore wettability, and shale oil mobility of terrestrial shale with different lithofacies - A case study of the Jurassic Lianggaoshan Formation in the Southeast Sichuan Basin of the Upper Yangtze Region in Southern China. Front. Earth Sci. 2022, 864189. doi:10.3389/feart.2022.864189
Zhang, K., Song, Y., Jiang, Z. X., Yuan, X., Wang, X., Han, F., et al. (2022c). Research on the occurrence state of methane molecules in postmature marine shales A case analysis of the Lower Silurian Longmaxi Formation shales of the upper Yangtze region in Southern China. Front. Earth Sci. 2022, 864279. doi:10.3389/feart.2022.864279
Zhang, Y. B., Zhao, Z. J., Wang, G. H., Jiang, Z. X., Wang, M. J., Zheng, M., et al. (2014). Type division and controlling factor analysis of 3rd-order sequences in marine carbonate rocks. Geosci. Front. 5 (2), 289–298. CNKI:SUN:GSFT.0.2014-02-013. doi:10.1016/j.gsf.2013.07.002
Zhang, Y. X., Chen, J. W., Zhou, J. Y., and Yuan, Y. (2019). Sedimentological sequence and depositional evolutionary model of lower triassic carbonate rocks in the south yellow sea basin. China Geol. 2 (3), 299–312. doi:10.31035/cg2018113
Keywords: sichuan basin, qixia formation, fourth order sequence, system, sedimentary microfacies, tainei beach
Citation: Liu S, Zhou L, Guan X, Chen X, Wu Y, Tan L, Qiu Z, Qian Y and Zhou J (2023) Research on distribution characteristics of sedimentary microfacies of a system tract under a high resolution sequence framework: A case study of Qixia Formation in Gaomo block, central Sichuan. Front. Earth Sci. 11:1101242. doi: 10.3389/feart.2023.1101242
Received: 17 November 2022; Accepted: 19 January 2023;
Published: 01 February 2023.
Edited by:
Wenlong Ding, China University of Geosciences, ChinaReviewed by:
Shuncun Zhang, Northwest Institute of Eco-Environment and Resources (CAS), ChinaJianguo Yan, Chengdu University of Technology, China
Copyright © 2023 Liu, Zhou, Guan, Chen, Wu, Tan, Qiu, Qian and Zhou. This is an open-access article distributed under the terms of the Creative Commons Attribution License (CC BY). The use, distribution or reproduction in other forums is permitted, provided the original author(s) and the copyright owner(s) are credited and that the original publication in this journal is cited, in accordance with accepted academic practice. No use, distribution or reproduction is permitted which does not comply with these terms.
*Correspondence: Shimin Liu, MTQwOTA2NDE4OUBxcS5jb20=