 Nan Li1
 Qiubo Wu
94% of researchers rate our articles as excellent or good
Learn more about the work of our research integrity team to safeguard the quality of each article we publish.
Find out more
ORIGINAL RESEARCH article
Front. Earth Sci., 18 January 2023
Sec. Economic Geology
Volume 11 - 2023 | https://doi.org/10.3389/feart.2023.1100882
This article is part of the Research TopicAdvances in Exploration and Exploitation of Deep and Ultra-Deep Shale Oil and GasView all 7 articles
In order to explore the feasibility of the Computational Fluid Dynamics (CFD) method for plunger gas lift and the flow pattern in a long wellbore, a lab simulation test was conducted to verify the reliability of the CFD simulation results. Verification data were provided for CFD simulation through carrying out a plunger gas lift lab test for vertical wells, identifying the plunger movement patterns and delivery rates under different flow pressures, and determining the minimum plunger startup pressure or differential pressure and leakage, and an identical CFD physical model was created on the basis of the lab test model, CFD dynamic grid programming and CFD simulation were conducted under test conditions, and a comparison of the simulation and test results was made to identify the calculation accuracy and the rationality of the CFD model and method; finally, boundary conditions such as temperature and pressure were set according to the actual long wellbore (200 m) conditions, the CFD simulation was performed, and the impacts of the downhole conditions on the gas lift performance were analyzed, so as to develop CFD calculation methods to predict the bottom-hole flow pressure, plunger speed, and delivery rate. The results show: the average plunger speed range is 7.74–22.5 m/s when the flow pressure varies from 199.77 to 632.93 kPa, and the leakage rate increases in a nearly linear way with the speed; compared with the lab test results, the simulation results from the created dynamic grid model and multi-phase turbulent flow model have the leakage error of 7.2% and the plunger speed average error is smaller than 11.1%; under long-wellbore conditions, the plunger lift speed shows the change pattern of increasing and then decreasing, the wellbore pressure has a wave-like drop, and in addition to this pressure drop characteristic, the fact that the plunger startup pressure differential increases with the wellhead pressure should be considered (when the bottom-hole pressure is 15 MPa, the wellhead pressure must not exceed 10 MPa).
With the continuous development of the gas field, the formation pressure is gradually reduced, the formation water can not be taken out of the wellbore, resulting in the accumulation of liquid at the bottom of the well. Especially in the middle and late stage of gas well exploitation, the problem of bottomhole fluid accumulation is more common (Zhao and Bai, 2018). The bottom hole fluid mainly comes from the liquefaction of water vapor in the well and the inflow of formation water. The generation of bottom hole effusion makes the bottom hole pressure unable to bring out the natural gas, which reduces the natural flow capacity of the gas well and seriously limits the production of the gas well (Shi et al., 2022). When the fluid accumulation at the bottom of the well increases to a certain extent, the gas well will be completely unable to produce. As an important drainage gas recovery measure, plunger gas lift is widely used in China and abroad. The plunger gas lift-based unloading gas production process is an important lift method for wells that contain gas and water and feature low liquid production and high gas/liquid ratio. It can extend the natural flow periods of such wells, improve their lift efficiency, and reduce the maintenance cost (Tang and Li, 2005; Ge et al., 2017).
So far, many researchers have studied this plunger gas lift-based unloading gas production process. Zhang Ting, Feng Xiaoya, et al. (Li, 2019; Xiaoya, 2020; Zhang et al., 2021) analyzed and optimized the plunger gas lift process and have carried out field program verifications; Duan Jinxian et al. (Duan et al., 2014; Zhang et al., 2014; Yin et al., 2018) conducted numerical flow field simulations for this new-type plunger gas lift process and identified the intra-plunger pressure distribution pattern and flow field change; Liang Decheng et al. (Lea, 1982; Blick et al., 1988; Ferrer and Maggiolo, 1991; Shen et al., 2004; Liang et al., 2019) studied the application of the plunger gas lift process in Zhongjiang Gasfield and proposed well selection and parameter optimization methods; Zhang Fengdong et al. (Zhang et al., 2005) established and worked out a plunger gas lift equation, thus providing a new approach to optimized plunger design; Mover (Mower et al., 1985) et al. took 13 different types of plungers as variables and carried out plunger gas lift experiments in experimental Wells at specific depths. They measured the leakage of different plungers, the working pressure during rising and falling, and the up and down motion speed of different plungers, and obtained the motion relationship chart between different plungers. D.ask (Sask et al., 2010) et al. carried out plunger gas lift experiments in the Great sierra gas field with different plungers as experimental variables, in which the rod plunger had the highest overall lifting and drainage efficiency, and also studied the influence of wellbore trajectory and plunger fluid leakage on the plunger lifting efficiency. Chave et al. (Chava et al., 2008) introduced intelligent equipment and used sensors installed on the plunger to record real-time temperature and pressure data. They proposed a new plunger lifting model, which can use the detected data to predict changes in other parameters. Tang Zuping (Tang and Li, 2005) et al. proposed a scheme to supplement the gas well with insufficient formation energy by artificial gas injection and maintain the production of the gas well. Considering the volume loss during the upward movement of the plunger, the plunger dynamic lifting model and liquid leakage equation were established. The influencing factors of artificial gas injection and plunger leakage were calculated, which provided a theoretical basis for plunger gas lifting process design. Cao Yinping (Cao, 2018) designed a set of plunger gas lift experimental device according to the actual situation of plunger gas lift, and carried out plunger gas lift experiments in highly deviated wells. The experimental phenomena of plunger upward and downward under different air intake, liquid volume and well inclination angle were observed. The influence of plunger movement speed, rising height and well inclination angle on plunger gas lift efficiency was analyzed. Liu Chunlu (Liu, 2020) designed the structure of the split plunger and conducted the gas lift experiment of the split plunger by taking the plunger groove type, air intake and liquid intake as the experimental variables. The data of the drainage of the plunger, the plunger movement speed and pressure change under different working conditions were obtained, and the analysis showed that the inclined ladder groove had the best drainage effect. To sum up, there have been many researches on lab tests and model equations regarding the plunger gas lift process, but no papers discuss how to apply the lab test results to long wellbores. The computational fluid dynamics (CFD) method is widely used for various gas lift simulations and can more visually explain and analyze the key lift parameters under the long wellbore conditions (Xu et al., 2020) with higher accuracy through simulating the change patterns of the relevant parameters, such as plunger speed and loss, in the numerical way according to CFD principles.
The paper presents a lab test simulating the plunge gas lift in a vertical well, during which the plunger movement patterns and delivery rates under different flow pressures, the minimum plunger startup pressure/differential pressure and loss, and the average plunger speed, loss, and their correlation were identified under different bottom-hole flow pressures and casing pressures; a CFD physical model was created according to the geometric model in the test to calculate the force applied on the plunger according to the pressure and shear stress distributions on its surface (Zheng et al., 2020), a macro definition was used in the CFD code and a CFD dynamic grid model was created to acquire the calculated CFD value, and a comparison was made with the lab value; when the model was applied to the actual wellbore conditions, a 200 m-long wellbore model was created, the related temperature and pressure were set as the boundary conditions, and the average plunger speed and loss under the actual wellbore conditions were measured, thus providing guidance on the actual applications of this process with the aim of realizing optimal gas well production.
The plunger gas lift test platform is mainly composed of a plunger gas lift stand, mixing tank, water and gas power system, water and gas flow measurement system, pressure sensor, flow regulation system, data acquisition system, control system, gas-liquid separation system, test pipe section, and manifold system. The gas and water power system is used to supply water and gas to the bottom of the wellbore so as to give an initial bottom-hole pressure. On the plunger gas lift stand there is a 13 m-high U-shaped simulation wellbore that can dip at any angle within the range 0–90, The experiment was carried out on the plunger gas lift experimental platform in the multiphase flow laboratory, which was mainly composed of the power system, testing system, metering system and data acquisition system. The power system was mainly composed of the screw type air compressor and the centrifugal pump. The measuring system is mainly composed of a 75 m “U” pipe with a height of 13 m and an inner diameter to simulate the actual tubing and casing. The left transparent pipe is the simulated tubing, and the inside is the plunger lifting channel. The rod shaped streamline plunger is used, and the right steel pipe is the simulated casing, which acts as the “pressure source” of the tubing and casing annulus. The U-shaped tube is installed on the test bench, which is adjustable from 0–90. Metering system consists of gas-liquid flow agent, pressure differential sensor and liquid carrying measurement system. The gas and water flowmeter has the flow rate range of 0–500 m3/h and the accuracy of ± 0.5%; the test pipe section’s pressure loss measurement accuracy and resolution are respectively ± 0.025% and ≤1 kPa; the air flowmeter’s flow rate range and measurement accuracy are respectively 0–50,000 m3/d and ± 1%; the platform scale’s measurement accuracy, model, and range are respectively 1%, XK3190-A12+E, and 100–10,000 kg; The data acquisition system is mainly composed of computer, which is mainly used to collect the measured data in real time, and process it into the designed table, which is convenient to call the test procedure is as shown in Figure 1A, and the reconstructed plunger gas lift test stand is as shown in Figure 1B, C.
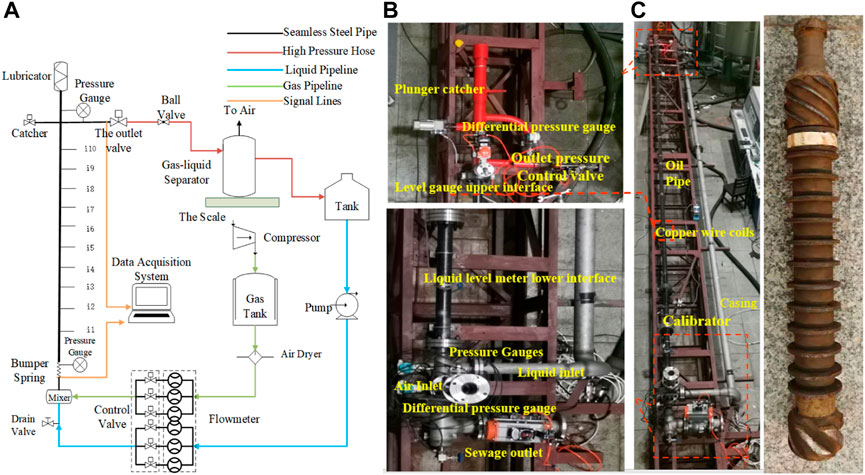
FIGURE 1. Reconstructed plunger gas lift stand. (A). Schematic diagram for plunger gas lift test (B). Simulated wellbore (C). Rod-like streamlined plunger.
In the experiment, the bottom hole flow pressure was controlled to be fixed and the height of liquid column above the plunger was controlled to simulate the movement condition of the formation liquid accumulation gas well. When the set condition was reached, the valve was opened to reach the set gas volume, and the wellbore pressure difference, liquid carrying amount and the speed when the plunger reached the set position were measured. The same process was repeated 2–3 times to reduce the experimental error. The experimental parameters were set according to the equivalent substitution of plunger gas lift in actual gas fields. The well track was vertical well, the bottom hole pressure was 200–450 KPa, the liquid column height was 0–5 m, and the gas volume was 0–50000 m3/d, which guaranteed the accuracy of the experiment and provided guarantee for CFD numerical simulation.
Table 1 presents the plunger gas lift test data, i.e. the lift or liquid production details under the initial accumulated gas energy of the wellbore. The parameters t1 and t2 are the times required by the plunger to move from the benchmark position to the first and second test points respectively (Figure 2), vm is the plunger’s average speed during the speed measurement section (7.2 m), the theoretical fluid displacement is the mass of the hydrostatic column above the plunger before the lift, and the loss is the difference between the theoretical and actual displacements. It can be seen that the average plunger speed changes within the 7.74–22.5 m/s when the flow pressure changes within the range 199.77–632.93 kPa. As the speed increases, the loss increases nearly in the linear way (Figure 3).
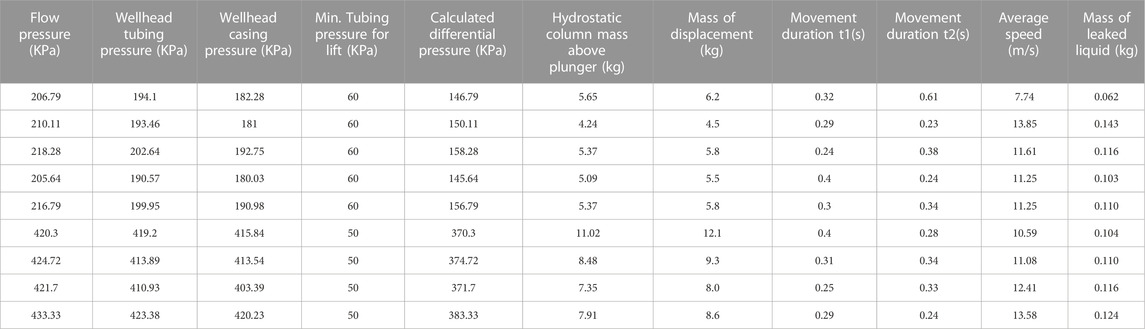
TABLE 1. Data of rod-like plunger gas lift test.
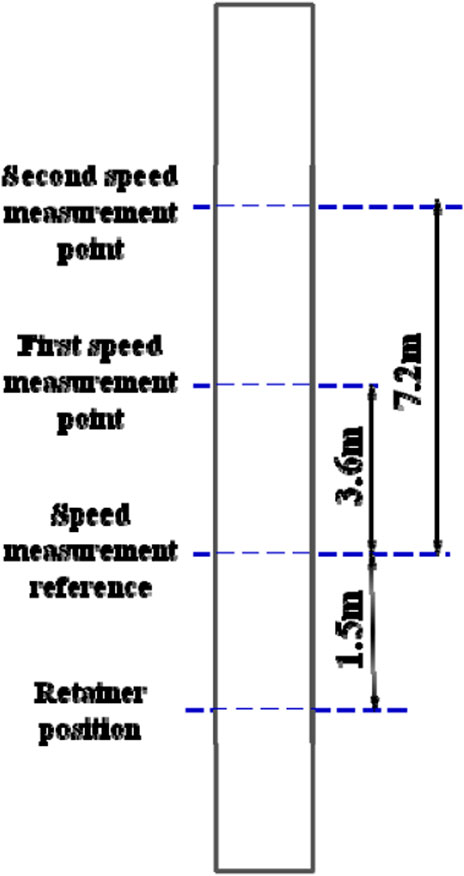
FIGURE 2. Plunger movement measurement points.
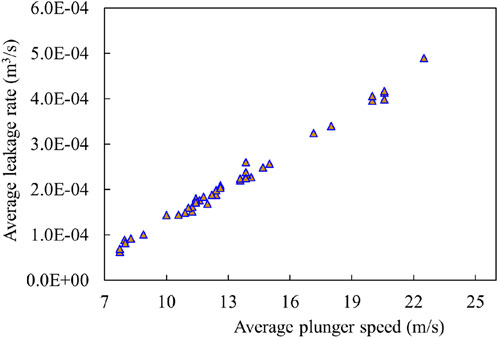
FIGURE 3. Change of average leakage rate with average plunger speed.
The plunger gas lift efficiency directly determines the economic benefit of the gas lift-based unloading gas production. The correlation between average plunger speed and lift efficiency was identified through the lab simulation test.
Figure 4 shows that the plunger lift efficiency increases as the average plunger speed increases and increases rapidly when the average speed was lower than 15 m/s and tends to be stable when the average speed exceeds 15 m/s. Under the lab conditions, the plunger movement was first accelerated and then was kept at a constant speed when the bottom-hole flow pressure and casing pressure were low, i.e., the average plunger speed increased gradually and the loss decreased gradually; when both the bottom-hole flow pressure and casing pressure reached higher values, the plunger acceleration tended to be the maximum value and the plunger was all the way in the accelerated state during the entire plunger movement process, thus driving the accumulated liquid upward and causing the bottom-hole loss to tend to be stable and reach a balance; so, the plunger efficiency first increased as the average plunger speed increases and then tended to be stable.
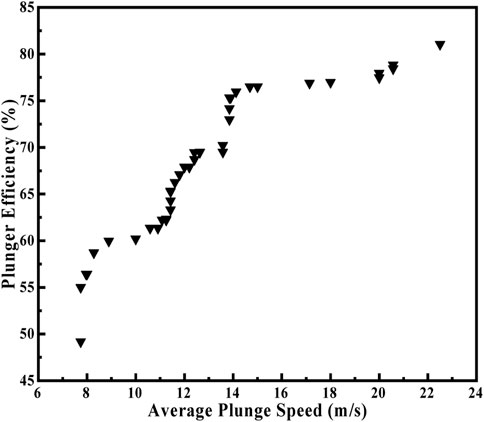
FIGURE 4. Change of plunger efficiency with average plunger speed.
The forces applied on the plunger are as shown in Figure 5. Its kinetic equation is:
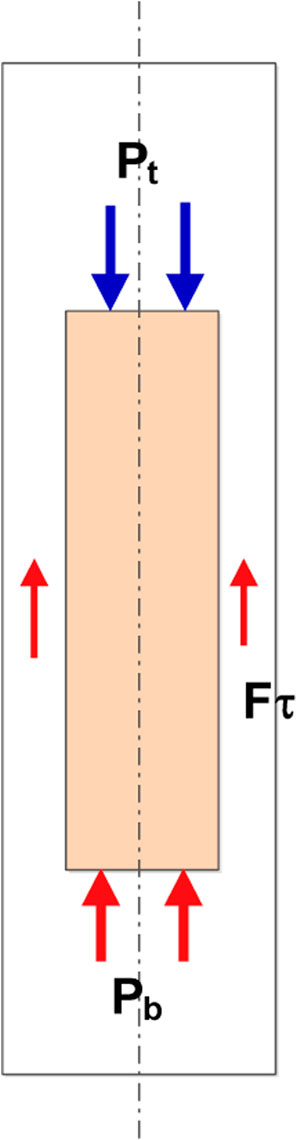
FIGURE 5. Forces applied on plunger.
The parameter m is the moving mass of the plunger (kg); az is the acceleration of the plunger (m/s2); Pb and Pt are the pressures respectively above and under the plunger (Pa); A is the area of the plunger’s end face (m2); Fτ is the tangential force of the fluid on the plunger (N).
When the CFD method was used to simulate the plunger, the multi-phase flow field was first acquired through iteration to identify the pressure and shear stress distributions on the plunger and calculate the forces applied on the plunger, then they were substituted into the first Eq. 1 to determine the instant acceleration, and finally the current speed vz(n) was determined according to the just acquired instant acceleration as well as the plunger speed vz(n−1) during the last moment.
Therein, Δt is the time step (s).
A 3D channel model (as shown in Figure 6) was created according to the size of the plunger gas lift test stand. In the U-shaped tube, the simulation tubing with the inner diameter of 62, in which a 485 m-long and 4 kg-heavy rod-like plunger was put, was connected to the simulation casing with the inner diameter of 60 m. In view of the fact that the plunger was lifted by the accumulated energy in the enclosed wellbore space in the test, the gas/liquid inlet pipe nipple could be removed when the model was created. A six-sided grid was employed to classify the flow area, and 10 layers of meshes were laid out between the plunger and tubing to capture the flow field in their clearance, with the total number of cells up to 435,280. Calculations showed that the calculation results can meet the grid-independent requirement when the total number of cells is larger than 340,000.

FIGURE 6. U-shaped CFD model for plunger gas lift. (A). Flow channel model (B). Grid model.
Because of the limited test stand height and the rapid plunger movement, the simulation results did not necessarily reveal the complete plunger movement pattern and the simulation of the actual wellbore requires high computer performance, and the computing capacity of computer can not be reached at present. So, a 200 m-long wellbore model was created (as shown in the Figure 7). The 190 m-long plunger gas lift channel within the vertical wellbore consisted of the tubing-casing annulus and the internal chamber of the tubing. The inner diameters of the casing and tubing were respectively 157.08 and 62 m. The channel was 10 m away from the bottom of the well. The cylindrical plunger had the diameter of 58 m and the length of 0.5 and was 15 m away from the bottom of the well.
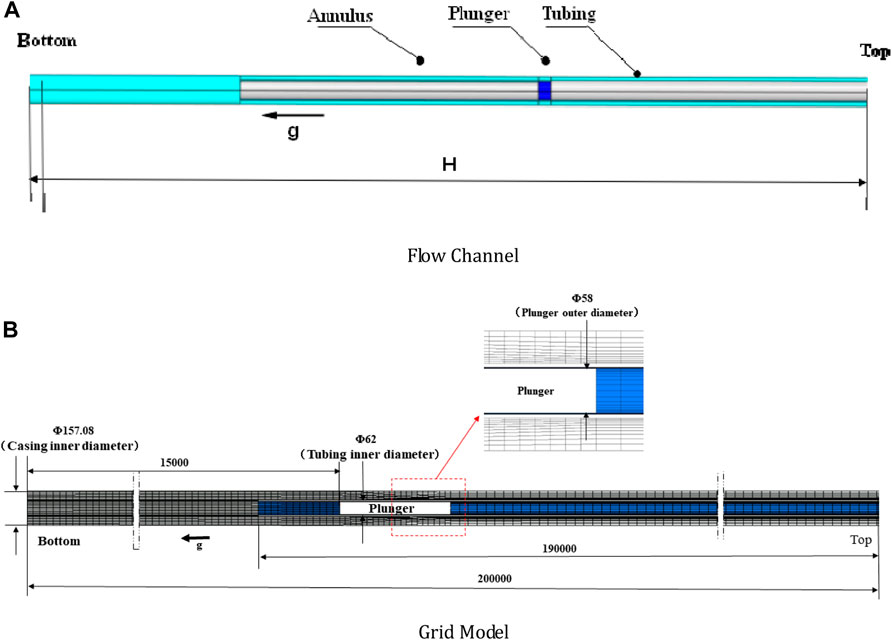
FIGURE 7. CFD model for down-hole plunger gas lift. (A). Flow channel model (B). Grid model.
The impacts of the downhole HTHP conditions on the physical properties of the natural gas were considered during the simulation. The Peng-Robinson Equation was used to calculate the values of the parameters including natural gas density, viscosity, specific heat capacity, and heat conductivity as well as water density, viscosity, specific heat capacity, and heat conductivity. The temperature and pressure ranges were respectively 20–70°C and 5–30 MPa. The specific parameter values are as shown in Table 2.
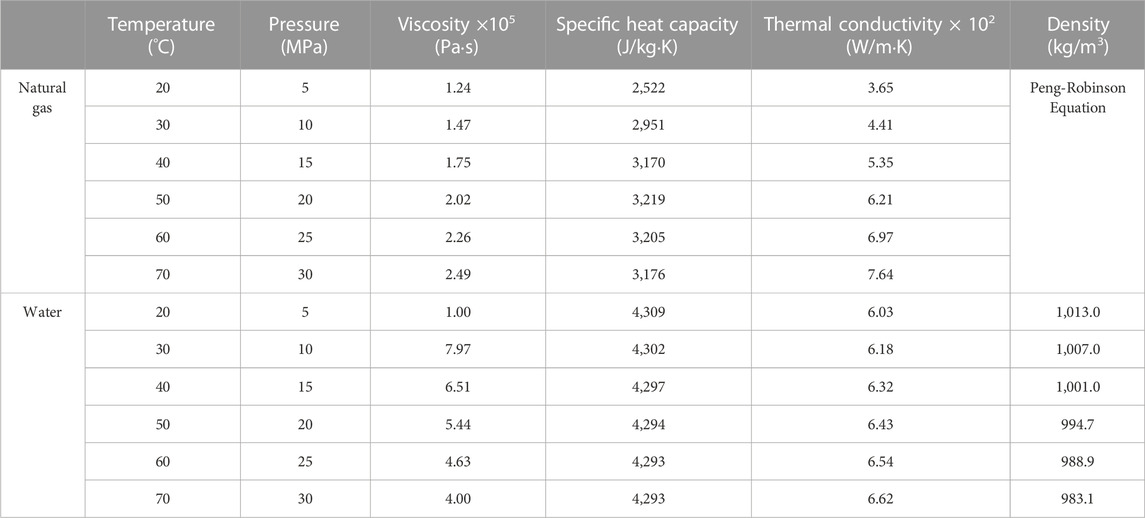
TABLE 2. Physical property parameters of natural gas and water under different temperatures and pressures.
Because there is a distinct interface during the plunger gas lift, VOF and Eulerian models can represent the gas-liquid interface satisfactorily; however, the Eulerian model involves many equations and considerable time consumption; so, the VOF model was used as the multi-phase flow model. The Reynolds Stress model is often used for high-strength cyclone conditions, and both the k- and k-models can successfully simulate the involved gas-liquid flow; however, the k-model is more stable, so a VOF + k-multi-phase turbulent flow model was used for the transient simulation. A small time step, i.e. 10−3, was set for easy convergence. The initial liquid level and pressure were given. No inlet boundary was involved. The wellhead position provides the outlet boundary conditions, with the gauge pressure of 0.
Application cases of the VOF model include stratified flow, free surface flow, influx, sloshing, flow of big bubbles in a liquid, water flow in case of a dam burst, and any steady-state or transient-state liquid-gas interface.
Continuity equation: the interphase interfaces can be tracked through working out the continuity equation for volume fractions; the continuity equation for the volume fraction αq of the phase q is as follows:
Momentum equation: a single moment equation was solved within the entire calculation domain and the speed field acquired can be shared by all the phases. The moment equation is related to the volume fraction through physical property parameters:
Such a flow field-sharing equation has limitations, one of which is that the calculation of the speed near the interface has low accuracy when a large speed field is shared by all the phases. When the viscosity factor ratio of these phases is higher than 10, convergence is difficult if the method is used.
Energy equation: the following energy equation is shared by all the phases:
In this model, the mass-weighted average of the energies (
When the bottom-hole flow pressure was 2 atm and the plunger’s upper end face was 2 m below the liquid level, the simulated flow field for plunger gas lift is as shown in Figure 8.
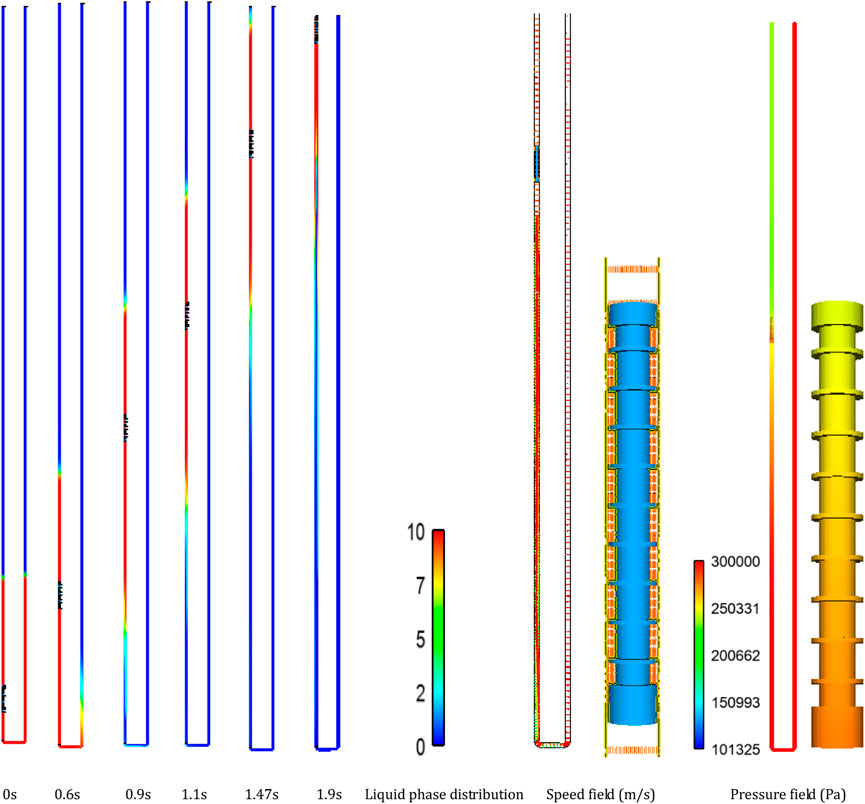
FIGURE 8. Flow field change of plunger gas lift (bottom-hole flow pressure: 2 atm).
Figure 9A shows the instantaneous speed of the plunger. The following can be seen: the plunger’s upward speed increased with time in a nearly linear way; the maximum flow rate was 12.48 at 2 and 12.39 m/s at 3 atm; the total upward displacement was 12.5 m; the required times were respectively 1.90 and 1.63 s; the higher the flow pressure was, the higher the plunger speed was.
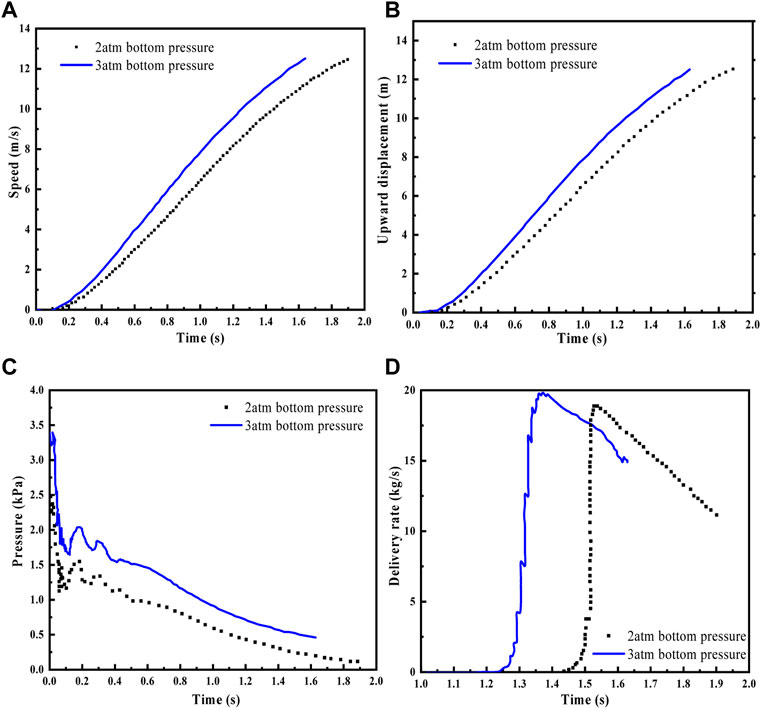
FIGURE 9. Analysis of simulation results. (A). Plunger’s upward speed. (B). Plunger’s upward displacement. (C). Bottom-hole pressure change. (D). Wellhead liquid flow rate.
Figure 9C shows the change of the bottom-hole pressure. It can be seen that the bottom-hole pressure dropped constantly, but within a period of time after the plunger suddenly started up, the strongly coupled plunger movement and flow rate brought about a dramatic pressure fluctuation. When the plunger arrived at the wellhead, the bottom-hole pressure dropped to 0.11 and 0.47 kPa respectively under the different initial bottom-hole pressures.
Figure 9D shows the delivery rates at the wellhead. It can be seen in the figure that when the plunger pushed the liquid column to a certain height, there was a liquid production at the wellhead and the instantaneous flow rate first increased dramatically and then gradually dropped.
It can be seen in the figure that under the difference between the bottom-hole pressure and the wellhead pressure, the gas and liquid phases along with the plunger moved toward the wellhead and meanwhile the pressure in the tubing gradually dropped. The time when the plunger reached the wellhead was 1.9 s. Then, the total liquid displacement was 5.966 kg. The mass of the initial liquid column above the plunger was 6.023 kg. Thus, the loss was 0.058 kg, which is slightly lower than the measured value of 0.062 (relative error: 7.2%). The plunger’s simulated average speed between the first and second speed measurement points as shown in the figure is 8.6 m/s, with the relative error of 11.1% compared with the measured value of 7.74 m/s. This indicates that the CFD numerical simulation matches well with the test and can well predict the loss and speed change of the plunger gas lift.
When the bottom-hole flow pressure and the wellhead tubing pressure were respectively 15 and 8 MPa and the liquid level was 30 m away from the bottom of the well, there occurrs a flow field for the plunger gas lift, as shown in Figures 10–12. Figures 10, 12 show that the plunger and liquid constantly move upward in the tubing after the wellhead valve is opened and meanwhile the liquid within the annulus drops and enter the tubing in its entirety and the pressure anywhere from the wellhead to the bottom of the well drops gradually (see Figure 12). Figure 10F shows that the accumulated liquid below the tubing is not displaced due to the shortage of the lifting force because it is assumed that no gas and liquid replenishment from the formation into the wellbore is made.
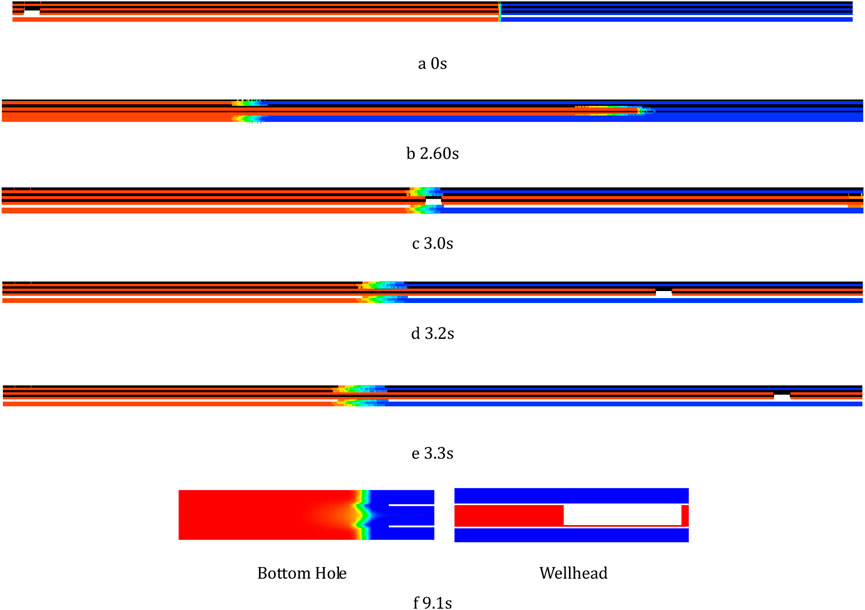
FIGURE 10. Liquid phase distribution (Red) during plunger gas lift. (A) 0. (B) 2.60. (C) 3.0. (D) 3.2. (E) 3.3. (F) 9.1 s.
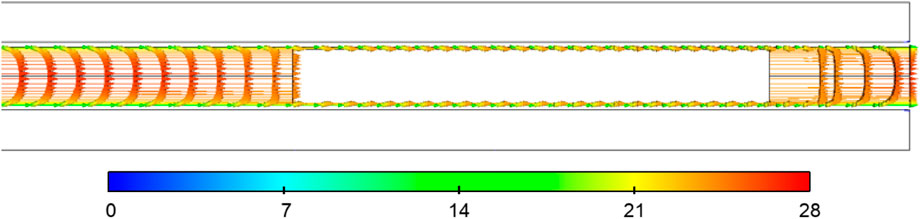
FIGURE 11. Speed field in plunger-tubing clearance (m/s).
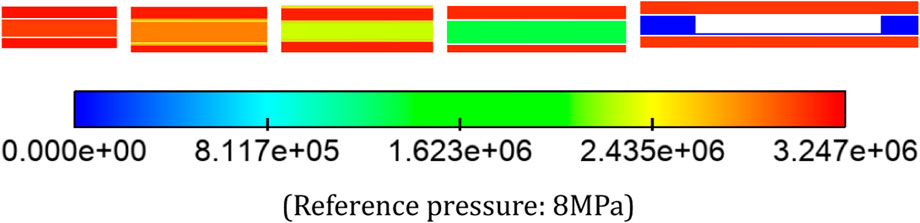
FIGURE 12. Pressure field in wellbore (9.1 s).
The time consumed by the plunger to reach the wellhead is 9.1 s and its speed and displacement are as shown in Figure 13. About .45 s after the wellhead valve is opened, the plunger begins to move upward and gains speed; about 1.15 s after the wellhead valve is opened, its speed gradually drops and tends to be stable. A comparison with the test model shows that the deceleration and nearly constant speed processes after the plunger acceleration differentiate them.
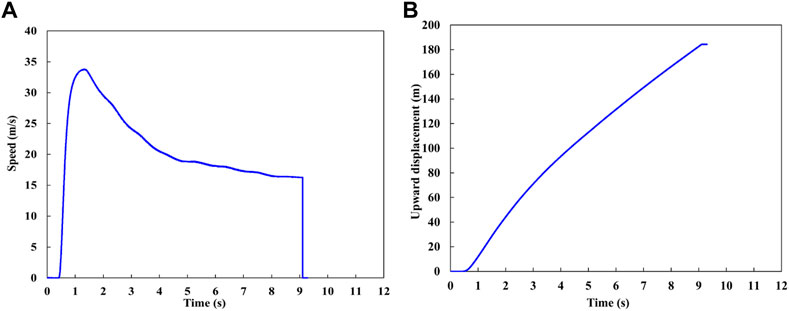
FIGURE 13. Plunger speed and displacement curves. (A). Plunger speed (B). Plunge displacement.
During the gas lift, the bottom-hole pressure showed a wave-like drop pattern, and the pressure waves came mainly from the strongly coupled effects of the plunger movement and fluid flow. The frictional pressure drop plays a dominant role in the plunger movement. As the speed decreases, the frictional pressure drop will gradually increase and thus the pressure will decrease (as shown in Figure 14A). The instantaneous liquid flow rate at the wellhead is as shown in Figure 14B. At 7.77 s, liquid production from the wellhead began to occur and then the flow rate dramatically increased; when the plunger reached the wellhead, the flow rate dropped sharply. The total displacement when the plunger reached the wellhead was calculated at 529.26 kg, which is slightly lower than the initial liquid mass above the plunger. Thus, the loss was 32.23 kg.
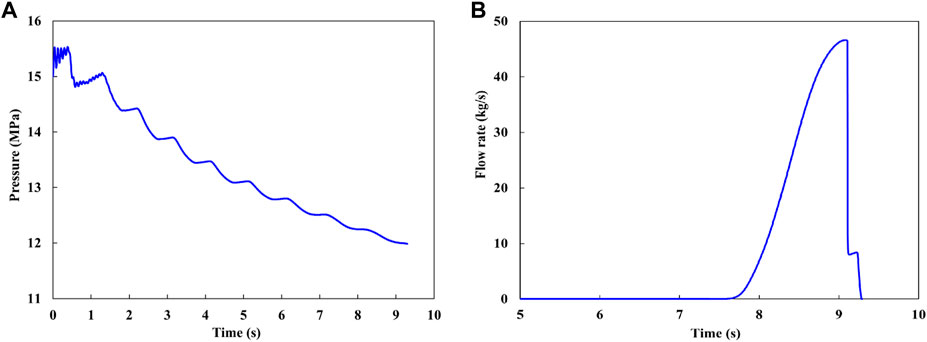
FIGURE 14. Simulation results in case of 15 MPa bottom-hole pressure and 5 MPa wellhead tubing pressure. (A). Bottom-hole pressure (B). Wellhead liquid flow rate.
The simulation results when the bottom-hole flow pressure is kept at 15 MPa and the wellhead pressure is changed are as shown in Figures 15A–D. As the wellbore pressure difference decreases, the plunger’s upward speed drops and the time required for it to reach the wellhead is longer. When the wellhead pressure reaches 12 MPa and the initial pressure difference is 3 MPa, the plunger cannot continue to move upward when it travels 100 m upward because the bottom-hole pressure drops to 13.5 MPa and its difference from the wellhead pressure is only 1.5 MPa. Thus, to keep a sufficient bottom-top pressure difference is an important condition for the plunger gas lift process to be feasible, and it is necessary to minimize the wellhead pressure on the premise that the surface gathering pressure requirement is met. When the bottom-hole flow pressure is 15 MPa, the wellhead pressure cannot exceed 10 MPa.
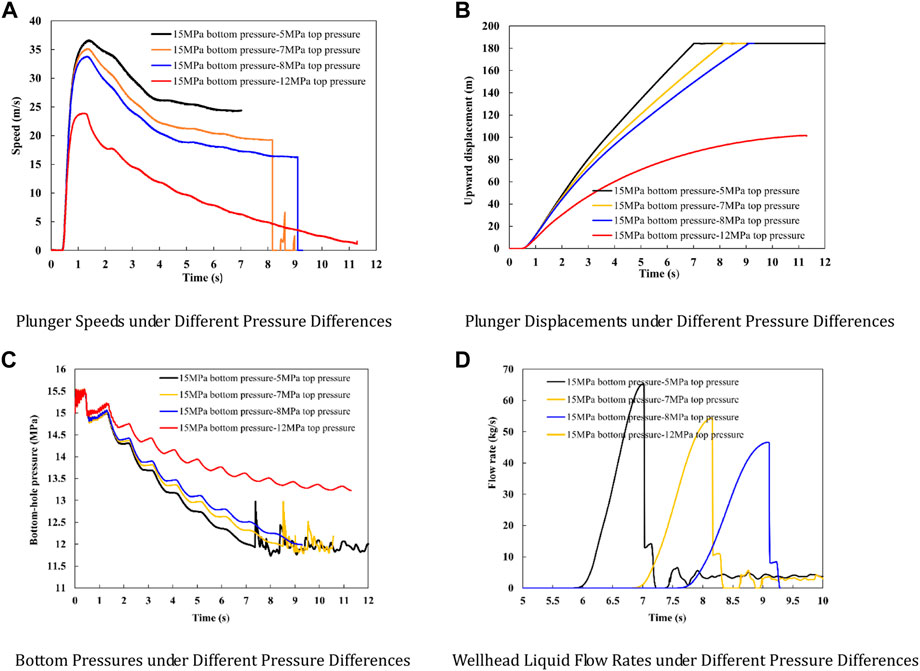
FIGURE 15. Simulation results under 15 MPa bottom-hole pressure and different wellhead tubing tressures. (A). Plunger speeds under different pressure differences (B). Plunger displacements under different pressure differences. (C). Bottom pressures under different pressure differences (D). Wellhead liquid flow rates under different pressure differences.
When the pressure difference is 5 MPa, a bottom-top pressure combination change affects the plunger lift. It can be seen in Figures 16A, B that the plunger can be successfully lifted when the wellhead pressure (gauge pressure) is zero or 10 MPa, but when the wellhead pressure reaches 15 MPa, the plunger can travel 150 m at most and will drop gradually due to the wellbore pressure drops. In addition, Figure 16 also shows that higher wellhead pressure means quicker plunger startup and a rapid wellbore pressure drop means a quicker plunger speed drop.
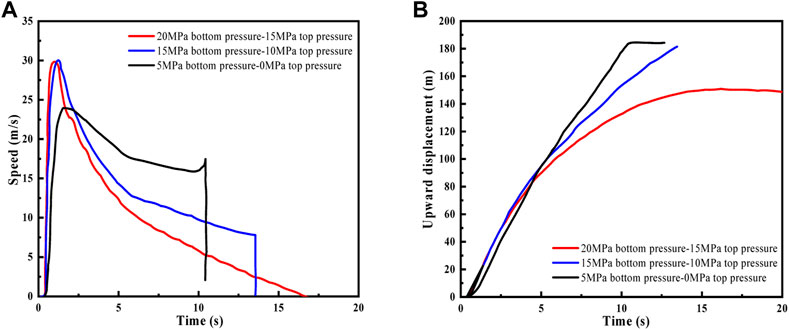
FIGURE 16. Simulation results under 5 MPa Bottom-top pressure difference and different wellhead pressures. (A). Plunger speed under 5 MPa pressure difference (B). Upward plunger displacement under 5 MPa pressure difference.
The following conclusions were made on the basis of the lab test and CFD simulations under general test conditions and long-wellbore test conditions:
1) In the plunger gas lift test for vertical wells conducted under the low-pressure lab conditions, the plunger speed average varied in the range of 7.74–22.5 m/s when the flow pressure varied in the range of 199.77–632.93 kPa, and the loss increased in the nearly linear way as the plunger speed increased.
2) The comparison of the lab simulation test data and the CFD simulation results, which came from the created dynamic grid model and multi-phase turbulent flow model, shows that the loss error was 7.2% and the average speed error was not higher than 11.1%, thus indicating that the CFD numerical simulation can well predict the loss and plunger speed change during the plunger gas lift.
3) The simulation results from the created 200 m-long long wellbore model under actual wellbore conditions show that the plunger lift speed has the variation pattern of increasing and then dropping and that the wellbore pressure has a wave-like drop.
4) The determination of the plunger starting pressure difference is related to the pressure drop and wellhead pressure. The higher the wellhead pressure is, the greater the required starting pressure difference is. (when the bottom-hole pressure is 15 MPa, the wellhead pressure must not exceed 12 MPa).
The raw data supporting the conclusion of this article will be made available by the authors, without undue reservation.
Conceptualization, NL, YJ, and WQ; methodology, HW; validation, GC; formal analysis, WM; investigation, HG; resources, QW; writing—original draft preparation, HW; writing—review and editing, NL; supervi-sion, HG; project administration, NL; All authors have read and agreed to the pub-lished version of the manuscript.
Authors NL, GC, HW and QW were employed by CNPC RIPED. Authors YJ and HG were employed by PetroChina Zhejiang Oilfield Company. WQ and WM were employed by PetroChina Coalbed Methane Company Limited.
All claims expressed in this article are solely those of the authors and do not necessarily represent those of their affiliated organizations, or those of the publisher, the editors and the reviewers. Any product that may be evaluated in this article, or claim that may be made by its manufacturer, is not guaranteed or endorsed by the publisher.
Blick, E. F., Enga, P. N., and Lin, P. C. (1988). Theoretical stability analysis of flowing oil wells and gas lift wells. SPE Prod. Eng. 3 (04), 508–514. doi:10.2118/15022-pa
Cao, Y. (2018). Simulation and optimization of drainage gas recovery by plunger lift in highly deviated wells[D]. Cheng Du: Southwest Petroleum University.
Chava, G. K., Falcone, G., et al. (2008). “Development of a new plunger-lift model using smart plunger data[C],” in Annual Technical Conference and Exhibition, 21–24.
Duan, J., Li, Y., and Zhong, H. (2014). Numerical simulation of new plunger gas lift flow field based on Fluent software [J]. J. Oil and Gas Technol. 36 (03), 117–120.
Ferrer, A. A., and Maggiolo, R. (1991). “Use of a computerized model in the optimization of continuous gas-lift operations[C],” in SPE Production Operations Symposium, Oklahoma City, Oklahoma, April 7, 1997.
Ge, K., Zou, J., and Song, W. (2017). Research progress on optimization design of plunger gas lift drainage parameters [J]. Digit. Des. 6 (01), 21–24+36. doi:10.19551/j.cnki.issn1672-9129.2017.01.06
Lea, F. J. (1982). Dynamic analysis of plunger lift operations. J. Petroleum Technol. 34 (11), 2617–2629. doi:10.2118/10253-pa
Li, X. (2019). Numerical simulation and optimization design of directional well plunger gas lift device [D]. Daqing, China: Northeast Petroleum University.
Liang, D., Xu, X., Ren, J., et al. (2019). Application of plunger gas lift drainage technology in Zhongjiang Gas Field [J]. Chem. Eng. Manag. (36), 209–210.
Liu, C. (2020). Study on the structure and performance of a new split gas-lift plunger. Daqing: Northeast Petroleum University.
Mower, L. M., Lea, J. F., and Ferguson, P. L. (1985). “Defining the characteristics and performance of gas lift plungers,” in SPE Annual Technical Conference and Exhibition, Las Vegas, Nevada, September 22, 1985. SPE Paper.No.14344.
Sask, D., Kola, D., and Tuftin, T. (2010). “Plunger lift optimization in horizontal gas wells: Case studies and challenges[C],” in Canadian Unconventional Resourcesand International Petroleum Conference, Calgary, Alberta, 19-21 October 2010 (Canada: Society of Petroleum Engineers).
Shen, S., Li, H., and Wang, Z. (2004). Research and application of PCS intelligent plunger lifting technology in Hubuzhai gas field [J]. Inn. Mong. Petrochem. Ind. (S1), 3–5+38.
Shi, H., Liu, J., Luo, W., et al. (2022). Study on liquid leakage model of rod plunger gas lift [J]. J. Xi 'an Petroleum Univ. ( Nat. Sci. Ed. ) 37 (01), 101–106+136. doi:10.3969/j.issn.1673-064X.2022.01.013
Tang, Z., and Li, Y. (2005). Analysis of liquid leakage in plunger gas lift process [J]. Oil Drill. process 83 (01), 44–45+48–83.
Xiaoya, F. (2020). Process design and lifting capacity analysis of plunger gas lift [D]. Jingzhou, China: Yangtze University.
Xu, X., Li, H., Huang, L., et al. (2020). “Optimization method of plunger gas lift process parameters considering gas channeling [C],” in Proceedings of the 32 nd National Natural Gas Academic Annual Conference, Chongqing, China, November 11, 2020. Natural Gas Professional Committee of Chinese Petroleum Society, 2407–2415. doi:10.26914/c.cnkihy.2020.065138
Yin, Q., Liu, F., He, J., et al. (2018). Research and application of plunger gas lift drainage and gas recovery technology [J]. Pet. Mach. 46 (09), 69–74. doi:10.16082/j.cnki.issn.1001-4578.2018.09.014
Zhang, F., Li, H., Li, H., et al. (2005). Establishment and solution of plunger gas lift model equation [J]. Drill. Min. Technol. (04), 66–69+18.
Zhang, Q., Ren, Y., Yabo, L., et al. (2014). “Evaluation and analysis of applicability effect of drainage gas recovery process in sulige gas field [C],” in Innovation Quality Low Carbon Sustainable Development - The 10th Ningxia Young Scientists Forum Petrochemical Thematic Forum Papers, Yinchuan China, July 23, 2014, 386–392+396.
Zhang, T., Tang, H., Zhu, P., et al. (2021). Research and application of plunger gas lift drainage technology for low pressure deep well [J]. Drill. Prod. Technol. 44 (06), 124–128. doi:10.3969/J.ISSN.1006-768X.2021.06.026
Zhao, K., and Bai, B. (2018). Transient liquid leakage during plunger lifting process in gas wells. J. Nat. Gas Sci. Eng. 59, 250–261. doi:10.1016/j.jngse.2018.09.009
Keywords: plunger gas lift, CFD simulation, loss, average speed, pressure drop
Citation: Li N, Cao G, Jiang Y, Gao H, Wang H, Wu Q, Qi W and Ma W (2023) Numerical computational fluid dynamics (CFD) simulation study based on plunger gas lift test. Front. Earth Sci. 11:1100882. doi: 10.3389/feart.2023.1100882
Received: 17 November 2022; Accepted: 02 January 2023;
Published: 18 January 2023.
Edited by:
Hongjian Zhu, Yanshan University, ChinaReviewed by:
Yonghui Liu, Southwest Petroleum University, ChinaCopyright © 2023 Li, Cao, Jiang, Gao, Wang, Wu, Qi and Ma. This is an open-access article distributed under the terms of the Creative Commons Attribution License (CC BY). The use, distribution or reproduction in other forums is permitted, provided the original author(s) and the copyright owner(s) are credited and that the original publication in this journal is cited, in accordance with accepted academic practice. No use, distribution or reproduction is permitted which does not comply with these terms.
*Correspondence: Guangqiang Cao, Y2FvZ3VhbmdxaWFuZ0BwZXRyb2NoaW5hLmNvbS5jbg==
Disclaimer: All claims expressed in this article are solely those of the authors and do not necessarily represent those of their affiliated organizations, or those of the publisher, the editors and the reviewers. Any product that may be evaluated in this article or claim that may be made by its manufacturer is not guaranteed or endorsed by the publisher.
Research integrity at Frontiers
Learn more about the work of our research integrity team to safeguard the quality of each article we publish.