 Guangyao Cai
 Weilai Wang
 Jianping Wu
 Jinrong Su2
 Guijuan Lai
- 1Institute of Geophysics, China Earthquake Administration, Beijing, China
- 2Sichuan Earthquake Agency, Chengdu, China
- 3Beijing Earthquake Agency, Beijing, China
An MS 6.8 earthquake struck the Luding county in the southeastern section of the Xianshuihe fault on 5 September 2022, causing heavy casualties and serious property losses. Using the data of 61 seismic stations surrounding the focal area, we utilize the machine learning-based LOC-FLOW for phase picking and association, and obtain a total of 13,496 aftershocks. We also collate 2,331 preshocks near the mainshock. We then conduct event relocation and three-dimensional P- and S-wave velocity structure inversion by double-difference tomography. The catalog we obtained has higher accuracy and completeness than the manual catalog. The relocation results show that the mainshock struck the Moxi section of the Xianshuihe fault at 9.2 km depth. There is a southeast-striking seismic strip of 35 km long at 5–13 km depth, and two relatively shallow seismic clusters exist to the west and northwest of the mainshock. Furthermore, there is an obvious seismic gap to the northwest of the mainshock. Based on the spatial pattern of the aftershock sequence, we speculate that the Moxi section of the Xianshuihe fault is the seismogenic fault. The earthquakes are mainly located in the regions of low velocity and low Poisson’s ratio, which is consistent with the granite that is geologically distributed along the southeast section of the Xianshuihe fault. There are two high-velocity zones located to the northwest and southeast of the mainshock, which are speculated to have controlled the rupture scale of the MS 6.8 Luding earthquake.
1 Introduction
According to the report from China Earthquake Networks Center, an MS 6.8 earthquake struck the Luding County (29.59°N, 102.08°E) in Sichuan province at 04:52 on 5 September 2022 (UTC) with a focal depth of 16 km. Within 5 days, there are 16 M3.0+ aftershocks, including 14 M3.0∼3.9 events and two M4.0∼4.9 events. According to the intensity survey result, the highest intensity near the focal area is IX; the long axis is 195 km and NW-directed, whereas the short axis is 112 km (http://www.mem.gov.cn/xw/yjglbgzdt/202209/t20220911_422190.shtml). The earthquake caused heavy casualties and serious property losses; a total of 93 people died and a large number of houses were collapsed.
The Ms 6.8 Luding earthquake is another strong earthquake that occured on the boundaries of the Bayanhar block over the past 25 years (Figure 1; Wang, 1998; Zhang et al., 2003). Since the 1997 M7.5 Mani earthquake, all the M7.0+ earthquakes in mainland China occurred on the boundaries of the Bayankara block, including two M8.0+ earthquakes, indicating that the boundaries of this block is prone to strong earthquakes. The southeast of the Bayanhar block is also the borders of the Sichuan-Yunnan block and the South China block (Qiao et al., 2004; Xu et al., 2005; Chen et al., 2013); several major faults, including the Xianshuihe fault, the Longmenshan fault, the Anninghe-Zemuhe-Xiaojiang fault and the Xiaojinhe fault, converging here (Figure 2; Xuan et al., 2015; Zhao et al., 2018). These faults have different properties and slip rates: the slip rates are larger for the Xianshuihe fault and the Anninghe-Zemuhe-Xiaojiang fault, and relatively smaller for the Longmenshan fault and the Xiaojinhe fault (Shen et al., 2005; Zhang, 2013; Zheng et al., 2017; Wang and Shen., 2020). The average elevation of the Gongga Mountain to the west side of the Xianshuihe fault is around 6,000 m, whereas the average elevation of its surrounding area to the east of the fault is only about 4,500 m (Hao et al., 2014; Jiang, 2019). The Gongga Mountain belongs to the frontal uplift part of the Tibetan Plateau, and has the largest vertical uplift rate within the southeastern margin of the Tibetan Plateau (Hao et al., 2014).
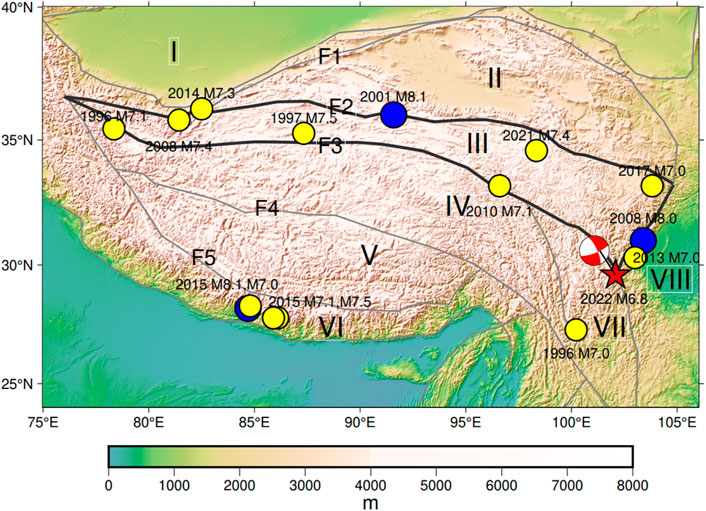
FIGURE 1. Topography and block boundaries of the Tibetan Plateau. The red star indicates the epicenter of the Ms 6.8 Luding earthquake; the beach ball shows the focal mechanism (https://www.cea-igp.ac.cn/kydt/279423.html). Yellow and blue circles indicate M7.0–7.9 and M8.0+ earthquakes around the Bayan Har block since 1996. The grey lines represent the active block boundary. Ⅰ: Tarim-North China Craton; Ⅱ: Qaidam Block; Ⅲ: Bayan Har Block; Ⅳ: Qiangtang Block; Ⅴ: Lhasa Block; Ⅵ: Himalayan Block; Ⅶ: Sichuan-Yunnan Block; Ⅷ: South China Block. F1: Western Kunlun-Qilian Mountains Galedonian Suture Zone; F2: Kunlun Mountains Varissian Suture Zone; F3: Jinsha River Indosinian Suture Zone; F4: Bangong Lake - Nujiang Yanshan suture zone; F5: Yarlung Tsangpo Himalayan Suture Zone.
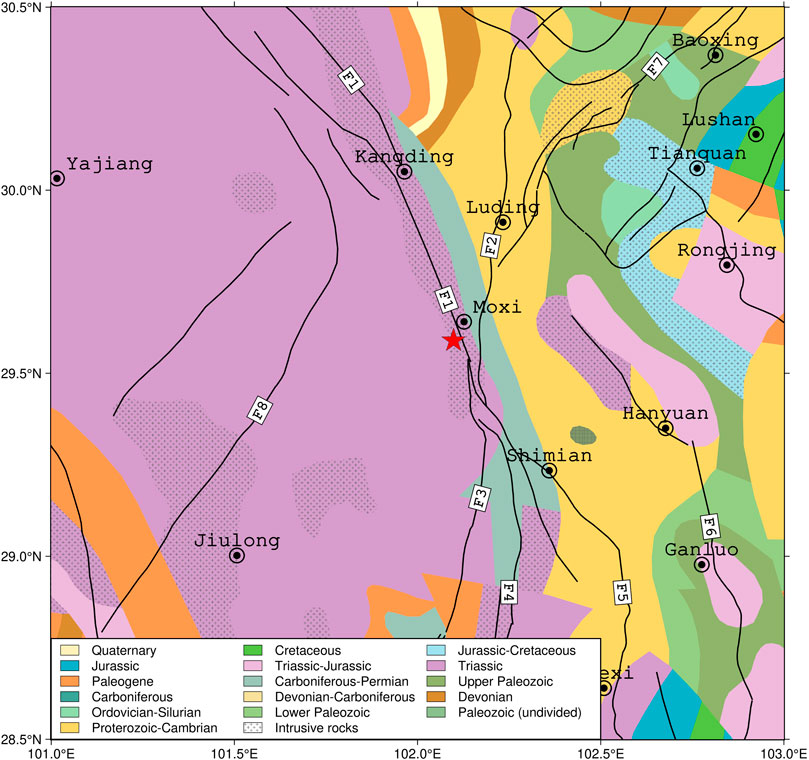
FIGURE 2. The Luding Ms 6.8 seismic area in tectonic background. Geological age and lithological distribution data from Steinshouer et al. (1999). The red star indicates the epicenter of the MS 6.8 Luding earthquake. F1:Xianshuihe Fault; F2: Daduhe Fault; F3:Xiaojinhe Fault; F4: Anninghe Fault; F5: Daliangshan Fault; F6: Hanyuan-ganluo fault; F7: Longmenshan Fault; F8: Yunongxi-yanshuitang Fault.
The focal area of the MS 6.8 Luding earthquake has large terrain undulation, high fault slip rate and vertical uplift rate, which reflect the active tectonic movement of the crust and the complexity of underground media. The fine three-dimensional velocity structure of the focal area and the high-precision aftershock sequence relocation results are essential for revealing the spatial geometry of the seismogenic fault, and for understanding the relationship between the major earthquake and the properties of the deep material medium. In this study, we collect continuous waveform data recorded by permanent and mobile stations near the focal area, use the machine learning method for automatic earthquake detection and phase picking, and adopt the double-difference tomography method to obtain the three-dimensional velocity structure of the focal area. By comparing the results with those from manual catalog, we exhibit the advantage and promise of the AI method.
2 Data and method
2.1 Data
After the MS 6.8 Luding earthquake, we collected the latest continuous waveform data from 61 seismic stations from the mainshock to 2 October 2022. Almost 1 month of data is sufficient because the data from a few or 10 days after a major earthquake can characterize the spatial pattern of the aftershock sequence well (Fang et al., 2013; Wang et al., 2014; 2021). The stations are distributed surrouding the mainshock and cover the earthquake sequence well, including 48 permanent stations of the Sichuan seismic network and 13 mobile stations deployed after the earthquake (Figure 3A). We adopt the LOC-FLOW program package (Zhang et al., 2019; 2022) for phase picking and association. During the phase association, the search area is centered at the station recording the earliest P phase, which is 22 km in horizontal direction and 20 km in depth with a search grid of 2.2 km and 2 km, respectively. The criteria for phase picking and association are as follows: 1) both P- and S-wave phases are recorded by at least four stations; 2) the phase identification probability for the P- and S-wave is greater than 0.3. By phase association, we obtain a total of 13,496 events. In addition, we also collate the phase report data recorded by permanent stations from 2014 to the mainshock, and select 2,341 preshocks with at least 12 phases and both P- and S-wave phases recorded by at least four stations. As a result, we obtain a total of 15,837 events (Figure 3A), including 154,054 P-wave phases and 153,363 S-wave phases (Figure 3B).
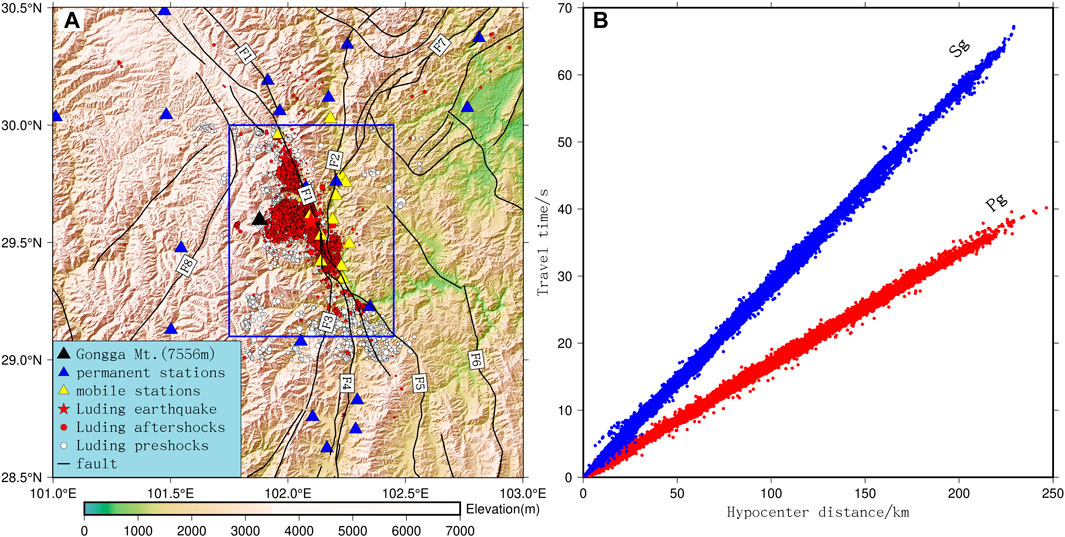
FIGURE 3. (A) Distribution of seismic stations and epicenters; (B) Travel time versus hypocenter distance for the Pg and Sg wave. The blue box is the study area.
2.2 Method
The double-difference tomography method (Zhang and Thurber, 2003) is developed based on the double-difference earthquake location method (Waldhauser and Ellsworth, 2000), from which we can obtain high-accuracy velocity structure model and earthquake relocation results simultaneously. Due to the consideration of the non-uniform variation in velocity, the method overcomes the assumption of a constant velocity of the earthquake pair to the station in the double-difference location method. Thus it can get more accurate location results. Both absolute and relative arrival time data can be used in the inversion. Usually, a larger weight is given to the absolute arrival time data for inversion iterations to obtain the velocity structure of the whole study area, and then the weight of the relative arrival time data is increased for subsequent iterations to obtain a more detailed velocity structure of the focal area. Many researchers have applied the method to different regions and obtained higher-resolution three-dimensional velocity models and high-precision earthquake sequence (e.g. Allam and Ben-Zion, 2012; Wang et al., 2018; 2021; Sun et al., 2021).
According to the distribution of the events and stations, the horizontal grid nodes in the study area near the Luding earthquake are set to be equally spaced by 0.1°×0.1°. In contrast, unequally spaced grid divisions are used in the boundary area with vertical grid nodes of −5, 0, 3, 6, 12, 20, 30, and 80 km. In this study, we refer to the result of the Deep Seismic Sounding profile (Wang et al., 2007) and the result from the H-κ scanning of the receiver function method (Wang et al., 2017), to establish a one-dimensional initial velocity model, as shown in Table 1. Considering the large terrain undulation in the study area, we set the 0 km depth of regional model as the average elevation of the stations, which is more convenient for describing the event depth and model depth in the subsequent sections. Before inversion, we test the smoothing factor and damping factor, and finally choose a smoothing factor of 30 and a damping factor of 700 by evaluating the L-curves to ensure the stability and reliability of the inversion results.
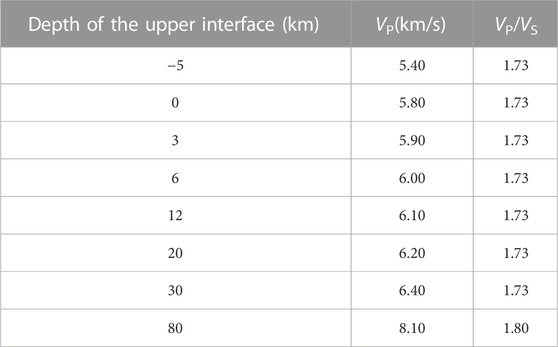
TABLE 1. The initial velocity model for phase picking and association in this study.
To check the resolution of the inversion results, we use the perturbation model and the theoretical arrival time data for the checkerboard test (Figure 4). Firstly, a checkerboard model (Supplementary Figure S1) is established by adding ±5% velocity perturbation to the initial velocity model alternately. Then the checkerboard model recovery is used to evaluate the reliability of the inversion results. According to the checkerboard results of the VP and VS models (Figure 4), the horizontal slices of 3 km, 6 km, and 12 km have an overall good resolution. The checkerboard test results have good resolution along the Xianshuihe fault at different depths, mainly due to the fact that the MS 6.8 Luding earthquake sequence occurs near the Xianshuihe fault, which has better ray coverage and stronger resolution in the study region. It has higher resolution at 6 km depth overall and lower resolution at 3 km and 12 km depth in the marginal area where there are fewer earthquakes.
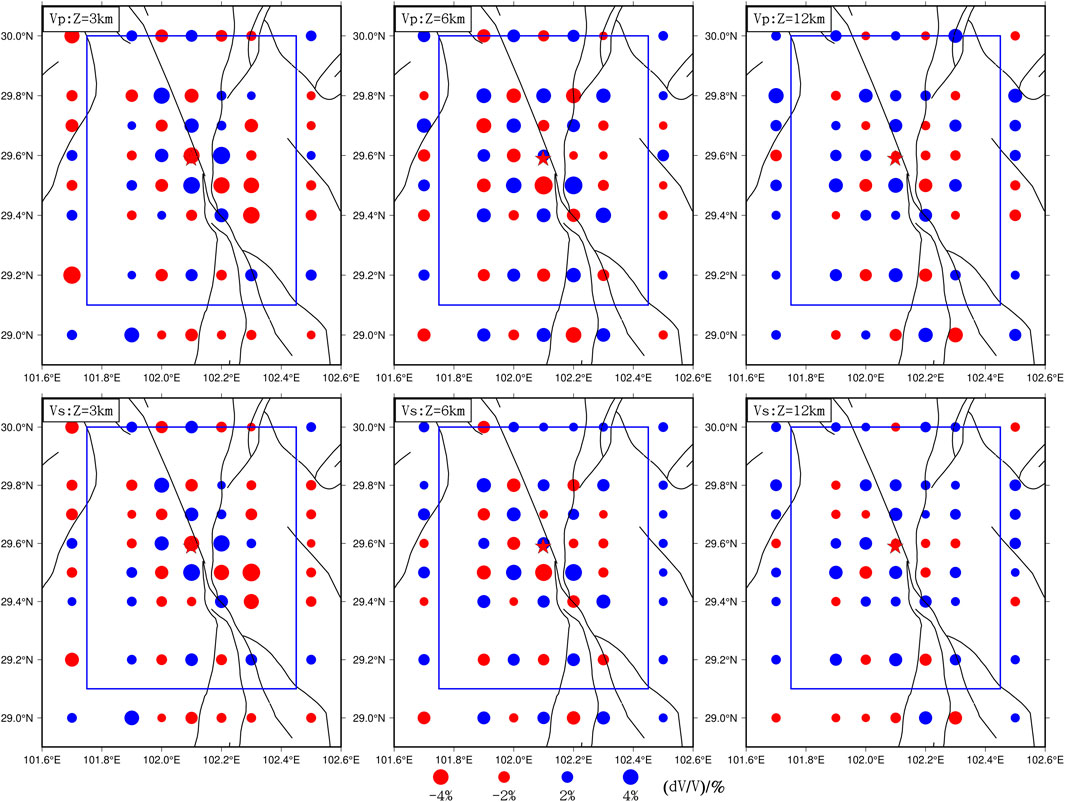
FIGURE 4. Checkerboard test results for the P- and S-wave at different depth slices. Black lines indicate the faults. The blue box is the study area.
3 Results
Based on the double-difference tomography, we obtained high-resolution three-dimensional P- and S-wave velocity models for the focal area of the MS 6.8 Luding earthquake and relocation results for 15,612 events, including 13,272 aftershocks and 2,340 preshocks (Figures 5–7).
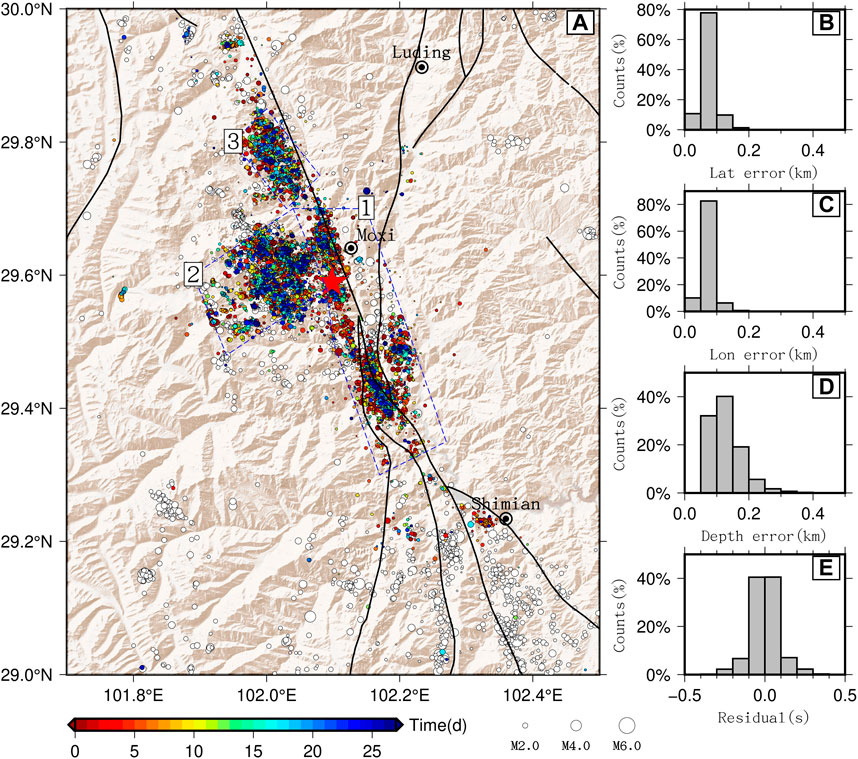
FIGURE 5. Relocated epicenters and error statistics in the study region. (A) Epicenter distribution; (B) errors along latitude; (C) errors along longitude; (D) errors along depth; (E) travel time residuals. The red star indicates the mainshock. White circles show the preshocks. Colored circles indicate the aftershocks, and the colors indicate the time from the mainshock. The blue dotted quadrilaterals outline the three seismic zones. Black lines indicate the faults.
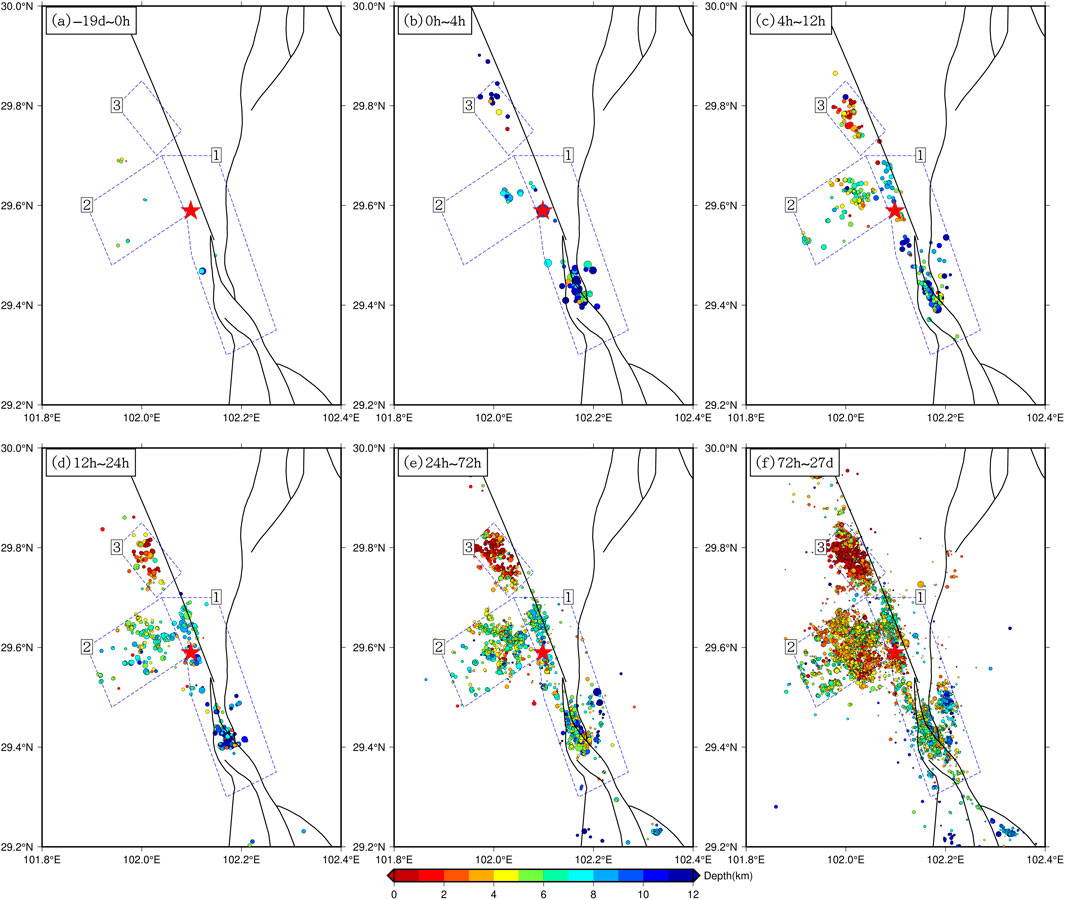
FIGURE 6. Spatiotemporal evolution of the relocated Ms 6.8 Luding earthquake sequence from −19 days to 27 days relative to the date 5 September 2022.
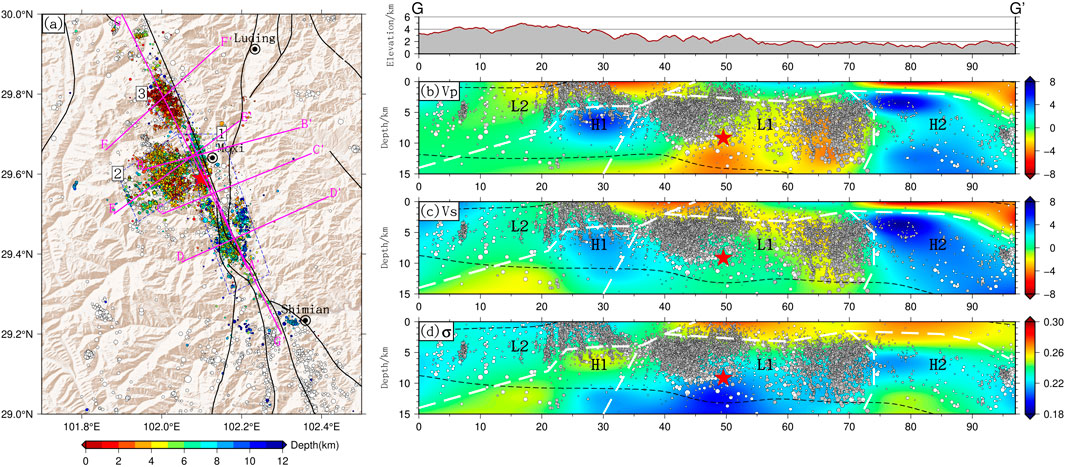
FIGURE 7. (A) Locations of the epicanters and the profiles AA’-GG’. (B) The focal depth distribution of the events located within 10 km from the northwest profile GG’, as well as the P-wave velocity, S-wave velocity and the Poisson’s ratio. H1: high velocity and high Poisson’s ratio regions, H2: high velocity and low Poisson’s ratio regions; L1 and L2: low velocity and low Poisson’s ratio regions, which are outlined by white dotted lines. The black dotted lines indicate the area where the checkerboard test recovery is 0.65.
3.1 Relocation results for the MS 6.8 Luding earthquake sequence
Figure 5 shows the relocation results and the error distribution. Most earthquakes have residuals less than 0.1 km in horizontal direction, less than 0.2 km in vertical direction, and less than 0.1 s for the travel time, indicating a highly accurate relocation results. The mainshock is located at (29.59°N, 102.09°E), and the focal depth is 9.2 km (Figures 5, 6). From Figure 5, the MS 6.8 Luding earthquake sequence is mainly NW-directed, and there are several obvious seismic clusters. The mainshock is located on a seismic strip of 35-km long and NNW-directed, which is coincident with the Moxi section of the Xianshuihe fault. Except for this seismic strip, there are two seismic clusters to the west and northwest of the seismic strip, which are SW- and NW- directed, respectively. In order to simplify the subsequent statement, we label the seismic strip and the two seismic clusters as A1, A2, and A3. There is a seismic gap between A3 and A1- A2. The seismic gap is an approximately circular area with a 5 km radius, and almost no earthquake occurred at 0–15 km depth. The focal mechanism result by the CAP method (https://www.cea-igp.ac.cn/kydt/279423.html) shows that it is a strike-slip earthquake and the centroid depth is about 7 km. Nodal plane I: strike 74°/dip 66°/slip angle −179° and Nodal plane II: strike 343°/dip 89°/slip angle −24°. Combined with the fact that this earthquake sequence is mainly NW-directed, nodal plane II is speculated to be the seismogenic fault. Luding earthquake is a unilateral rupture, and the main rupture area coincides with the seismic strip of A1, indicating that the energy of the mainshock may be released mainly in this strip.
Figure 6 shows the spatial-temporal evolution of the MS 6.8 Luding earthquake sequence. Within 19 days before the mainshock (Figure 6A), there are only a few earthquakes scattered in the study region and no significant foreshocks near the mainshock. Within 4 h from the mainshock (Figure 6B), there are a small amount of aftershocks, which are mainly distributed at the southeastern end of A1, and almost no earthquake occurred at the northern end of A1. The seismic strip A1 corresponding to the mainshock had not formed by that time, which is significantly different from the 2010 MS 7.0 Yushu earthquake sequence (Wang et al., 2012) and the 2021 MS 7.4 Maduo earthquake sequence (Wang et al., 2021), which are also strike-slip earthquakes in the Tibetan Plateau.
Within 4–12 h from the mainshock (Figure 6C), aftershocks increase significantly in succession in all the three areas. The seismic strip A1 starts to appear, and the seismic density in the middle part is significantly lower than that in the southern and northern ends. During the following three time periods (12–24 h, 24–72 h, and 72 h–27 days), the overall seismic strip in A1 does not change much, but a bifurcated seismic cluster gradually forms on the east side of the southeastern end. The strike of the seismic cluster in A2 is nearly perpendicular to the Xianshuihe fault. It shows outward dispersion characteristics, and the seismic density decreases with the increasing distance from the mainshock. The seismic cluster in A3 gradually forms NW-directed dominant distribution.
Figure 7A shows the epicenters of the MS 6.8 Luding earthquake sequence and seven profiles (AA’–GG’). Figure 7B shows the focal depth distribution for the events located within 10 km from the northwest-striking profile GG’, as well as the P-wave velocity, S-wave velocity and the Poisson’s ratio. We can see that the earthquakes are mainly distributed in the depth range of 0–15 km, and the earthquakes gradually deepen from northwest to southeast. In A3 in the northwest, the earthquakes are mainly at 0–6 km depth. The earthquakes in A2 and in the western A1 are mainly at 3–10 km depth. Earthquakes in the eastern A1 are mainly at 5–15 km depth. Deep seismic sounding profiles show that there is an extensive low-velocity detachment layer at 15–20 km deep in the crust of the eastern Tibetan plateau (Wang et al., 2007), and regional surface-wave and body-wave travel time tomography study also reveals the widespread occurrence of low-velocity layer in the middle and lower crust in the region (Zhang et al., 2020; Liu et al., 2021). It indicates that the middle and lower crust of the eastern Tibetan Plateau has low mechanical strength, where plastic deformation is dominant and not prone to earthquakes. The upper crust in this area is mainly in the range of 0–20 km, and consists of a cover layer of 15 km thick with VP of 6.05–6.15 km/s and a detachment layer of 5 km with VP of 5.85–5.95 km/s (Wang et al., 2007). The relocation result shows that most of the aftershocks are distributed in the depth range of 0–15 km, indicating that the earthquake mainly ruptured the cover of the upper crust.
3.2 Three-dimensional body wave velocity structure
Figure 8 shows the horizontal slices of P-wave and S-wave velocity at 3 km, 6 km, and 12 km depth, where the average P-wave velocities of the horizontal slices are 5.91 km/s, 5.98 km/s, and 5.99 km/s, respectively, and the average S-wave velocities of the horizontal slices are 3.44 km/s, 3.50 km/s and 3.52 km/s, respectively. The seismic events at depths of 0–4.5 km, 4.5–9 km, and 9–15 km are projected to the horizontal slices mentioned above. According to previous results (Wu et al., 2018; Li et al., 2022), the nodes with the checkerboard recovery higher than 0.65 can be considered as reliabe area. Based on the criterion, from the slice at 6 km depth with the best recovery, we can see that the body wave velocities between the two sides of the Xianshuihe fault are significantly different, where higher velocities are found on the east side and lower velocities are found on the west side, which is consistent with the joint inversion results of body and surface wave data by Liu et al. (https://github.com/liuyingustc/SWChinaCVM-V2.0). Xiao (2022) studied the velocity structure of the Longmenshan fault and the Anninghe fault and the surrounding areas, using the data of regional permanent seismic network and the double-difference tomography method. The results show that in the intersection of the Longmenshan fault, the Anninghe fault, and the Xianshuihe fault on the eastern edge of the Tibetan Plateau, high P- and S-wave velocities are found and the highest velocity of 6.3 km/s is found at 5 km depth. Although the resolution of the result is 0.25°×0.25°, the velocity difference can be found at 5–25 km depth on both sides of the southeastern section of the Xianshuihe fault. The results of deep seismic sounding profile in the east-west direction (Wang et al., 2007) also show that there is a low velocity detachment layer at 15–20 km depth on the west side of the Xianshuihe fault, which is not found on the east side of the Longmenshan fault zone.
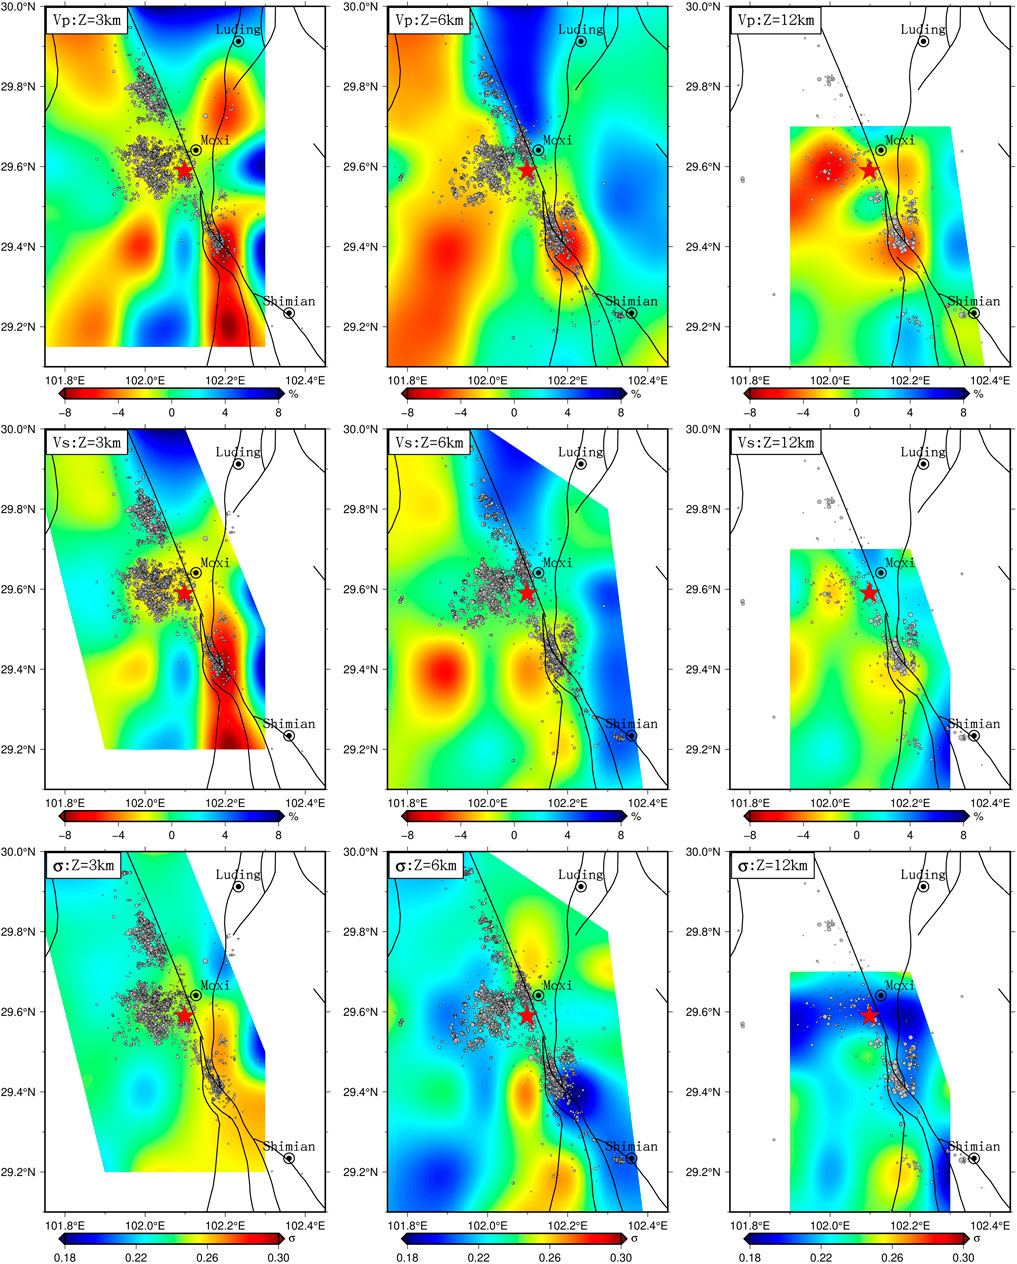
FIGURE 8. The VP, VS, and Poisson’s ratio for horizontal slices at 3 km, 6 km, and 12 km depth. Black lines indicate the faults.
The velocity and Poisson’s ratio are important parameters for understanding the material properties and state of the underground medium. In order to understand the relationship between the earthquake sequence and the velocity structure characteristics systematically, we obtain the regional Poisson’s ratio distribution from the P- and S-wave velocity. Due to the difference in the quantity and quality of P- and S-wave data, there may be errors to obtain the wave velocity ratio by directly dividing the P-wave velocity by the S-wave velocity (Allam and Ben-Zion, 2012; Hu et al., 2021; Sun et al., 2021). Tian et al. (2007) suggests that the reliability of Poisson’s ratio can be evaluated based on the resolution of P- and S-wave. Therefore, we use the region with better checkerboard recovery of both VP and VS to calculate the Poisson’s ratio. Usually, the P-wave velocity has better checkerboard recovery than the S-wave velocity, and thus we analyse the Poisson’s ratio structure in the region with reliable quality of Vs.
Figure 8 shows that the Poisson’s ratios are generally low in the study area. Zhang et al. (2014) use the receiver function method and obtain the wave velocity ratio of 1.738 (σ=0.253) in the Chinese continental crust, which is lower than the global continental average wave velocity ratio of 1.78 (σ=0.269). They speculate that the Chinese continental crust is rich in felsic or low in Fe-Mg material. Their results show that the Poisson’s ratios are generally lower than 0.25 at the intersection of the Bayanhar block, the Sichuan-Yunnan block, and the South China block, which is consistent with the low Poisson’s ratios in this study. The results of horizontal slices (Figure 8) show that both the velocity structure and the Poisson’s ratio are different on both sides of the Xianshuihe fault zone, indicating that there are different material properties on the two sides of the Xianshuihe fault.
In order to display the wave velocities, the Poisson’s ratios, and the vertical distribution characteristics of the events more clearly, we select a total of six profiles for the three seismic zones, including four profiles in A1, one profile in A2 and one profile in A3 (Figure 7A). Among them, profile AA’ is distributed along the Xianshuihe fault and the other five profiles are approximately perpendicular to the Xianshuihe fault. For each profile (Figure 9), the earthquakes within 5 km from the profile are projected to it. The profile AA’ is along the main rupture area A1 and through the mainshock. The mainshock is located at the bottom of the Luding earthquake sequence and at the upper edge of weak S-wave low-velocity zone, significant P-wave low-velocity zone and low Poisson’s ratio zone. Moreover, most of the earthquakes in A1 also occur in the weak low velocity and low Poisson’s ratio zone. Earthquakes along the five profiles BB'- FF’ that are perpendicular to the Xianshuihe fault have similar distribution characteristics. The wave velocity and Poisson’s ratio are low to the southwest of the southeast section of the Xianshuihe fault, whereas high velocity and low Poisson’s ratio are found to the northeast. The five profiles show the structural differences between the two sides of the southeastern Xianshuihe fault more significantly. The earthquakes are distributed in an approximately upright pattern along the five profiles, and mainly located in low velocity and low Poisson’s ratio zone.
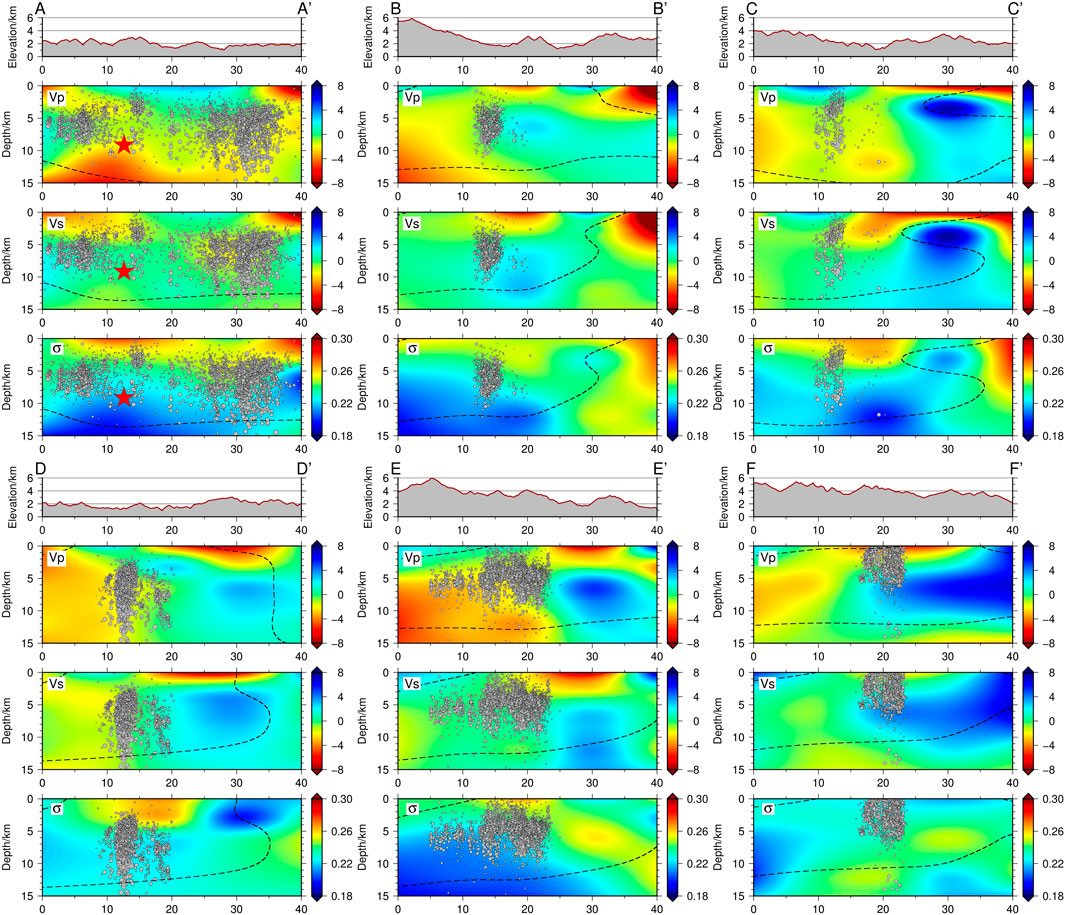
FIGURE 9. The VP, VS, Poisson’s ratio and the events along profile AA’, BB’, CC’, DD’, EE’, and FF’. The profiles are shown in Figure 7A. The black dotted lines indicate the area where the checkerboard test recovery is 0.65.
From the results of the horizontal slices and vertical profiles, it can be seen that the Luding earthquake sequence is mainly distributed in low velocity and low Poisson’s ratio zone, and fewer earthquakes occur in high velocity and high Poisson’s ratio zone. In order to simplify the subsequent discussion, we divide the profile GG’ with white dashed lines (Figure 7B), where H1 is high velocity and high Poisson’s ratio region, H2 is high velocity and low Poisson’s ratio zone, and both L1 and L2 are low velocity and low Poisson’s ratio zones.
3.3 Comparison with manual catalog
Traditionally, the seismic phase data from manual catalog are accurate and widely used in the study of seismic tomography (Huang and Zhao, 2004; Tian et al., 2007; Allam and Ben-Zion, 2012; Wang et al., 2018; 2021; Sun et al., 2021). In recent years, seismic phase data from machine learning has been applied to the double-difference tomography (e.g., Feng et al., 2022). After the Luding earthquake, there are high-quality seismic phase data from manual catalog by the Sichuan Earthquake Agency from permanent and mobile seismic stations, which provides a chance for checking the reliability of velocity structure tomography based on the AI catalog.
In this study, we collect the 5,163 earthquakes of manual catalog in the same period after the mainshock, among which 4,631 aftershocks are recorded by at least four stations with both P- and S-wave phases. With the same preshocks from manual catalog, a total of 6,972 events are finally collected, which are studied by double-difference tomography under the same parameters. Figures 10, 11, show the results of the checkerboard, the velocity structure and the earthquake distribution in horizontal slices at 6 km depth and vertical profiles along GG’ from the manual catalog.
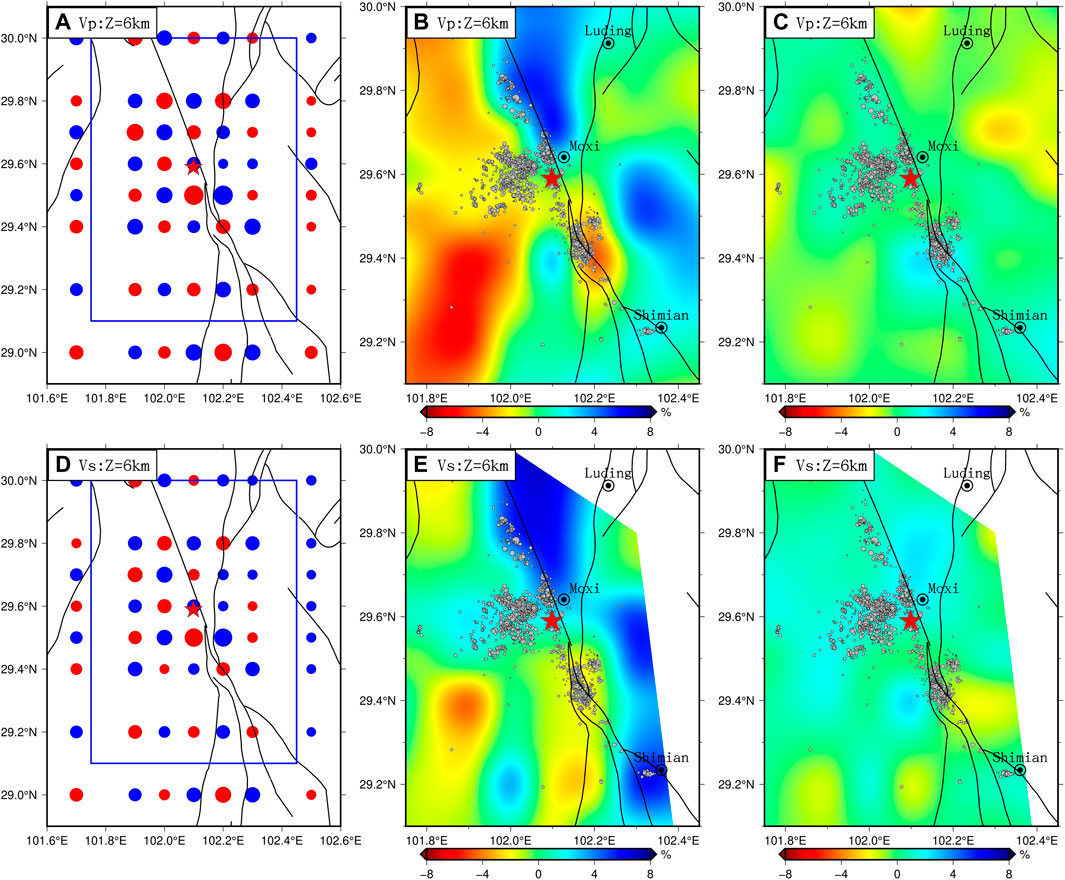
FIGURE 10. Horizontal slices at 6 km from manual catalog. (A) VP checkerboard test; (B) VP velocity; (C) VP velocity difference between tomography models produced from the manual catalog and AI catalogs; (D) VS checkerboard test; (E) VS velocity; (F) VS velocity difference between tomography models produced from the manual catalog and AI catalogs. Black lines indicate the faults. The blue box is the study area.
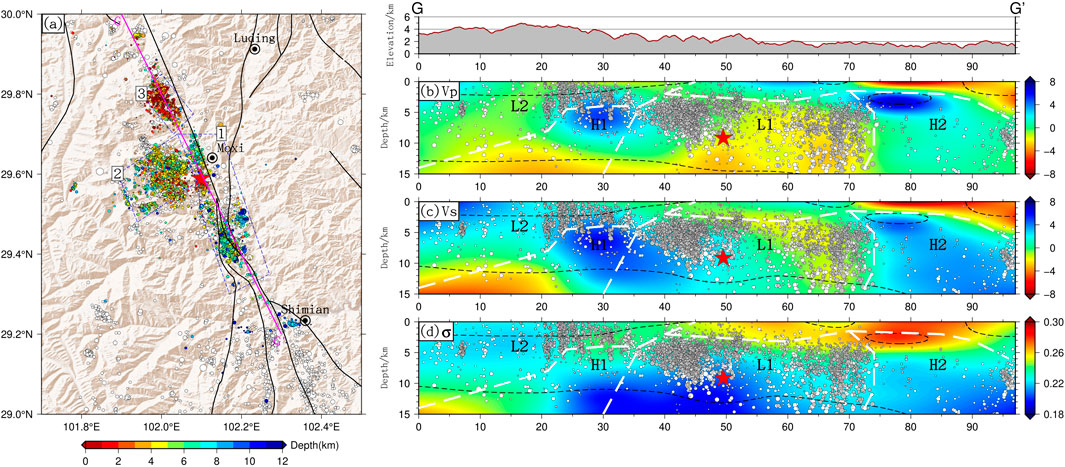
FIGURE 11. The focal depth distribution of relocated events for manual catalog along profile GG’, as well as the P-wave velocity, S-wave velocity and the Poisson’s ratio.
We compare the results based on two data sets in terms of both earthquake distribution and velocity structure. From Figures 7, 11, the aftershocks based on the two data sets have consistent distribution of seimic clusters and strip characteristics in horizontal direction, and the depth ranges for both of them change from 0–6 km in the northwest to 5–13 km in the southeast in the vertical direction. The spatial consistency indicates that the AI catalog is as reliable as the manual catalog. Moreover, the number of earthquakes from AI catalog is about three times as many as that from the manual catalog. The velocity structure along profile GG’ for L1 in the main rupture zone and for H2 to the southeast of the mainshock is consistent, whereas there are some differences for L2 and H1 to the northwest of the mainshock (Figures 7, 11). Combined with the checkerboard recovery, it can be seen that the L1 and H2 regions are overall very well, while the shallow part of L2 and the deep part of H1 are relatively poor. We speculate that the two data sets have limited resolution for anomalies to the northwest of the mainshock and result in differences in velocity structure. The results based on manual catalog show that the consistency between L2 and the low velocity and low Poisson’s ratio region as well as between H1 and high velocity and high Poisson’s ratio region is not well. In contrast, the results based on AI catalog have better resolution for L2 and H1. The seismic cluster to the northwest of the mainshock basically occurs within L2 of low velocity and low Poisson’s ratio, where there are granites which can be used to explain the distribution characteristics of the earthquake sequence more reasonably. Figure 10 shows the velocity structure based on the manual catalog data set at 6 km depth and the difference between the velocity structure based on the two data sets. The equations for calculating velocity structure difference:
4 Discussion
4.1 The seismogenic fault of the MS 6.8 Luding earthquake
The Sichuan-Yunnan block and the Bayanhar block undergo different degrees of deformation under the extrusion of the Indian plate (Wang et al., 2003). The former rotates and extrudes to the southeast, and the latter moves south-eastward at a relatively low rate due to the blockage by the Sichuan Basin. The difference in motion of the two blocks leads to the Xianshuihe fault with left-lateral strike-slip and extrusion characteristics. The southeast section of the Xianshuihe fault zone is also intersected with several faults, including the Longmenshan and the Anninghe-Zemuhe-Xiaojiang fault zones, and there are significant differences in the activity of each fault. The Xianshuihe fault has the largest slip rate and relatively active seismicity, and the surrounding faults have smaller slip rates. According to the GPS measurements (Shen et al., 2005; Zhang, 2013; Zheng et al., 2017; Wang and Shen., 2020), the right-lateral strike-slip rate of the Longmenshan fault zone is less than 1 mm/a; the left-lateral strike-slip rate of the Anninghe-Zemuhe-Xiaojiang fault zone is 7∼11 mm/a; the left-lateral strike-slip rate of the Xiaojinhe fault zone is less than 1 mm/a; whereas the left-lateral strike-slip rate of the Xianshuihe fault zone is basically in the range of 8–12 mm/a. The Daliangshan fault, the Anninghe fault, and the Xiaojinhe fault overlap and intersect at the southeast end of the Luding earthquake sequence, which is far from the mainshock. Similarly, the southwest end of the Longmenshan fault is far from the mainshock and does not overlap with the aftershock, while the Daduhe fault has only a small overlap with the aftershock sequence. The above faults were not involved in the occurrence of this Luding earthquake. However, in history, a series of major earthquakes have occurred along the Xinshuihe fault, and these major events have typical characteristics of migration, repetition, and segmentation (Wen, 2000; Xu et al., 2005; Wen et al., 2008; Chen et al., 2013). The MS 6.8 Luding earthquake occurs near the Moxi section of the fault zone. The focal mechanism (https://www.cea-igp.ac.cn/kydt/279423.html) is strike-slip, which is consistent with many strike-slip earthquakes along the Xianshuihe fault zone (Papadimitriou et al., 2004; Wen et al., 2008; Xu et al., 2013; Zhao et al., 2018), suggesting that the Xianshuihe fault largely controls the earthquake.
The Xianshuihe fault is not a single coherent fault. Instead, it is composed of many sub-faults in an oblique pattern and the fault structure is complex. He et al. (2017) concluded from the geomagnetic results that the Xianshuihe fault zone is composed of a group of faults; some faults are deep and large with steep dips cutting through the crust and some faults have gentle dips. Therefore, we show the distribution characteristics of relocated earthquakes and faults in the horizontal plane and three-dimensional space (Figure 12; Supplementary Figures S2, S3). High-precision earthquake location results show that the Luding earthquake sequence is distributed within the main rupture zone in a stripe roughly parallel to the Moxi section of the Xianshuihe fault. Furthermore, it is approximately upright in the vertical direction, which is consistent with the steeply upright fault plane characteristic of the Xianshuihe fault from the northwest to the southeast (Xu et al., 2013; Zhao et al., 2018). The focal mechanism also shows that the Luding earthquake is a left-lateral strike-slip earthquake with a high dip angle. In addition, the Xianshuihe fault is one of the most active faults and has the largest slip rate near the mainshock (Shen et al., 2005; Zhang, 2013; Zheng et al., 2017; Zhao et al., 2018; Wang and Shen., 2020; Bai et al., 2021; Li et al., 2022), indicating that the Xianshuihe fault controlled the occurrence of the Luding earthquake. According to the distribution of earthquake sequence in spatial pattern, the geometry and location of the seismogenic fault can be outlined (Fang et al., 2013; Wang et al., 2014; 2021; Hu et al., 2021; Li et al., 2021; Sun et al., 2021). In the main rupture area, the seismic strip to the southeast the mainshock has a high spatial overlap with the Moxi section of the Xianshuihe fault in both horizontal and vertical directions. Therefore, we speculate that the Moxi section of the Xianshuihe fault is the seismogenic fault of the Luding earthquake (Figure 12). In contrast, the other earthquake clusters (Figure 12) are distributed to one side of the mainshock and the overall distribution dispersed outward, which are more likely to be induced by the mainshock. In addition, for the earthquake cluster bending toward the Daduhe fault at the southeastern end of the aftershock sequence within A1, the Daduhe fault may have some contribution to the earthquakes in the southern part of the aftershock sequence.
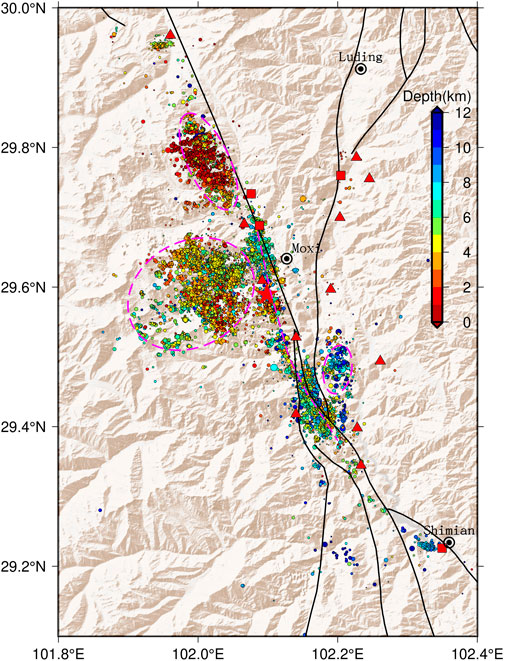
FIGURE 12. The seismogenic fault for the Ms 6.8 Luding earthquake. The pink dotted line indicates the main rupture of the Luding earthquake, and the pink circles show the main earthquake clusters. Black lines indicate the faults.
4.2 Seismogenic structure and mechanism
Weak materials of low velocity, high Poisson’s ratio and high conductivity are common in the crustal scale in the eastern margin of the Tibetan Plateau, which basically appear at 20 km depth (Clark et al., 2005; Wang et al., 2007; Wang et al., 2008; Bai et al., 2010; Chen et al., 2014; Liu et al., 2014; Qiao et al., 2018). However, the weak layer existing in the middle and lower crust changes near the southeastern section of the Xianshuihe fault. The S-wave velocity in the middle and lower crust on the southwestern side of the Xianshuihe fault is significantly lower than that on the eastern side (Chen et al., 2014; Liu et al., 2014), and it is easier for the southwestern side of the Xianshuihe fault to accumulate stress. The fluid or molten material in the middle and lower crust can lead to the weakening and stress concentration of the seismogenic fault above it, which can cause the occurrence of a major earthquake (Tian et al., 2007; Hu et al., 2021; Li et al., 2021), and the widely existing weak layer in the middle and lower crust in the southwestern part of the Xianshuhe fault may have a certain contribution to the Luding earthquake.
The occurrence of a major earthquake requires the condition for both the stress accumulation and stress release. Previous results (Huang and Zhao, 2004; Tian et al., 2007; Li et al., 2015; 2021; Wang et al., 2018; Hu et al., 2021) indicate that major earthquakes mostly occur at the boundary of high velocity zone or at the transition zone between high and low velocity zone, where it is easy to accumulate stress and bear major earthquakes and also easy to release stress to cause major earthquakes. The Luding earthquake sequence basically occurs in the low Poisson’s ratio and low velocity zone, which is different from previous understanding. The results of Li et al. (2015) show that such low velocity material distributed along the Xianshuihe fault on the west side also has a low density and low magnetic properties. Low Poisson’s ratio (σ < 0.26) indicates that felsic material dominates and middle Poisson’s ratio (0.26 < σ < 0.28) indicates mixed minerals dominate (Zandt and Ammon, 1995). The Xianshuihe fault is a boundary zone between the Sichuan-Yunnan and Bayanhar block. Li et al. (2016) proposes that under the collision of the blocks, melting of deep materials below the fault can be caused under the shear-generated heat in the boundary zone, which will generate materials such as metamorphic rocks, mixed rocks, and granites along the fault. In fact, research has shown that there are granites along the south-east section of the Xianshuihe fault zone and it is distributed in a striped pattern (Zhang et al., 2004; Li and Zhang, 2013; Zhang et al., 2017; Cook et al., 2018). He et al. (2017) combined the existing results and geomagnetic results and suggests that the granites are generated by the remelting of upper crustal materials under the force of the Xianshuihe fault. The mixed rocks to the east of the granites with strong left-lateral strike-slip deformation also indicates that the granite belongs to the product of the Xianshuihe fault (Li and Zhang, 2013; Li et al., 2016). The granites are also rich in quartz and other materials, which have characteristics such as high resistance, low magnetic, low density, and low gravity anomaly (Li et al., 2015; He et al., 2017), and it exhibits low velocity and low Poisson’s ratio in this study. According to the relocation results, the Luding earthquake sequence basically occur in the granite.
Major earthquakes are often closely related to the existence of barriers or asperities on the fault surface, where the barriers can halt or even terminate the rupture of earthquakes (Aki, 1979). Klinger et al. (2006) analysed the Kokoxili earthquake from high-resolution satellite image data and concluded that the rupture was constrained by the geometric barrier. Yue et al. (2017) discussed the rupture pattern of the Kumamoto earthquake in terms of stress accumulation and release for both stress barriers and material barriers, ultimately concluding that material barriers were the primary mechanism for rupture termination. The three-dimensional velocity structure model shows two regions of high velocity and low Poisson’s ratios (H1 and H2) on the two sides of the mainshock along the Xianshuihe fault. After a major earthquake, stress releases along the easily ruptured area. The high-velocity zone on one side of the major earthquake has a blocking effect on the earthquake rupture, leading to a unilateral rupture to the other side (Hu et al., 2021; Sun et al., 2021). The Luding earthquake is also a unilateral rupture in the granite along the Xianshuihe fault toward the southeast. The rupture scale of the Luding earthquake is within the L1 region that precedes H1 and H2, so we prefer to think that the existence of H1 and H2 as stress barriers blocked the earthquake rupture.
According to the shape of the earthquake sequence and the deep velocity structural features obtained in this study, the mainshock is located in the middle of the aftershock zone inside the granite. The high velocity body (H1) existing to the northwest of the mainshock may have blocked the rupture towards northwest, leading to a seismic gap in the area around the high velocity zone. In the northwest, the earthquake cluster basically occurs in the upper part of the high velocity zone in a dispersion pattern, which may be because the granite with low velocity, low Poisson’s ratio and low density in the upper part is more likely to rupture and release stress than the high velocity zone. Hence, the earthquakes mainly occur in the upper part of this high velocity zone. The earthquake cluster to the west of the mainshock also has a similar dispersion pattern. Therefore, the earthquake clusters to the west and northwest of the mainshock are probably caused by the granite rupture induced by the mainshock. After the mainshock, the rupture occurs in the relatively homogeneous granite L1 along the southeast direction of the Xianshuihe fault, where the granite is relatively deep and easy to release stress, so the dominant depth of the seismic strip within the main rupture zone increase. There is a significant high velocity zone (H2) to the southeast and about 25 km from the mainshock, which has a strong mechanical property that may block the rupture of the Luding earthquake along the Xianshuihe fault toward the southeast. To sum up, the Luding earthquake occurs in the granite with low velocity and low Poisson’s ratio, and the high velocity zones (H1 and H2) on two sides of the mainshock may control the rupture scale of the earthquake.
Based on the fault spatial sliding rate and stress distribution characteristics, the Moxi section of the Xianshuihe fault zone has the risk of major earthquakes (Bai et al., 2021; Li et al., 2022). We think that based on seismotectonic features and high-resolution three-dimensional velocity structure models, it is also possible to better understand the mechanisms of major earthquakes and further assess the risk of future major earthquakes. The seismogenic fault of the Luding earthquake was the Moxi section of the Xianshuihe fault, and along the Xianshuihe fault, there were two other significant high velocity bodies, respectively H1 and H2, which have the conditions to breed strong earthquakes. Li et al. (2015) suggested that the material in the Shimian area of the south-eastern section of the Xianshuihe fault has features such as high velocity, high density and strong magnetism, which has strong mechanical properties to bear major earthquakes, and the risk of the possible major earthquakes in the area is relatively high in the future. Moreover, combining the migratory pattern of major earthquakes along the Xianshuihe fault zone, there is a high probability of future major earthquakes along the southeastern part of the Xianshuihe fault in the Shimian region.
5 Conclusion
In the study, we use the data of 61 seismic stations surrounding the focal area and obtain the Luding earthquake sequence based on AI catalog. In combination with the preshocks near the mainshock, we conduct event relocation and three-dimensional P- and S-wave velocity structure inversion by double-difference tomography. Compared the results with those from the manual catalog, the catalog has high accuracy and completeness, and the three-dimensional velocity structure model is reliable and exhibits the AI method’s advantage and promise. About the Luding earthquake, we obtain the following understanding.
1) The MS 6.8 Luding earthquake sequence is distributed along the southeast section of the Xianshuihe fault. The mainshock locates at 9.2 km depth. The dominant depth range of the earthquake sequence gradually changes from 0–6 km in the northwest to 5–15 km in the southeast. A seismic strip about 35 km long in the southeast direction is within the main rupture area. In addition, the seismic clusters to the west and northwest of the mainshock show dispersion distribution. To the northwest of the mainshock, there is a significant seismic gap between the seismic strip and the northwestern earthquake cluster.
2) In the southeast direction of the main rupture area of the Mainshock, the seismic strip is distributed horizontally along the Moxi section of the Xianshuihe fault. In the vertical direction, it is approximately upright and coincides with the steep and vertical characteristics of the Xianshuihe fault plane. Overall, it has a high spatial overlap with the Xianshuihe fault which is seismically active with high slip rate. We speculate that the Moxi section of the Xianshuihe fault is the seismogenic fault of the Luding earthquake.
3) The earthquake sequences are mainly located in the regions of low velocity and low Poisson’s ratio, which is consistent with the granite that is geologically distributed along the southeast section of the Xianshuihe fault. The two high velocity zones on both sides of the Xianshuihe fault may have controled the rupture scale of the Luding earthquake.
Data availability statement
The original contributions presented in the study are included in the article/Supplementary Material, further inquiries can be directed to the corresponding authors.
Author contributions
GC and WW contributed to design of the study. GC wrote the first draft of the manuscript. WW gave guidance on writing the paper. JS provide the datasets. JW and GL modified sections of the manuscript. All authors contributed to manuscript revision, read, and approved the submitted version.
Funding
This work is supported by the National Natural Science Foundation of China (Grant No. 41974058) and the Special Fund of the Institute of Geophysics, China Earthquake Administration (No. DQJB22Z01).
Acknowledgments
We thank Haijiang Zhang for providing the double-difference tomography program (tomoDD). We are also grateful to the two reviewers for their comments. The figures are plotted by GMT 6 (Wessel et al., 2019) and the python visualisation library plotly.
Conflict of interest
The authors declare that the research was conducted in the absence of any commercial or financial relationships that could be construed as a potential conflict of interest.
Publisher’s note
All claims expressed in this article are solely those of the authors and do not necessarily represent those of their affiliated organizations, or those of the publisher, the editors and the reviewers. Any product that may be evaluated in this article, or claim that may be made by its manufacturer, is not guaranteed or endorsed by the publisher.
Supplementary material
The Supplementary Material for this article can be found online at: https://www.frontiersin.org/articles/10.3389/feart.2023.1099744/full#supplementary-material
References
Aki, K. (1979). Characterization of barriers on an earthquake fault. J. Geophys. Res. 84 (B11), 6140. doi:10.1029/JB084iB11p06140
Allam, A. A., and Ben-Zion, Y. (2012). Seismic velocity structures in the southern California plate-boundary environment from double-difference tomography: Tomography of the San Jacinto fault area. Geophys. J. Int. 190 (2), 1181–1196. doi:10.1111/j.1365-246X.2012.05544.x
Bai, D., Unsworth, M. J., Meju, M. A., Ma, X., Teng, J., Kong, X., et al. (2010). Crustal deformation of the eastern Tibetan plateau revealed by magnetotelluric imaging. Nat. Geosci. 3 (5), 358–362. doi:10.1038/ngeo830
Bai, M., Chevalier, M.-L., Leloup, P. H., Li, H., Pan, J., Replumaz, A., et al. (2021). Spatial slip rate distribution along the SE Xianshuihe fault, eastern Tibet, and earthquake hazard assessment. Tectonics 40, e2021TC006985. doi:10.1029/2021TC006985
Chen, C., Ren, J., Meng, G., Yang, P., Xiong, R., Hu, C., et al. (2013). Division, deformation and tectonic implication of active blocks in the eastern segment of Bayan Har block. Chin. J. Geophys. 56 (12), 4125–4141. doi:10.6038/cjg20131217
Chen, M., Huang, H., Yao, H., van der Hilst, R., and Niu, F. (2014). Low wave speed zones in the crust beneath SE Tibet revealed by ambient noise adjoint tomography. Geophys. Res. Lett. 41 (2), 334–340. doi:10.1002/2013GL058476
Clark, M. K., Bush, J. W. M., and Royden, L. H. (2005). Dynamic topography produced by lower crustal flow against rheological strength heterogeneities bordering the Tibetan Plateau. Geophys. J. Int. 162 (2), 575–590. doi:10.1111/j.1365-246X.2005.02580.x
Cook, K. L., Hovius, N., Wittmann, H., Heimsath, A. M., and Lee, Y.-H. (2018). Causes of rapid uplift and exceptional topography of Gongga Shan on the eastern margin of the Tibetan Plateau. Earth Planet. Sci. Lett. 481, 328–337. doi:10.1016/j.epsl.2017.10.043
Fang, L., Wu, J., Wang, W., Lu, Z., Wang, C., Yang, T., et al. (2013). Relocation of mainshock and aftershock sequences of Ms7.0 Sichuan Lushan earthquake. Chin. Sci. Bull. 58 (20), 3451–3459. doi:10.1007/s11434-013-6000-2
Feng, T., Zhang, M., Xu, L., Wu, J., and Fang, L. (2022). Machine learning-based earthquake catalog and tomography characterize the middle-northern section of the Xiaojiang fault zone. Seismol. Res. Lett. 93 (5), 2484–2497. doi:10.1785/0220220116
Hao, M., Wang, Q., Shen, Z., Cui, D., Ji, L., Li, Y., et al. (2014). Present day crustal vertical movement inferred from precise leveling data in eastern margin of Tibetan Plateau. Tectonophysics 632, 281–292. doi:10.1016/j.tecto.2014.06.016
He, M., Fang, H., Wang, X., Lu, J., Yuan, Y., Bai, D., et al. (2017). Deep conductivity characteristics of the southern Xianshuihe fault zone. Chin. J. Geophys. 60 (6), 2414–2424. doi:10.6038/cjg20170630
Hu, J., Zhao, T., Bai, C., Guo, H., Wang, Y., Li, X., et al. (2021). Three-dimensional P and S wave velocity structure and earthquake relocation of the May 21, 2021 Yangbi MS6.4 source region. Chin. J. Geophys. 64 (12), 4488–4509. doi:10.6038/cjg2021P0456
Huang, J., and Zhao, D. (2004). Crustal heterogeneity and seismotectonics of the region around Beijing, China. Tectonophysics 385, 159–180. doi:10.1016/j.tecto.2004.04.024
Jiang, F. (2019). A 3D electrical structure of Gongga Mountain and its uplifting mechanism. Beijing, China: Institute of Geology, China Earthquake Administration. Ph.D. Thesis.
Klinger, Y., Michel, R., and King, G. C. P. (2006). Evidence for an earthquake barrier model from Mw∼ 7.8 Kokoxili (Tibet) earthquake slip-distribution. Earth Planet. Sci. Lett. 242 (3–4), 354–364. doi:10.1016/j.epsl.2005.12.003
Li, C., Tang, M., Guo, W., Wang, X., and Dong, L. (2022). A preliminary study on 3D velocity structure of Rongchang and its adjacent area. Seismol. Geol. 44 (1), 205–219. doi:10.3969/j.issn.0253-4967.2022.01.013
Li, D., Ding, Z., Wu, P., Liu, S., Deng, F., Zhang, X., et al. (2021). The characteristics of crustal structure and seismogenic background of Yangbi MS6.4 earthquake on May 21, 2021 in Yunnan Province, China. Chin. J. Geophys. 64 (9), 3083–3100. doi:10.6038/cjg2021P0405
Li, D., Ding, Z., Wu, P., Zheng, C., Ye, Q., and Liang, M. (2015). The deep seismogenic environment of the southeastern section of the Xianshuihe fault zone and the 2014 Kangding MS6.3 earthquake. Chin. J. Geophys. 58 (6), 1941–1953. doi:10.6038/cjg20150610
Li, H., Zhang, Y., Zhang, C., and Wang, J. (2016). Zircon U-Pb study of two-staged oligo-miocene migmatization along the Xianshuihe fault zone, east tibet plateau. Earth Sci. Front. 23 (2), 222–237. doi:10.13745/j.esf.2016.02.021
Li, H., and Zhang, Y. (2013). Zircon U–Pb geochronology of the Konggar granitoid and migmatite: Constraints on the Oligo-Miocene tectono-thermal evolution of the Xianshuihe fault zone, East Tibet. Tectonophysics 606, 127–139. doi:10.1016/j.tecto.2013.07.007
Li, X., Gao, K., Feng, Y., and Zhang, C. (2022). 3D geomechanical modeling of the Xianshuihe fault zone, SE Tibetan Plateau: Implications for seismic hazard assessment. Tectonophysics 839, 229546. doi:10.1016/j.tecto.2022.229546
Liu, Q., van der Hilst, R. D., Li, Y., Yao, H., Chen, J., Guo, B., et al. (2014). Eastward expansion of the Tibetan Plateau by crustal flow and strain partitioning across faults. Nat. Geosci. 7, 361–365. doi:10.1038/ngeo2130
Liu, Y., Yao, H., Zhang, H., and Fang, H. (2021). The community velocity model V.1.0 of southwest China, constructed from joint body- and surface-wave travel-time tomography. Seismol. Res. Lett. 92, 2972–2987. doi:10.1785/0220200318
Papadimitriou, E., Wen, X., Karakostas, V., and Jin, X. (2004). Earthquake triggering along the Xianshuihe Fault zone of western sichuan, China. Pure Appl. Geophys. 161, 1683–1707. doi:10.1007/s00024-003-2471-4
Qiao, L., Yao, H., Lai, Y., Huang, B., and Zhang, P. (2018). Crustal structure of southwest China and northern vietnam from ambient noise tomography: Implication for the large-scale material transport model in SE tibet. Tectonics 37, 1492–1506. doi:10.1029/2018TC004957
Qiao, X., Wang, Q., and Du, R. (2004). Characteristics of current crustal deformation of active blocks in the Sichuan-Yunnan region. Chin. J. Geophys. 47 (5), 805–811. doi:10.3321/j.issn:0001-5733.2004.05.011
Shen, K., Lü, J., Wang, M., and Bürgmann, R. (2005). Contemporary crustal deformation around the southeast borderland of the Tibetan Plateau. J. Geophys. Res. 110, B11409. doi:10.1029/2004JB003421
Steinshouer, D. W., Qiang, J., McCabe, P. J., and Ryder, R. T. (1999). Maps showing geology, oil and gas fields, and geologic provinces of the asia pacific region: U.S. Geol. Surv. Open-File Rep., 97-470, 16 doi:10.3133/ofr97470F
Sun, Q., Pei, S., Su, J., Liu, Y., Xue, X., Li, J., et al. (2021). Three-dimensional seismic velocity structure across the 17 June 2019 Changning MS6.0 earthquake, Sichuan, China. Chin. J. Geophys. 64 (1), 36–53. doi:10.6038/cjg2021O0246
Tian, Y., Zhao, D., Sun, R., and Teng, J. (2007). The 1992 Landers earthquake: Effect of crustal heterogeneity on earthquake generation. Chin. J. Geophys. 50 (5), 1300–1308. doi:10.1002/cjg2.1149
Waldhauser, F., and Ellsworth, W. L. (2000). A double-difference earthquake location algorithm: Method and application to the northern hayward fault, California. Bull. Seismol. Soc. Am. 90, 1353–1368. doi:10.1785/0120000006
Wang, C., Han, W., Wu, J., Lou, H., and Chan, W. (2007). Crustal structure beneath the eastern margin of the Tibetan Plateau and its tectonic implications. J. Geophys. Res. 112, B07307. doi:10.1029/2005JB003873
Wang, C., Lou, H., Lv, Z., Wu, J., Chang, L., Dai, S., et al. (2008). S-Wave crustal and upper mantle’s velocity structure in the eastern Tibetan plateau—deep environment of lower crustal flow. Sci. China Earth Sci. 51, 263–274. doi:10.1007/s11430-008-0008-5
Wang, C., Wu, J., Liu, Y., Yang, T., Fan, L., and Liu, J. (2021). Three-dimensional P-wave velocity structure around the sources of Ludian and Qiaojia earthquakes. Acta Seismol. Sin. 43 (1), 1–12. doi:10.11939/jass.20200110
Wang, C., Wu, J., Yang, T., Wang, W., Fan, L., and Fang, L. (2018). Crustal structure beneath the Taiyuan Basin and adjacent areas revealed by double-difference tomography. Chin. J. Geophys. 61 (3), 963–974. doi:10.6038/cjg2018L0114
Wang, M., and Shen, Z. (2020). Present-Day crustal deformation of continental China derived from GPS and its tectonic implications. J. Geophys. Res. 125, e2019JB018774. doi:10.1029/2019JB018774
Wang, W., Fang, L., Wu, J., Tu, H., Chen, L., Lai, G., et al. (2021). Aftershock sequence relocation of the 2021 MS7.4 Maduo earthquake, qinghai, China. Sci. China Earth Sci. 64 (8), 1371–1380. doi:10.1007/s11430-021-9803-3
Wang, W., Wu, J., Fang, L., Lai, G., and Cai, Y. (2017). Crustal thickness and Poisson’s ratio in southwest China based on data from dense seismic arrays: The RF H- κ Stacking in Southwest China. J. Geophys. Res. 122, 7219–7235. doi:10.1002/2017JB013978
Wang, W., Wu, J., Fang, L., and Lai, G. (2014). Double difference location of the Ludian MS6.5 earthquake sequences in Yunnan province in 2014. Chin. J. Geophys. 57 (9), 3042–3051. doi:10.6038/cjg20140929
Wang, W., Wu, J., Fang, L., and Wang, C. (2013). Relocation of the Yushu MS7.1 earthquake and its aftershocks in 2010 from HypoDD. Sci. China Earth Sci. 56 (2), 182–191. doi:10.1007/s11430-012-4450-z
Wang, Y. (1998). Basic characteristics of active structures on the qinghai-tibet plateau (in Chinese). Beijing, China: Seismological Press.
Wang, Y., Shen, J., and Wang, Q. (2003). On the lateral extrusion of Sichuan-yunan block. Earth Sci. Front. 10 (1), 188–192. doi:10.3321/j.issn:1005-2321.2003.z1.026
Wen, X. (2000). Character of repture segmentation of the Xianshuihe-Anninghe-Zemuhe fault zone, Western Sichuan. Seismol. Geol. 22 (3), 239–249. doi:10.3969/j.issn.0253-4967.2000.03.005
Wen, X., Ma, S., Xu, X., and He, Y. (2008). Historical pattern and behavior of earthquake ruptures along the eastern boundary of the Sichuan-Yunnan faulted-block, southwestern China. Phys. Earth Planet. Inter. 168, 16–36. doi:10.1016/j.pepi.2008.04.013
Wessel, P., Luis, J. F., Uieda, L., Scharroo, R., Wobbe, F., Smith, W. H. F., et al. (2019). The generic mapping tools version 6. Geochem. Geophys. Geosystems 20, 5556–5564. doi:10.1029/2019GC008515
Wu, H., Shen, X., Wang, J., Zhao, L., and Chen, J. (2018). Three-dimensional velocity structure of upper crust in the Three Gorges Reservoir area derived from double-difference tomography. Chin. J. Geophys. 61 (7), 2802–2814. doi:10.6038/cjg2018L0345
Xiao, Y. (2022). Three-dimensional crustal P-wave velocity structure around Longmenshan andAninghe fault zones. Beijing, China: Institute of Geophysics.
Xuan, S., Shen, C., and Tan, H. (2015). Tectonic implications of images of Bouguer gravity anomaliy and its normalized full gradient in Lushan-Kangding area. Chin. J. Geophys. 58 (11), 4007–4017. doi:10.6038/cjg20151110
Xv, J., Shao, Z., Ma, H., and Zhang, L. (2013). Evolution of Coulomb stress and stress interaction among strong earthquakes along the Xianshuihe fault zone. Chin. J. Geophys. 56 (4), 1146–1158. doi:10.6038/cjg20130410
Xv, X., Zhang, P., Wen, X., Qin, Z., Chen, G., and Zhu, A. (2005). Features of active tectonics and recurrence behaviors of strong earthquakes in the Western sichuan province and its adjacent regions. Seismol. Geol. 27 (3), 446–461. doi:10.3969/j.issn.0253-4967.2005.03.010
Yue, H., Ross, Z. E., Liang, C., Michel, S., Fattahi, H., Fielding, E., et al. (2017). The 2016 KumamotoMw = 7.0 earthquake: A significant event in a fault-volcano system. J. Geophys. Res. 122, 9166–9183. doi:10.1002/2017JB014525
Zandt, G., and Ammon, C. (1995). Continental crust composition constrained by measurements of crustal Poisson's ratio. Nature 374, 152–154. doi:10.1038/374152a0
Zhang, H., and Thurber, C. H. (2003). Double-difference tomography: The method and its application to the hayward fault, California. Bull. Seismol. Soc. Am. 93, 1875–1889. doi:10.1785/0120020190
Zhang, M., Ellsworth, W. L., and Beroza, G. C. (2019). Rapid earthquake association and location. Seismol. Res. Lett. 90, 2276–2284. doi:10.1785/0220190052
Zhang, M., Liu, M., Feng, T., Wang, R., and Zhu, W. (2022). LOC-FLOW: An end-to-end machine learning-based high-precision earthquake location workflow. Seismol. Res. Lett. 93, 2426–2438. doi:10.1785/0220220019
Zhang, P. (2013). A review on active tectonics and deep crustal processes of the Western Sichuan region, eastern margin of the Tibetan Plateau. Tectonophysics 584, 7–22. doi:10.1016/j.tecto.2012.02.021
Zhang, P., Deng, Q., Zhang, G., Ma, J., Gan, W., Min, W., et al. (2003). Active tectonic blocks and strong earthquakes in the continent of China. Sci. China Earth Sci. 46 (2), 13–24. doi:10.3969/j.issn.1674-7313.2003.z2.002
Zhang, P., Zhu, L., Chen, H., Wang, Q., and Yang, Y. (2014). Crustal structure in China from teleseismic receiver function. Acta Seismol. Sin. 36 (5), 850–861. doi:10.3969/j.issn.0253-3782.2014.05.0009
Zhang, Y., Chen, W., and Yang, N. (2004). 40Ar/39Ar dating of shear deformation of the Xianshuihe fault zone in west Sichuan and its tectonic significance. Sci. China Earth Sci. 47 (9), 794–803. doi:10.1360/03yd0509
Zhang, Y., Replumaz, A., Leloup, P. H., Wang, G., Bernet, M., van der Beek, P., et al. (2017). Cooling history of the Gongga batholith: Implications for the Xianshuihe Fault and miocene kinematics of SE tibet. Earth Planet. Sci. Lett. 465, 1–15. doi:10.1016/j.epsl.2017.02.025
Zhang, Z., Yao, H., and Yang, Y. (2020). Shear wave velocity structure of the crust and upper mantle in Southeastern Tibet and its geodynamic implications. Sci. China Earth Sci. 63, 1278–1293. doi:10.1007/s11430-020-9625-3
Zhao, J., Ren, J., Jiang, Z., and Yue, C. (2018). Three-dimensional deformation characteristics of the Xianshuihe fault zone. Seismol. Geol. 40 (4), 818–831. doi:10.3969/j.issn.0253-4967.2018.04.007
Keywords: Ms 6.8 Luding earthquake, double-difference tomography, machine learning, earthquake relocation, velocity structure, seismogenic fault
Citation: Cai G, Wang W, Wu J, Su J, Lai G, Wu P, Chen L and Su J (2023) Three-dimensional body wave velocity structure and seismogenic structure for the 2022 MS 6.8 Luding earthquake sequence in Sichuan, China. Front. Earth Sci. 11:1099744. doi: 10.3389/feart.2023.1099744
Received: 16 November 2022; Accepted: 20 January 2023;
Published: 13 February 2023.
Edited by:
Jonny Wu, University of Houston, United StatesReviewed by:
Renqi Lu, Institute of Geology, China Earthquake Administration, ChinaMita Uthaman, Indian Institute of Technology Kharagpur, India
Copyright © 2023 Cai, Wang, Wu, Su, Lai, Wu, Chen and Su. This is an open-access article distributed under the terms of the Creative Commons Attribution License (CC BY). The use, distribution or reproduction in other forums is permitted, provided the original author(s) and the copyright owner(s) are credited and that the original publication in this journal is cited, in accordance with accepted academic practice. No use, distribution or reproduction is permitted which does not comply with these terms.
*Correspondence: Weilai Wang, d2FuZ3dsQGNlYS1pZ3AuYWMuY24=; Jianping Wu, d2pwd3VAY2VhLWlncC5hYy5jbg==