 Yuanyuan Ma
 David Eaton
 Nadine Igonin
 Chaoyi Wang1
- 1Department of Geoscience, University of Calgary, Calgary, AB, Canada
- 2Bureau of Economic Geology, Jackson School of Geosciences, The University of Texas at Austin, Austin, TX, Unites States
In recent years, Distributed Acoustic Sensing (DAS) deployed in deviated wells has been increasingly used for microseismic monitoring. DAS can provide observations of microseismic wavefields with high spatial resolution and wide aperture, at the cost of unusually large data volumes compared with conventional downhole microseismic monitoring. To tackle this big-data challenge, we have developed key elements of a processing workflow that is assisted by machine learning techniques. We trained a convolutional neural network (CNN) for event detection and a U-Net model for both P- and S-wave arrival time picking. The workflow was applied to two multiwell DAS datasets acquired during hydraulic fracturing completions in western Canada. These datasets also include co-located 3C borehole geophone arrays that enable further comparison between catalogs from both sensor types. Compared with a traditional short-term average/long-term average (STA/LTA) method for event detection, our results indicate that the CNN method has a lower false-trigger rate and increases the event catalog size by a factor of 2.6–5.6. U-Net yields arrival-time picks with relatively small errors, high efficiency, and minimal user intervention, providing hypocenter location and focal depth that is arguably more accurate than the geophone catalog. While the proposed automated workflow requires substantial effort to build high-quality and large training datasets, it enables the use of DAS for real-time seismicity monitoring and risk management after the training stage. Although the DAS system detected fewer events than the geophone catalog and missed smaller magnitude events, our results indicate that fiber-optic sensors provide enough sensitivity to detect and locate sufficient events to characterize the treatment stages. DAS also captured induced events located at a hypocentral distance of >1 km, which are possibly indicative of reactivation of structural features.
1 Introduction
In recent years, distributed acoustic sensing (DAS) has been increasingly used for microseismic monitoring during hydraulic fracturing. DAS systems operate by emitting coherent laser pulses into an optical fiber (Hartog, 2017). Part of the signal is returned due to Rayleigh backscattering, and the phase change of the back-scattered signals is converted to strain or strain-rate using interferometry. Optical fibers can be permanently deployed (cemented) behind a casing, or they can be temporarily deployed on a wireline (e.g., Eaton et al., 2022; Wang et al., 2022). Once a fiber-optic cable is deployed downhole, it can be used for many purposes, including monitoring interwellbore strain during hydraulic fracturing (Jin and Roy, 2017; Zhang et al., 2020), carbon capture and sequestration monitoring (Daley et al., 2013), flow monitoring, vertical seismic profiling (VSP) (Mateeva et al., 2013) and microseismic monitoring (Cole et al., 2018; Karrenbach et al., 2019). One important advantage of DAS is that fibers can be kilometers long and can be used to monitor the entire well with high spatial resolution (on the order of a few meters). Thus, DAS monitoring systems typically provide denser sampling of elastic wavefields compared with traditional geophone arrays.
Several case studies have illustrated successful microseismic monitoring with DAS technology (e.g., Karrenbach et al., 2019; Lellouch et al., 2020a). Microseismic waveforms recorded by a standard fiber, however, generally have a lower signal-to-noise ratio (SNR) than those from geophones (Correa et al., 2017). Fortunately, engineered fiber with high back-scattered technology has become available, enabling SNR that approaches geophones (Richter et al., 2019). DAS systems measure strain or strain-rate along the fiber, and thus provide a single (axial) component. Locating microseismic events in 3D generally requires multi-fiber (Cole et al., 2018) and/or multi-component fiber (Lim Chen Ning and Sava, 2018) acquisition. Geophones and seismometers can measure three component (3C) data, thereby providing directional information that is not directly available from DAS observations. Advanced processing techniques using DAS have been developed to locate microseismic events (Verdon et al., 2020) and to determine source mechanisms (Baird et al., 2020; Rodriguez & Wuestefeld, 2020). The results from previous studies highlight the potential to integrate measurements from different fiber-optic cables, including microseismic, strain, and temperature, to improve subsurface monitoring during hydraulic fracturing (Zhang et al., 2021).
Since DAS technology provides thousands of channels with a high sampling rate (>1,000 Hz), DAS acquisition tends to generate exceptionally large data volumes—typically on the order of a TB per day. This large data volume poses a significant challenge for real-time data processing and analysis to inform operational decisions (Clarke et al., 2019). Common outputs of microseismic monitoring include the origin time, location of hypocenter, magnitude, and source mechanism of detected microseismic events (Maxwell 2014; Eaton 2018). Event detection and arrival time picking are two of the most time-consuming steps in the processing workflow. Increasing DAS data volumes are stretching the capabilities of traditional processing hardware and workflows. In addition, both permanently and temporarily deployed DAS systems usually contain higher noise levels than conventional 3C geophone data, with SNR that can vary greatly from trace to trace. Most traditional methods, such as event detection using short-term average/long-term average (STA/LTA), are quite sensitive to noise and may miss weak events, which makes them poorly suited for DAS data. These tools also need a certain level of human intervention, such as setting thresholds and performing quality control, which renders them inefficient for dealing with large data volumes produced by DAS.
Machine-learning techniques have been widely used to improve processing speed and accuracy. Some machine learning assisted techniques have been published to accelerate DAS microseismic data, such as the convolutional neural network (CNN) (Binder & Tura, 2020; Huot et al., 2021; Ma et al., 2021; Given et al., 2022) and YOLOv3, a state-of-the-art neural network for image object detection (Stork et al., 2020). Those techniques often show superior performance over traditional methods, but still require additional effort to build a synthetic training dataset that has high diversity to cover most features from field data.
In this paper, we present a novel machine learning-assisted processing workflow for DAS-recorded microseismic data. We begin by introducing two machine learning models, including a 2D convolutional neural network (CNN) for event detection and a 1D U-Net for arrival time picking. Two field DAS datasets from western Canada are used to demonstrate that our machine learning workflow can be effectively applied to large DAS data and provide accurate microseismic catalogs while reducing human intervention, and can achieve superior results compared with traditional methods. We further compared the DAS performance with a downhole three-component geophone array to obtain quantitative conclusions regarding the effectiveness of DAS for microseismic monitoring.
2 Methods
2.1 Data preprocessing
This section introduces the processing workflow for DAS microseismic data, including preprocessing, and two machine learning models for event detection and arrival time picking. Briefly, we first remove bias in the background (DC) amplitude level and spurious data spikes. In addition, we subtract the median value (using all channels) at each time sample of the DAS recordings to attenuate the system noise. We then apply a bandpass filter to the data with a passband of 10 and 150 Hz. This frequency band was chosen to avoid low-frequency noise and facilitate event detection based on the frequency band with the highest SNR. Finally, we apply trace normalization for better visualization.
Figure 1 shows the overall processing workflow for multi-fiber DAS microseismic data using machine learning, including preprocessing, event detection using CNN, arrival time picking using U-Net, and 3D hypocenter location using conventional ray tracing and grid search. As elaborated in the Results section, this workflow has been successfully applied to two DAS datasets in western Canada.
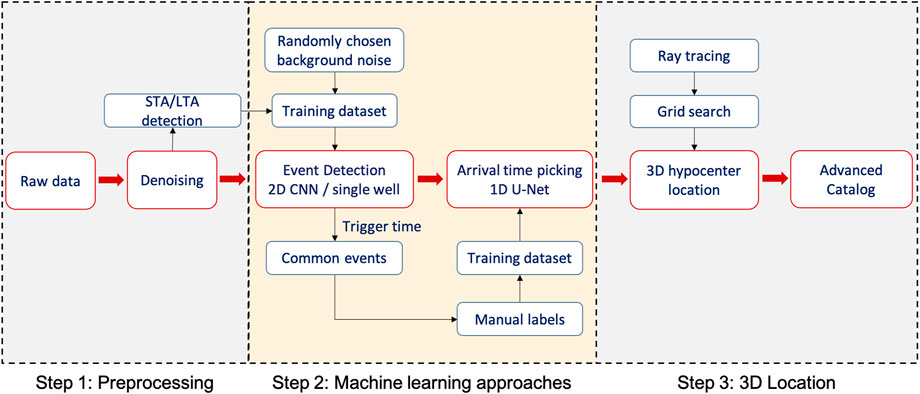
FIGURE 1. Machine learning-assisted processing workflow for multi-fiber DAS microseismic data developed in this project. The primary workflow is highlighted in red. The machine learning algorithms developed here occur in Step 2.
For context, Figure 2 shows phenomenology of four representative microseismic events recorded by horizontal DAS fibers. The first two events are characterized by complex microseismic wavefields. The first P- and S-arrivals are clear in both horizontal and vertical sections of the well, and exhibit polarity changes. The dense receiver spacing enables other details to be discerned, such as guided waves, reflections related to hydraulic fractures induced in a previous stage (Figure 2A) (Ma et al., 2022), and downgoing reflections from interfaces (Figure 2B). Effects of the near-field radiated component of strain (Luo et al., 2021) are also visible near the apex, between P- and S-wave arrivals. Figure 2C shows a typical microseismic event recorded by DAS system, which exhibits strong S-arrivals and relatively weak P-arrivals. The relatively low amplitude of P waves that impinge on the cable at a high angle is expected, since DAS generally only provides axial strain or strain rate observations along the fiber and the projection of P-wave particle motion onto this component is small. While some events are clear in DAS data and show full wavefields that cannot be observed by geophone array, many events are weak and of similar amplitude as the background noise, making them unsuitable for standard single-channel thresholding detection methods (Lellouch et al., 2020b). Figure 2D shows a distant event that occurred beyond the distal end (toe) of the monitoring fiber, which has no recorded local minimum (apex) of the P or S arrival.
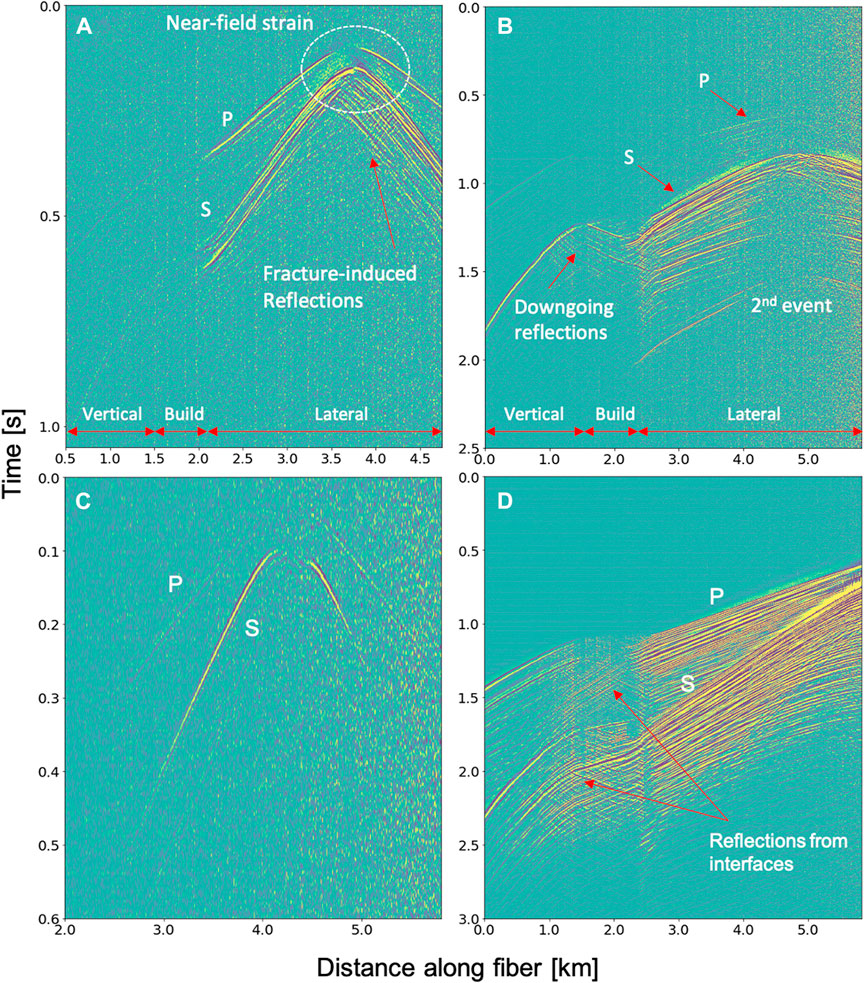
FIGURE 2. Examples of microseismic events detected by permanent (cemented) DAS fibers in horizontal wells. Events in (A,B) indicate P- and S- arrivals, fracture- and interface-induced reflections, guided wave, shear wave splitting, and near-field strain; event (C) is faint but typical of our DAS microseismic data; (D) shows a distant event beyond the well toe.
Template matching or waveform cross-correlation are alternative event detection methods that take advantage of waveform similarity and spatiotemporal recording (Maxwell 2014). These approaches are impractical, however, since events might originate from various locations so a detection method that relies on template-matching would in general require an inordinate number of templates.
2.2 CNN architecture for event detection
Near real-time decision making during hydraulic fracturing requires event detection algorithms to be automated, efficient, and robust in order to handle large data volumes with minimal human interference. Since DAS data provide high-resolution 2D space-time images of the strain wavefield, it is possible to leverage advances in CNN methods for image classification problems to the DAS event detection task to identify if an input 2D data window contains microseismic signals. In a CNN, the core operation is convolution of a two-dimensional image with a series of learnable kernels and application of a non-linear activation function to create a feature map (LeCun et al., 1989). The CNN architecture chosen for this study is depicted in Figure 3. Input images first go through five down-sampling layers, and each layer consists of a 3x3 convolutional layer, a rectified linear unit (ReLU) activation function, and a downsampling layer. Gradually increased drop rates [0.1-0.25] were applied from the first convolutional layer down the network. Then a fully connected layer with 128 hidden nodes and a sigmoid activation function was applied to generate two output classes, microseismic signal and noise. Cross-entropy loss was used as the loss function, which measures the performance of a classification model whose output is a probability value between 0 and 1. Bayesian optimization was used to select hyper-parameters, and the filter numbers of each layer are shown in Figure 3. The hyperparameters chosen here render the architecture simpler than most general image classification networks. Nevertheless, we obtained good results that are illustrated in the following section. We used Keras (Chollet, 2015) and Tensorflow (Abadi et al., 2015) to build the architecture.
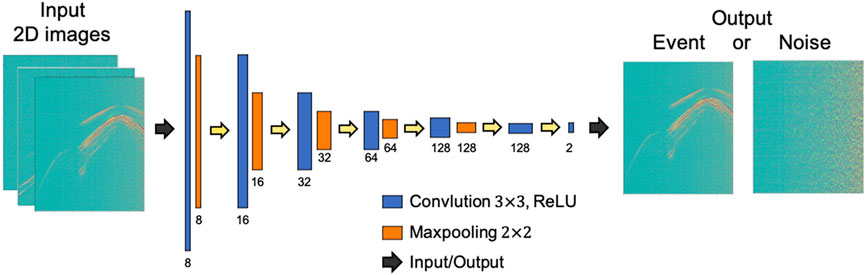
FIGURE 3. CNN architecture used for event detection. The input is 2D images created from the DAS data in windows, and the output is binary (event or noise).
Training a model using supervised learning methods often requires a large number of images with corresponding labels. Creating representative training samples and keeping high diversity are crucial to successfully train a network and to prevent the network from learning unrelated patterns. In our workflow, we build the training dataset using the following steps.
1. Apply a well-established approach, STA/LTA to obtain a preliminary set of detected events.
2. Limit the DAS data to the well segments (horizontal sections) desired for training and detection.
3. Normalize the seismic traces to fall within the range from 0 to 255, for training.
4. Create input blocks with same size (512x512, 0.512), chosen to provide a balance between retaining representative image features and reducing computation cost.
5. Manually pick noise at random channels and times to build a suite of background noise samples, which here are at least 30 s time separation from any other event.
6. Perform data augmentation by injecting random noise into STA/LTA pick times for reference events to obtain more events with various SNR for training.
7. The detection windows are cropped randomly around the apex of each microseismic event for each training epoch for data augmentation.
Unlike other studies (Stork et al., 2020), we do not use synthetic datasets for training because synthetic samples usually do not contain sufficient complexity to provide adequately diverse training data. After training and validation, we then apply the trained model to search for events on all fibers.
2.3 U-net for arrival time picking
We treat arrival-time picking as an image-segmentation problem and use a simplified U-Net architecture to pick arrival times automatically. Image segmentation methods have been widely used to solve various geophysical tasks, including horizon interpretation (Wu H. et al., 2019), fault detection (Wu X. et al., 2019), salt dome detection (Khayer et al., 2022a; Khayer et al., 2022b; Khayer et al., 2022c; Fard et al., 2022), and arrival time picking (Zhu & Beroza, 2018; Ma et al., 2020). U-Net (Ronneberger et al., 2015) is a pixel-level neural network for image segmentation. Figure 4 illustrates the process of microseismic arrival time picking. Each input 1D seismic trace is tagged using three classes: P-wave, S-wave, and noise, according to the manual picking (marked by dashed lines). Then, the network automatically learns representative features and generates a probability map to predict the arrival time.
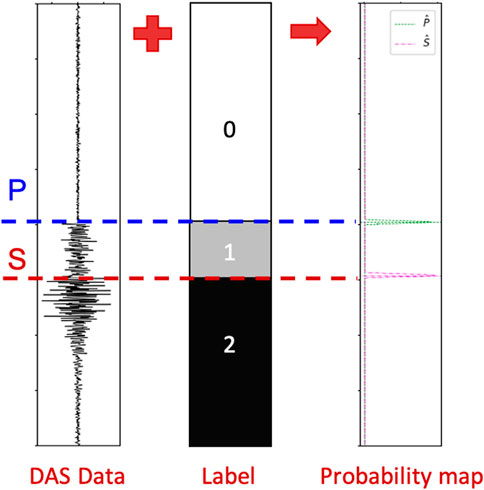
FIGURE 4. Arrival time picking method. The manual picked P- and S-wave times are marked with blue and red dashed lines, respectively. The training data contains the labels (0, 1 or 2). The trained network produces probability densities for P- and S-arrivals.
Figure 5 shows the U-Net architecture we used with 1-D seismic time series. The input seismic data undergo four down-sampling stages and four up-sampling stages. Within each stage, we apply 1-D convolutions and ReLU activations. A skip connection at each depth directly concatenates the left output to the right layer without going through the deeper layer (grey arrows in Figure 5), which improves convergence during training and the resolution of outputs. The 1-D convolution kernel size is set to seven data points. Finally, the normalized softmax exponential function is used to assign probabilities in the last layer. Manual picking samples were used to build the training dataset. The results of applying these two machine learning networks and further details on implementation are presented in the following section.
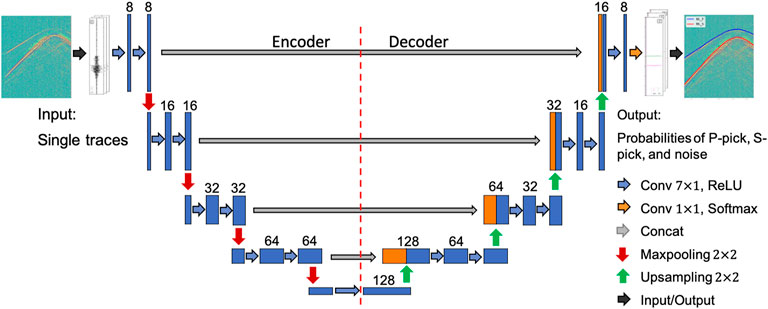
FIGURE 5. U-Net architecture for arrival-time picking.
3 Results
3.1 Data overview
Two case studies are presented in this paper, both involving multi-well DAS acquisition. In both cases, the reservoir was stimulated in stages along horizontal sections of the treatment well, as illustrated in Figure 6. In the first case study, three permanently installed fibers in both horizontal (Well A, B) and vertical (Well C) wells were used to monitor hydraulic fracturing (Figure 6A) using a 4-m gauge length, an acquisition parameter that determines the spatial resolution of the dataset (Hartog, 2017). The raw data were converted to strain and down-sampled from 1m to 4 m channel spacing for microseismic data processing, with a 2000 Hz sampling rate. The second case study has a similar well geometry (Figure 6B), including two fibers cemented in horizontal wells (Well A, C) and vertical well (Well M) with a 7-m gauge length.

FIGURE 6. (A) Case study 1 well geometry: Two fibers are permanently installed in horizontal Well A and B, one in vertical Well C. Stars indicate perforation locations of three stages discussed in this paper. (B) Case study 2 has a similar well geometry. Two fibers are permanently installed in horizontal Well A and C, one in vertical Well M.
In both case studies, we selected three treatment stages, each several hours in duration, to demonstrate the performance of the developed workflow. This includes recordings from Stage 21 to Stage 23 in case study 1 and Stage 1 to Stage 3 in case study 2. In addition to the DAS monitoring, for both case studies there was a co-located downhole 3-component geophone array in the vertical well, allowing for the comparison of the DAS and conventional geophone-derived microseismic catalogs.
3.2 Case study 1: Event detection results by CNN
For case study 1, the final training dataset consists of 3,584 samples: 1,792 positive, and 1,792 noise samples. Training hyperparameters used in the model with the best performance include a batch size of 32 and a learning rate of 0.001. We train the network for 100 epochs with an early-stop if the performance does not improve over 10 epochs. In each iteration, 20% of the dataset was randomly selected for validation. The final model achieves high accuracy (96.62%), precision (98.73%), and recall (95.51%). We then apply the well-trained model to search for events independently on all three fibers. The time windows for detection were 25% overlapped to avoiding the loss of edge information.
Table 1 shows the detection results of all stages for case study 1. Compared with STA/LTA, CNN detection increased the event catalog size by a factor of 2.6. This factor was calculated as the ratio of the absolute number of events by CNN (586) and STA/LTA (224). Besides the performance improvement for event detection, CNN detection provides a lower false positive ratio, which can help to reduce the time cost on quality control. The false ratio of event detection could be lower since the false positive number shown in Table 1 counts all false-triggered detection windows, and not false-triggered microseismic events. Manual validation of the picked events confirms that the CNN model learned microseismic features and detected events well. Figure 7 shows two examples missed even by manually labeling but detected by the CNN model, which could be easily misclassified as false positive samples, but that are revealed to be actual extremely weak events (arrows).
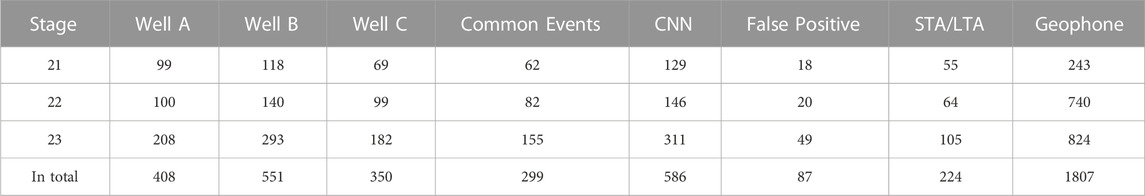
TABLE 1. Case study 1: Comparison of DAS CNN, STA/LTA, and geophone performance for event detection.
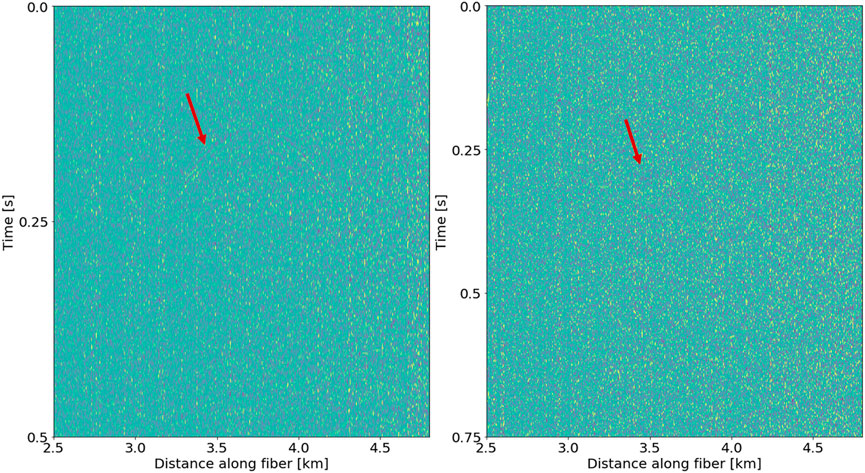
FIGURE 7. Case study 1: Examples of extremely weak events detected by CNN but missed by both STA/LTA and manual labels.
Figure 8 compares histograms of STA/LTA and CNN detection results with a one-hour bin width, showing that the CNN model expands the STA/LTA catalog. Although DAS detected fewer events than the use of traditional methods with geophones (only around 30% of geophone catalog) and missed smaller magnitude events (below −2.0) due to the intrinsic limitation of fiber optical sensors, DAS did detect several events that are close to the treatment well but not contained in the 3-component dataset. Importantly, both approaches yield good general agreement in terms of the distribution of events versus time. When events are detected on at least two horizontal fibers within a pre-defined time interval (we used one second for this dataset), the events are labelled as being associated to the same microseismic source. Selecting common events helps to discriminate events that are too weak to map and to eliminate inaccurate arrival time picks.
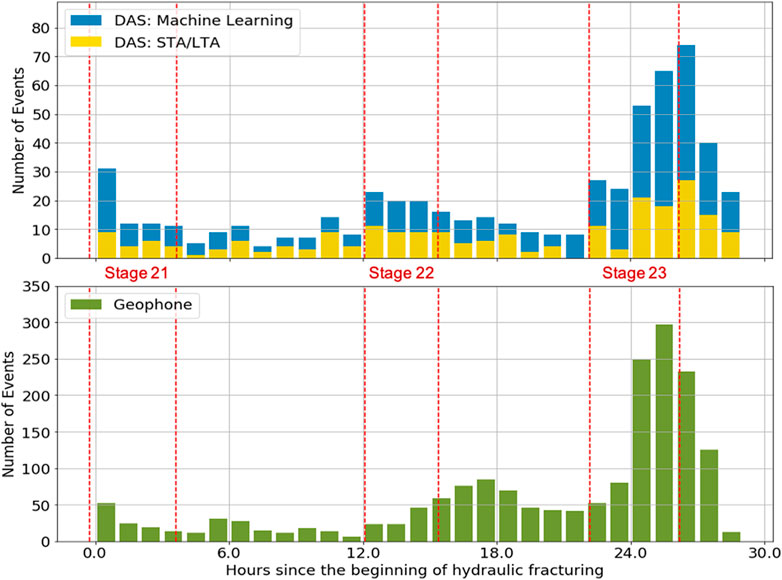
FIGURE 8. Case study 1: Comparison of event histograms from DAS and 3C geophone for three stages. CNN (blue) significantly extends the DAS catalog compared to STA/LTA (yellow). Although DAS detects fewer events than the geophones(green), there is good general agreement in the distribution of events versus time.
3.3 Case study 1: Arrival time picking by U-Net
To pick the arrival time automatically, we applied the U-Net method described in Section 2.3 to selected events with associated signals on multiple fibers. We first manually picked 62 common events of Stage 21 from all three wells, which provides 4,000 labeled traces with clear P- and S-arrivals for training. All input traces share the same size of 3001x1, which is equal to a time window of 1.5 s suitable for most channels. We train the network for 100 epochs by using a batch size of 100 and a learning rate of 0.0001. After training and validation, we applied the model to each channel of all common events. To pick the accurate arrival times from the probability maps, we set a threshold as 0.3 for both P- and S-wave arrival times.
The picking results of the events recorded by DAS are shown in Figure 9. The diversity in the pick continuity reflects varying amplitude levels and focal mechanisms. The U-Net model picked both accurate P- and S-wave for the left strong event, but only S-picks for the middle example. Figure 9C gives an example of arrival time picking for a far distant event. In summary, the U-Net model picked most S-wave with high accuracy but missed weak P-arrivals that are barely visible in some channels.
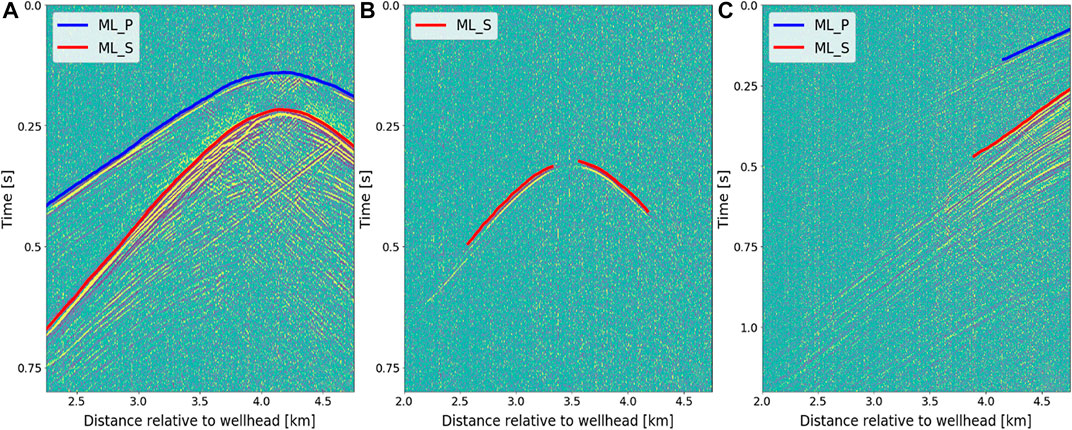
FIGURE 9. Case study 1: Arrival time picking results of representative events. (A) A strong event, (B) a weaker event, (C) an off-well event.
3.4 Case study 2
With the machine learning networks trained for detection and phase-picking, the next test of the networks is to apply them to another DAS dataset. In case study 2 we applied the same workflow described in Figure 1, with a few site-specific changes based on the new data features. New samples from three stages in the second data were introduced to retrain both the CNN model and the U-Net model based on the models from the first data. Our machine learning workflow achieved good results for Case study 2, compared to traditional microseismic processing tools, after a relatively quick re-training step.
Figure 10 and Table 2 compare the performance of STA/LTA, CNN detection, and geophone catalog. The results reveal reasonable counts of microseismic events for each stage, demonstrating that this workflow is robust. In contrast, manual picking is not feasible to complete event detection in near real time to aid in stimulation and production decisions. While advanced transfer learning, an approach used to generalize a well-trained machine learning model, was not applied in this project, the CNN model achieved better performance than STA/LTA and increased the catalog size from 257 to 1,459 with a ratio of 5.6. We remark that both DAS datasets were acquired by the same service provider, resulting in similar data quality that can ease the learning process from two different data and avoid intrinsic differences that may prevent the machine learning model from learning new features.
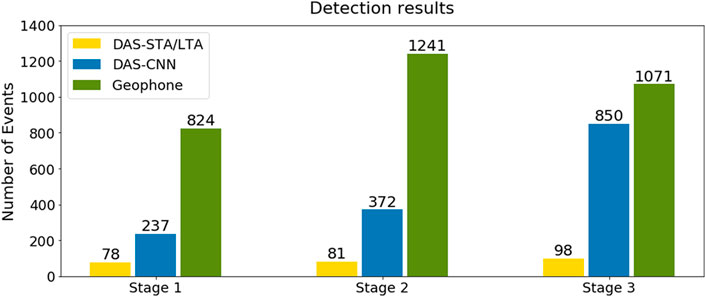
FIGURE 10. Case study 2: Event detection results of three stages in the second DAS data, comparing performance of DAS STA/LTA (yellow), CNN (blue), and 3C geophone (green).
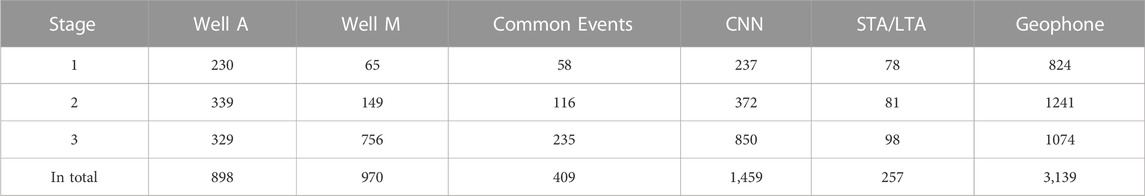
TABLE 2. Case study 2: Comparison of DAS CNN, STA/LTA, and geophone performance for event detection.
Although the second DAS case study shows event detectability that is generally similar to the first case study, and similarly provides less sensitivity to small microseismic events compared with collocated 3C geophones, in one treatment stage (stage 3) the DAS detection performance is comparable to geophones. In the case of DAS recording in a near-vertical fiber located close to the treatment stage, the vertical fiber provided comparable detection capability comparable to the geophone array.
After picking the arrival time of all common events by the U-Net model, we locate hypocenter locations using a conventional approach consisting of ray tracing and grid search to minimize the misfit between observed and modelled times. We used a laterally homogeneous (1-D) velocity model, constructed using the compressional and shear sonic logs from the vertical well (Well M). In sedimentary rocks the seismic velocity is often different in the horizontal direction than in the vertical direction due to seismic anisotropy. However, in this study, calibration sources with known-location (Eaton, 2018) were unavailable so it was not feasible to construct an anisotropic velocity model. Figure 11 shows a map view and a time-depth event distribution, overlaid on a low-frequency DAS (LF-DAS) strain plot for a single hydraulic fracturing stage. In map view, both DAS and geophone results show microseismic clouds of similar extent near the treatment stage, including a similar fracture azimuth. Two distant small clouds to the east of the horizontal wells indicate near-fault reactivation that may be related to the hydraulic fracturing operations.
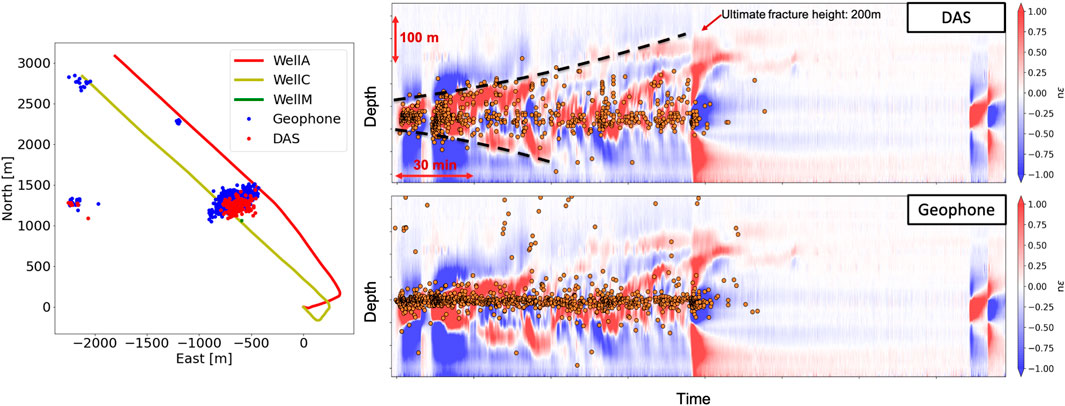
FIGURE 11. Case study 2: Left: map view of events from a single hydraulic fracturing stage. Right: Time-depth distribution of fiber strain rate in vertical well M, and microseismic events (orange dots) from DAS (upper) and geophone (lower).
Another way to validate the quality of the event locations is by comparing the event distribution with the LF-DAS response. As the fiber optic cable was used to detect microseismic events (high-frequency DAS) it was also recording low-frequency signals (<1 Hz), which can be used to track the growth of hydraulic fractures (Jin and Roy, 2017). The waterfall plot of LF-DAS in Figure 11 is from a vertical fiber and contains typical expressions of fracture opening (positive strain, red) and fracture closure (negative strain, blue). This plot indicates that fractures initiate at the perforation depth and grow both upwards and downwards, with the upward growth being more dominant. The event locations from the geophones and the DAS are overlain to determine if they correspond with the observed fracture growth. From geophone data, most microseismic events originate around the perforation depth, but hypocenters located using the DAS fiber appear to show more fracture height growth that is more consistent with the LF-DAS. The good agreement of event depth and fracture opening benefits from accurate arrival time picking by U-Net as well as the large aperture provided by the DAS fibers, which is favorable for characterizing microseismic sources as it produces a large solid angle (Eaton and Forouhideh, 2011). Fiber strains indicate that the ultimate fracture height growth extends to approximately 200 m above the perforation depth.
4 Discussion
In this paper, we apply machine learning models to two DAS datasets during hydraulic fracturing. The examples presented above show that machine learning methods can automate microseismic processing tasks, opening up multiple avenues for DAS-based microseismic analysis and characterization of hydraulic fracturing. The results of both case studies show that the proposed CNN model can detect microseismic events recorded by low SNR DAS data with accuracy and efficiency superior to a commonly used conventional approach for event detection (STA/LTA). For arrival-time picking, the U-Net model can achieve accurate picks for both P- and S-arrival time, resulting in robust hypocenter locations. Qualitative and quantitative comparisons with results from traditional geophone methods show that the machine-learning assisted workflow is effective.
Both case studies demonstrated in this paper were acquired using permanently cemented fiber. DAS fibers can also be deployed into a cased borehole using a wireline system (e.g., Eaton et al., 2022; Wang et al., 2022), which usually is less sensitive and yields noisier data compared with cemented fiber due to inferior coupling between the cable and the surrounding medium. To handle noisy data processing, our workflow could benefit from further new samples with diverse noise types and advanced noise attenuation tools (e.g., Mahdavi et al., 2021; Mafakheri et al., 2022) as part of the data pre-conditioning step. An advantage of CNN machine-learning techniques is that the network can be retrained as more data become available, which makes it possible to use transfer learning, i.e., to train a network using DAS data from one well and apply it to DAS data from other wells. The network still requires samples from new wells for training; fortunately, training is faster and requires fewer new samples as many wells covered. The automated workflow we have developed allows us to explore the use of DAS for real-time seismicity monitoring and risk management.
For DAS microseismic data, most P-waves are barely discernible because DAS only measures the strain (or strain rate) along the axial direction of the fiber. Thus, microseismic waveforms from DAS are usually S-wave dominated. In this study, we set the same threshold of probabilities for both P- and S-picks. Tuning the threshold can improve the performance, but we found that the improvements are not significant. This limitation could be alleviated by first extracting S-wave arrivals, and then remove data after the S-picks and subsequently pick the P-wave arrival. Such a two-step workflow, currently being tested, might help to mitigate the influence of high amplitude S-wave arrivals on the P-wave picking. Considering the complex wavefields observed by DAS, there is considerable scope to develop automated tools to make use of more complex phase data, including reflections, guided waves, and coda wave. U-Net is a powerful tool that has the potential to be further developed for multi-phase picking.
The use of fiber-optic DAS systems for microseismic monitoring offers several advantages over traditional downhole geophone arrays. The dense spatial sampling provided by DAS acquisitioni results in a large-aperture, which enables the application of advanced processing and imaging algorithms. For example, the dipping reflections shown in Figure 2A are caused by hydraulic fractures from previous stages (Ma et al., 2022). Additionally, the spatial continuity of the DAS events reveals both upgoing and downgoing reflections that could be used to improve depth estimation (Rutledge and Soma, 2013). Integration of different fiber-optic data, including DAS microseismic, low-frequency DAS, with other measurements, such as perforation injection and production flow, could further characterize dynamic structural and fluid changes during hydraulic fracturing. Fortunately, machine learning provides powerful tools to handle large data processing and complex statistical tasks combining various types of data.
5 Conclusion
This paper describes a novel machine-learning-assisted processing workflow for multi-fiber DAS microseismic data. Our method uses a CNN model for microseismic event detection, using a preliminary catalog generated by conventional detection method (STA/LTA). The CNN model significantly enhances the detection capabilities compared with conventional approaches and, more importantly, provides a low false-positive rate, which can improves processing efficiency. Using a training dataset with manually picked arrival times, we then used a U-Net model for arrival-time picking. This method provides stable and accurate picks for both P- and S- arrival time, resulting in hypocenter location and focal depth that we infer to be more accurate than in the geophone catalog. The improved location accuracy is likely due to the considerably increased observational aperture provided by multi-well DAS fibers compared with the geophone data. Two case studies illustrate some of the advantages offered by semi-automated DAS microseismic processing enabled using a machine learning approach, including low computation cost and minimal human intervention requirements after the training stage. Comparison with a microseismic catalog from 3C borehole geophone arrays suggests that the DAS system is less sensitive to weak events than geophone, although the DAS captured distant events that lie beyond the typical treatment well distance.
Data availability statement
The data analyzed in this study is subject to the following licenses/restrictions: The data are proprietary, but the code is available from the corresponding author upon request. Requests to access these codes should be directed to eXVhbnl1YW4ubWFAdWNhbGdhcnkuY2E=.
Author contributions
YM contributed to developing the processing workflow, DAS data analysis, and drafting of the paper. DE contributed to integrated data interpretation and critical revision of the paper. NI contributed to geophone data processing, interpretation, and critical revision of the paper. CW contributed to low-frequency DAS data analysis, interpretation, and critical revision of the paper.
Funding
This research was funded in part through the Canada First Research Excellence Fund (CFREF) by the Global Research Initiative in Sustainable Low Carbon Unconventional Resources (GRI).
Acknowledgments
The authors are grateful to ConocoPhillips Canada and an anonymous company for permission to publish the DAS examples. OptaSense is thanked for their insights and technical assistance for the project. We also thank the sponsors of the Microseismic Industry Consortium for their ongoing support. The data are proprietary, but the code is available from the corresponding author upon request.
Conflict of interest
The authors declare that the research was conducted in the absence of any commercial or financial relationships that could be construed as a potential conflict of interest.
Publisher’s note
All claims expressed in this article are solely those of the authors and do not necessarily represent those of their affiliated organizations, or those of the publisher, the editors and the reviewers. Any product that may be evaluated in this article, or claim that may be made by its manufacturer, is not guaranteed or endorsed by the publisher.
References
Abadi, M., Agarwal, A., Barham, P., Brevdo, E., Chen, Z., Citro, C., et al. (2015). TensorFlow: Large-scale machine learning on heterogeneous distributed systems. Available at: https://www.tensorflow.org/.
Baird, A., Stork, A., Horne, S., Naldrett, G., Kendall, J.-M., Wookey, J., et al. (2020). Characteristics of microseismic data recorded by distributed acoustic sensing systems in anisotropic media. Geophysics 85, KS139–KS147. doi:10.1190/geo2019-0776.1
Binder, G., and Tura, A. (2020). Convolutional neural networks for automated microseismic detection in downhole distributed acoustic sensing data and comparison to a surface geophone array. Geophysical Prospecting. 68, 2770–2782. doi:10.1111/1365-2478.13027
Chollet, F., (2015). Keras. Available at; https://github.com/fchollet/keras.
Clarke, H., Verdon, J., Kettlety, T., Baird, A., and Kendall, J.-M. (2019). Real-time imaging, forecasting, and management of human-induced seismicity at Preston new road, Lancashire, England. Seismological Research Letters. 90. 1902-1915. doi:10.1785/0220190110
Cole, S., Karrenbach, M., Kahn, D., Rich, J., Silver, K., and Langton, D. (2018). Source parameter estimation from DAS microseismic data. SEG Technical Program Expanded Abstracts, 4928–4932. doi:10.1190/segam2018-2995716.1
Correa, J., Egorov, A., Tertyshnikov, K., Bålona, A., Pevzner, R., Dean, T., et al. (2017). Analysis of signal to noise and directivity characteristics of DAS VSP at near and far offsets—A co2crc otway project data example. Lead Edge Capital Management, LLC. 36, 994a1–994a7. doi:10.1190/tle36120994a1.1
Daley, T. M., Freifeld, B. M., Ajo-Franklin, J., Dou, S., Pevzner, R., Shulakova, V., et al. (2013). Field testing of fiber-optic distributed acoustic sensing (DAS) for subsurface seismic monitoring. Lead Edge Capital Management, LLC. 32, 699–706. doi:10.1190/tle32060699.1
Eaton, D. W., and Forouhideh, F. (2011). Solid angles and the impact of receiver-array geometry on microseismic moment-tensor inversion. Geophysics 76 (6), WC77–WC85. doi:10.1190/geo2011-0077.1
Eaton, D. W., Ma, Y., Wang, C., and MacDougall, K. (2022). Effectiveness of dip-in DAS observations for low-frequency strain and microseismic analysis: The CanDiD experiment. 2022 SEG Technical Program Expanded Abstracts, 565–569. doi:10.1190/image2022-3745367.1
Eaton, D. W. (2018). Passive seismic imaging of induced seismicity: Fundamental principles and application to energy technologies. Cambridge, United States: Cambridge University Press.
Fard, E. H., Kahoo, A. R., Soleimani Monfared, M., Khayer, K., and Fard, A. A. (2022). Automatic seismic image segmentation by introducing a novel strategy in histogram of oriented gradients. Journal of Petroleum Science and Engineering. 209, 109971. doi:10.1016/j.petrol.2021.109971
Given, P., Huot, F., Lellouch, A., Luo, B., Clapp, R. G., Biondi, B. L., et al. (2022). Automatic microseismic event detection in downhole DAS data through convolutional neural networks: A comparison of events during and post-stimulation of the well. SEG Technical Program Expanded Abstracts, 1966–1969. doi:10.1190/image2022-3751887.1
Hartog, A. H. (2017). An introduction to distributed optical fibre sensors. Florida, United States: CRC Press.
Huot, F., Lellouch, A., Given, P., Clapp, R. G., Biondi, B. L., Nemeth, T., et al. (2021). Detecting microseismic events on DAS fiber with super-human accuracy. 2021 SEG Technical Program Expanded Abstracts, 3174–3178. doi:10.1190/segam2021-3583060.1
Jin, G., and Roy, B. (2017). Hydraulic-fracture geometry characterization using low-frequency DAS signal. Lead Edge Capital Management, LLC. 36 (12), 975–980. doi:10.1190/tle36120975.1
Karrenbach, M., Cole, S., Ridge, A., Boone, K., Kahn, D., Rich, J., et al. (2019). Fiber-optic distributed acoustic sensing of microseismicity, strain and temperature during hydraulic fracturing. Geophysics 84 (1), D11–D23. doi:10.1190/geo2017-0396.1
Khayer, K., Fard, E. H., Kahoo, A. R., Soleimani Monfared, M., Khayer, K., and Fard, A. A. (2022a). Integration of feature extraction, attribute combination and image segmentation for object delineation on seismic images. Acta Geophysica. 71, 275–292. doi:10.1007/s11600-022-00921-5
Khayer, K., Kahoo, A. R., Soleimani Monfared, M., and Kavouosi, K. (2022b). Combination of seismic attributes using graph-based methods to identify the salt dome boundary. Journal of Petroleum Science and Engineering. 215, 110625. Part A. doi:10.1016/j.petrol.2022.110625
Khayer, K., Kahoo, A. R., Soleimani Monfared, M., Tokhmechi, B., and Kavousi, K. (2022c2022). Target-Oriented fusion of attributes in data level for salt dome geobody delineation in seismic data. Natural Resources Research. 31 (5), 2461–2481. doi:10.1007/s11053-022-10086-z
LeCun, Y., Boser, B., Denker, J. S., Henderson, D., Howard, R. E., Hubbard, W., et al. (1989). Backpropagation applied to handwritten zip code recognition. Neural Computation. 1, 541–551. doi:10.1162/neco.1989.1.4.541
Lellouch, A., Lindsey, N. J., Ellsworth, W. L., and Biondi, B. L. (2020b). Comparison between distributed acoustic sensing and geophones: Downhole microseismic monitoring of the FORGE geothermal experiment. Seismological Research Letters. 91, 3256–3268. doi:10.1785/0220200149
Lellouch, A., MarkMeadowsNemeth, A. T., and Biondi, B. (2020a). Fracture properties estimation using distributed acoustic sensing recording of guided waves in unconventional reservoirs. Geophysics 85, M85–M95. doi:10.1190/geo2019-0793.1
Lim Chen Ning, I., and Sava, P. (2018). High-resolution multi-component distributed acoustic sensing. Geophysical Prospecting. 66, 1111–1122. doi:10.1111/1365-2478.12634
Luo, B., Jin, G., and Staněk, F. (2021). Near-field strain in distributed acoustic sensing-based microseismic observation. Geophysics 86 (5), P49–P60. doi:10.1190/geo2021-0031.1
Ma, Y., Cao, S., Rector, J. W., and Zhang, Z. (2020). Automated arrival-time picking using a pixel-level network. Geophysics 85 (5), V415–V423. doi:10.1190/geo2019-0792.1
Ma, Y., Eaton, D. W., and Wang, C. (2022). Fracture imaging using DAS-recorded microseismic reflections. SEG Technical Program Expanded Abstracts, 587–591. doi:10.1190/image2022-3745381.1
Ma, Y., Igonin, N., Wang, C., and Eaton, D. W. (2021). “Comparison of multi-well distributed acoustic sensing and three-component geophones for microseismic monitoring,” in AGU Fall Meeting, New Orleans, United States, December 2021.
Mafakheri, J., Kahoo, A. R., Anvari, R., Mohammadi, M., Radad, M., and Soleimani Monfared, M. (2022). Expand dimensional of seismic data and random noise attenuation using low-rank estimation. Journal of Selected Topics in Applied Earth Observations and Remote Sensing. 15, 2773–2781. doi:10.1109/JSTARS.2022.3162763
Mahdavi, A., Kahoo, A. R., Radad, M., and Soleimani Monfared, M. (2021). Application of the local maximum synchrosqueezing transform for seismic data. Digital signal processing. 110, 102934. doi:10.1016/j.dsp.2020.102934
Mateeva, A., Lopez, J., Mestayer, J., Wills, P., Cox, B., Kiyashchenko, D., et al. (2013). Distributed acoustic sensing for reservoir monitoring with VSP. Lead Edge Capital Management, LLC 32, 1278–1283. doi:10.1190/tle32101278.1
Maxwell, S. C. (2014). Microseismic imaging of hydraulic fracturing: Improved engineering of unconventional shale reservoirs: Seg. Distinguished Instructor Series. 17. doi:10.1190/1.9781560803164
Richter, P., Parker, T., Woerpel, C., Wu, Y., Rufino, R., and Farhadiroushan, M. (2019). Hydraulic fracture monitoring and optimization in unconventional completions using a high-resolution engineered fibreoptic distributed acoustic sensor. First Break 37, 63–68. doi:10.3997/1365-2397.n0021
Rodriguez, I., and Wuestefeld, A. (2020). Strain microseismics: Radiation patterns, synthetics and moment tensor resolvability with distributed acoustic sensing in isotropic media. Geophysics 85, KS101–KS114. doi:10.1190/geo2019-0373.1
Ronneberger, O., Fischer, P., and Brox, T. (2015). “U-Net: Convolutional networks for biomedical image segmentation,” in Medical image computing and computer-assisted intervention – miccai 2015. Editors N. Navab, J. Hornegger, W. Wells, and A. Frangi (Berlin, Germany: Springer), 9351. Lecture Notes in Computer Science. doi:10.1007/978-3-319-24574-4_28
Rutledge, J., and Soma, N. (2013). “Using reflected phases to improve depth resolution of microseismic source locations from single-well observations,” in Unconventional Resources Technology Conference, Denver, Colorado, 12-14 August 2013. URTEC-1578994-MS. doi:10.1190/urtec2013-024
Stork, A., Baird, A., Horne, S., Naldrett, G., Lapins, S., Kendall, J.-M., et al. (2020). Application of machine learning to microseismic event detection in distributed acoustic sensing data. Geophysics 85, KS149–KS160. doi:10.1190/geo2019-0774.1
Verdon, J., Horne, S., Clarke, A., Stork, A., Baird, A., and Kendall, J.-M. (2020). Microseismic monitoring using a fiber-optic distributed acoustic sensor (DAS) array. Geophysics 85 (3), 85KS89–KS99. doi:10.1190/geo2019-0752.1
Wang, C., Ma, Y., Eaton, D., MacDougall, K., and Furlong, C. (2022). “Hydraulic fracture monitoring using distributed acoustic sensing: A case study using dip-in fiber,” in The SPE/AAPG/SEG Unconventional Resources Technology Conference, Texas, United States, June, 2022. URTEC-3723692-MS. doi:10.15530/urtec-2022-3723692
Wu, H., Zhang, B., Lin, T., Cao, D., and Lou, Y. (2019a). Semiautomated seismic horizon interpretation using the encoder-decoder convolutional neural network. Geophysics 84 (6), B403–B417. doi:10.1190/geo2018-0672.1
Wu, X., Liang, L., Shi, Y., and Fomel, S. (2019b). FaultSeg3D: Using synthetic data sets to train an end-to-end convolutional neural network for 3D seismic fault segmentation. Geophysics 84 (3), IM35–IM45. doi:10.1190/geo2018-0646.1
Zhang, Z., DiSiena, J., Bevc, D., Lim Chen NingTan, I. Y., Swafford, L., Craven, M., et al. (2021). “Hydraulic fracture characterization by integrating multidisciplinary data from the hydraulic fracturing test site 2 (HFTS-2),” in Unconventional Resources Technology Conference, Texas, United States, July 2021. doi:10.15530/urtec-2021-5039
Zhang, Z., Fang, Z., Stefani, J., DiSiena, J., Bevc, D., Lim Chen Ning, I., et al. (2020). Modeling of fiber-optic strain responses to hydraulic fracturing. Geophysics 85, A45–A50. doi:10.1190/geo2020-0083.1
Keywords: distributed acoustic sensing (DAS), data analysis, microseismic (MS) monitoring, machine learning (ML), event detection, arrival time picking, hydraulic fracture (HF)
Citation: Ma Y, Eaton D, Igonin N and Wang C (2023) Machine learning-assisted processing workflow for multi-fiber DAS microseismic data. Front. Earth Sci. 11:1096212. doi: 10.3389/feart.2023.1096212
Received: 11 November 2022; Accepted: 10 January 2023;
Published: 07 February 2023.
Edited by:
Wenzhuo Cao, Imperial College London, United KingdomReviewed by:
Mohammad Radad, Shahrood University of Technology, IranKeyvan Khayer, Shahrood University of Technology, Iran
Amin Roshandel Kahoo, Shahrood University of Technology, Iran
Copyright © 2023 Ma, Eaton, Igonin and Wang. This is an open-access article distributed under the terms of the Creative Commons Attribution License (CC BY). The use, distribution or reproduction in other forums is permitted, provided the original author(s) and the copyright owner(s) are credited and that the original publication in this journal is cited, in accordance with accepted academic practice. No use, distribution or reproduction is permitted which does not comply with these terms.
*Correspondence: Yuanyuan Ma, eXVhbnl1YW4ubWFAdWNhbGdhcnkuY2E=, eW01MEByaWNlLmVkdQ==