 Junzu Ma
 Jiaxu Jin*
94% of researchers rate our articles as excellent or good
Learn more about the work of our research integrity team to safeguard the quality of each article we publish.
Find out more
ORIGINAL RESEARCH article
Front. Earth Sci., 20 January 2023
Sec. Petrology
Volume 11 - 2023 | https://doi.org/10.3389/feart.2023.1095686
Rocks in Northwest China are often affected by the combined action of freeze-thaw and load erosion. Therefore, in order to better understand the mechanical properties of rocks in seasonal frozen areas and the meso-damage caused by freeze-thaw erosion, uniaxial compression tests, electron microscope scanning tests, X-ray diffraction tests (XRD) and mercury intrusion tests (MIP) were carried out on five sandstone samples with different freeze-thaw times, and the mechanical parameters and meso-damage characteristics of sandstone samples with different freeze-thaw times were obtained. Fractal theory was used to analyze the change in pore volume of sandstone after freeze-thaw cycles. Finally, the damage constitutive equation under the coupling action of freeze-thaw damage and load was established based on Lemaitre’s equivalent effect variation criterion. The results showed that the type of sandstone is a porous coarse-grained sandstone. With the increased freeze-thaw times, the compressive strength and cohesion of sandstone gradually decreased, and the closed pores in sandstone gradually connected, leading to the visible internal macroscopic cracks. Affected by freeze-thaw times, the volume proportion of large pores (100–1,000 µm) in sandstone gradually increased, while the volume proportion of micropores (.05–100 µm) gradually decreased. With the increased freeze-thaw times, the fractal dimension of pore volume decreased from 1.94 to 1.59. The theoretical curve can better fit the characteristic points of the stress-strain curve, which can further reveal the damage mechanism of sandstone under the coupling effects of freeze-thaw and load. The minimum error between the peak point of the experimental curve and the theoretical curve is 3.3%.
Rock masses in cold regions, are often damaged by freeze-thaw effects every year. The reduction in rock bearing capacity and volumetric deformation caused by freeze-thaw erosion may pose a potential safety hazard in engineering, such as tunnel lining cracks, exfoliations of some structures (Xu et al., 2021), instability of open pit slopes (Hong et al., 2021), and even landslide and collapse (Chen et al., 2021). With the development of Qinghai-Tibet railway project in cold regions, many natural disasters such as landslides have occurred as a result of the instability of rock slopes caused by freeze-thaw effects, posing significant safety risks in railway construction and transportation. In Northwestern China, not only is the railway subgrade slope prone to freeze-thaw erosion, but also is the difficulty of excavation exacerbated in tunnel engineering due to the bearing strength decrease of rock mass resulting from constant fluctuation of the temperature field (Peng et al., 2020). The freeze-thaw damage of rock is mainly caused by the 9% volume expansion of the water-ice phase (Zhou et al., 2015). As a result, studying the damage and erosion extent of rocks under freeze-thaw conditions is critical.
In the past decades, experts had studied the mechanisms of freeze-thaw damage of rocks in depth, including mechanical strength, P wave velocity, pore diameter and quantity, etc. (Li et al., 2018; Ma et al., 2018). After numerous freeze-thaw times, the physical and mechanical properties of rocks were found to steadily deteriorate. The number of pores was observed to grow as a result of the volume expansion caused by the water-ice phase transformation (Niu et al., 2021; Yang et al., 2021). Furthermore, numerous mechanical parameters, such as peak stress and elastic modulus, can be employed as criteria for analyzing freeze-thaw damage from a macro perspective (Fang et al., 2019; Zhang et al., 2020). The large attenuation of rock strength represents the continuous superposition of internal damage of rocks (Gao et al., 2021). Through the pore size distribution, the process of ice crystals penetrating the pore network can be described in more detail, which is also the key to further understanding the damage of rock caused by freeze-thaw erosion. Liu et al. (2019) thought that freeze-thaw times lead to pore radius expansion, and the radius of these expansion pores was mainly concentrated on 0–40 μm. Song et al. (2021) used C-T scanning technology to perform layered scanning of freeze-thaw times of rock, which found that as the number of freeze-thaw times increased, the volume fraction of internal macropores increased rapidly. Niu et al. (2021) observed the mesostructure of freeze-thaw sandstone by scanning electron microscopy and concluded that the smoothness of the sandstone interior played a dominant role in rock failure.
Fractal dimension theory is frequently utilized by academics to examine the irregular evolution of pores in rock mass and to quantitatively describe the complexity of pore structure. There are numerous ways to determine the fractal dimension, including experiments using nitrogen adsorption and mercury intrusion. By using the water saturation method and the mercury saturation method, Wang et al. (2020) determined the fractal dimension of tight sandstone. According to this study, the fractal dimension determined using the mercury saturation method has a strong link with the reservoir’s pore structure and may accurately characterize that structure in sandstone reservoirs. Dong et al. (2019) obtained relevant pore structure parameters through the digital rock model built and quantitatively analyzed the pore structure in the rock with the fractal theory of porous media. It is believed that the pore fractal dimension of the whole rock is related to porosity, permeability, and the average pore radius. By using the nitrogen adsorption method, the pore size distribution and pore structure parameters of several types of rocks were determined. This study took into account that the uneven shape of the pore surface was more significant the larger the fractal dimension was. According to the fractal theory, the primary variables determining porosity and permeability are pore size and pore distribution (Xu et al., 2022). Lin et al. (2022) studied the pore structure and heterogeneity of tight rocks by combining digital rock technology with fractal theory. The study held that the larger the porosity of tight sandstone was, the larger the fractal dimension was, and that the fractal dimension of tight sandstone was less affected by isolated pores. Wei et al. (2019) analyzed the pore structure of carbonate rocks based on fractal theory. The results showed that the fractal dimensions of macropores and mesopores were high. The total fractal dimension of sample pores was negatively correlated with the maximum mercury saturation, and the pore diameter was also negatively correlated with the fractal dimension.
Experts have conducted qualitative and quantitative investigations into the damage to rocks produced by water-ice phase transformation in the freeze-thaw times based on damage mechanics theory. Based on the statistical theory and maximum tensile strain yield criterion, the damage constitutive equation under freeze-thaw load was derived by Huang et al. (2018) to examine the stability of rock masses under thermal-hydraulic coupling. Lu et al. (2019) established the damage evolution equation of freeze-thaw sandstone under load based on Lemaitre’s equivalent strain principle and continuous damage mechanics theory, and utilized this model to estimate the triaxial compressive strength attenuation of single-defect sandstone. Yao (2020) based on parabolic strength criterion and strain equivalent principle, established a statistical damage constitutive model considering pore compaction stage and residual deformation stage. However, experts gradually realized through their research that rock freeze-thaw damage was primarily caused by internal pore changes (Jia et al., 2020). Park et al. (2014) carried out freeze-thaw g tests on saturated diorite, basalt and tuff, and summarized the change rule of microstructure with the freeze-thaw times. The analysis shown that the increase of freeze-thaw times caused the falling off of the internal particles of the rock, and the continuous expansion and appearance of internal cracks, so that the porosity increased. Hou et al. (2021) summarized the evolution process of the microstructure of anhydrite rock by a descriptive-behavioral model, and concluded that the proportion of macropores and mesopores increased with the increase of freeze-thaw times. Zhou et al. (2017) obtained the change rule of pore diameter by NMR experiments: With the increase of freeze-thaw times, the pores of sandstone expanded, but the difference between pore diameter gradually decreased. Indirect ways to study the freeze-thaw damage of rocks including studies from the perspectives such as strength attenuation and other mechanical parameters (Kahanlari et al., 2014), while the relationship between the evolution law of rock pores and the damage mechanism after freeze-thaw times could directly reflect the freeze-thaw damage. The number of pores in rocks determined its water content in a saturated state (Chao et al., 2020).
Freeze-thaw damage has always been a topic of concern in engineering. Most of the damage variables in the constitutive model of rock freeze-thaw damage in previous studies were the change of mechanical parameters, which analyzed the damage from a macro perspective. In fact, the fundamental cause of rock damage is the continuous evolution of its internal pores. In order to reflect the damage of freeze-thaw rock more directly and reveal its long-term freeze-thaw damage mechanism, this paper first analyzed the mineral composition of sandstone in this region by X-ray diffraction, and then carried out uniaxial compression, electron microscope scanning and mercury intrusion test on sandstone samples under freeze-thaw times up to 40. The mechanical properties and internal microstructure of sandstone after freeze-thaw were analyzed, and the influence of freeze-thaw times on the strength and microstructure of sandstone was discussed. Based on the Lemaitre’s equivalent strain criterion, a rock damage model under load and freeze-thaw action was established from the microscopic perspective of pore volume change. On the one hand, the mass change of saturated rock after freeze-thaw times was regarded as the new-added pore volume, and through the conversion of water mass and volume, the mass change of saturated rock after freeze-thaw times was regarded as the freeze-thaw damage variable. On the other hand, according to the D-P strength criterion, the strength of each unit follows Weibull distribution function, and the experimental data obtained from uniaxial compression test were compared with that from the established multi-scale damage model to verify the rationality of the model.
In order to study the damage characteristics of sandstone under freeze-thaw times and load coupling, eight sandstone samples with different freeze-thaw times were designed to verify the accuracy of the model. The sandstone used in this test was derived from a sedimentary rock under a rock wall in northwest China, as shown in Figure 1A. The dry density of the sandstone was 2.4 g/cm3, and the saturation density was 2.5 g/cm3. The sandstone samples were made into cylinders with a diameter of 50 mm and a height of 100 mm. The upper and lower surfaces of the cylinder sample were polished to ensure that the flatness be less than .05 mm, as shown in Figure 1B. In order to truly restore the effects of freeze-thaw time on the bearing capacity of sandstone in water flow for a long time, the sandstone samples were saturated by vacuum saturation method firstly, as shown in Figure 1C. Secondly, the saturated samples were subjected to freeze-thaw times. Because the lower part of the rock mass was always contacted with water, the samples also were put into water for melting. The process is shown in Figure 1D.
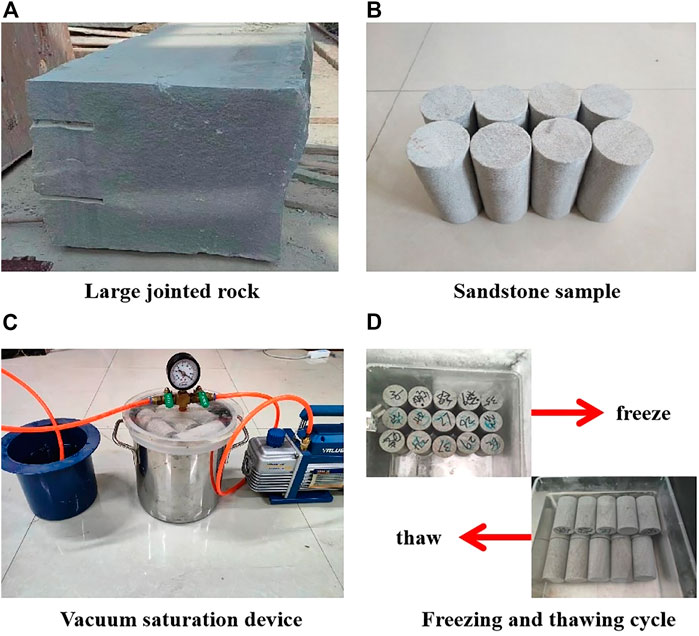
FIGURE 1. Preparation of freeze-thaw sandstone samples.
The uniaxial testing system adopted is shown in Figure 2A. To analyze the influence of freeze-thaw times on mechanical properties of sandstone more accurately, sandstone samples were divided into four groups according to the number of freeze-thaw times (10, 20, 30, 40). The freezing temperature was set to −20°C in the freeze-thaw time test, while the melting temperature was fixed at 20°C. The samples were ensured to be below the water surface during the melting process. The TAW-2000 electro-hydraulic servo rock triaxial testing system was adopted for loading. The specific loading procedures were as follows: Firstly, the indenter of the device was lowered quickly; when it was about to contact the surface of the sample, the lowering speed of the indenter was slowed down. When the load value of the display became positive, the indenter was in full contact with the sample by default. Then, the displacement control method was used to load at a speed of .05 mm/min until the specimen lost its bearing capacity.
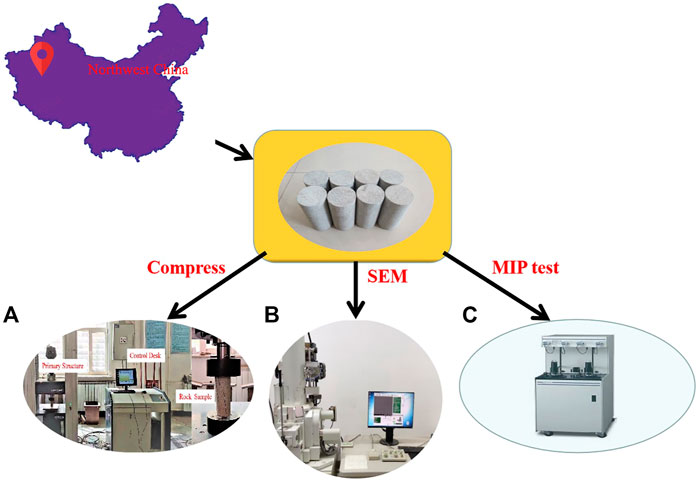
FIGURE 2. Main experimental instruments and processes.
The degree of internal pore structure development of sandstone with different freeze-thaw times was analyzed based on scanning electron microscope images. The interior of sandstone was porous structure, and there were many micro cracks after freeze-thaw times. When selecting samples, the fracture surfaces with micro-cracks was selected as far as possible. Firstly, the sample was cut and milled, and was made into a specimen with a length of about 5 mm × 5 mm × 2 mm. Then the specimen was placed in the electronic scanner for scanning. Finally, the focal length and magnification were continuously adjusted to obtain the scanning electron microscope images of the fracture surface with micro-cracks. The instrument used for scanning is shown in Figure 2B.
The instrument shown in Figure 2C used in the mercury injection test is automatic mercury porosimeter to measure the pore size of sandstones. The pores are assumed to be different cylindrical capillary tube bundles, then the relationship between the intrusion radius of pores and the mercury pressure can be expressed using the Washburn equation (Czachor et al., 2007).
Where pc is the capillary pressure, pHg surface tension of mercury, θ the wetting contact angle between the pore wall of stones and the mercury, and rc the radius of pores. Generally, pHg = .48 N/m. The contact angle θ between mercury and other substances ranges between 135° and 150°; therefore, the average value is typically 140°.
The mechanical properties of sandstone mainly depend on the internal mineral composition and the cementation force between them. The chemical composition of sandstone was analyzed by X-ray diffraction (XRD). As shown in Figure 3A, the sandstone is composed of quartz (27%), kaolinite (29.9%), plagioclase (32.7%) and a small amount of clay minerals (10.4%). The content of quartz, kaolinite and plagioclase accounts for nearly 90% of the total sample, so they are the main mineral compositions affecting the strength of sandstone. As shown in Figure 3B, these mineral particles are tightly cemented, forming a coarse cementation structure. According to the mineral content and cementation degree of sandstone, it can be determined that this type of sandstone belongs to porous coarse-grained sandstone, and the porous structure provides favorable conditions for freeze-thaw erosion. Therefore, it is of great significance to study the distribution of pore structure in porous sandstone after freeze-thaw erosion.
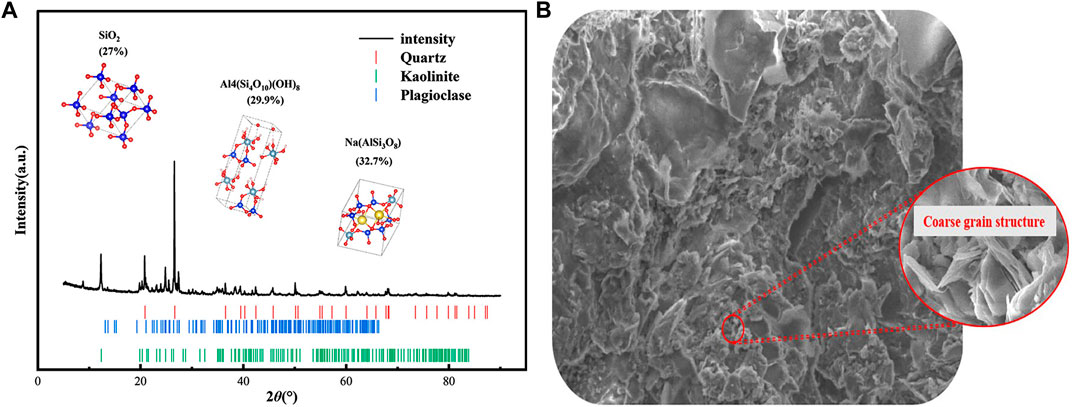
FIGURE 3. Mineral composition and sandstone type determined by XRD.
Figures 4A–C show the macro states of sandstone damaged by different freeze-thaw times. It can be observed in Figure 4A that the overall structure of sandstone without freeze-thaw times is dense and has high hardness due to the bonding force between mineral particles. After 20 freeze-thaw times (Figure 4B), due to the increased volume of water freezing into ice, the pores in sandstone expanded, and tiny cracks appeared on the surface of the sample. When the number of freeze-thaw times reached 40 (Figure 4C), the pores in the sandstone developed ultimately and were connected to produce new micro cracks. This is basically consistent with the research conclusion of Li. He believed that macroscopic cracks were rapidly developed and expanded under the effect of water-rock interaction and the frost heaving pressure (Li et al., 2019). Under freeze-thaw erosion, the bonding force between mineral particles decreased, resulting in the softening of the internal particle skeleton, and serious exfoliations could be observed on the lower surface of the sample. At this time, the sandstone was seriously eroded by freeze-thaw.
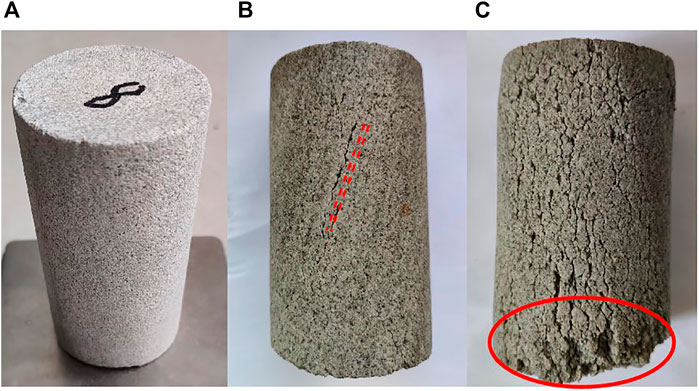
FIGURE 4. Complete rock sample and rock sample after freeze-thaw erosion [(A) 0 freeze-thaw time; (B) 20 freeze-thaw times; (C) 40 freeze-thaw times].
Because the electron microscope cannot detect the sample in a low-temperature state, samples with different freeze-thaw times were scanned at room temperature to investigate the local microstructure of sandstone. This paper compared the samples without freeze-thaw times and those with 40 freeze-thaw times from a micro perspective to highlight the impact of freeze-thaw damage, as seen in Figure 5.
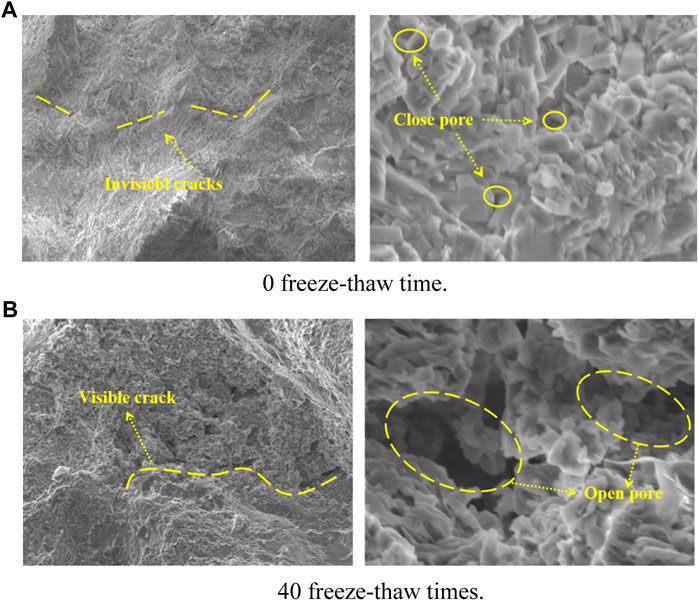
FIGURE 5. Microstructure of specimens before and after freeze-thaw times. [(A) 0 freeze-thaw time; (B) 40 freeze-thaw times].
In Figure 5A, the sample without freeze-thaw times has a whole surface, uniform particle distribution, and invisible internal cracks, and the internal pore diameter varies at room temperature and dry environment because of the bonding force between particles, but the pore arrangement is dense. For the samples subjected to freeze-thaw times after saturation, there was an adsorption force between water molecules and mineral particles, which made the particles surrounded by water molecules. During the freezing process, the frost heaving force generated by pore water solidification penetrated the interval between pores, making the porous structure inside the sandstone mesoporous and macroporous structure, which connects the whole particle skeleton as shown in Figure 5B. The growth of macropores might be the primary factor leading to freeze-thaw damage and strength loss (Huang et al., 2022). Moreover, due to the disappearance of the bonding force between particles, small particles were constantly scoured with the flow of water molecules, lacking mutual support between particles, increasing the plasticity of sandstone and reducing its bearing capacity.
The volume of mercury intrusion into the sample after different freeze-thaw times were shown in Figure 6. It can be observed that there are approximate three peak points. Ondrasik’s research suggested that it could be divided into nanopores (<.05 μm), micropores (.05–100 μm), macropores (100–1,000 μm) according to the pore size (Ondrášik et al., 2014). It could be seen in Figure 6 that with the increase of freeze-thaw times, the proportion of different pore sizes changed, the proportion of macropores gradually increased, and the proportion of micropore volume gradually approached 0.
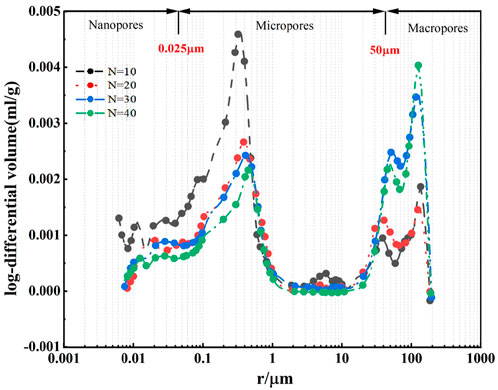
FIGURE 6. Mercury injection volume increment of each pore radius after different freeze-thaw times.
Table 1 showed the proportion of pore volume with different pore sizes, and the proportion of micropore volume decreased with the increase of freeze-thaw times. After 30 freeze-thaw times, the micropores (<.05 μm) became mesopores (.1–100 μm) and macropores (100–1,000 μm), and the volume growth rates were 10.03% and 10.47%, respectively. When the number of freeze-thaw times reached 40 times, the transformation form of micropores (<.05 μm) was mainly macropores, with an increase rate of 37.41%. This indicated that the freeze-thaw times made many tiny pores connect with each other and then develop into large pores. The relaxation period of sandstone was 1–100 ms at the initial stage of the freeze-thaw cycle, which suggested that the majority of the pores at this time are micropores, according to Li’s research on sandstone nuclear magnetic resonance imaging. The porosity of sandstone increased as the number of freeze-thaw cycles increased. The pore size of a sandstone sample increased with increasing freeze-thaw cycles. It demonstrated how the effect of freeze-thaw accelerated the expansion of the rock pores, which eventually grew from micropores to bigger pores (Li et al., 2016). Not only has the proportion of pore diameter changed after freeze-thawing cycles, but also has the roughness of the pores. In the study of freeze-thaw erosion of anhydrite rock, Hou et al. (2022) found that freeze-thaw erosion increased the roughness of microporous surfaces. The research of Ke et al. (2017) showed that with the increased freeze-thaw times, the pore volume expanded and the pore size distribution became more uniform, which further proved that freeze-thaw erosion could change the spatial distribution of pores in rock.
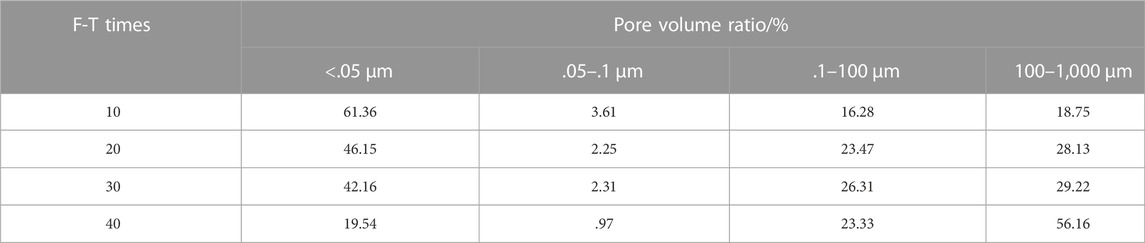
TABLE 1. Determination of pore size distribution after different freeze-thaw times by MIP test.
Cumulative pore volume in rock is difficult to obtain by testing, but (Ju et al., 2008) found the law of pore size distribution, Benavente et al. (1999) used optical microscope, electron microscope and mercury porosity measurement method to test the porosity of rock. All the data obtained could well confirm that the correlation between pore volume and radius satisfies an exponential relationship, as shown in the Eq. 2.
where F(r) represents the volume of pore accumulation with radius greater than r, and m is the characteristic parameter of pore distribution obtained from sandstone with different freeze-thaw times.
According to Figure 6, the sandstone had three significant peaks, so Eq. 2 became:
where V1, V2 and V3 represent the volume fraction of pores with different pore sizes. V1 + V2 + V3 = 1.
The aperture characteristics (m1, m2, m3) and their volume components (V1, V2, V3) can be determined by fitting the experimental data with Eq. 3, and a very good fitting coefficient was obtained, as shown in Figure 7. As the number of freeze-thaw times increased, the volume fraction of small pores gradually decreased, and the volume fraction of large pores increased significantly. It also showed that with the aggravation of freeze-thaw erosion, the form of pores was mainly macropores. Ice crystal pressure expands micropores into macropores.
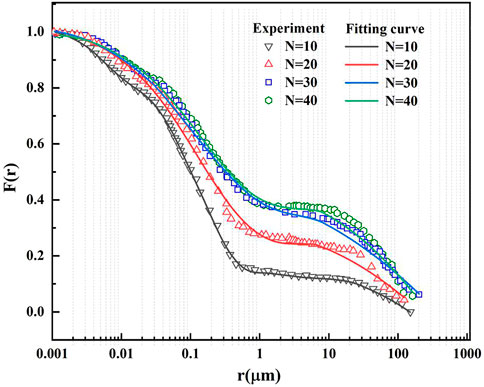
FIGURE 7. The volume components of pores after different freeze-thaw times.
The pore sizes of rock were different, and there were a certain number of pores in the multi-scale range, and the number of these pores was the main factor leading to different properties of sandstone. As a measure of irregularity of complex space, fractal dimension could well reflect the variation characteristics of sandstone pore size after freeze-thaw times. Therefore, fractal theory was introduced to qualitatively describe complex pore structure. The fractal dimension description of volume components of pores with different pore sizes obtained from mercury intrusion tests could be used to summarize the disorder degree and surface morphology of sandstone pore structure under different freeze-thaw times (Jin et al., 2020). The number of pores with a radius greater than r can be expressed as a function of Eq. 4 (Chen et al., 2019):
Where Df denotes the fractal dimension. N(r) is the number of pores with a pore size greater than r.
If the pores inside the sandstone were regarded as cylindrical capillaries, Eq. 4 became:
VHg(r) represents the content of mercury intrusion in pores with pore size greater than r, and l represents the length of cylindrical pores.
Using the logarithm form of Eq. 4, there is.
Equation 6 was a function expression about
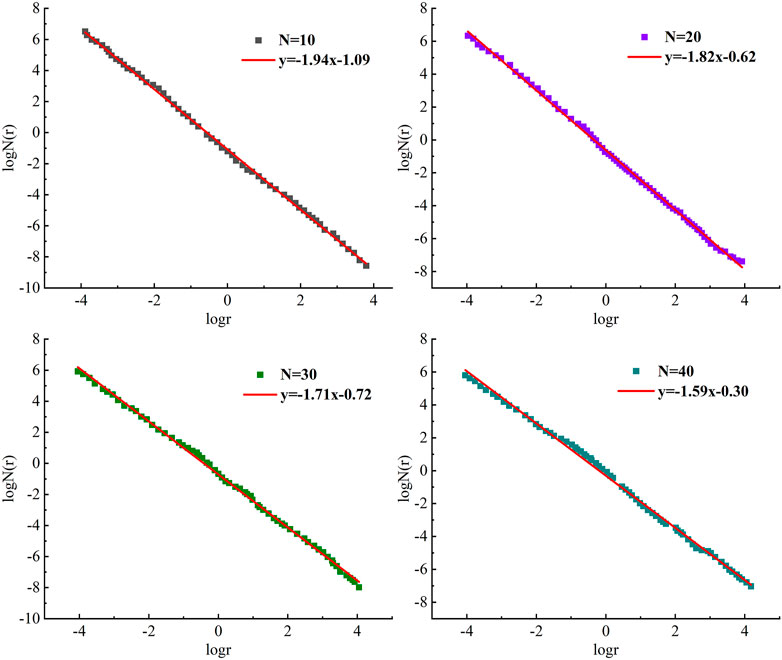
FIGURE 8. Fractal dimension of sandstone with different freeze-thaw times.
Sandstone is a sedimentary rock, mainly cemented by sand. The micro damage to sandstone increased with the increase of freeze-thaw times. The pore diameter inside the sandstone gradually increased. When the pore diameter increased to a certain extent, it began to connect, which aggravated the internal damage. Therefore, the damage variable is defined by the change of pore volume. The damage degree of sandstone DF is shown in Eq. 7.
Where DF represents the freeze-thaw damage variable, VN and VC represent pore volume after N freeze-thaw times and initial pore volume, respectively.
Sandstone overcomes the bonding force between particles under the action of load, which causes damage. Because the rock belongs to heterogeneous material, the strength distribution of internal particles is different, so the rock damage caused by the load is random. This paper assumed that the strength of each micro-element in sandstone conforms to Weibull distribution. Therefore, Eq. 8 defines the failure probability of sandstone.
Where P(F) is the probability density of the strength distribution of each micro-element in sandstone; F is the strength of each micro-element in sandstone; m and F0 are the parameters of the model distribution.
Under a certain load level, the damage generated in the rock is defined in Eq. 9.
The total damage variable in the freeze-thaw time coupled with load is:
In this study, the damage constitutive model of rock subjected to freeze-thaw times and load coupling is established based on following two assumptions:
(1) Microelement strength of rock meets Drucker-Prager criterion.
(2) Lemaitre’s strain equivalence principle is followed in solving macroscopic and microscopic damage under freeze-thaw times and load action.
Based on Drucker-Prager criterion, F can be expressed as:
Where I is the first invariant of effective stress; J2 is the second invariant of the effective stress deviation; α and K are only experimental constants related to the internal friction angle and the cohesive force c of rock, and their expressions are:
According to Lemaitre’s strain equivalence principle, the effective stress of rock materials can be replaced by nominal stress, and the stress-strain damage constitutive relationship of rock materials is established by introducing damage variables.
Where σ represents the nominal stress; σ* represents the effective stress.
Damage is caused by two kinds of damage together (Qiao et al., 2021). According to the generalized Hooke’s law, the stress state of sandstone is:
By substituting Eqs 10, 11 into Eq. 17, we can get:
Where EN represents the elastic modulus of rock after freeze-thaw N times; ε1 and ε3 represent the nominal axial strain and transverse strain, respectively; μN represents Poisson’s ratio of rocks with different freeze-thaw times.
Suppose the peak stress of the stress-strain curve is σc, and the corresponding peak strain is εc. Based on the stress-strain curve under different freeze-thaw times and load coupling, according to the peak point method, σc and its corresponding εc should meet the following geometric conditions:
Derivation of Eq. 18 according to Eq. 19:
Simplified Eq. 20:
In the formula, Fc is the corresponding F value when σ1 = σc.
According to the extreme conditions in Eq. 18:
The expressions of model parameters m and F0 can be obtained by simultaneous equations Eqs 21, 22:
The constitutive model parameters after different freeze-thaw times were calculated according to the testing results. The values of each parameter are shown in Table 2. In order to obtain the theoretical curve under the coupling effect of load and freeze-thaw, as shown in Figure 9. The parameters of freeze-thaw sandstone samples were determined by mechanical tests and substituted into the constitutive equation (Eq. 18). Table 3 shows the theoretical curve’s peak strength as well as the peak strength determined by the uniaxial experiment. Figure 10 depicts the contrast and error between the theoretical peak stress and the actual peak stress.
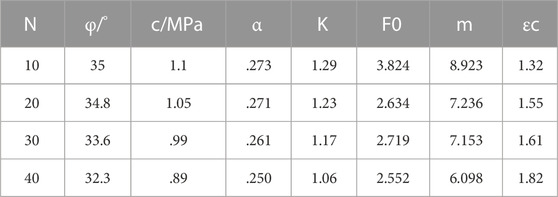
TABLE 2. Model parameters with different freeze-thaw times.
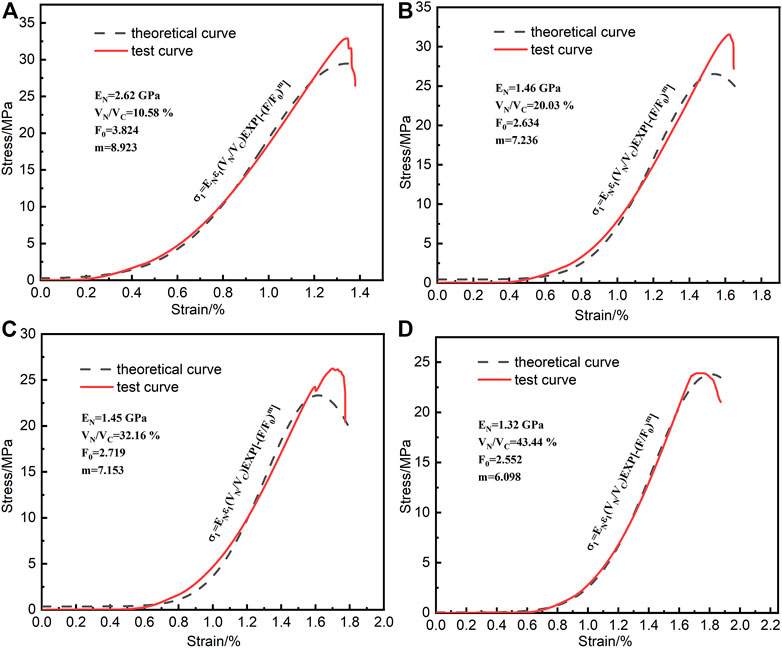
FIGURE 9. Comparison of freeze-thaw damage model and test data (A–D) represent 10, 20, 30, 40 freeze-thaw times, respectively.
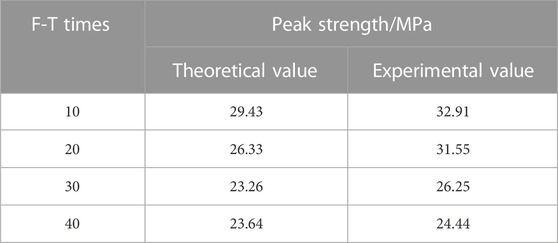
TABLE 3. Comparison between theoretical value and experimental value.
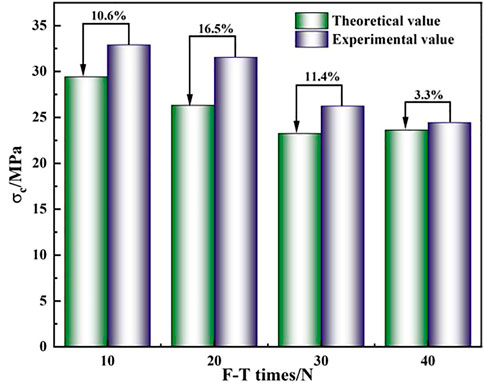
FIGURE 10. Comparison between theoretical value and actual value.
In Table 2, the variation of F0 and m shows that when freeze-thaw times rise, F0 falls from 3.824 to 2.552 and m from 8.923 to 6.098. At this time, the sandstone sample’s failure strain rises from 1.32 to 1.82. As a result, F0 and m can, to some extent, reflect the ductility of sandstone. Sandstone becomes more ductile as the parameter decreases.
The constitutive equation fitted according to the experimental parameters can accurately reflect the four stages of compaction, elasticity, yield and failure experienced by the rock in the process of uniaxial compression. The theoretical curve has a high degree of agreement with the experimental curve. The maximum error between the theoretical value and the actual value of the peak stress is 16.5% (N = 20), and the minimum is 3.3% (N = 10). The reason for the error may be that there is a discrepancy between the strength of the Weibull randomly distributed rock unit in theory and the strength of the actual unit. Since sandstone is an anisotropic material, the theoretical curve has a specific reference value for the strength of the actual sandstone.
This study examines how freeze-thaw cycles affect the pore structure, macroscopic physical characteristics, and mechanical properties of sandstone. A damage constitutive model is built under the coupling actions of freeze-thaw and load based on the Lemaitre equivalent strain criterion. The main novelty of this study is that it can establish the relationship between freeze-thaw damage and macroscopic and mesoscopic. Based on this research, the following conclusion can be drawn:
(1) From the macro perspective, the sandstone grain skeleton will become looser after the freeze-thaw cycle. When the number of freeze-thaw cycles reaches 40, the sandstone particles begin to peel off. From the mesoscale perspective, the pore volume in sandstone gradually increases after freeze-thaw erosion, and the pores are interconnected to form significant fractures.
(2) According to their size, the pores in sandstone can be classified as nanopores, micropores, and macropores. After freeze-thaw cycles, the pore size of all types of pores is increasing. Many micropores expand and connect to form large pores. The pore structure of sandstone is dominated by macropores, and the volume fraction increases from 18.75% (N = 10) to 56.61% (N = 40). The volume fraction of micropores decreases significantly.
(3) After freeze-thaw cycles, the pores in sandstone have obvious fractal characteristics. With the increase in freeze-thaw cycles, the fractal dimension decreases from 1.94 to 1.59, indicating that the pore structure becomes uniform. Additionally, the fractal dimension can be used to assess the severity of freeze-thaw damage and establish a link between microscopic damage and physico-mechanical characteristics.
(4) With the increase of freeze-thaw cycles, the peak strength of sandstone decreases from 32.91 to 24.44 MPa, and the cohesion decreases gradually. Based on the damage constitutive model in this paper, there is an error between the theoretical peak strength and the actual peak strength of sandstone; the minimum is 3.3%. The values of parameters F0 and m can reflect the ductility of sandstone, and the values of the two parameters gradually decrease with the increase in ductility.
The raw data supporting the conclusions of this article will be made available by the authors, without undue reservation.
For research articles with several authors, a short paragraph specifying their individual contributions must be provided. The following statements should be used “Conceptualization, JJ; methodology, JM; software; validation, PW and ZQ; formal analysis, JJ; writing—original draft preparation, JM; writing—review and editing, BJ; all authors have read and agreed to the published version of the manuscript.”
This research was funded by “National Nature Science Foundation of China,” grant numbers: 52274206, 51974145, and 51904144.
This study thanks the National Nature Science Foundation of China for its support.
The authors declare that the research was conducted in the absence of any commercial or financial relationships that could be construed as a potential conflict of interest.
All claims expressed in this article are solely those of the authors and do not necessarily represent those of their affiliated organizations, or those of the publisher, the editors and the reviewers. Any product that may be evaluated in this article, or claim that may be made by its manufacturer, is not guaranteed or endorsed by the publisher.
Bai, Y., Shan, R., Ju, Y., Wu, Y., Sun, P., and Wang, Z. (2019). Study on the mechanical properties and damage constitutive model of frozen weakly cemented red sandstone. Cold Regions Sci. Technol. 171, 102980. doi:10.1016/j.coldregions.2019.102980
Benavente, D., del Cura, M. A. G., Fort, R., and Ordonez, S. (1999). Thermodynamic modelling of changes induced by salt pressure crystallisation in porous media of stone. J. Cryst. growth 204, 168–178. doi:10.1016/S0022-0248(99)00163-3
Chao, Z., Ma, G., Hu, X., and Luo, G. (2020). Experimental research on stress-dependent permeability and porosity of compact sandstone with different moisture saturations. J. Nat. Gas Sci. Eng. 84, 103639. doi:10.1016/j.jngse.2020.103639
Chen, G., Wan, Y., Li, Y., Pei, X., and Huang, D. (2021). Time-dependent damage mechanism of rock deterioration under freeze–thaw cycles linked to alpine hazards. Nat. Hazards 108, 635–660. doi:10.1007/s11069-021-04699-5
Chen, Z., Chen, H., Li, J., and Ma, W. (2019). Study on the changing rules of silty clay’s pore structure under freeze-thaw cycles. Adv. Civ. Eng. 2019, 1–11. doi:10.1155/2019/7493872
Czachor, H. (2007). Applicability of the Washburn theory for determining the wetting angle of soils. Hydrological Process. Int. J. 21, 2239–2247. doi:10.1002/hyp.6753
Fang, W., Jiang, N., and Luo, X. (2019). Establishment of damage statistical constitutive model of loaded rock and method for determining its parameters under freeze-thaw condition. Cold Regions Sci. Technol. 160, 31–38. doi:10.1016/j.coldregions.2019.01.004
Gao, F., Xiong, X., Xu, C., and Zhou, K. (2021). Mechanical property deterioration characteristics and a new constitutive model for rocks subjected to freeze-thaw weathering process. Int. J. Rock Mech. Min. Sci. 140, 104642. doi:10.1016/j.ijrmms.2021.104642
Hong, Y., Shao, Z. S., Shi, G. B., Dou, Y., Wang, W. Q., and Zhang, W. (2021). Freeze-thaw effects on stability of open pit slope in high-altitude and cold regions. Geofluids 2021, 1–10. doi:10.1155/2021/8409621
Hou, C., Jin, X., and He, J. (2022). Investigation on the microscopic deterioration characteristics of anhydrite rock exposed to freeze–thaw cycles. Int. J. Geomechanics 22, 4022013. doi:10.1061/(asce)gm.1943-5622.0002328ASCEGM.1943-5622.0002328
Hou, C., Jin, X. G., He, J., and Li, H. L. (2021). Experimental studies on the pore structure and mechanical properties of anhydrite rock under freeze-thaw cycles. J. Rock Mech. Geotechnical Eng. 14, 781–797. doi:10.1016/j.jrmge.2021.10.005
Huaimin, D., Jianmeng, S., Likai, C., Naser, G., and Weichao, Y. (2019). Characteristics of the pore structure of natural gas hydrate reservoir in the Qilian Mountain Permafrost, Northwest China. J. Appl. Geophys. 164, 153–159. doi:10.1016/j.jappgeo.2019.03.005
Huang, S., Liu, Q., Cheng, A., and Liu, Y. (2017). A statistical damage constitutive model under freeze-thaw and loading for rock and its engineering application. Cold Regions Sci. Technol. 145, 142–150. doi:10.1016/j.coldregions.2017.10.015
Huang, S., Yu, S., Ye, Y., Ye, Z., and Cheng, A. (2022). Pore structure change and physico-mechanical properties deterioration of sandstone suffering freeze-thaw actions. Constr. Build. Mater. 330, 127200. doi:10.1016/j.conbuildmat.2022.127200
Jia, H., Ding, S., Zi, F., Dong, Y., and Shen, Y. (2020). Evolution in sandstone pore structures with freeze-thaw cycling and interpretation of damage mechanisms in saturated porous rocks. Catena 195, 104915. doi:10.1016/j.catena.2020.104915
Jin, S., Zheng, G., and Yu, J. (2020). A micro freeze-thaw damage model of concrete with fractal dimension. Constr. Build. Mater. 257, 119434. doi:10.1016/j.conbuildmat.2020.119434
Ju, Y., Yang, Y. M., Song, Z. D., and Xu, W. (2008). A statistical model for porous structure of rocks. Sci. China Ser. E Technol. Sci. 51, 2040–2058. doi:10.1007/s11431-008-0111-z
Ke, B., Zhou, K., Deng, H., and Bin, F. (2017). NMR pore structure and dynamic characteristics of sandstone caused by ambient freeze-thaw action. Shock Vib. 2017, 1–10. doi:10.1155/2017/9728630
Khanlari, G., Sahamieh, R. Z., and Abdilor, Y. (2014). The effect of freeze–thaw cycles on physical and mechanical properties of Upper Red Formation sandstones, central part of Iran. Arabian J. Geosciences 8, 5991–6001. doi:10.1007/s12517-014-1653-y
Li, J., Zhou, K., Liu, W., and Deng, H. w. (2016). NMR research on deterioration characteristics of microscopic structure of sandstones in freeze–thaw cycles. Trans. Nonferrous Metals Soc. China 26, 2997–3003. doi:10.1016/S1003-6326(16)64430-8
Li, J., Kaunda, R. B., and Zhou, K. (2018). Experimental investigations on the effects of ambient freeze-thaw cycling on dynamic properties and rock pore structure deterioration of sandstone. Cold Regions Sci. Technol. 154, 133–141. doi:10.1016/j.coldregions.2018.06.015
Li, J. L., Zhu, L. Y., Zhou, K. P., Liu, H. W., and Cao, S. P. (2019). Damage characteristics of sandstone pore structure under freeze-thaw cycles. Rock Soil Mech. 40, 3524–3532. doi:10.16285/j.rsm.2018.1066
Lin, W., Wu, Z., Li, X., Yang, Z., Hu, M., Han, D., et al. (2022). Digital characterization and fractal quantification of the pore structures of tight sandstone at multiple scales. J. Petroleum Explor. Prod. Technol. 2022, 2565–2575. doi:10.1007/s13202-022-01502-4
Liu, B., Ma, Y., Liu, N., Han, Y., Li, D., and Deng, H. (2019). Investigation of pore structure changes in Mesozoic water-rich sandstone induced by freeze-thaw process under different confining pressures using digital rock technology. Cold Regions Sci. Technol. 161, 137–149. doi:10.1016/j.coldregions.2019.03.006
Liu, K., and Ostadhassan, M. (2017). Multi-scale fractal analysis of pores in shale rocks. J. Appl. Geophys. 140, 1–10. doi:10.1016/j.jappgeo.2017.02.028
Lu, Y., Li, X., and Chan, A. (2019). Damage constitutive model of single flaw sandstone under freeze-thaw and load. Cold Regions Sci. Technol. 159, 20–28. doi:10.1016/j.coldregions.2018.11.017
Ma, Q., Ma, D., and Yao, Z. (2018). Influence of freeze-thaw cycles on dynamic compressive strength and energy distribution of soft rock specimen. Cold Regions Sci. Technol. 153, 10–17. doi:10.1016/j.coldregions.2018.04.014
Niu, C., Zhu, Z., Zhou, L., Li, X., Ying, P., Dong, Y., et al. (2021). Study on the microscopic damage evolution and dynamic fracture properties of sandstone under freeze-thaw cycles. Cold Regions Sci. Technol. 191, 103328. doi:10.1016/j.coldregions.2021.103328
Ondrášik, M., and Kopecký, M. (2014). Rock pore structure as main reason of rock deterioration. Studia geotechnica Mech. 36, 79–88. doi:10.2478/sgem-2014-0010
Park, J., Hyun, C.-U., and Park, H.-D. (2015). Changes in microstructure and physical properties of rocks caused by artificial freeze–thaw action. Bull. Eng. Geol. Environ. 74, 555–565. doi:10.1007/s10064-014-0630-8
Peng, X., Yimin, W., Zijian, W., and Le, H. (2020). Distribution laws of freeze-thaw cycles and unsaturated concrete experiments in cold-region tunnels. Cold Regions Sci. Technol. 172, 102985. doi:10.1016/j.coldregions.2019.102985
Qiao, C., Li, C., Wang, Y., Yang, H., and Song, Z. (2021). Research on macro and meso damage model of pre-flawed granites subjected to coupling action of freeze-thaw and loading. Arabian J. Geosciences 14, 1083–1114. doi:10.1007/s12517-021-07308-8
Song, Y., Tan, H., Yang, H., Chen, S., Che, Y., and Chen, J. (2021). Fracture evolution and failure characteristics of sandstone under freeze-thaw cycling by computed tomography. Eng. Geol. 294, 106370. doi:10.1016/j.enggeo.2021.106370
Wang, J., Wu, S., Li, Q., and Guo, Q. (2020). An investigation into pore structure fractal characteristics in tight oil reservoirs: A case study of the triassic tight sandstone with ultra-low permeability in the ordos basin, China. Arabian J. Geosciences 13, 961–1016. doi:10.1007/s12517-020-05928-0
Wei, D., Gao, Z., Zhang, C., Fan, T., Karubandika, G. M., and Meng, M. (2019). Pore characteristics of the carbonate shoal from fractal perspective. J. Petroleum Sci. Eng. 174, 1249–1260. doi:10.1016/j.petrol.2018.11.059
Xu, P., Wu, Y., Huang, L., and Zhang, K. (2021). Study on the progressive deterioration of tunnel lining structures in cold regions experiencing freeze–thaw cycles. Appl. Sci. 11, 5903. doi:10.3390/app11135903
Xu, S., Yang, Z., Wu, S., Wang, L., Wei, W., Yang, F., et al. (2022). Fractal analysis of pore structure differences between shale and sandstone based on the nitrogen adsorption method. Nat. Resour. Res. 31, 1759–1773. doi:10.1007/s11053-022-10056-5
Yang, C., Zhou, K., Xiong, X., Deng, H., and Pan, Z. (2021). Experimental investigation on rock mechanical properties and infrared radiation characteristics with freeze-thaw cycle treatment. Cold Regions Sci. Technol. 183, 103232. doi:10.1016/j.coldregions.2021.103232
Zhang, H., Meng, X., and Yang, G. (2020). A study on mechanical properties and damage model of rock subjected to freeze-thaw cycles and confining pressure. Cold Regions Sci. Technol. 174, 103056. doi:10.1016/j.coldregions.2020.103056
Keywords: mechanical properties, meso-damage, sandstone, freeze-thaw times, fractal theory, damage constitutive
Citation: Ma J, Jin J, Wu P, Qin Z and Jia B (2023) Study on the pore structure characteristics and damage constitutive model of sandstone under freeze-thaw conditions. Front. Earth Sci. 11:1095686. doi: 10.3389/feart.2023.1095686
Received: 11 November 2022; Accepted: 09 January 2023;
Published: 20 January 2023.
Edited by:
Zhentao Dong, China University of Petroleum, Huadong, ChinaReviewed by:
Shaofei Wang, Shaanxi University of Technology, ChinaCopyright © 2023 Ma, Jin, Wu, Qin and Jia. This is an open-access article distributed under the terms of the Creative Commons Attribution License (CC BY). The use, distribution or reproduction in other forums is permitted, provided the original author(s) and the copyright owner(s) are credited and that the original publication in this journal is cited, in accordance with accepted academic practice. No use, distribution or reproduction is permitted which does not comply with these terms.
*Correspondence: Jiaxu Jin, amluamlheHVASW50dS5lZHUuY24=
Disclaimer: All claims expressed in this article are solely those of the authors and do not necessarily represent those of their affiliated organizations, or those of the publisher, the editors and the reviewers. Any product that may be evaluated in this article or claim that may be made by its manufacturer is not guaranteed or endorsed by the publisher.
Research integrity at Frontiers
Learn more about the work of our research integrity team to safeguard the quality of each article we publish.