
95% of researchers rate our articles as excellent or good
Learn more about the work of our research integrity team to safeguard the quality of each article we publish.
Find out more
ORIGINAL RESEARCH article
Front. Earth Sci. , 07 March 2023
Sec. Volcanology
Volume 11 - 2023 | https://doi.org/10.3389/feart.2023.1095135
This article is part of the Research Topic Linking Subaqueous, Subglacial, and Subaerial Volcanism: How Water Influences Eruption Dynamics and Creation of Volcanic Products View all 10 articles
 Meagen Pollock1*
 Benjamin R. Edwards2
 Shelley Judge1
 Chloe Wallace1Alex Hiatt1
 Aleksander Perpalaj2
 Ellie Was2Steinunn Hauksdóttir3
Glaciovolcanic landforms provide global-scale records of paleoenvironmental conditions and yield insights into subglacial eruption processes. Models for the formation of glaciovolcanic ridges, or tindars, are relatively simple, proposing a monogenetic eruption and a fairly uniform stratigraphy with or without a single transition from effusive pillow lavas to explosive fragmental deposits. Others have suggested that tindars are more complicated. To build a more robust model for tindar formation, we conducted a field and geochemical study of Undirhlíðar ridge on the Reykjanes Peninsula in southwestern Iceland. We show that the ridge was built through a complex sequence of eruptive and intrusive events under dynamically changing ice conditions. Quarry walls expose a continuous cross-section of the ridge, revealing multiple pillow and fragmental units. Pillow lava orientations record the emplacement of discrete pillow-dominated lobes and the migration of volcanic activity between eruptive vents. Volatile contents in glassy pillow rinds show repeated pulses of pillow lava emplacement under glaciostatic conditions, with periods of fragmentation caused by depressurization. Variations in major elements, incompatible trace element ratios, and Pb-isotopes demonstrate that the eruption was fed from separate crustal melt reservoirs containing melts from a compositionally heterogeneous mantle source. A shift in mantle source signature of pillow lavas suggests that the primary ridge-building phase was triggered by the injection of magma into the crust. Within the growing edifice, magma was transported through dykes and irregularly shaped intrusions, which are up to 20% by area of exposed stratigraphy sequences. The model for tindar construction should consider the significant role of intrusions in the growth of the ridge, a detail that would be difficult to identify in natural erosional exposures. The 2021–22 eruptions from the adjacent Fagradalsfjall vents allow us to draw parallels between fissure-fed eruptions in subaerial and ice-confined environments and test hypotheses about the composition of the mantle underlying the Reykjanes Peninsula. Both Fagradalsfjall and Undirhlíðar ridge eruptions may have occurred over similar spatial and temporal scales, been triggered by mixing events, erupted lavas with varying mantle source signatures, and focused volcanic activity along migrating vents. Differences in composition between the two locations are not related to systematic lateral variations in the underlying mantle. Rather, the Undirhlíðar ridge and Fagradalsfjall eruptions capture complex interactions among the crustal magma plumbing system, mantle source heterogeneity, and melting conditions for a moment in time.
Glaciovolcanism creates global-scale records of paleoenvironmental conditions (Smellie and Edwards, 2016; Smellie, 2018) and magmatic-climatic system interactions. Dramatic glaciovolcanic eruptions in Iceland (Gjálp in 1996 and Eyjafjallajökull in 2010) have driven research on glaciovolcanism over the past 2 decades (Smellie and Edwards, 2016), yielding first-hand observations of the effects of the cryosphere on volcanic products (Edwards et al., 2022). Those products are used in paleoclimate studies to constrain the extent and thickness of past glaciers and ice sheets on Earth (e.g., Lescinsky and Fink, 2000; Smellie, 2008; Tuffen et al., 2010; Edwards et al., 2011) and on Mars (cf. Smellie and Edwards, 2016), and they provide critical insights into subglacial eruption dynamics, with implications for understanding flash flooding caused by rapid ice-melt (jökulhlaups) and other hazards related to volcano-ice interaction (Gudmundsson et al., 2008; Oddsson et al., 2016).
While globally significant, the details of glaciovolcanic eruptive processes are obscured by limited accessibility during active eruptions (Gudmundsson et al., 1997; Gudmundsson et al., 2004; Gudmundsson et al., 2012; Gudmundsson, 2005; Edwards et al., 2012; Oddsson et al., 2016). Much of our understanding derives from the parts of the eruption that break through the ice or from glaciovolcanic landforms that have been exposed by Holocene ice retreat, especially in Antarctica, Canada, and Iceland (e.g., Jones, 1969; Jones, 1970; Höskuldsson et al., 2006; Smellie et al., 2008; Edwards et al., 2009; Edwards et al., 2020). Even these insights are limited by the variability of erosion processes, which frequently provide limited views into edifice interiors and effectively restrict access to stratigraphic information.
Tindars are elongate glaciovolcanic ridges not capped by flat-lying lava flows (Jones, 1969; Smellie, 2007; Smellie, 2013; Jakobsson and Gudmundsson, 2008). Analogous to linear tuyas of Russell et al. (2014), tindars have a length to width ratio greater than 2:1 and consist of some combination of pillow lavas and tephra, depending on magmatic and ice conditions (Jakobsson and Gudmundsson, 2008; Russell et al., 2014). Most tindar formation models propose a monogenetic eruption under ice, with an initial pillow-building phase followed by a transition to explosive volcanic activity as water depth decreases (e.g., Jakobsson and Johnson, 2012). However, the complexity of pillow-dominated tindars has been demonstrated by detailed investigations of edifices that have been deeply dissected by erosion or other processes, such as mining (Jones, 1969; Jones, 1970; Höskuldsson et al., 2006; Edwards et al., 2009; Hungerford et al., 2014; Pollock et al., 2014). Lithofacies variations have been attributed to changes in lava effusion rate, shifts in the magma source region, and fluctuating lake levels caused by ice melt and the development of drainage systems (Moore et al., 1995; Höskuldsson et al., 2006; Edwards et al., 2009; Hungerford et al., 2014; Pollock et al., 2014; Oddsson et al., 2016). Some complex pillow-dominated tindars show sustained hydrostatic conditions and short-lived (e.g., weeks to months) eruptive activity (Hungerford et al., 2014; Wilson and Russell, 2017), yet others are constructed by repeated eruptive events over longer time scales (e.g., years to decades) (Edwards et al., 2009; Pollock et al., 2014). Edifice architecture can be further complicated by the migration of the eruptive vent during ridge formation and the emplacement of subglacial lava flows in ice tunnels (Hungerford et al., 2014; Oddsson et al., 2016).
To better understand the construction of pillow-dominated tindars, we conducted a comprehensive lithostratigraphic and geochemical study of Undirhlíðar ridge in southwestern Iceland. Quarries along the ridge provide exceptional views of the internal tindar architecture. Recent effusive activity at Fagradalsfjall, which is located adjacent to Undirhlíðar ridge, has provided a modern subaerial analogue for fissure eruptions in the region. Our results include maps of lateral and vertical stratigraphic variations, measurements of individual pillow lava orientations, geochemical (major, trace, volatiles, limited isotopes) characterization of all mappable lithologies, and models of magma evolution and paleo-ice conditions. We describe the formation of Undirhlíðar from magma source to volcanic edifice, exploring the complex relationships among paleo-ice conditions, the underlying magmatic system, and eruptive dynamics. Our findings reveal the emplacement mechanisms for a growing pillow lava pile and the effects of magmatic processes on the composition of the resulting edifice. We compare our model to the 2021–22 activity at nearby Fagradalsfjall, drawing new contrasts and parallels between fissure-fed eruptions in subaerial and ice-confined environments. Our work presents one of the most comprehensive geochemical and physical investigations of a single pillow-dominated tindar to date.
The Reykjanes Peninsula in southwestern Iceland links the submarine Reykjanes Ridge to Iceland’s Western Volcanic Zone through five en echelon NE-SW trending volcanic systems (Figure 1; Jakobsson et al., 1978; Saemundsson, 1979; Sæmundsson et al., 2020). The volcanic systems are delineated by geophysical patterns and structural features that show elongated swarms of dykes, fissures, faults, and craters that extend from central zones of magma upwelling and storage (Sæmundsson et al., 2020). Holocene volcanic activity has generally migrated from east to west across the volcanic systems, occurring periodically every ∼800–1,000 years (Sæmundsson et al., 2020). Eruptions along the volcanic systems during the last glacial maximum (26.5–19 ka Late Weichselian glaciation; Patton et al., 2017) produced NE-trending glaciovolcanic tindar ridges that stand out in relief among younger, post-glacial lava flows (<15 ka) emplaced in ice-free environments (Figure 1). Our study area is at the northern end of the Krýsuvík system.
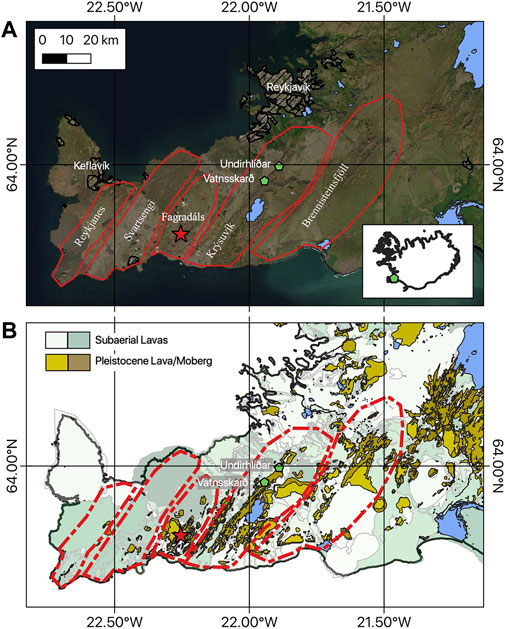
FIGURE 1. Location of field area. (A) Satellite image (ESRI Satellite plugin for QGIS) showing relevant parts of the Reykjanes Peninsula, including the 5 main fissures zones (Sæmundsson et al., 2020), the Fagradals eruption site, and the two quarries that bound the field area. (B) Same map elements as (A) but using geological mapping from ÍSOR to highlight glaciovolcanic (brown shades) versus subaerial units.
After ∼800 years of volcanic inactivity on the Reykjanes Peninsula (Sæmundsson et al., 2020), eruptions recently occurred at Fagradalsfjall, which is immediately west of and adjacent to Krýsuvík. In February 2021, elevated seismicity and ground surface deformation suggested the migration of magma and magmatic fluids in the subsurface (Cubuk-Sabuncu et al., 2021; Geirsson et al., 2021; Flóvenz et al., 2022; Sigmundsson et al., 2022). Intense earthquake swarms and changes in ground deformation patterns indicated the intrusion of a NE-SW-trending vertical segmented dyke with sustained magma inflow (Sigmundsson et al., 2022). On 19 March 2021, a fissure eruption began as an effusive outpouring of basaltic lava from closely-spaced vents (Bindeman et al., 2022; Halldórsson et al., 2022). After about a month of activity, five additional vents opened along a 1 km-long segment extending to the northeast (Bindeman et al., 2022; Pedersen et al., 2022). During this first eruptive phase, effusion rates were low to moderate (Pedersen et al., 2022) and periodic fire fountaining from multiple vents built spatter cones and fed lava flows (Bindeman et al., 2022; Halldórsson et al., 2022). After about 3 months of activity, the eruption focused to one vent and effusion rates increased with more intense fire fountaining (Halldórsson et al., 2022; Pedersen et al., 2022). The expansion of the lava field was constrained by the topography of the surrounding ridges. Lava flows filled valleys by inflation and successive emplacement of later flows, then spilled into adjacent valleys (Pedersen et al., 2022). The eruption entered its final phase in September, forming a lava pond that partially drained before the eruption ceased on 18 September 2021 (Pedersen et al., 2022). On 3 August 2022, a second short-lived eruption began in Meradalir about 1 km northeast of the 2021 main eruptive vent (Global Volcanism Program, 2022a). This eruption was preceded by a pattern of increased seismicity and ground deformation similar to the previous eruption (Global Volcanism Program, 2022c). Lasting about 2 weeks, this eruption began as weak lava fountaining along a fissure, followed by a decrease in lava effusion rate and the development of a central cone that contained a lava pond and fed lava flows to the surrounding Meradalir valley (Global Volcanism Program, 2022b).
Krýsuvík, the volcanic system of which Undirhlíðar ridge is the northernmost section, is distinct among the volcanic systems on the Reykjanes Peninsula (Figure 1). It is the only volcanic system to host a buried caldera, identified by circular geophysical anomalies at depth and the remnant at Lake Kleifarvatn (Eysteinsson, 2001; Hersir et al., 2020; Sæmundsson et al., 2020). The ancient central volcano may have been rooted by an intrusive complex, evidenced by layered gabbroic xenoliths in volcanic ejecta and the eruption of evolved tholeiitic basalts (Jónsson, 1978; Sæmundsson et al., 2020). The Krýsuvík geothermal area, in the southern part of the system, covers ∼60 km2 and is bound by two NE-SW trending tindar complexes, Núphlíðarháls-Vesturháls to the west and Sveifluháls to the east (Hersir et al., 2020). Along strike with Sveifluháls to the northeast is Undirhlíðar ridge, an early Weischelian (118–80 kyr; Lambeck et al., 2006; Sæmundsson et al., 2016) pillow-dominated tindar. Undirhlíðar ridge is ∼7 km long and has been excavated at its northern extent in Undirhlíðar and Vatnsskarð quarries, which are separated by ∼3 km and have walls ∼100 m high, exposing both longitudinal and across-axis cross sections of the ridge.
In a previous paper (Pollock et al., 2014), we presented the lithostratigraphic and compositional variations exposed in Undirhlíðar quarry. We proposed a model for the construction of the northern part of Undirhlíðar ridge that comprises at least three eruptive phases ranging in style from explosive to effusive (Figure 10 in Pollock et al., 2014). The pillow lava units comprising the core of the ridge were formed in an initial effusive phase that erupted magma from an incompatible element-enriched mantle source. This was followed by intrusions of a less-enriched magma and a second effusive phase that began with an explosive event. Because the first and second eruptive phases were fed by magmas from slightly different mantle sources, we hypothesized that magma resided in discrete melt bodies that experienced separate evolutionary histories, consistent with evidence for a local intrusive complex and the sheeted sill model for volcanic systems (Gee et al., 1998; Maclennan et al., 2003; Eason and Sinton, 2009; Peate et al., 2009). Lithologically, the boundary between the first and second eruptive phases is marked with deposits of vitric tuff-breccia, interpreted as products of subaqueous fire-fountaining, suggesting that pillow-forming eruptions may have been initiated by mild explosive activity. A final effusive phase produced a capping layer of pillow lavas that are geochemically related to the pillow lavas from the preceding effusive phase. While intrusions were also documented in this study, their importance to the overall ridge formation was not as well understood.
The Undirhlíðar study modified the existing model for subglacial pillow-forming eruptions (Jones, 1969; Jones, 1970; Moore et al., 1995; Höskuldsson et al., 2006) by documenting multiple episodes of pillow lava emplacement and transitions in eruptive style that coincided with shifts in the underlying magmatic system. Here, we examine whether the model applies to the rest of the ridge by extending our work to Vatnsskarð quarry and the ∼3 km length of the ridge between the quarries. Along the ridge, water-carved gullies offer ∼100 m high exposures of fragmental volcanic material, intrusions, pillow lavas, and glacial diamict. Vatnsskarð quarry is ∼750 m long and exposes ∼80 m high walls that show several distinct pillow lava units, volcaniclastic units, and intrusions. Where Undirhlíðar quarry revealed glaciovolcanic processes at the margins of a tindar ridge, Vatnsskarð quarry provides insights into glaciovolcanic processes nearer to the center of magma upwelling and storage within a volcanic system. Since our original model at Undirhlíðar in 2014, the adjacent Fagradalsfjall volcanic system erupted in 2021–22, allowing us to draw parallels and observe contrasts between fissure eruptions in subaerial and ice-confined environments.
Field mapping at the quarries and along the ridge that connects them has been ongoing since 2009. We sampled and made measurements at a variety of scales. We measured >100 individual pillow lava sizes and orientations using meter tape measures and Brunton compasses with clinometers. Trend and plunge data of pillow basalts for each locality were plotted using Stereonet (v. 11.4.5 Allmendinger et al., 2013; Cardozo and Allmendinger, 2013). Data were contoured using the Kamb contouring method. The average trend and plunge direction for pillows at each locality was calculated based on the center of the contoured pi-maxima. Data from localities close to each other were compared; if averages were similar, then the data were merged into one plot that represented a larger area.
A variety of approaches have been used to map vertical faces in the quarries, including laser range-finding, Gigapan technology, Structure-from-Motion, and drones. Sample and data collection sites were located using standard handheld GPS units, which are generally considered to have non-corrected positional errors of ± 5 m or less. For samples where accurate elevations are critical, we used the Arctic DEM subsampled to 1.8 m resolution to subsequently correct sample elevations to a consistent elevation model.
We note here that quarries, while providing unparalleled exposures and access to fresh samples, can have inherent disadvantages. For example, our field observations are largely centered on pillow lava units, which now dominate the stratigraphy at both quarries. It is possible that the unconsolidated tuff-breccia units originally occupied a larger proportion of the quarries but have been preferentially removed due to ease of mining.
Major and trace elements were measured on a total of 89 whole-rock samples, including 6 bombs from fragmental units, 57 pillow lavas, and 26 intrusions (Table 1; Supplementary Table SA1). Whole-rock powders from fresh samples were prepared in alumina grinding containers and sieved through 325 mesh. Loss on ignition (LOI) was determined by heating the powders for 1 h at 950°C following Boyd and Mertzman (1987). Most samples were analyzed for major elements by X-ray fluorescence spectroscopy (XRF; 86 samples) at the College of Wooster following the methods of Pollock et al. (2014). The XRF was drift corrected prior to each run and repeat analyses of standards shows reproducibility <2%. Most trace elements were measured by inductively coupled plasma mass spectrometry (ICP-MS; 71 samples) at the Peter Hooper Lab, Washington State University, United States following standard methods (Lichte et al., 1987; Jarvis, 1988; Doherty, 1989; Jenner et al., 1990; Longerich et al., 1990). Analytical runs consisted of unknowns, standards, and drift correction solutions. Reproducibility is <5% for rare Earth elements and <10% for all other elements. Full analytical precision and accuracy details for XRF and ICP-MS analyses are provided in the Supplementary Tables SA2–SA4). A few samples (3) were analyzed at Duke University by directly coupled plasma atomic emission spectroscopy (DCP-AES) and ICP-MS following the methods of Klein et al. (1991); Cheatham et al. (1993), respectively. DCP-AES analyses show reproducibility of 1%–2% for all major elements with the exception of K2O (∼10%) and P2O5 (< 8%). ICP-MS analyses at Duke show reproducibility of 1%–5% for trace elements. Full quality assurance data for the Duke analyses are provided in the Supplementary Material to Pollock et al. (2014). Interlab comparison of duplicate samples analyzed by ICP-MS at Duke and Washington State Universities shows good agreement between methods (Supplementary Table SA5).
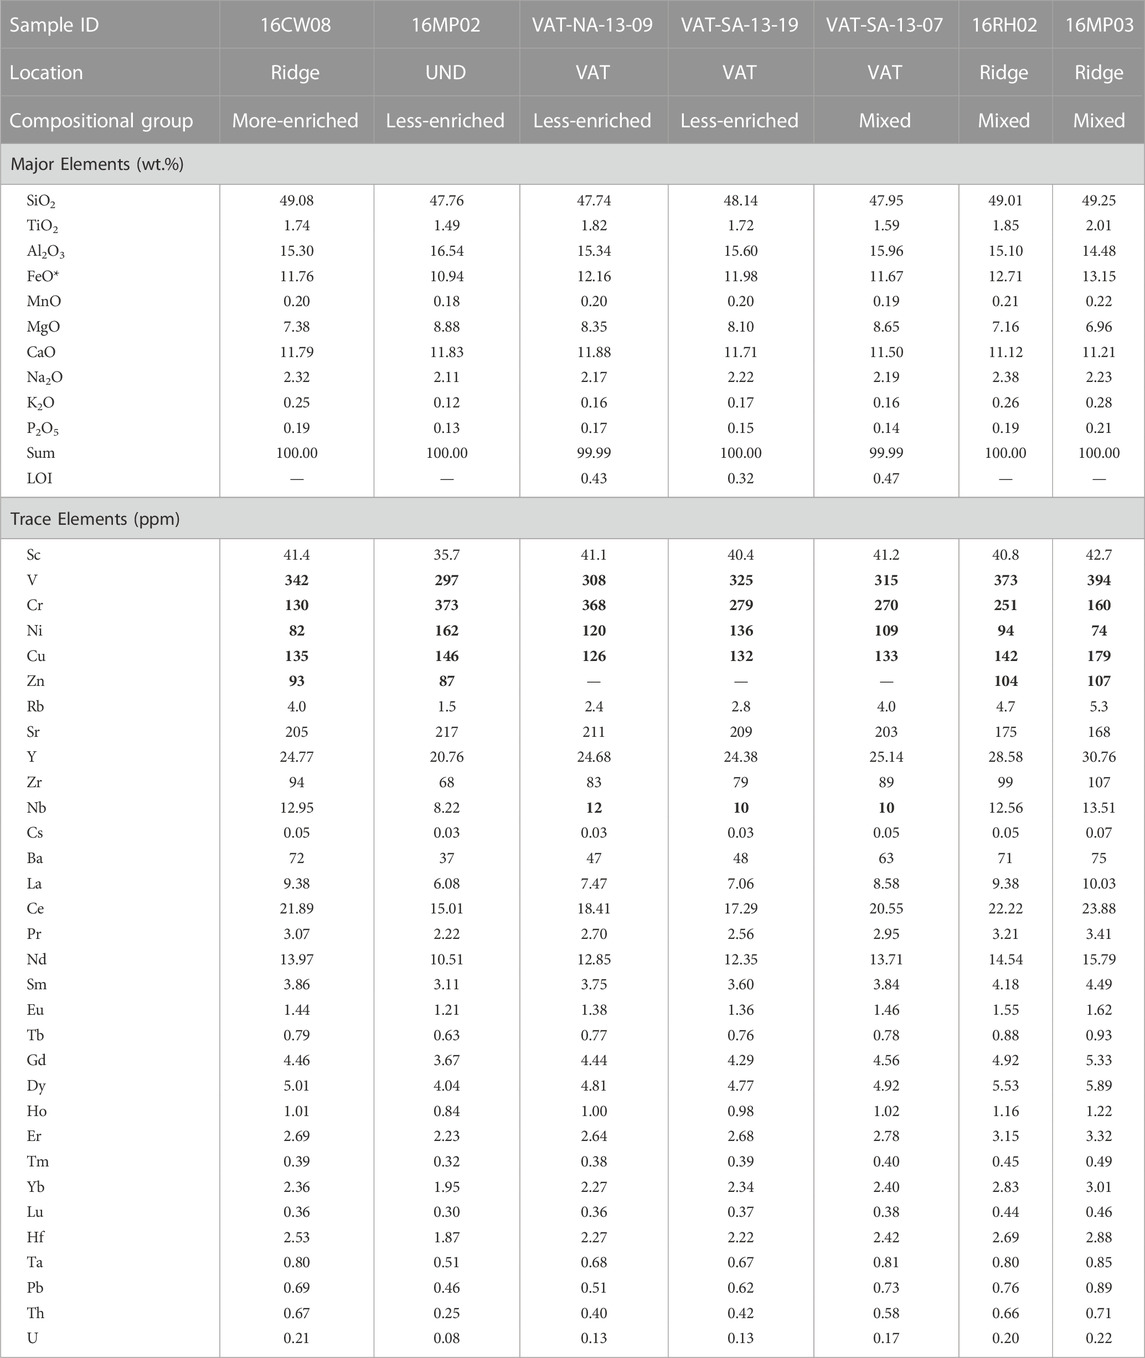
TABLE 1. Geochemistry of selected Undirhlíðar ridge samples. Major elements (in wt. %) and select trace elements (bold) measured by XRF. All other trace elements measured by ICP-MS. Details of analytical methods are described in the text. All samples are whole-rock pillow lavas except 16MP03 (dyke). Location describes sample sites in Undirhlíðar quarry (UND), Vatnsskarð quarry (VAT), or along the ridge between the quarries. Compositional group defined by LaN/SmN value as described in the text. The full geochemical dataset and quality data are available in the (Supplementary Material).
Sr-Nd-Pb isotope ratios were measured on seven whole-rock powders from Undirhlíðar and Vatnsskarð quarries by thermal ionization mass spectrometry (TIMS) at the University of North Carolina at Chapel Hill (Table 2). Samples were dissolved and cations were separated following the methods of (Miller and Glazner, 1995). Measurements were made on a VG Sector 54 mass spectrometer. Sr isotopes are referenced to 87Sr/86Sr = 0.710231 ± 9 (NBS 987, n = 9). Nd isotopes are referenced to 146Nd/144Nd = 0.512102 ± 10 (JNdi, n = 20).
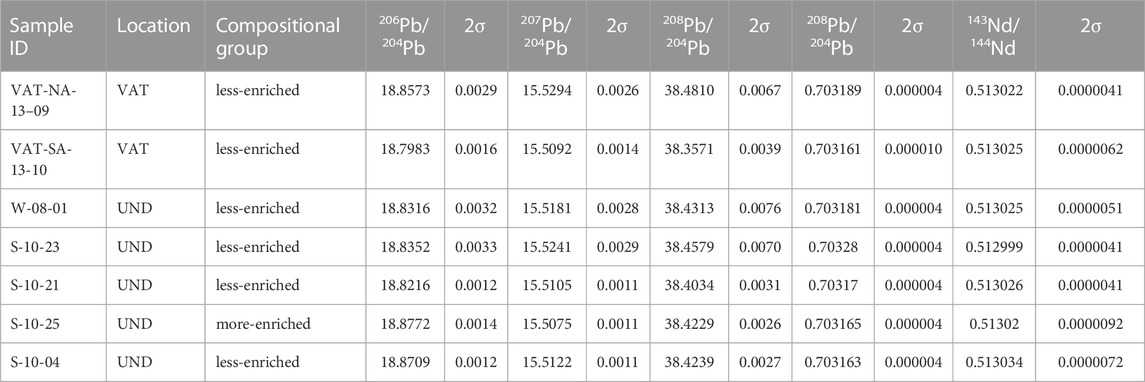
TABLE 2. Radiogenic isotope data for whole-rock samples from Undirhlíðar ridge. Location describes sample site in Undirhlíðar (UND) or Vatnsskarð (VAT) quarries. Compositional group defined by LaN/SmN value as described in the text. Major and trace element data for UND samples are reported in Pollock et al., 2014. All samples are pillow lavas except for S-10-21 (dyke). Details of analytical methods are described in the text. Error is 2
Volatiles (H2O and CO2) were measured on pristine glassy rims from 38 pillow lavas. In Undirhlíðar quarry, seven samples were collected from a cluster of adjacent pillows, four of which were collected from a single pillow (Table 3). For most samples, three glass chips were selected for analysis. Glass chips ranged in size from <1 mm to 7 mm in diameter and were chosen to avoid significant weathering, alteration, phenocrysts, and vesicles. Chips were doubly polished into 100–200 micron-thick wafers. Thickness of each glass wafer was measured three times and averaged for each chip for a precision of ± 5 microns. Wafers were analyzed by Fourier Transform Infrared Spectroscopy (FTIR) at the University of Massachusetts Amherst on a Bruker Tensor 27 FTIR with attached Hyperion 3000 microscope. FTIR spectra were obtained for a 10 × 10 micron area using OPUS (version 7.2) software. Care was taken to avoid measuring sites adjacent to fractures, vesicles, crystals, and margins. At least three sites were measured for each chip, so each value reported represents the average of 3–12 spectra. Individual FTIR measurements are presented in the (Supplementary Table SA7).
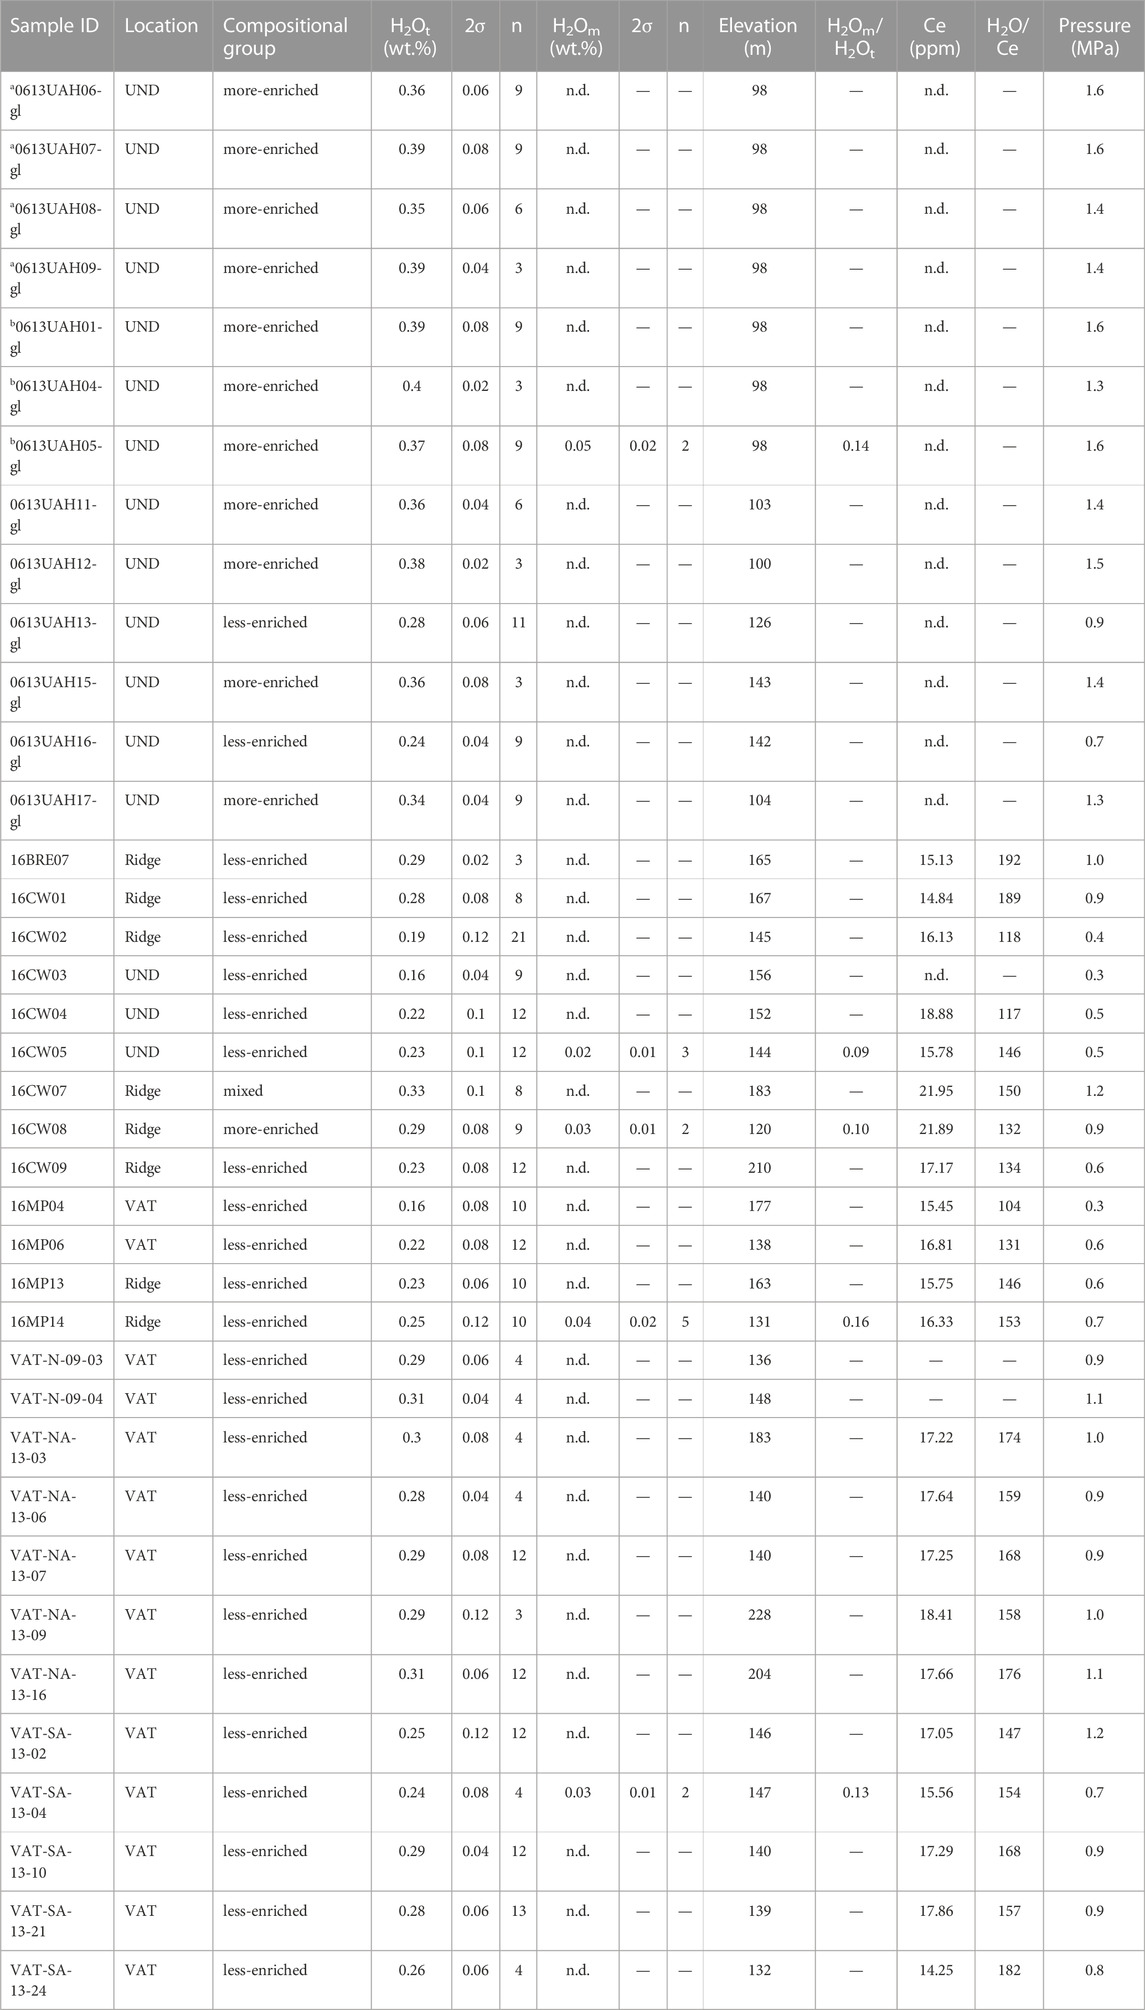
TABLE 3. Water contents, elevations, and saturation pressures of Undirhlíðar ridge samples. Location describes sample sites in Undirhlíðar quarry (UND), Vatnsskarð quarry (VAT), or along the ridge between the quarries. Compositional group defined by LaN/SmN value as described in the text. H2Ot and H2Om concentrations (in wt.%) are calculated averages of n number of FTIR spectra. Error is 2
IR peak absorbance at ∼3529 cm-1 was used to calculate total water (H2Ot) concentration using the Beer-Lambert Law (Stolper, 1982). Glass density was 2,750 ± 55 g/L, estimated using Bottinga and Weill (1972) and based on average composition of the sample suite. The molar absorption coefficient for H2O in basalt was 63 ± 3 L/mol-cm (Dixon et al., 1995). Water speciation was not determined for most samples because spectra did not show measurable peaks at the 4,500 cm-1 and 5,200 cm-1 bands (Mcintosh et al., 2017). For the few samples with peaks detected at 1,630 cm-1, spectra were analyzed using Spectragryph (v.1.2.16.1). Peak absorbance was determined on spectra corrected with adaptive baselines. Molecular water (H2Om) concentrations were calculated the Beer-Lambert law and the same parameters described above with a molar absorption coefficient of 25 ± 3 L/mol-cm (Dixon et al., 1995). Uncertainty was estimated by propagating errors through the Beer Lamber Law for sample thickness, density, absorption coefficient, and absorbance based on repeated analyses of the same site. Average precision (1-θ) for H2Ot concentrations is 10%, which is consistent with previous studies of total water measurements made by FTIR (Dixon and Clague, 2001). Error for H2Om concentrations is higher because of additional uncertainty in absorbance intensity measured from adaptive baselines (McIntosh et al., 2022).
Most samples did not show a measurable CO2 peak at ∼2,360 cm-1, and the CO2 peaks that were observed did not consistently appear in the spectra, even within the same chip. Therefore, CO2 values are interpreted to be below the lower limit of quantification (20 ppm). The Supplementary Material contains the data for the few CO2 peaks that were detected. The Beer-Lambert Law was used to calculate the CO2 concentration using the same parameters described above and a molar absorption coefficient of 945 L/mol-cm for CO2 (Fine and Stolper, 1985).
After FTIR analysis, 11 glass samples were carbon coated and analyzed for major elements by electron probe microanalysis (EPMA) at the University of Massachusetts Amherst. The Cameca SX 50 microprobe was operated under an acceleration voltage of 15 keV, a beam current of 20 nA, and a spot size of 30 µm. Full compositional data for the glass chips are provided in the (Supplementary Table SA1).
The alphaMELTS program (v. 1.9) was used to model crystallization and melting (Smith and Asimow, 2005). Using the MELTS thermodynamic model (Ghiorso and Sack, 1995), liquid lines of descent (LLD) were calculated for isobaric fractional crystallization at 1 kb and 1,200°C with 3°C steps. A primitive aphyric lava was used for the parent magma (VAT-SA-13-07, MgO 8.6 wt.%, LaN/SmN 1.44) with the addition of 0.5 wt.% H2O. Initial Fe2O3 was calculated from FeO in alphaMELTS at the FMQ buffer. The same conditions were used to calculate the liquidus phase for two additional parent magma compositions (16MP02 and S-10-18 from Pollock et al., 2014). Using the pMELTS thermodynamic model (Ghiorso et al., 2002), mantle melts were generated through isentropic decompression melting starting at 4 GPa and 1,500°C with 0.01 GPa steps. Melting was continuous with 0.05% residual porosity. Two mantle source compositions were modeled: Depleted MORB mantle (Workman and Hart, 2005) and enriched mantle comprising 95% DMM and 5% pyroxenite from Koornneef et al. (2012). Trace element partition coefficients from McKenzie and O’Nions (1991), McKenzie and O’Nions (1995) remained constant during melting. Melts were aggregated using the 1D aggregation model and extracted at 2.17 GPa for both mantle sources.
VolatileCalc (v. 2.0) was used to calculate volatile saturation pressures (Newman and Lowenstern, 2002). Liquid temperatures were determined with alphaMELTS using glass or whole-rock compositions under the same conditions as the LLD models. Water concentrations were determined by FTIR. Because CO2 solubility affects H2O saturation pressures, pressures were calculated at 0 ppm and 15 ppm CO2, representing complete and partial degassing. Full calculation data are provided in the (Supplementary Table SA8).
We have broken out several different lithofacies, including: 1) Pillow lava, 2) tuff, 3) lapilli tuff, 4) tuff-breccia, 5) dykes, 6) massive, columnar-jointed basaltic intrusions, 7) and diamict (Figures 2, 3). These lithofacies are essentially the same as those described in Pollock et al. (2014), and so are not described in detail here. The most common pillow-dominated units comprise stacked pillow lavas with very little intra-pillow material (Figure 4A). Tuff and lapilli tuff are limited to relatively thin interbeds between pillow units (Figure 4B), although they are more extensive locally on the eastern side of the ridge. Tuff-breccia is present in larger masses (Figures 3, 4C). Since the basic stratigraphy for Undirhliðar quarry was described by Pollock et al. (2014), here we focus on describing Vatnsskarð quarry and the ridge between the quarries.
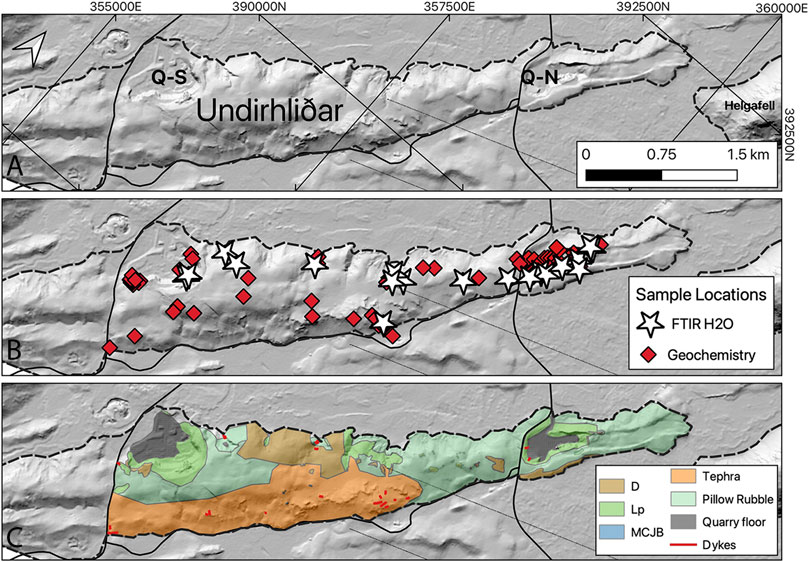
FIGURE 2. Maps showing the morphology, sample locations, and geology of Undirhliðar ridge between Undirhliðar (Q–N) and Vatnsskarð (Q–S) quarries. (A) Digital elevation model (DEM) showing the overall ridge morphology; data for the DEM from the ArcticDEM website, sampled at 1.0 m resolution. (B) Locations of samples used in this study. (C) Geology of the ridge based on new mapping.
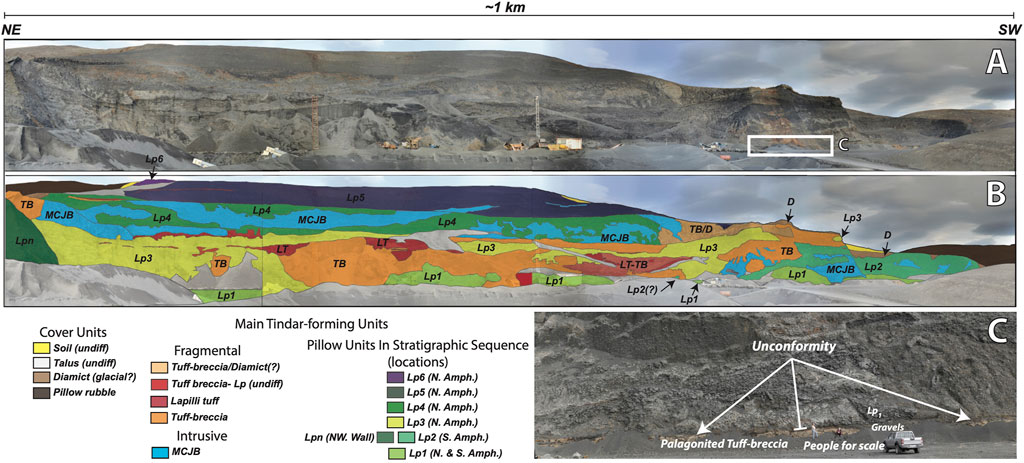
FIGURE 3. Stratigraphy of units at Vatnsskarð quarry. (A) Composited image of the quarry with interpreted distribution of units below (B). (C) Close-up view of the palagonitized tuff-breccia that forms the bedrock to the ridge and is unconformably overlain by quarry units.
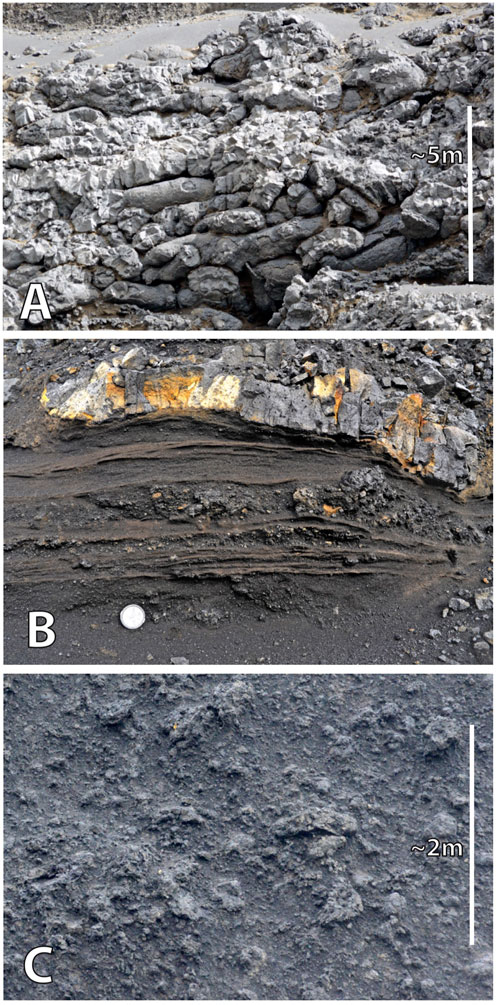
FIGURE 4. Field images of critical lithofacies. (A) Shallowly plunging pillow lava tubes from Lp2 in the central wall of Vatnsskarð quarry. View is approximately 30 m across horizontally. (B) Thinly laminated beds of tuff and lapilli tuff in the northeastern wall of Vatnsskarð quarry (lens cap for scale). (C) View of tuff-breccia unit between Lp2 and Lp3 in the central wall of Vatnsskarð quarry. Largest bombs/pillow fragments are approximately 50 cm in diameter (outcrop was unreachable).
Undirhliðar ridge is the northern extension of a much larger composite tindar ridge complex that extends for more than 20 km in total length (Figure 1). The northern half of the Undirhliðar segment is dominated by intact pillow lavas and pillow lava rubble (Figure 2C), which is sporadically directly overlain by a tan-brown, variably indurated diamicton interpreted to be of glacial origin. Approximately 1.5 km south of Undirhliðar quarry, the east side of the ridge abruptly shifts from pillow rubble to variably palagonitized lapilli tuff and tuff-breccia. Where they are in contact, the fragmental materials appear to directly overlie pillow lava units; however, the palagonitized tephra deposits are absent from either of the quarries. In several places small dykes (< 1 m thick) cut through the tephra-rich east side deposits and appear to be less common, although still present, in pillow units along the west-central part of the ridge (Figure 2C). Vatnsskarð quarry marks the southern end of the study area, where mining operations as of 2021 have bisected approximately half of the ridge width.
Vatnsskarð quarry, which is still active and expanding, is approximately 1 km long and up to 80 m from the quarry floor to the top of the ridge. Most of the Vatnsskarð quarry walls expose longitudinal sections of the ridge, but the northern end exposes a cross section that is perpendicular to the length of the ridge. We have identified 7 different pillow lava units based on stratigraphy and location, 4 different primary fragmental units (tuff, lapilli tuff, tuff-breccia), and overlying glaciofluvial deposits (tuff-breccia/diamict Figure 3). The north wall is dominated by pillow lavas, and because of their plunge orientations (see below), we have designated these pillows as a distinct unit (LpN; Figure 3).
The walls of Vatnsskarð quarry expose a continuous longitudinal section of the ridge, from the basal contact, through volcanic stratigraphy with multiple pillow and fragmental units, to capping sedimentary units (Figure 3). The basal contact is exposed near the center of the walls, where the lowest pillows (Lp1) appear in lenses that lie unconformably over sedimentary layers of yellow diamict containing cobble-sized clasts of vesicular basalt. The upper contact of the basal pillows lavas (Lp1) is marked by a thin (cm-scale) layer of vitric tuff and a sharp contact with overlying pillows (Lp2). Lp2 comprises the bulk of the central and southern quarry walls. Within the pillows are isolated lenses of lapilli tuff and vitric tuff-breccia that include glassy basaltic bombs. Above Lp2 is a dark black vitric tuff breccia (TB) that dips downward and thickens to the northeast. This fragmental unit consists of a vitric lapilli tuff (LT) with some highly vesicular glassy fragments that gradually coarsens to bomb-dominated, with glassy bombs that are mostly vesiculated throughout (LT-TB). The TB unit contains lobes of a third pillow unit (Lp3). The upper portion of the Lp3-TB complex is marked by a relatively flat-lying contact with a fourth pillow unit (Lp4) that hosts irregularly shaped intrusions, which are described in detail below. Capping the Lp4-intrusion complex is another pillow unit (Lp5). We lose stratigraphic control above this pillow unit and find one more isolated pillow exposure (Lp6) in a roadcut at the top of the mine. Laterally to the south, the volcanic stratigraphy is capped by a sequence of sedimentary units that lies unconformably over the exposures in the central and southern walls. Most of the sedimentary unit comprises a clast-rich sandy diamict that stands out in relief, containing ∼60% gravel-sized fragments and with weathered yellow to red appearance. Cobbles are rounded and striated. The matrix comprises glass and palagonitized sand-size grains. Within the sandy diamict is a 3 m-thick unit of gray muddy diamict with sparse interbedded sandy lenses.
Pillow units are distinguished based on their appearance and orientations. For example, Lp1 and Lp2 show a sharp contrast in appearance: Pillow lavas in Lp1 are aphyric, variably fractured, and weathered brown-yellow, whereas Lp2 pillows are darker, fresher-looking, olivine-bearing and have fresh glassy rinds with corrugated textures. Pillow orientations differ among the quarry walls (Figure 6). Lp2 pillows in the south wall plunge steeply to the southwest. Pillow units in the main quarry walls plunge to northwest. The north wall exposes a pillow unit (LpN) that plunges steeply to the south.
Irregular subhorizontal intrusions are present in all of the quarry walls (Figures 3, 5). They appear as laterally extensive massive columnar jointed basalts that are irregular in shape with complex jointing patterns. Many of the irregular intrusions show chilled margins and glassy contacts with the surrounding pillow lavas. The intrusions are holocrystalline with visible plagioclase, olivine, and clinopyroxene phenocrysts and crystal size increasing toward the interior. Some parts of the intrusions are slightly vesiculated (< 3%), although other locations along the margin have 10%–15% vesicularity, showing mm-scale vesicles, and sparse larger (4–5 mm) pipe vesicles. These irregular intrusions also contain gabbroic and troctolitic xenoliths. The xenoliths tend to appear at the base of the intrusions.
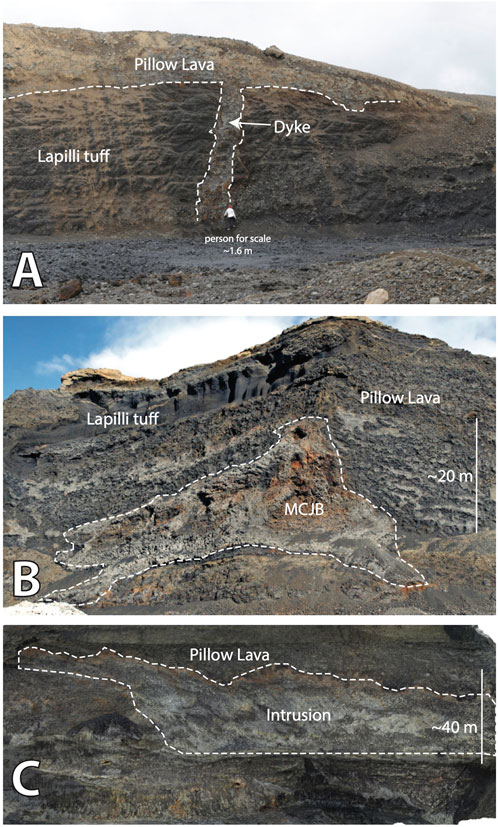
FIGURE 5. Field images showing intrusions. (A) Dyke feeding overlying pillow lavas, Undirhliðar quarry. Person for scale. (B) Irregular intrusion into pillow lavas, Vatnsskarð quarry. Maximum vertical dimension is 17 m. (C) Sill-like intrusion, northern walls, Vatnsskarð quarry. The intrusion is ∼300 m long and 38 m tall.
Ridge-parallel dykes cut through the pillow units on the southernmost and northernmost walls that expose cross-sections perpendicular to the ridge (Figure 3). The dykes are ∼1–1.5 m wide with chilled margins. They display well developed columnar joints and patterns in vesicularity (pipe vesicles perpendicular to margins and vesicle bands parallel to margins). The cores of some dykes are glassy, vesiculated, and fragmented. Ridge-perpendicular dykes are less abundant but also present.
In Undirhlíðar quarry, pillows in the central part of the quarry generally have southwest trends (236°–256°) with low plunges (Figure 6). These data are consistent with eruption from a vent trending perpendicular to the main ridge axis. However, pillows in the area to the south (pw07-pw10), have northwest trends (307°) with low plunges, suggesting an eruptive vent to the southeast. In Vatnsskarð quarry, a number of areas show pillows with plunge orientations that are also consistent with eruption from small fissures with a variety of orientations with respect to the main ridge axis (Figure 6). For example, pillows in the south wall (Lp2) show plunge directions opposite to pillows exposed in an erosional gully adjacent and south to the quarry.
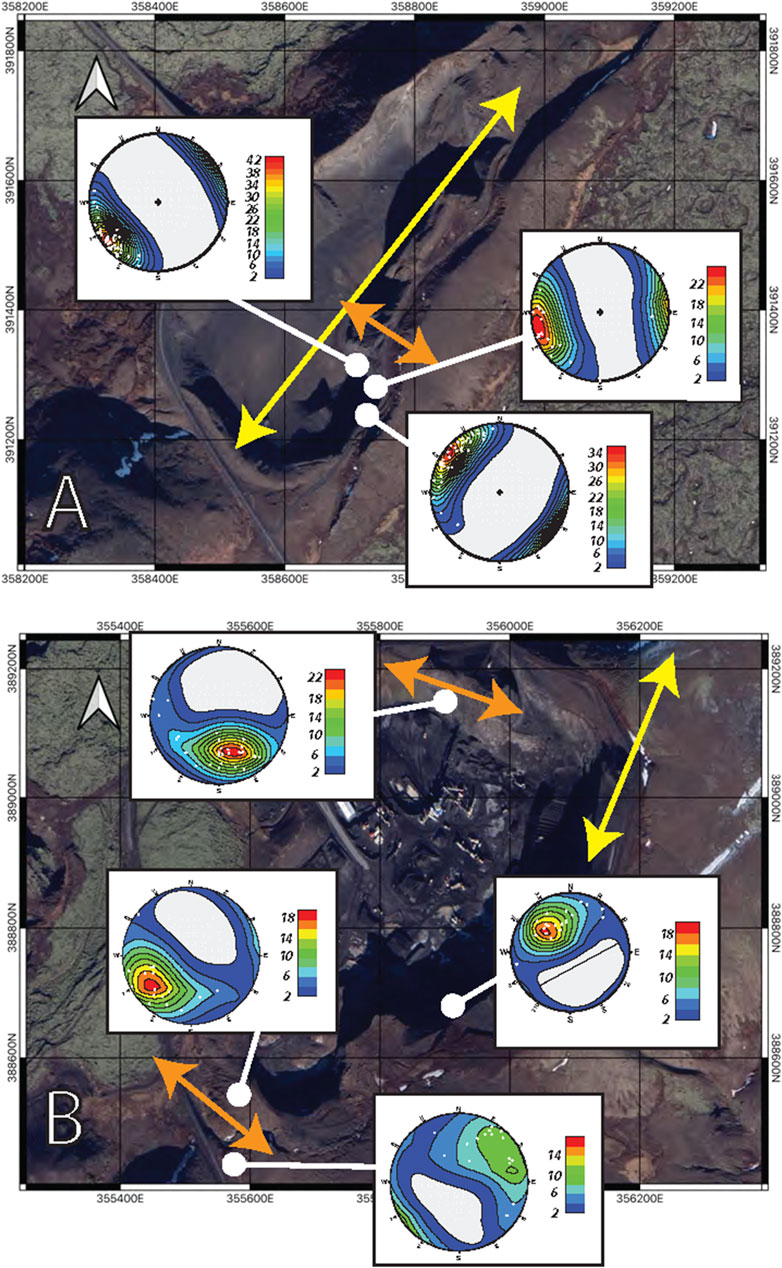
FIGURE 6. Quantification of pillow orientations. (A) Satellite image of the Central Wall of Undirhliðar showing populations of pillow plunges. (B) Satellite image of the central and southern walls at Vatnsskarð quarry showing populations of pillow plunges. In (A, B) yellow arrows show the general trend of the overall ridge, and orange arrows show fissure trends inferred from pillow plunge directions.
Within the Undirhlíðar ridge suite, samples form distinct geochemical clusters defined by Rare Earth Element (REE) patterns (Figure 7). Based on relative light REE (LREE) enrichment, we divide the Undirhlíðar ridge samples into three compositional groups. Most of the suite comprises the “less-enriched” group with chondrite-normalized (McDonough and Sun, 1995) LaN/SmN less than 1.31. The “more-enriched” group overlaps the less-enriched group in REE abundance but has LaN/SmN ratios greater than 1.50. The “mixed” group has LaN/SmN ratios between 1.37 and 1.49 and shows the highest REE abundances in the suite. All of the Undirhlíðar ridge samples have smooth REE patterns with no or slightly positive Eu anomalies.
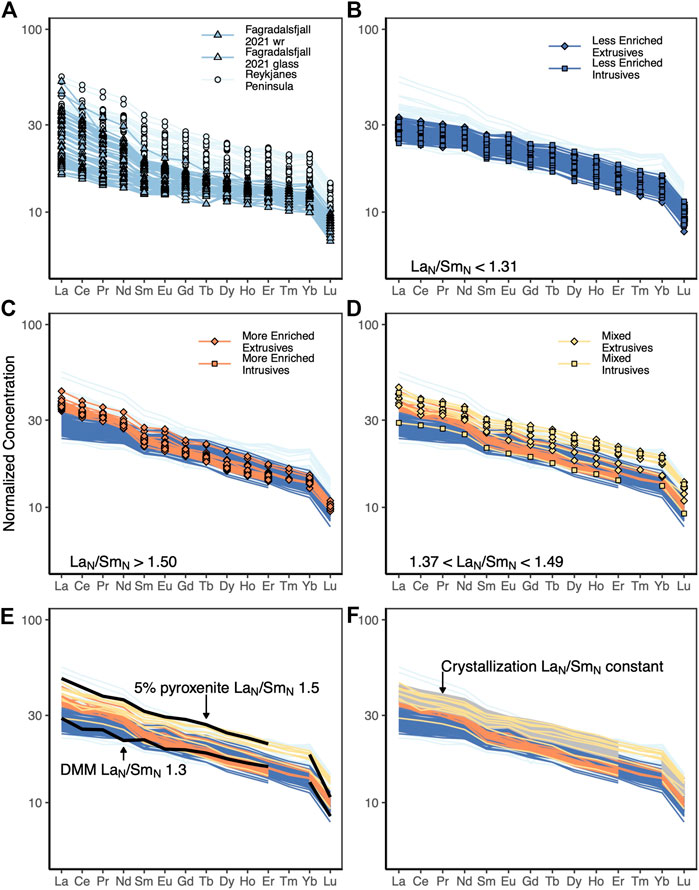
FIGURE 7. Rare Earth element (REE) concentrations normalized to chondrite values from McDonough and Sun (1995). (A) Reykjanes Peninsula (light blue circles), including the Fagradalsfjall 2021 eruption (medium blue triangles). Undirhlíðar ridge extrusive (diamonds) and intrusive (squares) samples shown in (B–D), grouped by LaN/SmN values: (B) LaN/SmN < 1.31 (less enriched), (C) LaN/SmN > 1.50 (more enriched), (D) 1.37 < LaN/SmN < 1.49 (mixed). (E) Black lines show alphaMELTS model melt compositions for depleted (DMM) and enriched (5% pyroxenite) mantle sources, illustrating how mixing between two mantle source compositions can generate the Undirhlíðar ridge data. (F) Gray field show alphaMELTS model liquid compositions for up to 30% fractional crystallization illustrating how variable extents of crystallization affect REE abundance. See text for model details. Undirhlíðar ridge data from this study and (Pollock et al., 2014). Reykjanes Peninsula data (light blue circles), excluding picrites, from (Kokfelt et al., 2006; Peate et al., 2009; Koornneef et al., 2012; Eason and Sinton, 2015; Halldórsson et al., 2016). Fagradalsfjall data (triangles) from (Bindeman et al., 2022; Halldórsson et al., 2022).
Undirhlíðar ridge REE data overlap with enriched lavas from the Reykjanes Peninsula but show a more restricted range in LREE enrichment (Figure 7). Reykjanes Peninsula lavas show LaN/SmN ranging from 1.20 to 1.67 (Kokfelt et al., 2006; Peate et al., 2009; Koornneef et al., 2012; Eason and Sinton, 2015; Halldórsson et al., 2016). Fagradalsfjall lavas show a wider range in LaN/SmN (1.24–2.74) and extend to lower REE abundances (Bindeman et al., 2022; Halldórsson et al., 2022). Using incompatible trace element ratios, Gee et al. (1998) divided Reykjanes Peninsula samples into “depleted” (Nb/Zr < 0.08) and “enriched” (Nb/Zr > 0.08) groups. Peate et al. (2009) further subdivided enriched historical Reykjanes Peninsula lavas into “less-enriched” (Nb/Zr 0.10–0.13, LaN/SmN 1.21–1.36) and “more-enriched” (Nb/Zr 0.13–0.14, LaN/SmN 1.38–1.48) groups based on incompatible trace element ratios and LREE enrichment. By these definitions, all of the Undirhlíðar ridge samples are enriched. Like Peate et al. (2009), we observe more-enriched and less-enriched subdivisions within the Undirhlíðar ridge dataset. Our more-enriched group shows higher LaN/SmN values than the more-enriched group of Peate et al. (2009). Our mixed group would have been classified by Peate et al. (2009) as “more-enriched,” but we choose to separate the mixed samples because of compositional differences.
The three compositional groups show variations that are distinguishable in major element space (Figure 8). In general, with decreasing MgO, the Undirhlíðar ridge suite shows decreasing Al2O3 and CaO, increasing FeOT, TiO2, and Na2O, and relatively flat SiO2 values. The less-enriched group encompasses the entire range of MgO found in the dataset, extending to the highest MgO values (MgO >9.0 wt.%). The high-MgO samples are dominated by olivine-phyric intrusions and pillow lavas. At a given value of MgO, some less-enriched samples show elevated Al2O3 and CaO and lower FeOT and K2O. These samples are plagioclase-phyric pillow lavas. The mixed and more-enriched groups are distinguished by where they overlap with the less-enriched group. Mixed group samples dominate the low-MgO range of the Undirhlíðar ridge dataset. More-enriched samples fall toward the lower edges of TiO2, FeOT, and Al2O3 fields and the higher edges of CaO field defined by the less-enriched samples. The most notable distinction among the three compositional groups is in K2O. For a given value of MgO, the more-enriched group shows the greatest variability in K2O and extends to higher values. This distinction is clearly observed in the ratio of K2O/TiO2, where the more-enriched group shows the highest values (avg. 0.18 ± 0.04, n = 25), the less-enriched group shows the lowest values (avg. 0.10 ± 0.03, n = 107), and the mixed group spans the range of the suite.
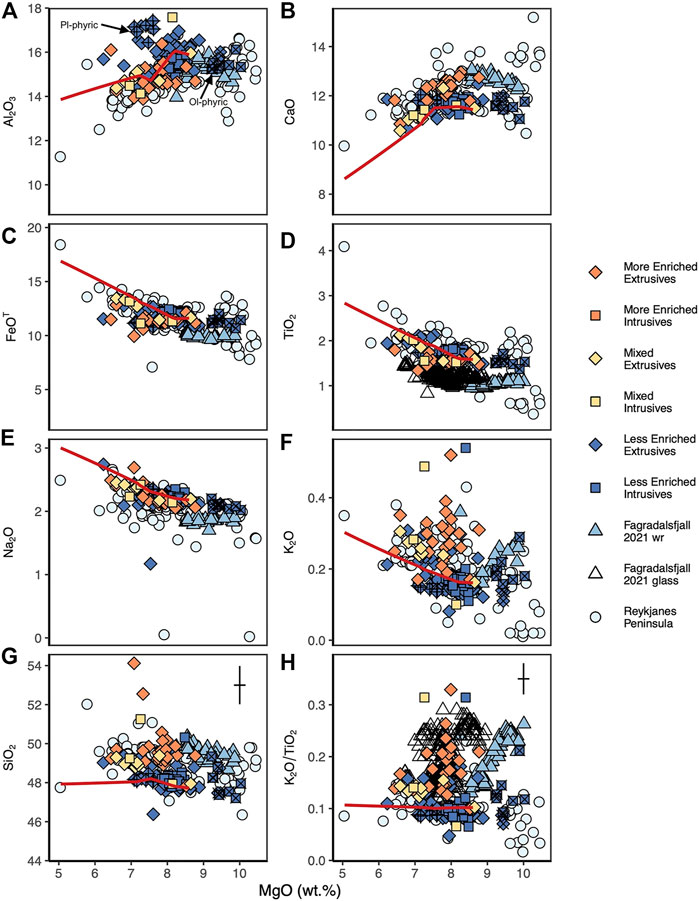
FIGURE 8. Major elements vs. MgO in wt% with symbols and colors as in Figure 7. (A) Al2O3, (B) CaO, (C) FeOT, (D) TiO2, (E) Na2O, (F) K2O, (G) SiO2, (H) K2O/TiO2. All iron is recalculated as total FeO (FeOT). Data have been normalized to 100% on an anhydrous basis. Error bars show 2
Overall, the Undirhlíðar ridge samples are tholeiitic basalts similar in major element composition to other lavas from the Reykjanes Peninsula (Jakobsson et al., 1978; Condomines et al., 1983; Hemond et al., 1988; Hemond et al., 1993; Gee et al., 1998; Kempton et al., 2000; Skovgaard et al., 2001; Fitton et al., 2003; Momme et al., 2003; Kokfelt et al., 2006; Maclennan, 2008; Peate et al., 2009; Jakobsson and Johnson, 2012; Koornneef et al., 2012; Eason and Sinton, 2015; Halldórsson et al., 2016). Reykjanes Peninsula samples span a slightly wider range in MgO compared to Undirhlíðar ridge (Figure 8). Like the Undirhlíðar compositional groups, the less- and more-enriched compositional groups of Peate et al. (2009) are distinct in major elements. Namely, the less-enriched group shows lower MgO, K2O, and TiO2 and higher SiO2 and Fe2O3 than the more-enriched group (Peate et al., 2009). Although we observe that our less-enriched samples are lower in K2O than our more-enriched samples, the other patterns identified by Peate et al. (2009) do not apply to the Undirhlíðar ridge data. Our less-enriched samples are higher in TiO2 and lower in SiO2 compared to our more-enriched samples (Figure 8). Our compositional groups span most of the range of MgO values (Figure 9A) and show no correlation with FeOT (Figure 9B).
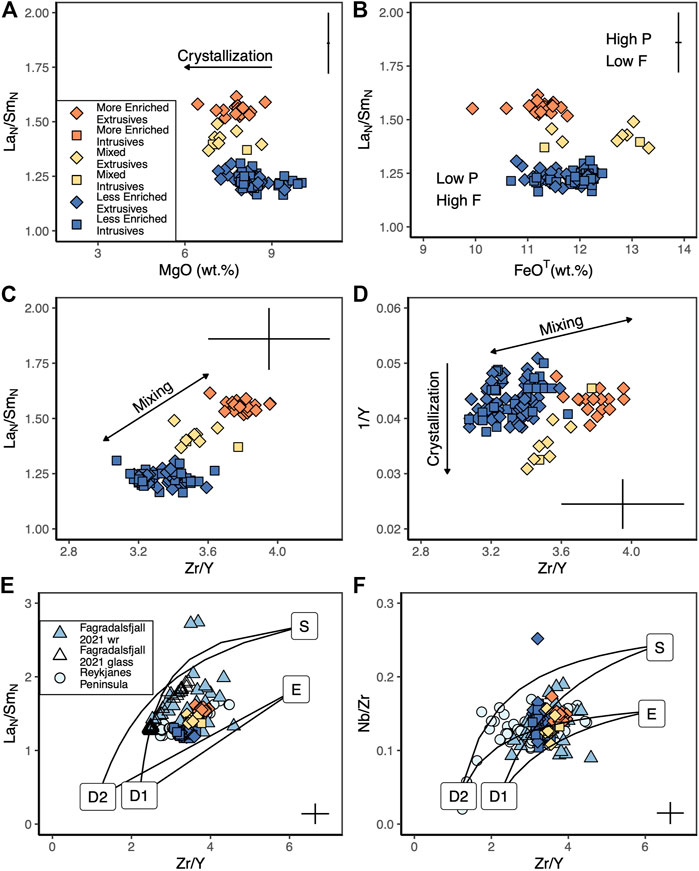
FIGURE 9. Trace element variations with symbols and colors as in Figure 7. (A) LaN/SmN vs. MgO, (B) LaN/SmN vs. FeOT, (C) LaN/SmN vs. Zr/Y, and (D) 1/Y vs. Zr/Y for Undirhlíðar ridge. (E) LaN/SmN vs. Zr/Y and (F) Nb/Zr vs. Zr/Y for Undirhlíðar ridge, Reykjanes Peninsula, and the 2021 eruption of Fagradalsfjall. Arrows in (A) through (D) indicate the direction of trends caused by mixing and crystallization. Scatter in the data in (A, C) indicates variable extents of crystallization. The lack of correlation between trace element ratios and major element indicators of melting in (D) suggests mixing. Curves in (E, F) show mixing between two depleted mantle components (D1 and D2), the main basaltic plume component (“E” for Eldgjá), and the alkalic component (“S” for Snæfellsnes) after (Murton et al., 2002; Bindeman et al., 2022). Mantle compositions from (Kempton et al., 2000; Murton et al., 2002). Reykjanes Peninsula data (light blue circles), excluding picrites, from (Wood et al., 1979; Chauvel and Hémond, 2000; Peate et al., 2009; Koornneef et al., 2012; Eason and sinton, 2015; Halldórsson et al, 2016). Fagradalsfjall data (triangles) from Bindeman et al. (2022) and Halldórsson et al. (2022). Error bars show 2
The Undirhlíðar ridge dataset shows positive correlations between LREE and incompatible trace element enrichment (Figure 9). The more-enriched samples have higher incompatible trace element ratios (Zr/Y 3.6-4.0) compared to the less-enriched group (Zr/Y 3.1-3.6). The mixed samples have incompatible trace element ratios that fall between the more- and less-enriched groups. Undirhlíðar ridge samples overlap with enriched samples from the Reykjanes Peninsula, which encompass greater ranges in incompatible trace element ratios (Wood et al., 1979; Chauvel and Hémond, 2000; Peate et al., 2009; Koornneef et al., 2012; Eason and Sinton, 2015; Halldórsson et al., 2016).
The three compositional groups are correlated with spatial location along the ridge. Almost all of the more-enriched samples are found in the basal stratigraphic units at lower elevations in Undirhlíðar quarry. Mixed samples are the least abundant in the suite and most are located along the ridge between the quarries. The less-enriched group is the most abundant in the suite, found in the dykes and upper units in Undirhlíðar quarry, along the ridge, and heavily concentrated in Vatnsskarð quarry. The single sample from the basal, weathered unit in Vatnsskarð quarry is compositionally distinct from the rest of the suite with a much higher Nb/Zr ratio (Figure 9).
Within the quarries, we observe patterns in trace element compositions related to lithostratigraphic units. Almost all of the Vatnsskarð quarry extrusive samples belong to the less-enriched group; the exceptions are two mixed-group samples (a bomb from a tuff breccia unit and a single pillow lava). Within the less-enriched extrusive units, we observe a shift in trace element ratios that correlates with a stratigraphic break between exposures from north to south. Pillow lavas in the north wall show identically low values of LaN/SmN (1.20). Pillow lavas in the other Vatnsskarð quarry exposures show a range of LaN/SmN values that encompasses most of the range of the less-enriched suite (1.21–1.27). The transition between north wall and the rest of the Vatnsskarð quarry occurs over a distance of tens of meters. In general, Vatnsskarð quarry intrusions show similar REE patterns and abundances to the pillows into which they intrude. However, in Undirhlíðar quarry, less-enriched dykes intrude through more-enriched pillow lavas in the lower stratigraphic units.
Undirhlíðar ridge radiogenic isotope compositions (Sr-Nd-Pb) encompass a narrow range that overlaps with isotopically enriched lavas from the Reykjanes Peninsula (Table 2; Figure 10; Schilling, 1973; Sun and Jahn, 1975; Condomines et al., 1983; Hemond et al., 1993; Gee et al., 1998; Kempton et al., 2000; Fitton et al., 2003; Thirlwall et al., 2004; Kokfelt et al., 2006; Peate et al., 2009). Within dataset limits, Undirhlíðar ridge is consistent with several isotopic relationships observed in other lavas from the Reykjanes Peninsula. First, radiogenic isotopes show positive correlations with trace element ratios (Peate et al., 2009). Although six of the seven Undirhlíðar ridge samples are from the less-enriched compositional group, the single more-enriched sample shows greater 206Pb/204Pb (Figure 10). Second, in their suite of historical Reykjanes Peninsula lavas, Peate et al. (2009) observed that their less- and more-enriched compositional groups were nearly identical in radiogenic Nd and Sr compositions and showed linear correlations in Pb-Pb isotope space. With the exception of a pillow lava from the upper units at Undirhlíðar quarry (S-10-23), the Undirhlíðar ridge samples also overlap in 143Nd/144Nd and 87Sr/86Sr compositions and show linear Pb-Pb isotope patterns (Figure 10). Third, Peate et al. (2009) observed that the Reykjanes Peninsula data plot below the Northern Hemisphere Reference Line (NHRL) for 207Pb/204Pb (negative
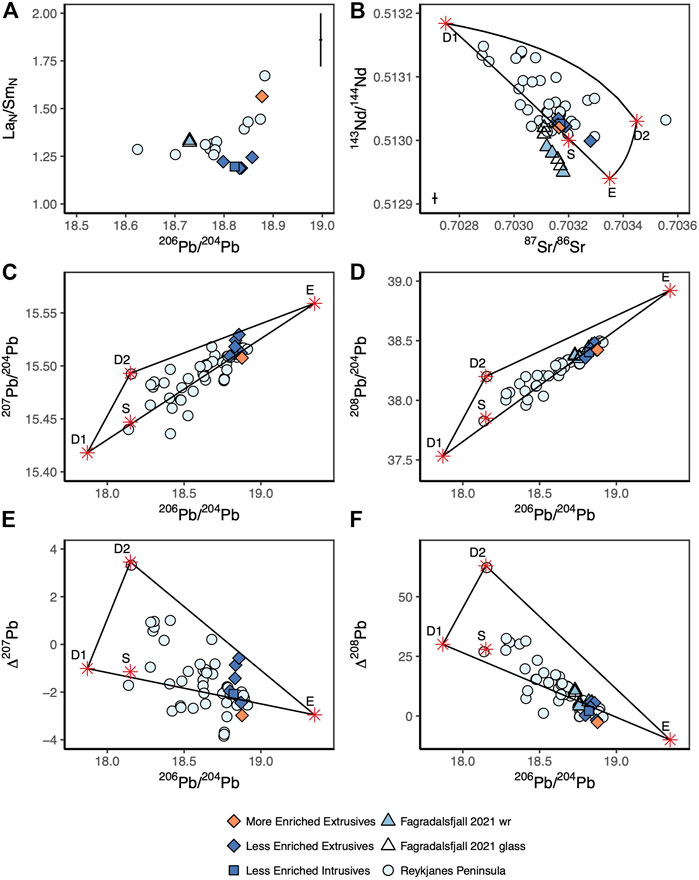
FIGURE 10. Isotope compositions with symbols and colors as in Figure 7. (A) LaN/SmN vs. 206Pb/204Pb, (B) 143Nd/144Nd vs. 87Sr/86Sr, (C) 207Pb/204Pb vs. 206Pb/204Pb, (D) 208Pb/204Pb vs. 206Pb/204Pb, (E)
On Pb-Pb isotope plots, the less-enriched Undirhlíðar ridge samples create a linear array (Figure 10). The ends of the linear array are bracketed by samples from Vatnsskarð quarry, with the least isotopically enriched sample from the southern end and the most isotopically enriched sample from <1 km away in the northern end. Samples from the upper stratigraphic units of Undirhlíðar quarry fall between the Vatnsskarð quarry samples. The single sample from the more-enriched group represents the lower stratigraphic units in Undirhlíðar quarry. Although this sample clusters with the less-enriched samples on a plot of 143Nd/144Nd vs. 87Sr/86Sr, it falls below the linear trend defined by the Vatnsskarð endmembers Pb-Pb isotope plots. The more-enriched sample also has the most negative
Water concentrations for Undirhlíðar ridge were analyzed from fresh glass chips that showed vitreous surface textures, sparse plagioclase microlites, and vesicularity <20% (Table 3; Figure 11). Water speciation was not determined for most samples, so measurements represent total water (H2Ot) concentration. FTIR mapping reveals homogeneous water concentrations within the glass. Highest water concentrations are observed around fractures and vesicles, which were avoided during data acquisition (Supplementary Figure SA1). Only five of the 22 samples produced a detectable peak CO2 peak at the 2,360 cm-1 position, indicating that measured CO2 values are at or below detection limits (< 20 ppm).
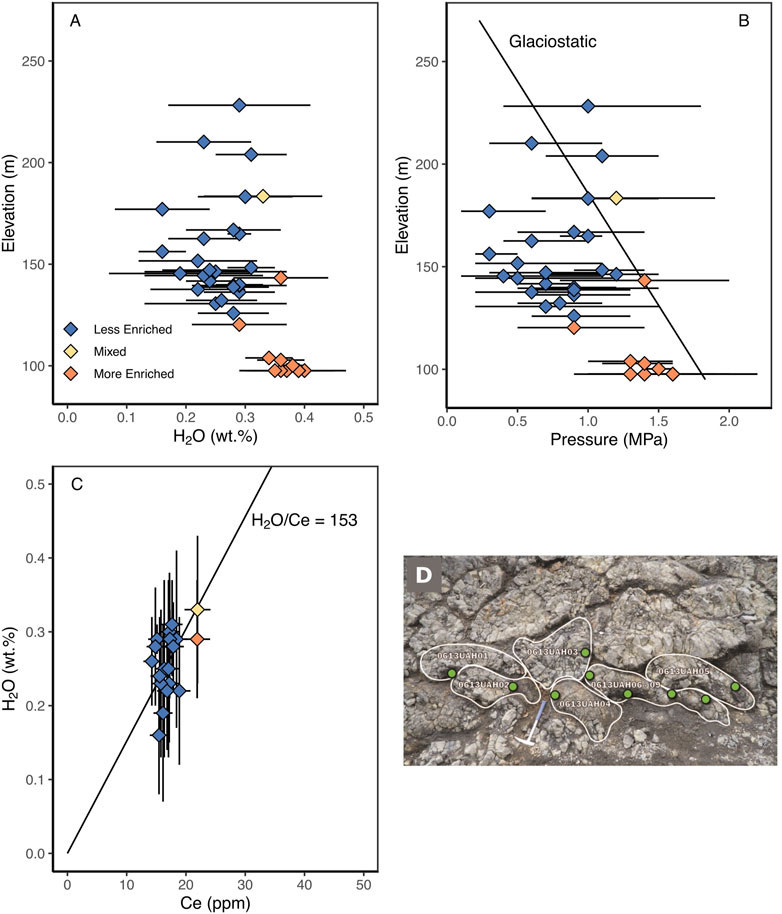
FIGURE 11. Water concentrations in glass samples from Undirhlíðar ridge. Symbols and colors as in Figure 7. (A) Elevation vs. H2O (wt.%) for pillow lavas from this study. H2O generally decreases with increasing elevation. More-enriched samples show higher H2O concentrations than less-enriched samples. Error bars show 2
To check if water concentrations represent magmatic conditions, we measured water speciation when possible. Only five samples produced measurable H2Om peaks at the 1,630 cm-1 band (Table 3). Secondary hydration enriches volcanic glasses in H2Om (e.g., Mcintosh et al., 2017). Most samples did not show measurable H2Om. For the few samples that showed measurable peaks, H2Om/H2Ot ratios are less than the values found in experiments of basaltic glasses quenched at high temperatures (Dixon et al., 1995), suggesting that the analzyed glasses in this study did not experience secondary hydration (e.g., Sano and Yamashita, 2019). To determine if water concentrations from a single pillow represent the conditions for surrounding lavas, we conducted detailed sampling of adjanced pillow lavas and assessed small-scale (< 1 m) spatial variations in H2Ot concentrations (Figure 11). The four samples taken from the same pillow in Undirhlíðar quarry have measured H2Ot concentrations that are similar within analytical error (Table 3). Likewise, the samples from the cluster of adjacent pillows are within analytical error of one another. Therefore, we find that the H2Ot data measured by FTIR on individual pillow lavas are reproducible and representative of the unit in which the pillow lava was erupted.
Water concentrations for Undirhlíðar ridge span a wide range (0.16–0.40 wt.%) and generally decrease with increasing elevation (Figure 11). We observe the greatest range of water contents (0.19–0.36 wt.%) at ∼145 m elevation. Water concentrations are most variable over the smallest spatial scales in Undirhlíðar quarry, where contents change from 0.23–0.40 wt.% H2O over walls that are ∼50 m high and ∼150 m long. Conversely, Vatnsskarð quarry is dominated by less-enriched samples and shows a narrower range of H2O concentrations (0.24–0.31 wt.%), despite exposing walls that are taller (∼80 m) and longer (∼750 m).
Calculated water saturation pressures mimic the pattern of water concentrations (Figure 11). Assuming complete CO2 degassing, saturation pressures range from 0.3 MPa to 1.6 MPa. Using densities of 0.917 g/cm3 for ice and 1.000 g/cm3 for water, saturation pressures correspond to ice thicknesses up to 178 ± 33 m and water depths up to 163 ± 31 m. The decrease in saturation pressure with elevation generally follows a linear trend predicted by glaciostatic conditions under 200 m-thick ice. However, most less-enriched samples between ∼120 m and ∼180 m in elevation fall below the glaciostatic curve.
The significant decrease in water contents starting at ∼120 m in elevation is correlated with a shift in trace element ratios (Figure 11). More-enriched samples show greater H2O concentrations (average 0.37 ± 0.03 wt.%, n = 12) and less-enriched samples show lower H2O concentrations (average 0.25 ± 0.04 wt.%, n = 25). To examine the influence of degassing and magma differentiation on water contents, we compared H2O to Ce, a trace element that behaves similarly during magmatic processes (e.g., Sano and Yamashita, 2019). Water contents show a positive linear correlation with Ce. Less-enriched samples show a wide range in H2O/Ce ratios (average 153 ± 24, n = 20). Samples from the mixed and more-enriched groups fall along a line with a slope that matches the H2O/Ce ratio of the less-enriched group.
Compositional data indicate that mantle source and crustal processes both play essential roles in the formation and evolution of magma at Undirhlíðar ridge. Some variability in major element and REE patterns is consistent with the effects of crystallization and crystal accumulation (Figures 7, 8). This is demonstrated in the major element trends of increasing FeOT, TiO2, and Na2O and decreasing Al2O3 and CaO with decreasing MgO. The most evolved samples in the suite show the greatest REE abundances. The effects of crystal accumulation are apparent in olivine-phyric lavas that show elevated MgO and plagioclase-phyric lavas that show elevated Al2O3 and positive Eu anomalies.
The observed compositional variations are consistent with thermodynamic models of fractional crystallization (Figures 7, 8). Isobaric shallow fractional crystallization of a primitive parent magma from the mixed group shows a typical basaltic crystallization sequence of ol, ol + pl, and ol + pl + cpx. The resulting LLD forms downward curving paths in Al2O3 and CaO and linear upward paths in FeOT, TiO2, and Na2O that follow major element patterns. REE abundances can also be explained by varying degrees of crystallization, which do not affect the slope of REE patterns but cause relative REE abundances to increase in more evolved lavas. The higher REE abundances of the mixed samples can be generated by up to 30% crystallization. Much of the scatter in major element and REE patterns can be explained by variable degrees of crustal-level crystallization.
While all of the Undirhlíðar ridge magmas evolved in the crust, the samples cannot be related to each other by cooling of a single parent magma. This is demonstrated by the scatter in major and trace elements, particularly in SiO2, K2O, K2O/TiO2, and LaN/SmN at a given value of MgO (Figures 8, 9). More-enriched samples follow major element trends that parallel the modeled LLD at lower values of TiO2, FeOT, and Al2O3 and higher values of CaO, suggesting a different parent magma composition. Separate parent magmas are also indicated by modeled liquidus phases. For parent magmas from the from the mixed group (VAT-SA-13-07) and the less-enriched group (16MP02), the modeled liquidus phase is olivine; for a parent magma from the more-enriched group (S-10-18), the liquidus phase is clinopyroxene. In Pollock et al. (2014), we argued that the less-enriched and more-enriched groups follow separate LLD and proposed a model for crystallization in separate crustal reservoirs. At that time, we had not identified the mixed samples from the ridge. Our expanded dataset confirms that the Undirhlíðar ridge magmas cannot be derived from crystallization of a single parent magma in the same melt reservoir. The major and trace element variability are consistent with variations in mantle melting or source composition underlying Undirhlíðar ridge.
In Pollock et al. (2014), we argued that the compositional variations in Undirhlíðar quarry could be explained by mixing of mantle melts extracted from over a range of depths, but our expanded study shows that the compositional groups are likely related to mantle heterogeneity. In our expanded dataset, we observe no correlation between LaN/SmN and FeOT (Figure 9), a major element indicator of degree and pressure of melting. Undirhlíðar ridge samples also have smooth REE patterns with no difference in degree of HREE fractionation between the compositional groups (Figure 7), suggesting a relatively constant degree of melting from shallow depths. Instead of variations in melting of a homogeneous mantle source, the variability in Pb isotopes in our expanded dataset demonstrate that the source mantle cannot be a single homogeneous composition.
Mantle source heterogeneity must influence the compositional variability in the Undirhlíðar ridge magmas. Variable enrichment in incompatible elements and radiogenic isotopes in Iceland have been attributed to aggregation of melts from heterogeneous mantle that are extracted over a range of depths (Hanan and Schilling, 1997; Chauvel and Hémond, 2000; Hanan et al., 2000; Kempton et al., 2000; Stracke et al., 2003; Thirlwall et al., 2004; Thirlwall et al., 2006; Kokfelt et al., 2006; Peate et al., 2009; Koornneef et al., 2012). On the Reykjanes Peninsula, linear isotopic trends and correlations between isotopes and trace element indicators of enrichment have been interpreted as near-binary mixing between mantle sources (Thirlwall et al., 2004; Kokfelt et al., 2006; Peate et al., 2009). The presence of up to six mantle endmembers has been suggested by previous workers (Murton et al., 2002; Thirlwall et al., 2004; Kokfelt et al., 2006; Peate et al., 2009). The nature and origin of the mantle heterogeneity is discussed by numerous workers, but many posit that there are enriched components related to the plume and the alkalic source and depleted components related to the ambient mantle (Kempton et al., 2000; Murton et al., 2002; Thirlwall et al., 2004; Kokfelt et al., 2006). Here, we use simple binary mixing equations (Langmuir et al., 1978) to calculate mixing curves among four endmembers: two enriched mantle compositions are defined by the enriched plume (represented by Eldgja (E) and alkalic Snaefellsnes (S) lavas) and two depleted mantle sources that are similarly depleted in trace elements but show different isotopic compositions (Murton et al., 2002; Thirlwall et al., 2004; Kokfelt et al., 2006).
The Undirhlíðar Pb-Pb isotope data create a linear array that we interpret as mixing between two mantle source compositions. The mixing trends are best seen on the ∆207Pb and 207Pb/204Pb plots, where the mixing lines between the Eldgjá and depleted endmembers are most distinct (Figure 10). The Undirhlíðar data form a binary mixing line between two mantle compositions that are intermediate between the endmembers. The less-enriched samples trend toward one endmember that is a mix of Eldgjá and D2. The more-enriched sample trends toward the second endmember that is a mix between Eldgjá and D1. Because the Snæfellsnes endmember is itself intermediate between Eldgjá and D1, it is difficult to determine the role of the Snæfellsnes source using the isotope data. The location of Snæfellsnes on a mixing line between Eldgja and D1 suggests that the alkalic source may make a bigger contribution to the more-enriched samples. This is consistent with observations on plots of trace element ratios, where binary mixing creates hyperbolas whose curvatures are determined by a ratio of the endmember denominators (Figure 9). On plots of LaN/SmN versus Zr/Y and Nb/Zr versus Zr/Y, all of the Undirhlíðar ridge data fall within a multi-component mixing array defined by the Eldgjá, Snæfellsnes, and depleted mantle components. The more-enriched samples fall toward an enriched endmember that is intermediate between Snæfellsnes and the depleted endmembers. The less-enriched samples fall toward an endmember that is intermediate between the Eldgjá and depleted endmembers.
To test whether a heterogeneous mantle source can produce the range of LaN/SmN values that we observe in the Undirhlíðar ridge data, we modeled polybaric continuous melting for two mantle sources under the same conditions using AlphaMelts. One mantle source is the depleted mantle (DMM) from Workman and Hart (2005). The other mantle source is DMM that has been enriched in pyroxenite (Koornneef et al., 2012). Melts from the two mantle sources reproduce REE patterns observed at Undirhlíðar ridge (Figure 7). The depleted mantle melt overlaps with REE for the less-enriched group. The melt from the DMM enriched with pyroxenite overlaps with REE for the more-enriched group. This suggests that the difference in LaN/SmN ratio can be generated by different mantle source compositions that melt under similar conditions. To generate the trace element trends with comparatively constant degrees of melting, the more-enriched samples require a higher amount of the enriched mantle component, which we also observe in our isotopic and trace element ratio data.
Our understanding of the nature of the magma plumbing system can be informed by the relationship between crystallization and mixing of heterogeneous mantle melts. Because the curvature of a mixing hyperbola in plots of incompatible trace element ratios depends on the denominators of the endmembers, mixing should result in a linear array on a plot of 1/Y versus Zr/Y (Langmuir et al., 1978). Undirhlíðar ridge data fall off a linear array as a result of variable degrees of crystallization, with the most evolved lavas extending to the lowest values of 1/Y (Figure 9D). Mixing must have occurred prior to crystallization. This is consistent with major elements trends, where the compositional groups must have had parent magma compositions that differed in CaO, SiO2, and K2O (Figure 8). The magma plumbing system preserves mantle source signatures on small spatial scales. Within the area exposed by Undirhlíðar quarry, we observe more-enriched lavas intruded by less-enriched magmas. Vatnsskarð quarry is dominated by the less-enriched group but shows geographic shifts in LREE enrichment within the northernmost exposures. The mixed group is the most evolved, suggesting that it was cooled to greater degrees. Because this compositional variability is preserved, even at the local scale, there must be no large-scale efficient mixing processes to homogenize the magma. We propose that the magmatic plumbing system consisted of separately evolving crustal melt bodies and that original model from Pollock et al. (2014) extends to the entire ridge.
Paleo-ice conditions for Undirhlíðar ridge are constrained by the measurements of water in quenched glassy pillow rims. Glass textures and variations in volatile content show evidence of volatile saturation and degassing. The glasses show abundant vesicles, suggesting degassing of a volatile saturated magma (Tuffen et al., 2010). Because CO2 degasses more readily than H2O, and measured CO2 concentrations are at or below the detection limits, CO2 was essentially entirely degassed when the glasses were quenched (Dixon and Stolper, 1995). Although it is possible that vesicles represent predominately CO2 bubbles that formed before H2O degassing, samples with low H2O/Ce ratios indicate that H2O degassing has occurred in the Undirhlíðar suite. Post-emplacement hydration has not affected H2O contents presented in this study. Although higher H2O concentrations were observed in the fractures, we avoided fractures while measuring. The lack of measurable H2Om peaks and low H2Om/H2Ot ratios suggest that molecular water was not enriched by secondary hydration. Thus, we infer that the Undirhlíðar ridge magmas degassed prior to quenching and that H2O concentrations are indicative of pressures during emplacement.
Calculated saturation pressures suggest that Undirhlíðar ridge formed within ice at least 200 m thick. The range of water contents and emplacement pressures at Undirhlíðar ridge is similar to those observed in other subglacial edifices on the Reykjanes Peninsula (Nichols et al., 2002; Schopka et al., 2006). At Helgafell, a Pleistocene-age hyaloclastite ridge ∼1 km east of this study, ice thickness was estimated to be ∼500 m at the time of eruption, although volatile contents indicated lower emplacement pressures caused by meltwater drainage and ice subsidence (Schopka et al., 2006). Estimates of ice thickness on the Reykjanes Peninsula during the last glacial maximum range from 250 m to 500 m (Einarsson et al., 1988; Licciardi et al., 2007; Le Breton et al., 2010; Patton et al., 2017).
A major change in water contents at Undirhlíðar ridge correlates with a shift in the magmatic system. The more-enriched lavas show higher H2O contents than the less-enriched lavas, which is likely due to differences in magma composition. The geochemical groups have similar H2O/Ce ratios, indicating that the mixed and more-enriched samples have not experienced more degassing than the less-enriched samples. The positive linear correlation between H2O and Ce suggests that water is behaving as an incompatible element. We interpret the shift from wetter, more-enriched lavas to less-wet, less-enriched lavas as a result of a shift in melts from a more enriched mantle to a more depleted mantle.
However, within the less-enriched group, lavas show variable extents of degassing. Less-enriched lavas with lower H2O/Ce ratios have undergone more degassing than those with higher values. Many of the less-enriched samples show saturation pressures lower than expected for glaciostatic conditions. These less-enriched lavas show wide variations in water contents, saturation pressures, and H2O/Ce ratios over short distances (∼100 s of m) at mid-elevations along the ridge. For this group of less-enriched lavas, hydrologic conditions were dynamic during emplacement.
Ice conditions varied during construction of Undirhlíðar ridge. Saturation pressures suggest that Undirhlíðar ridge erupted under thin ice, similar to conditions at Grímsvötn and Eyjafjallajökull (Magnússon et al., 2012). The initial summit eruption in the 2010 Eyjafjallajökull event occurred under ∼200 m thick ice, leading to high subglacial water pressures associated with localized glacier uplift and accumulation of meltwater in an ice cauldron (Magnússon et al., 2012). Accumulated water was released in supraglacial flooding that lowered water levels and reduced emplacement pressures (Magnússon et al., 2012). Within days, flank eruptions extending ∼1 km from the summit experienced different hydrologic conditions. Flank eruptions occurred on steeper slopes under thinner (50–100 m thick) ice, resulting in rapid drainage of meltwater through high volume, short duration flood events (Magnússon et al., 2012) that created localized water-drained areas with low emplacement pressures (Woodcock et al., 2016). The dynamic variability in hydrologic conditions at Eyjafjallajökull over km-long spatial scales and days-long temporal scales is consistent with the variable extents of degassing observed in the less-enriched lavas that comprise the bulk of the ridge at Undirhlíðar. Saturation pressures return to values consistent with glaciostatic conditions in the upper elevations of Undirhlíðar ridge, suggesting that the upper portions of the edifice were emplaced beneath ice or in a stable englacial lake. The presence of ice at the upper reaches of the ridge is also illustrated by the diamict that drapes over Vatnsskarð quarry, which is consistent with a recovery or return of ice after eruptions ceased.
Our detailed study of the compositions and lithostratigraphic relationships allows us to propose several revisions to the existing models for the construction of glaciovolcanic fissure-fed eruptions. We observe a full vertical section of Undirhlíðar ridge in Vatnsskarð quarry. The basal contact of the ridge lies uncomformably over older palagonitized tuff-breccia, pillow lavas and local glaciofluvial deposits. The sandy and muddy diamict units draping over the central and southern walls of the quarry, in addition to the remnant till deposits scattered along the length of the ridge top, suggest that the pillow ridge was covered by a glacier after the eruption. We infer that the ∼3 km length of the ridge was emplaced in an ice-confined environment through a series of fissure eruptions.
Eruptions were fed by multiple vents (Figure 12). Plunges reveal that many of the pillows were erupted from vents that parallel the strike of the ridge, but exposures in quarry walls also show eruptive vents and pillow emplacement that were ridge-perpendicular (Figure 6). An example of this is the north wall of the Vatnsskarð quarry, in which the plunge directions in the north wall pillows suggest that this is an isolated “nose” of pillows that erupted off the main ridge axis. The north wall pillow lavas are also compositionally distinct from the other eruptive units in Vatnsskarð quarry, suggesting that the north wall pillows form their own distinct pillow mound within the broader ridge structure.
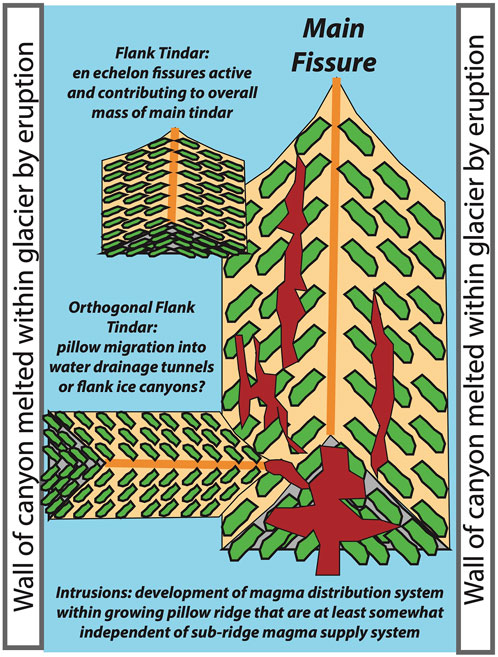
FIGURE 12. Schematic cartoon showing the important, newly identified components of tindar ridge construction. The main fissure system produces pillow lavas (green) that generally plunge downslope perpendicular to the axis of the fissure. Subsidiary, smaller fissures parallel but adjacent to main fissure produce flank pillow mounds that are eventually incorporated into the overall ridge structure. Locally fissures open orthogonal to the main fissure and produce secondary pillow ridges that form perpendicular to the overall fissure structure. Intrusions (red) within the ridge system are part of the lava distributary system within the ridge.
Within the growing edifice, magma was transported in a complex intrusive system (Figure 12). Some dykes are ridge-parallel and cut through pillows that belong to a different compositional group, suggesting that dykes played an important role in transporting magma along-axis. Irregular intrusions are exposed in both Undirhlíðar ridge and in Vatnsskarð quarry. Some have open tube structures and others show evidence of collapsed tube structures, such as shelves and lava drips that are typical of lava tubes in subaerial and glaciovolcanic systems (Hungerford et al., 2014). The irregular and massive intrusions frequently are the same composition as the lavas into which they intrude. We interpret these to be part of the shallow plumbing system of the growing pillow edifice, which were important for distributing magma locally.
Emplacement conditions and the magma source changed as the edifice grew. Eruptions forming the lowermost units were fed by more-enriched mantle melts emplaced into a ∼200 m thick ice sheet under glaciostatic conditions. Eruptions forming the bulk of the ridge were fed by less-enriched mantle melts. These less-enriched lavas degassed to variable extents under dynamically shifting hydrologic conditions along the length of the ridge. Less-enriched melts continued to feed eruptions forming the uppermost units, where emplacement conditions were glaciostatic.
We originally proposed a sequence of events for the construction of the volcanic succession exposed at Undirhlíðar quarry that included multiple eruptive and intrusive phases (Pollock et al., 2014). This study expands on previous work by adding detailed lithostratigraphic mapping of Vatnskarð quarry, additional major and trace element data, and new volatile and isotope analyses. Using the field relationships and geochemical findings from this study, we extend the model to the formation of Undirhlíðar ridge that is summarized as follows (Figure 13):
1. The entire ridge was emplaced upon a glaciated surface of pre-existing glaciovolcanic deposits, presumably from an early glaciation. Limited exposures show palagonitized tuff-breccia unconformably overlain by discontinuous gravels.
2. The lower units at the northern extent of Undirhlíðar ridge were emplaced in an initial eruptive phase under ice at least ∼200 m thick. These lavas (Lp1-2) were fed from a cooling crustal magma reservoir supplied by melts from a more-enriched mantle source. The eruptive events were mainly effusive, punctuated by pauses and collapse events that deposited stratified layers of vitric tuff and tuff-breccia at the fronts of advancing pillow mounds. At both quarries the lower two pillow units show similar relationships (Pollock et al., 2014; Figure 10) and are overlain locally by lapilli tuff and tuff-breccia. Intrusions are also present in Lp2 at both quarries, although in Vatnskarð the within ridge plumbing is better exposed.
3. The bulk of the ridge was emplaced in subsequent eruptive phases under dynamically changing ice conditions. At Undirlhiðar quarry this phase is mainly preserved as Lp3 (Pollock et al., 2014) but in Vatnskarð quarry the ridge is higher and shows the emplacement of three more pillow units (Lp3-Lp5). This phase was triggered by the injection of melts from a less-enriched mantle source into the crust. In this primary ridge-building phase, separate crustal melt reservoirs fed multiple eruptive vents along the fissure. Draining melt channels and an ephemeral englacial lake created rapidly changing emplacement pressures along the length of the ridge. Eruption style shifted between effusive and explosive, combining with localized pauses in volcanic activity to deposit lenses of tephra between growing pillow mounds. Magma was transported to the margins of the growing edifice through an internal plumbing system of shallow, irregularly shaped intrusions.
4. A final eruptive phase smaller than the others emplaced the final pillow lava unit (Lp6) as well as dykes near the center of the ridge. These lavas were fed by a crustal melt reservoir containing mixed magma that had cooled and crystallized to a greater degree in the crust.
5. The eruption ceased and the edifice was covered by ice, producing the capping layer of glaciofluvial diamict.
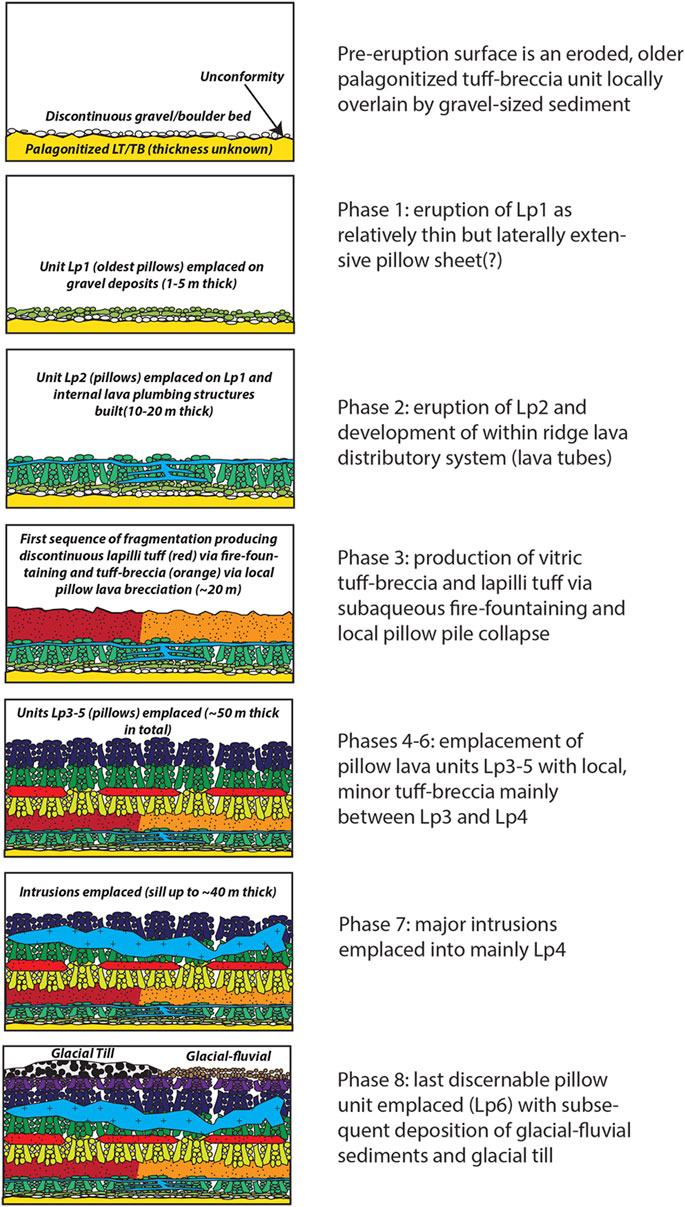
FIGURE 13. Formation sequence for Undirhliðar tindar based on exposures in Vatnskarð quarry. Panels are labeled with main eruption events. Unit colors are the same as in the legend for Figure 3.
By sampling and mapping Undirhlíðar ridge at a high-resolution, we are able to test general models for the construction of tindar ridges. Our study confirms some aspects of the theoretical models, namely, that 1) pillow-dominated tindar ridges are built through a complex sequence of eruptive phases from multiple eruptive vents that show changing eruptive styles (effusive vs. explosive) and 2) hydrologic conditions are dynamic on small spatial scales. Our study also adds new insights into the enigmatic aspects of the theoretical models, namely, that shallow-level intrusions are important to distributing lava within the growing pillow edifice.
The 2021–22 eruptions at Fagradalsfjall, which is located on the volcanic system adjacent to the western side of Krýsuvík, allows us to use direct observations of a subaerial fissure eruption to surmise details that cannot be observed in subglacial environments. At Undirhlíðar ridge, pillow orientations and compositions provide evidence for multiple eruptive vents, but it is not possible to know the number or spacing of active vents. Variations in stratigraphic packages are consistent with numerous eruptive pulses, but it is difficult to determine the duration of the Undirhlíðar ridge eruption. Volcanic activity at Fagradalsfjall lasted for ∼6 months, followed by a ∼2-week eruption nearly a year later (Pedersen et al., 2022). At least five eruptive vents opened along a ∼2 km long fissure segment (Bindeman et al., 2022; Pedersen et al., 2022). Volcanic activity pulsated and eruption style shifted between effusive lava extrusion and more explosive fire fountaining (Bindeman et al., 2022; Halldórsson et al., 2022). The resulting lava field covers an area of ∼5 km2 with a DRE volume of ∼0.1 km3 (Bindeman et al., 2022) and an average estimated thickness of 30 m (Pedersen et al., 2022) Like Fagradalsfjall, Undirhlíðar ridge was built by a moderately-sized eruption that occurred along a fissure segment on the order of 3–4 km long, and has an area of about 4.3 km2. Pillow-dominated tindars like Undirhlíðar ridge are interpreted to be the result of short-duration, small-volume monogenetic events (Jakobsson and Johnson, 2012). Such events have been observed in modern glaciovolcanic eruptions at Eyjafjallajökull (2010) and Gjalp (1996) (Thordarson and Larsen, 2007; Gudmundsson et al., 2012). Despite the difference in eruptive environments, the spatial and temporal scales of the Fagradalsfjall eruption may be similar to the tindar-building fissure eruption that constructed Undirhlíðar ridge.
Direct geophysical and petrological observations at Fagradalsfjall yield insights into the processes that initiated the Undirhlíðar ridge eruption. At Undirhlíðar ridge, lavas with different mantle source signatures were erupted sequentially from separate crustal melt reservoirs, suggesting that the main ridge-building event was triggered by injection of magma into the crustal plumbing system. At Fagradalsfjall, the eruption was fed from a lower crustal magma reservoir at near-Moho (∼15–20 km) depths, supplied with chemically variable melts from a heterogeneous mantle (Bindeman et al., 2022; Halldórsson et al., 2022). Erupted lava compositions at Fagradalsfjall progressively transitioned to more enriched mantle melts (Bindeman et al., 2022; Halldórsson et al., 2022). The addition of enriched melts to a deep crustal magma reservoir may have caused a mixing event that initiated magma ascent and eruption (Halldórsson et al., 2022). In the months leading up to the Fagradalsfjall eruption, seismic swarms and surface inflation were attributed to subsurface magma migration (Cubuk-Sabuncu et al., 2021; Geirsson et al., 2021; Sigmundsson et al., 2022). At least a year prior to the geophysical signals of volcano-tectonic unrest, the deep magma chamber experienced a disequilibrium event (Kahl et al., 2022). Diffusion modeling of olivine and plagioclase crystals suggests that the onset of disequilibrium in the deep magma chamber was related to magma injection and mush disaggregation (Kahl et al., 2022). At both Fagradalsfjall and Undirhlíðar ridge, the supply of heterogeneous mantle melts to the deep parts of the magmatic system played a critical role in initiating eruptions (e.g., Kahl et al., 2022).
The relative locations of the Krýsuvík andFagradalsfjall volcanic systems allows us to comment on spatial variations in mantle composition under the Reykjanes Peninsula. Bindeman et al. (2022) identified at least three different mantle components in the Fagradalsfjall lavas and proposed a lateral gradient in degree of mantle enrichment, in the context of the “plume sheath” suggested by previous researchers (Fitton et al., 1997; Kempton et al., 2000; Murton et al., 2002). The laterally variable plume sheath model predicts that Krýsuvík should erupt lavas more enriched in incompatible trace elements and radiogenic isotopes (Fitton et al., 1997; Kempton et al., 2000; Murton et al., 2002; Bindeman et al., 2022). We find no evidence for a systematic change in mantle composition between Fagradalsfjall and Undirhlíðar ridge. Undirhlíðar ridge has more radiogenic 206Pb/204Pb and 208Pb/204Pb than Fagradalsfjall, but Sr-Nd isotopes do not show the same enrichment. Fagradalsfjall incompatible trace element ratios overlap with and extend beyond the Undirhlíðar ridge data. The Undirhlíðar ridge and Fagradalsfjall eruptions capture magmatic conditions for moments in time, reflecting complex interactions among the scale of mantle source heterogeneity, the region of melt generation, and the mechanism of melt extraction (e.g., Peate et al., 2009). A more appropriate evaluation of the lateral plume sheath model should examine the full range of trace element and isotope compositions erupted at each of the volcanic systems on the Reykjanes Peninsula over the longest available time frames (e.g., Gee et al., 1998; Peate et al., 2009).
Our work presents one of the most comprehensive geochemical and physical investigations of a single pillow-dominated tindar to date. We add to existing models for tindar formation by addressing details not easily identified in natural erosional exposures. We provide evidence for magmatic processes that produce geochemical diversity within the ridge stratigraphy and intrusions that play a significant role in ridge growth. The nearby eruption at Fagradalsfjall provides a modern analogue that is useful for understanding the events at Undirhlíðar ridge. Despite the difference in eruption environment, the Fagradalsfjall and Undirhlíðar ridge eruptions may have been triggered by similar mixing events and occurred over comparable spatial and temporal scales. Overall, we confirm that tindar ridges are built through a complex series of extrusive and intrusive events under changing hydrologic conditions.
The original contributions presented in the study are included in the article/Supplementary Material, further inquiries can be directed to the corresponding author.
MP: Conceptualization, methodology, investigation, analysis, writing (all phases), visualization, supervision, project administration, funding acquisition. BE: Conceptualization, methodology, investigation, analysis, writing (all phases), visualization, supervision, project administration, funding acquisition. SJ: Analysis, data curation, visualization. CW, AH, AP, and EW: Investigation, visualization. SH: Resources, visualization.
This work was supported by The College of Wooster Luce Fund, the Keck Geology Consortium (NSF EAR 2050697-MP), NSF EAR 0958928 (MP), NSF EAR 1220176 (MP), the Dickinson College Research and Development Committee, and NSF EAR 1220403 (BE).
We thank G. Dwyer for ICP-MS and DCP analyses, D. Coleman and R. Mills for isotope analyses, and S. Seaman for FTIR analyses. Thanks to GAIN for help with manuscript preparation and G. Einarsson (ÍSOR) for supplying information for Figure 1. For their assistance in the field and lab, we thank J. Ciarrocca, J. Franceschi, W. Kochtitzky, B. Kumpf, E. Plascencia, M. Reinthal, A. Silverstein, T. Spillman, M. Williams, and the 2016 Keck Iceland Team. This paper benefited from inspiring discussions with K. Sæmundsson and M.T. Gudmundsson.
The authors declare that the research was conducted in the absence of any commercial or financial relationships that could be construed as a potential conflict of interest.
All claims expressed in this article are solely those of the authors and do not necessarily represent those of their affiliated organizations, or those of the publisher, the editors and the reviewers. Any product that may be evaluated in this article, or claim that may be made by its manufacturer, is not guaranteed or endorsed by the publisher.
The Supplementary Material for this article can be found online at: https://www.frontiersin.org/articles/10.3389/feart.2023.1095135/full#supplementary-material
Allmendinger, R. W., Cardozo, N. C., and Fisher, D. (2013). Structural Geology Algorithms: Vectors and Tensors. Cambridge, England: Cambridge University Press.
Bindeman, I. N., Deegan, F. M., Troll, V. R., Thordarson, T., Höskuldsson, Á., Moreland, W. M., et al. (2022). Diverse mantle components with invariant oxygen isotopes in the 2021 Fagradalsfjall eruption, Iceland. Nat Commun 13, 3737. doi:10.1038/s41467-022-31348-7
Bottinga, Y., and Weill, D. F. (1972). The viscosity of magmatic silicate liquids; a model calculation. American Journal of Science 272, 438–475. doi:10.2475/ajs.272.5.438
Boyd, F. R., and Mertzman, S. A. (1987). Composition and structure of the Kaapvaal lithosphere, Southern Africa, 1. University Park, PA: Special Publication - Geochemical Society, 13–24.
Cardozo, N. C., and Allmendinger, R. W. (2013). Spherical projections with OSXStereonet. Computers and Geosciences 51, 193–205. doi:10.1016/j.cageo.2012.07.021
Chauvel, C., and Hémond, C. (2000). Melting of a complete section of recycled oceanic crust: Trace element and Pb isotopic evidence from Iceland. Geochemistry, Geophysics, Geosystems 1. doi:10.1029/1999GC000002
Cheatham, M. M., Sangrey, W. F., and White, W. M. (1993). Sources of error in external calibration ICP-MS analysis of geological samples and an improved non-linear drift correction procedure. Spectrochimica Acta Part B: Atomic Spectroscopy 48, 487–506. doi:10.1016/0584-8547(93)80054-X
Condomines, M., Grönvold, K., Hooker, P. J., Muehlenbachs, K., O’Nions, R. K., Óskarsson, N., et al. (1983). Helium, oxygen, strontium and neodymium isotopic relationships in Icelandic volcanics. Earth and Planetary Science Letters 66, 125–136. doi:10.1016/0012-821X(83)90131-0
Cubuk-Sabuncu, Y., Jónsdóttir, K., Caudron, C., Lecocq, T., Parks, M. M., Geirsson, H., et al. (2021). Temporal Seismic Velocity Changes During the 2020 Rapid Inflation at Mt. Þorbjörn-Svartsengi, Iceland, Using Seismic Ambient Noise. Geophysical Research Letters 48, e2020GL092265. doi:10.1029/2020GL092265
Dixon, J. E., and Clague, D. A. (2001). Volatiles in basaltic glasses from Loihi Seamount, Hawaii: Evidence for a relatively dry plume component. Journal of Petrology 42, 627–654. doi:10.1093/petrology/42.3.627
Dixon, J. E., and Stolper, E. M. (1995). An experimental study of water and carbon dioxide solubilities in mid-ocean ridge basaltic liquids. Part II: Applications to degassing. Journal of Petrology 36, 1633–1646. doi:10.1093/oxfordjournals.petrology.a037268
Dixon, J. E., Stolper, E. M., and Holloway, J. R. (1995). An experimental study of water and carbon dioxide solubilities in mid-ocean ridge basaltic liquids. Part I: Calibration and solubility models. Journal of Petrology 36, 1607–1631. doi:10.1093/oxfordjournals.petrology.a037267
Doherty, W. (1989). An internal standardization procedure for the determination of yttrium and the rare earth elements in geological materials by inductively coupled plasma-mass spectrometry. Spectrochimica Acta Part B: Atomic Spectroscopy 44, 263–280. doi:10.1016/0584-8547(89)80031-X
Eason, D. E., Sinton, J., Gronvold, K., and Kurz, M. D. (2015). Effects of deglaciation on the petrology and eruptive history of the Western Volcanic Zone, Iceland. Bulletin of Volcanology 77, 47. doi:10.1007/s00445-015-0916-0
Eason, D. E., and Sinton, J. M. (2009). Lava shields and fissure eruptions of the Western Volcanic Zone, Iceland: Evidence for magma chambers and crustal interaction. Journal of Volcanology and Geothermal Research 186, 331–348. doi:10.1016/j.jvolgeores.2009.06.009
Edwards, B., Magnússon, E., Thordarson, T., Guđmundsson, M. T., Höskuldsson, A., Oddsson, B., et al. (2012). Interactions between lava and snow/ice during the 2010 Fimmvörðuháls eruption, south-central Iceland. Journal of Geophysical Research: Solid Earth 117. doi:10.1029/2011JB008985
Edwards, B. R., Russell, J. K., Jicha, B., Singer, B. S., Dunnington, G., and Jensen, R. (2020). “A 3 million year record of volcanism and glaciation in northern British Columbia, Canada,” Geological Society of America Special Paper, Untangling the Quaternary Period: A Legacy of Stephen C. Porter. Editors R. B. Waitt, G. D. Thackray, and A. R. Gillespie doi:10.1130/2020.2548
Edwards, B. R., Russell, J. K., and Simpson, K. (2011). Volcanology and petrology of Mathews Tuya, northern British Columbia, Canada: glaciovolcanic constraints on interpretations of the 0.730 Ma Cordilleran paleoclimate. Bull Volcanol 73, 479–496. doi:10.1007/s00445-010-0418-z
Edwards, B. R., Russell, J. K., and Pollock, M. (2022). Cryospheric forcing on volcano-magmatic systems. Front. Earth Sci. 10, 871951. doi:10.3389/feart.2022.871951
Edwards, B. R., Skilling, I. P., Cameron, B., Haynes, C., Lloyd, A., and Hungerford, J. H. D. (2009). Evolution of an englacial volcanic ridge: Pillow Ridge tindar, Mount Edziza volcanic complex, NCVP, British Columbia, Canada. Journal of Volcanology and Geothermal Research 185, 251–275. doi:10.1016/j.jvolgeores.2008.11.015
Einarsson, T., Albertsson, K. J., Shackleton, N. J., West, R. G., and Bowen, D. Q. (1988). The glacial history of Iceland during the past three million years. Philosophical Transactions of the Royal Society of London. B, Biological Sciences 318, 637–644. doi:10.1098/rstb.1988.0027
Eysteinsson, H. (2001). Resistivity measurements around Trölladyngja and Núpshlíðarháls, Reykjanes Peninsula. NEA Report OS-2001/038.
Fine, G., and Stolper, E. (1985). The speciation of carbon dioxide in sodium aluminosilicate glasses. Contr. Mineral. and Petrol. 91, 105–121. doi:10.1007/BF00377759
Fitton, J. G., Saunders, A. D., Kempton, P. D., and Hardarson, B. S. (2003). Does depleted mantle form an intrinsic part of the Iceland plume? Geochemistry, Geophysics, Geosystems 4. doi:10.1029/2002GC000424
Fitton, J. G., Saunders, A. D., Norry, M. J., Hardarson, B. S., and Taylor, R. N. (1997). Thermal and chemical structure of the Iceland plume. Earth and Planetary Science Letters 153, 197–208. doi:10.1016/S0012-821X(97)00170-2
Flóvenz, Ó. G., Wang, R., Hersir, G. P., Dahm, T., Hainzl, S., Vassileva, M., et al. (2022). Cyclical geothermal unrest as a precursor to Iceland’s 2021 Fagradalsfjall eruption. Nat. Geosci. 15, 397–404. doi:10.1038/s41561-022-00930-5
Gee, M. A. M., Thirlwall, M. F., Taylor, R. N., Lowry, D., Murton, B. J., and Bohrson, W. A. (1998). Crustal processes; major controls on Reykjanes Peninsula lava chemistry, SW Iceland. J.Petrol. 39, 819–839. doi:10.1093/petroj/39.5.819
Geirsson, H., Parks, M., Vogfjörd, K., Einarsson, P., Sigmundsson, F., Jónsdóttir, K., et al. (2021). The 2020 volcano-tectonic unrest at Reykjanes Peninsula, Iceland: stress triggering and reactivation of several volcanic systems. EGU21-7534. doi:10.5194/egusphere-egu21-7534
Ghiorso, M. S., Hirschmann, M. M., Reiners, P. W., and Kress, V. C. (2002). The pMELTS; a revision of MELTS for improved calculation of phase relations and major element partitioning related to partial melting of the mantle to 3 GPa. Geochemistry Geophysics Geosystems 3, 1–35. doi:10.1029/2001gc000217
Ghiorso, M. S., and Sack, R. O. (1995). Chemical mass transfer in magmatic processes IV. A revised and internally consistent thermodynamic model for the interpolation and extrapolation of liquid-solid equilibria in magmatic systems at elevated temperatures and pressures. Contributions to Mineralogy and Petrology 119, 197–212. doi:10.1007/bf00307281
Global Volcanism Program (2022a). Report on Fagradalsfjall (Iceland) — 3 August-9 August 2022. Available at: https://volcano.si.edu/ShowReport.cfm?wvar=GVP.WVAR20220803-371032 (Accessed September 26, 2022).
Global Volcanism Program (2022b). Report on Fagradalsfjall (Iceland) — 17 August-23 August 2022). Available at: https://volcano.si.edu/ShowReport.cfm?wvar=GVP.WVAR20220817-371032 (Accessed September 26, 2022).
Global Volcanism Program (2022c). Report on Fagradalsfjall (Iceland) — 27 July-2 August 2022. Available at: https://volcano.si.edu/ShowReport.cfm?wvar=GVP.WVAR20220727-371032 (Accessed September 26, 2022).
Gudmundsson, M., Larsen, G., Höskuldsson, Á., and Gylfason, Á. G. (2008). Volcanic hazards in Iceland. Jökull 58, 251–268.
Gudmundsson, M., Sigmundsson, F., and Björnsson, H. (1997). Ice–volcano interaction of the 1996 Gjálp subglacial eruption, Vatnajökull, Iceland. Nature 389, 954–957. doi:10.1038/40122
Gudmundsson, M. T. (2005). “6. Subglacial volcanic activity in Iceland,” in Developments in Quaternary Sciences Iceland — Modern Processes and Past Environments. Editors C. Caseldine, A. Russell, J. Harđardóttir, and Ó. Knudsen (Amsterdam, Netherlands: Elsevier), 127–151. doi:10.1016/S1571-0866(05)80008-9
Gudmundsson, M. T., Sigmundsson, F., Björnsson, H., and Högnadóttir, T. (2004). The 1996 eruption at Gjalp, Vatnajokull ice cap, Iceland: efficiency of heat transfer, ice deformation and subglacial water pressure. Bulletin of Volcanology 66, 46–65. doi:10.1007/s00445-003-0295-9
Gudmundsson, M. T., Thordarson, T., Höskuldsson, Á., Larsen, G., Björnsson, H., Prata, F. J., et al. (2012). Ash generation and distribution from the April-May 2010 eruption of Eyjafjallajökull, Iceland. Sci Rep 2, 572. doi:10.1038/srep00572
Halldórsson, S. A., Barnes, J. D., Stefánsson, A., Hilton, D. R., Hauri, E. H., and Marshall, E. W. (2016). Subducted lithosphere controls halogen enrichments in the Iceland mantle plume source. Geology 44, 679–682. doi:10.1130/G37924.1
Halldórsson, S. A., Marshall, E. W., Caracciolo, A., Matthews, S., Bali, E., Rasmussen, M. B., et al. (2022). Rapid shifting of a deep magmatic source at Fagradalsfjall volcano, Iceland. Nature 609, 529–534. doi:10.1038/s41586-022-04981-x
Hanan, B. B., Blichert-Toft, J., Kingsley, R., and Schilling, J.-G. (2000). Depleted Iceland mantle plume geochemical signature: Artifact of multicomponent mixing? Geochemistry, Geophysics, Geosystems 1. doi:10.1029/1999GC000009
Hanan, B. B., and Schilling, J.-G. (1997). The dynamic evolution of the Iceland mantle plume: the lead isotope perspective. Earth and Planetary Science Letters 151, 43–60. doi:10.1016/S0012-821X(97)00105-2
Hemond, C., Arndt, N. T., Lichtenstein, U., Hofmann, A. W., Oskarsson, N., and Steinthorsson, S. (1993). The heterogeneous Iceland plume: Nd-Sr-O isotopes and trace element constraints. Journal of Geophysical Research: Solid Earth 98, 15833–15850. doi:10.1029/93JB01093
Hemond, Ch., Condomines, M., Fourcade, S., Allègre, C. J., Oskarsson, N., and Javoy, M. (1988). Thorium, strontium and oxygen isotopic geochemistry in recent tholeiites from Iceland: crustal influence on mantle-derived magmas. Earth and Planetary Science Letters 87, 273–285. doi:10.1016/0012-821X(88)90015-5
Hersir, G. P., Árnason, K., Vilhjálmsson, A. M., Saemundsson, K., Ágústsdóttir, Þ., and Friðleifsson, G. Ó. (2020). Krýsuvík high temperature geothermal area in SW Iceland: Geological setting and 3D inversion of magnetotelluric (MT) resistivity data. Journal of Volcanology and Geothermal Research 391, 106500. doi:10.1016/j.jvolgeores.2018.11.021
Höskuldsson, A., Sparks, R. S. J., and Carroll, M. R. (2006). Constraints on the dynamics of subglacial basalt eruptions from geological and geochemical observations at Kverkfjoll, NE-Iceland. Bull. Volc. 68, 689–701. doi:10.1007/s00445-005-0043-4
Hungerford, J. D. G., Edwards, B. R., Skilling, I. P., and Cameron, B. I. (2014). Evolution of a subglacial basaltic lava flow field: Tennena volcanic center, Mount Edziza volcanic complex, British Columbia, Canada. Journal of Volcanology and Geothermal Research 272, 39–58. doi:10.1016/j.jvolgeores.2013.09.012
Jakobsson, S. P., and Gudmundsson, M. T. (2008). Subglacial and intraglacial volcanic formations in Iceland. Jökull 58, 179–196.
Jakobsson, S. P., and Johnson, G. L. (2012). Intraglacial volcanism in the Western Volcanic Zone, Iceland. Bull Volcanol 74, 1141–1160. doi:10.1007/s00445-012-0589-x
Jakobsson, S. P., Jonsson, J., and Shido, F. (1978). Petrology of the western Reykjanes Peninsula, Iceland. J.Petrol. 19, 669–705. doi:10.1093/petrology/19.4.669
Jarvis, K. E. (1988). Inductively coupled plasma mass spectrometry: A new technique for the rapid or ultra-trace level determination of the rare-earth elements in geological materials. Chemical Geology 68, 31–39. doi:10.1016/0009-2541(88)90084-8
Jenner, G. A., Longerich, H. P., Jackson, S. E., and Fryer, B. J. (1990). ICP-MS — A powerful tool for high-precision trace-element analysis in Earth sciences: Evidence from analysis of selected U.S.G.S. reference samples. Chemical Geology 83, 133–148. doi:10.1016/0009-2541(90)90145-W
Jones, J. G. (1969). Intraglacial volcanoes of the Laugarvatn region, south-west Iceland, I. Quarterly Journal of the Geological Society 124, 197–211. doi:10.1144/gsjgs.124.1.0197
Jones, J. G. (1970). Intraglacial volcanoes of the Laugarvatn region, southwest Iceland, II. J.Geol. 78, 127–140. doi:10.1086/627496
Jónsson, J. (1978). Jarðfræðikort af Reykjanesskaga (Geological map of Reykjanes Peninsula). Orkustofnun JHD, Reykjavik: Iceland Energy Authority.
Kahl, M., Mutch, E. J. F., Maclennan, J., Morgan, D. J., Couperthwaite, F., Bali, E., et al. (2022). Deep magma mobilization years before the 2021 CE Fagradalsfjall eruption, Iceland. Geology 51, 184–188. doi:10.1130/G50340.1
Kempton, P. D., Fitton, J. G., Saunders, A. D., Nowell, G. M., Taylor, R. N., Hardarson, B. S., et al. (2000). The Iceland plume in space and time: a Sr–Nd–Pb–Hf study of the North Atlantic rifted margin. Earth and Planetary Science Letters 177, 255–271. doi:10.1016/S0012-821X(00)00047-9
Klein, E. M., Langmuir, C. H., and Staudigel, H. (1991). Geochemistry of basalts from the southeast Indian Ridge, 115°E–138°E. Journal of Geophysical Research: Solid Earth 96, 2089–2107. doi:10.1029/90JB01384
Kokfelt, T. F., Hoernle, K., Hauff, F., Fiebig, J., Werner, R., and Barge-Schonberg, G. (2006). Combined trace element and Pb-Nd–Sr-O isotope evidence for recycled oceanic crust (upper and lower) in the Iceland mantle plume. Journal of Petrology 47, 1705–1749. doi:10.1093/petrology/egl025
Koornneef, J. M., Stracke, A., Bourdon, B., Meier, M. A., Jochum, K. P., Stoll, B., et al. (2012). Melting of a Two-component Source beneath Iceland. Journal of Petrology 53, 127–157. doi:10.1093/petrology/egr059
Langmuir, C. H., Vocke, R. D., Hanson, G. N., and Hart, S. R. (1978). A general mixing equation with applications to Icelandic basalts. Earth and Planetary Science Letters 37, 380–392. doi:10.1016/0012-821X(78)90053-5
Le Breton, E., Dauteuil, O., and Biessy, G. (2010). Post-glacial rebound of Iceland during the Holocene. Journal of the Geological Society 167, 417–432. doi:10.1144/0016-76492008-126
Lescinsky, D. T., and Fink, J. H. (2000). Lava and ice interaction at stratovolcanoes: Use of characteristic features to determine past glacial extents and future volcanic hazards. Journal of Geophysical Research: Solid Earth 105, 23711–23726. doi:10.1029/2000JB900214
Licciardi, J. M., Kurz, M. D., and Curtice, J. M. (2007). Glacial and volcanic history of Icelandic table mountains from cosmogenic 3He exposure ages. Quaternary Science Reviews 26, 1529–1546. doi:10.1016/j.quascirev.2007.02.016
Lichte, F. E., Meier, A. L., and Crock, J. G. (1987). Determination of the rare-earth elements in geological materials by inductively coupled plasma mass spectrometry. Analytical Chemistry 59, 1150–1157. doi:10.1021/ac00135a018
Longerich, H. P., Jenner, G. A., Fryer, B. J., and Jackson, S. E. (1990). Inductively coupled plasma-mass spectrometric analysis of geological samples: A critical evaluation based on case studies. Chemical Geology 83, 105–118. doi:10.1016/0009-2541(90)90143-U
Maclennan, J. (2008). Concurrent mixing and cooling of melts under Iceland. Journal of Petrology 49, 1931–1953. doi:10.1093/petrology/egn052
Maclennan, J., McKenzie, D., Hilton, F., Gronvöld, K., and Shimizu, N. (2003). Geochemical variability in a single flow from northern Iceland. Journal of Geophysical Research: Solid Earth 108, ECV 4-1–ECV 4-21. doi:10.1029/2000JB000142
Magnússon, E., Gudmundsson, M. T., Roberts, M. J., Sigurðsson, G., Höskuldsson, F., and Oddsson, B. (2012). Ice-volcano interactions during the 2010 Eyjafjallajökull eruption, as revealed by airborne imaging radar. Journal of Geophysical Research: Solid Earth 117. doi:10.1029/2012JB009250
McDonough, W. F., and Sun, S. -S. (1995). The composition of the Earth. Chemical Geology 120, 223–253. doi:10.1016/0009-2541(94)00140-4
Mcintosh, I. M., Nichols, A. R. L., Tani, K., and Llewellin, E. W. (2017). Accounting for the species-dependence of the 3500 cm–1 H2Ot infrared molar absorptivity coefficient: Implications for hydrated volcanic glasses. American Mineralogist 102, 1677–1689. doi:10.2138/am-2017-5952CCBY
McIntosh, I. M., Tani, K., Nichols, A. R. L., Chang, Q., and Kimura, J.-I. (2022). Past eruptions of a newly discovered active, shallow, silicic submarine volcano near Tokyo Bay, Japan. Geology 50, 1111–1115. doi:10.1130/G50148.1
McKenzie, D., and O’Nions, R. K. (1991). Partial melt distributions from inversion of rare earth element concentrations. Journal of Petrology 32, 1021–1091. doi:10.1093/petrology/32.5.1021
McKenzie, D., and O’Nions, R. K. (1995). The source regions of ocean island basalts. Journal of Petrology 36, 133–159. doi:10.1093/petrology/36.1.133
Miller, J. S., and Glazner, A. F. (1995). Jurassic plutonism and crustal evolution in the central Mojave Desert, California. Contr. Mineral. and Petrol. 118, 379–395. doi:10.1007/s004100050021
Momme, P., Óskarsson, N., and Keays, R. R. (2003). Platinum-group elements in the Icelandic rift system: melting processes and mantle sources beneath Iceland. Chemical Geology 196, 209–234. doi:10.1016/S0009-2541(02)00414-X
Moore, J. G., Hickson, C. J., and Calk, L. C. (1995). Tholeiitic-alkalic transition at subglacial volcanoes, Tuya region, British Columbia, Canada. Journal of Geophysical Research 100, 24577–24592. doi:10.1029/95jb02509
Murton, B. J., Taylor, R. N., and Thirlwall, M. F. (2002). Plume–ridge interaction: a geochemical perspective from the Reykjanes Ridge. Journal of Petrology 43, 1987–2012. doi:10.1093/petrology/43.11.1987
Newman, S., and Lowenstern, J. B. (2002). VolatileCalc: a silicate melt–H2O–CO2 solution model written in Visual Basic for excel. Computers and Geosciences 28, 597–604. doi:10.1016/S0098-3004(01)00081-4
Nichols, A. R. L., Carroll, M. R., and Hoskuldsson, A. (2002). Is the Iceland hot spot also wet? Evidence from the water contents of undegassed submarine and subglacial pillow basalts. Earth and Planetary Science Letters 202, 77–87. doi:10.1016/S0012-821X(02)00758-6
Oddsson, B., Gudmundsson, M. T., Edwards, B. R., Thordarson, T., Magnússon, E., and Sigurðsson, G. (2016). Subglacial lava propagation, ice melting and heat transfer during emplacement of an intermediate lava flow in the 2010 Eyjafjallajökull eruption. Bull Volcanol 78, 48–17. doi:10.1007/s00445-016-1041-4
Patton, H., Hubbard, A., Bradwell, T., and Schomacker, A. (2017). The configuration, sensitivity and rapid retreat of the Late Weichselian Icelandic ice sheet. Earth-Science Reviews 166, 223–245. doi:10.1016/j.earscirev.2017.02.001
Peate, D. W., Baker, J. A., Jakobsson, S. P., Waight, T. E., Kent, A. J. R., Grassineau, N. V., et al. (2009). Historic magmatism on the Reykjanes Peninsula, Iceland; a snap-shot of melt generation at a ridge segment. Contributions to Mineralogy and Petrology 157, 359–382. doi:10.1007/s00410-008-0339-4
Pedersen, G. B. M., Belart, J. M. C., Óskarsson, B. V., Gudmundsson, M. T., Gies, N., Högnadóttir, T., et al. (2022). Volume, Effusion Rate, and Lava Transport During the 2021 Fagradalsfjall Eruption: Results From Near Real-Time Photogrammetric Monitoring. Geophysical Research Letters 49, e2021GL097125. doi:10.1029/2021GL097125
Pollock, M., Edwards, B., Hauksdóttir, S., Alcorn, R., and Bowman, L. (2014). Geochemical and lithostratigraphic constraints on the formation of pillow-dominated tindars from Undirhlíðar quarry, Reykjanes Peninsula, southwest Iceland. Lithos 200– 201, 317–333. doi:10.1016/j.lithos.2014.04.023
Russell, J. K., Edwards, B. R., Porritt, L., and Ryane, C. (2014). Tuyas: a descriptive genetic classification. Quaternary Science Reviews 87, 70–81. doi:10.1016/j.quascirev.2014.01.001
Sæmundsson, K., Sigurgeirsson, M. Á., and Friðleifsson, G. Ó. (2020). Geology and structure of the Reykjanes volcanic system, Iceland. Journal of Volcanology and Geothermal Research 391, 106501. doi:10.1016/j.jvolgeores.2018.11.022
Sæmundsson, K., Sigurgeirsson, M. Á., Hjartarson, Á., Kaldal, I., and Kristinsson, S. G. (2016). Geological Map of of Southwest Iceland. Available at: https://en.isor.is/geological-maps-geological-web-map.
Sano, T., and Yamashita, S. (2019). Evolution, hydrothermal assimilation, and ascent of magma inferred from volatile contents in MORB glasses: An example from thick lava pile at IODP Site 1256. Lithos 346–347, 105143. doi:10.1016/j.lithos.2019.07.010
Schilling, J.-G. (1973). Iceland mantle plume: Geochemical study of Reykjanes Ridge. Nature 242, 565–571. doi:10.1038/242565a0
Schopka, H. H., Gudmundsson, M. T., and Tuffen, H. (2006). The formation of Helgafell, southwest Iceland, a monogenetic subglacial hyaloclastite ridge; sedimentology, hydrology and volcano-ice interaction. J.Volcanol.Geotherm.Res. 152, 359–377. doi:10.1016/j.jvolgeores.2005.11.010
Sigmundsson, F., Parks, M., Hooper, A., Geirsson, H., Vogfjörd, K. S., Drouin, V., et al. (2022). Deformation and seismicity decline before the 2021 Fagradalsfjall eruption. Nature 609, 523–528. doi:10.1038/s41586-022-05083-4
Skovgaard, A. C., Storey, M., Baker, J., Blusztajn, J., and Hart, S. R. (2001). Osmium–oxygen isotopic evidence for a recycled and strongly depleted component in the Iceland mantle plume. Earth and Planetary Science Letters 194, 259–275. doi:10.1016/S0012-821X(01)00549-0
Smellie, J. L. (2007). “Glacial landforms, Quaternary vulcanism, subglacial landforms,” in Encyclopedia of Quaternary Science. Editor S. A. Elias (Oxford: Elsevier), 784–798. doi:10.1016/B0-44-452747-8/00101-0
Smellie, J. L. (2008). Basaltic subglacial sheet-like sequences: Evidence for two types with different implications for the inferred thickness of associated ice. Earth-Science Reviews 88, 60–88. doi:10.1016/j.earscirev.2008.01.004
Smellie, J. L. (2013). “Quaternary vulcanism: subglacial landforms,” in Reference module in Earth Systems and Environmental Sciences The Encyclopedia of Quaternary Science (Amsterdam: Elsevier), 780–802.
Smellie, J. L. (2018). “Chapter 10 - Glaciovolcanism: A 21st Century Proxy for Palaeo-Ice,” in Past Glacial Environments. Editors J. Menzies, and J. J. M. van der Meer Second Edition (Amsterdam: Elsevier), 335–375 doi:10.1016/B978-0-08-100524-8.00010-5
Smellie, J. L., and Edwards, B. R. (2016). Glaciovolcanism on Earth and Mars. Cambridge, United Kingdom: Cambridge University Press.
Smellie, J. L., Johnson, J. S., McIntosh, W. C., Esser, R., Gudmundsson, M. T., Hambrey, M. J., et al. (2008). Six million years of glacial history recorded in volcanic lithofacies of the James Ross Island Volcanic Group, Antarctic Peninsula. Palaeogeography, Palaeoclimatology, Palaeoecology 260, 122–148. doi:10.1016/j.palaeo.2007.08.011
Smith, P. M., and Asimow, P. D. (2005). Adiabat_1ph: A new public front-end to the MELTS, pMELTS, and pHMELTS models. Geochemistry, Geophysics, Geosystems 6. doi:10.1029/2004GC000816
Stolper, E. (1982). The speciation of water in silicate melts. Geochimica et Cosmochimica Acta 46, 2609–2620. doi:10.1016/0016-7037(82)90381-7
Stracke, A., Bizimis, M., and Salters, V. J. M. (2003). Recycling oceanic crust: Quantitative constraints. Geochemistry, Geophysics, Geosystems 4. doi:10.1029/2001GC000223
Sun, S.-S., and Jahn, B. (1975). Lead and strontium isotopes in post-glacial basalts from Iceland. Nature 255, 527–530. doi:10.1038/255527a0
Thirlwall, M. F., Gee, M. A. M., Lowry, D., Mattey, D. P., Murton, B. J., and Taylor, R. N. (2006). Low δ18O in the Icelandic mantle and its origins; evidence from Reykjanes Ridge and Icelandic lavas. Geochim.Cosmochim.Acta 70, 993–1019. doi:10.1016/j.gca.2005.09.008
Thirlwall, M. F., Gee, M. A. M., Taylor, R. N., and Murton, B. J. (2004). Mantle components in Iceland and adjacent ridges investigated using double-spike Pb isotope ratios. Geochim.Cosmochim.Acta 68, 361–386. doi:10.1016/s0016-7037(03)00424-1
Thordarson, T., and Larsen, G. (2007). Volcanism in Iceland in historical time: Volcano types, eruption styles and eruptive history. Journal of Geodynamics 43, 118–152. doi:10.1016/j.jog.2006.09.005
Tuffen, H., Owen, J., and Denton, J. (2010). Magma degassing during subglacial eruptions and its use to reconstruct palaeo-ice thicknesses. Earth-Science Reviews 99, 1–18. doi:10.1016/j.earscirev.2010.01.001
Wilson, A. M., and Russell, J. K. (2017). Lillooet Glacier basalts, southwestern British Columbia, Canada: products of Quaternary glaciovolcanism. Can. J. Earth Sci. 54, 639–653. doi:10.1139/cjes-2016-0201
Wood, D. A., Joron, J.-L., Trueil, M., Norry, M., and Tarney, J. (1979). Elemental and Sr isotope variations in basic lavas from Iceland and the surrounding ocean floor. Contributions to Mineralogy and Petrology 70, 319–339. doi:10.1007/bf00375360
Woodcock, D. C., Lane, S. J., and Gilbert, J. S. (2016). Ice-melt rates during volcanic eruptions within water-drained, low-pressure subglacial cavities. Journal of Geophysical Research: Solid Earth 121, 648–662. doi:10.1002/2015JB012036
Keywords: glaciovolcanism, Iceland, Fagradalsfjall, geochemistry, volcano-ice interaction
Citation: Pollock M, Edwards BR, Judge S, Wallace C, Hiatt A, Perpalaj A, Was E and Hauksdóttir S (2023) The complex construction of a glaciovolcanic ridge with insights from the 2021 Fagradalsfjall Eruption (Iceland). Front. Earth Sci. 11:1095135. doi: 10.3389/feart.2023.1095135
Received: 10 November 2022; Accepted: 15 February 2023;
Published: 07 March 2023.
Edited by:
Alison Hollomon Graettinger, University of Missouri–Kansas City, United StatesReviewed by:
James D. L. White, University of Otago, New ZealandCopyright © 2023 Pollock, Edwards, Judge, Wallace, Hiatt, Perpalaj, Was and Hauksdóttir. This is an open-access article distributed under the terms of the Creative Commons Attribution License (CC BY). The use, distribution or reproduction in other forums is permitted, provided the original author(s) and the copyright owner(s) are credited and that the original publication in this journal is cited, in accordance with accepted academic practice. No use, distribution or reproduction is permitted which does not comply with these terms.
*Correspondence: Meagen Pollock, bXBvbGxvY2tAd29vc3Rlci5lZHU=
Disclaimer: All claims expressed in this article are solely those of the authors and do not necessarily represent those of their affiliated organizations, or those of the publisher, the editors and the reviewers. Any product that may be evaluated in this article or claim that may be made by its manufacturer is not guaranteed or endorsed by the publisher.
Research integrity at Frontiers
Learn more about the work of our research integrity team to safeguard the quality of each article we publish.