 Shan Yang
 Hongzhi Yang3
 Yongfei Yang
- 1Institute of Sedimentary Geology, Chengdu University of Technology, Chengdu, Sichuan, China
- 2Institute of Exploration and Development, PetroChina Southwest Oil and Gas Field Company, Chengdu, Sichuan, China
- 3PetroChina Southwest Oil and Gas Field Company, Chengdu, Sichuan, China
- 4Research Center of Multiphase Flow in Porous Media, School of Petroleum Engineering, China University of Petroleum (East China), Qingdao, Shandong, China
Instruction: Due to the declining production rate of conventional natural gas reservoir and the rising demand for natural gas resources, conventional natural gas resources cannot satisfy the needs of economic development. Unconventional gas resource is considered to be the most promising energy supplement, therefore it is an inevitable trend to explore and develop unconventional oil and gas resources such as low permeability reservoirs. At present, the carbonate gas reservoirs in the high permeability area of Sichuan Basin have been almost fully developed, while the remaining gas reservoirs in the low permeability area are not well developed. However, the key factors for effectively enhancing gas recovery rate in different types of low permeability reservoirs are not the same. Even gas reservoirs with the same macroscopic geological characteristics will show different development characteristics through the production processes.
Method: In order to analyze the factors affecting the effective production rate of low-permeability gas reservoirs, it is necessary to conduct research from the microscopic perspective, to reveal the effective production conditions of natural gas in low-permeability reservoirs. In this study, low-permeability carbonate samples of Sinian Dengying Formation from Sichuan Basin were taken. Micro-CT scanning technology was used to obtain core images for the carbonate rocks, and the digital carbonate core models at microscopic scale were reconstructed. Based on the reconstructed carbonate digital core models, LBM method was applied to obtain the absolute permeability of the core models.
Results: The results imply that the porosity, pore area fraction, throat area fraction, mean throat length, shape factor, coordination number and tortuosity are the factors affecting the absolute permeability of carbonate rocks.
Discussion: Subsequently, the relationship between different pore structure parameters and absolute permeability was obtained by multi-parameter fitting method, which provided a new research method for directly predicting the absolute permeability of carbonate rocks by using pore structure parameters.
1 Introduction
Natural gas is a viable solution to replace coal as cleaner hydrocarbon resources (Hu et al., 2022), especially under the circumstance that reaching carbon neutrality goals turns out to be significant. However, as with the decrease of conventional natural gas production rate and the increasing demand for natural gas resources, conventional natural gas resources cannot meet the needs of economic development (Zou et al., 2018). Therefore, unconventional natural gas resources are considered as the most promising energy supplement. Among the unconventional natural gas reservoirs, carbonate gas reservoir has huge natural gas reserves and is the main reservoir type to realize increasing natural gas storage and production in the future (Jia et al., 2021; Li, 2022). However, the complex pore structure of carbonate reservoir (Yang et al., 2020), the coupling effect of pore structure on fluid flow in micro-scale length (Al-Khulaifi et al., 2018) and low permeability of pore space have greatly reduced the natural gas production rate. Therefore, it is essential to conduct research from the microscopic pore-throat characteristics and transport mechanism to determine the major pore structure parameters affecting the permeability of carbonate rock, and to provide a theoretical basis for determining the effective production conditions of natural gas in carbonate reservoirs (Zhao et al., 2021).
The complex pore structure of carbonate rocks leads to low permeability of pore space, which has a great influence on natural gas production rate. In recent years, researchers have studied the microscopic pore structure of rocks by using constant rate mercury injection (Pan et al., 2022; Yang et al., 2022), micro-CT scanning (Zhang et al., 2010; Li et al., 2022) and Scanning Electron Microscopy (SEM) (Pan et al., 2022). However, it is necessary to comprehensively consider the influence of fluid flow process in the structural analysis of carbonate rock, and establish fluid flow model in the complex pore structure of carbonate rock, so as to achieve effective prediction of permeability. The digital carbonate rocks constructed by CT scanning technology can provide a simulation model for flow simulation technology (Blunt et al., 2013; Raeini et al., 2014; Zhu et al., 2017). Micro-CT scanning is one of the most accurate methods to build digital rocks (Iglauer et al., 2011; Blunt et al., 2013), by using microscopic imaging equipment to scan core samples with micron- and nano-meter resolutions to build digital rocks directly, which makes digital rock reconstruction convenient (Zhu et al., 2019). Carbonate are complex in its pore structure (Mahesar et al., 2020), and its secondary pores such as fractures and caves are developed. There are even primary pores of micron or even nanometer scale in the carbonate reservoir. Therefore, digital cores are the important basis of pore scale flow simulation (Yang et al., 2021) and an effective experimental tool for characterization of pore structure and study of fluid transport mechanism in carbonate cores.
Based on micro-CT scanning reconstruction of digital rock, pore scale simulation method can be used to accurately simulate fluid flow process in rock samples (Raeini et al., 2014; Yang et al., 2021), so as to obtain accurate permeability. At the pore scale, the methods for simulating fluid flow in porous media mainly include, Pore Network Modelling (PNM) (Fatt, 1956; Valvatne & Blunt, 2004), Lattice Boltzmann Method (LBM) (Shan and Chen, 1993; McClure et al., 2021) and Direct Numerical Simulation (DNS) (Shams et al., 2018; Namaee-Ghasemi et al., 2021). Among them, the LBM has been widely used for fluid flow in porous media. Shan and Chen (Shan and Chen, 1993) first established a Lattice-Boltzmann method that can simulate multi-phase and multi-component flow processes. Pan et al. (2004) used the Lattice-Boltzmann method to simulate the two-phase flow problem at the pore scale. McClure et al. (2021) proposed a Lattice-Boltzmann method for Porous Media (LBPM) combined with Special Core Analysis Laboratory (SCAL). By combining with experimental data, the LBPM method improves the efficiency of transport simulation and the accuracy of prediction of permeability of cores. However, for carbonate cores, it still takes vast of computing resources to carry out pore-scale LBM simulations. The obtained simulation results are often not directly related to the pore structure parameters, so the correlation between pore-structure and permeability cannot be obtained. Therefore, it is necessary to put forward an efficient method to predict the permeability of carbonate cores from the perspective of pore structure parameters and permeability fitting.
In this study, low-permeability carbonate samples from Sichuan Basin were taken. CT scanning technology was used to obtain core images, and the digital carbonate rock containing real pore structure was reconstructed. Based on the reconstructed carbonate digital rock model, an LBM method is used to calculate the absolute permeability of the core model. By means of multi-parameter fitting method, the fitting relation between pore structure parameters and permeability was obtained, and the method of efficiently predicting permeability of carbonate core by using pore structure parameters was realized. This study is helpful to improve the understanding of microscopic seepage characteristics of low permeability carbonate reservoir and is of great significance to the development of low permeability carbonate natural gas reservoir.
2 Samples and methods
2.1 Carbonate samples
The carbonate samples were taken from a low permeability block which is located in Sinian Dengying Formation in Sichuan Basin, China. The reservoir in this block is dominated by pores and fractures are not developed, which is a typical carbonate pore reservoir. Six samples were selected, and their petrophysical parameters are shown in Table 1.
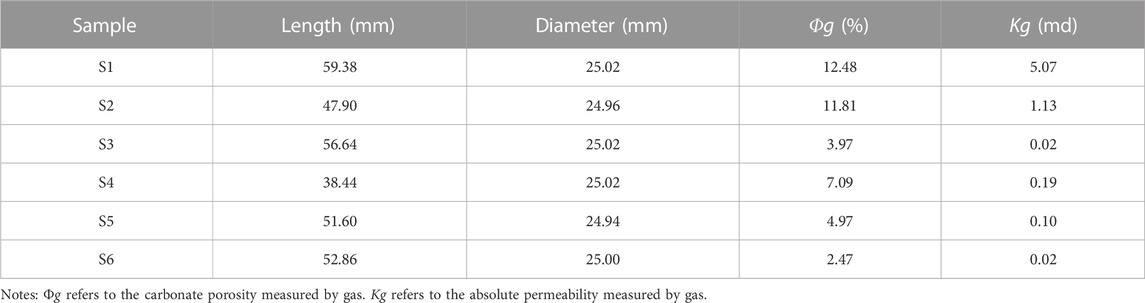
TABLE 1. Petro-physical parameters of carbonate samples tested.
2.2 X-ray computed tomography experiment
Micro-CT scanning is one of the most accurate methods to obtain pore structure characteristics of core by scanning the cross section of core directly using a Micro imaging device at micron resolution. Due to the low permeability and dense pore development of selected core samples, we used a 10x MicoXCT-400 camera lens to obtain accurate images, with a resolution of 1.88 um per scan. Due to the limitations of the instrument’s own power, the core sample could not be penetrated by X-rays at this resolution, so we drilled a miniature cylinder sample from several different carbonate samples, all of which were 9 mm in diameter and 25 mm in length. From the two-dimensional grayscale images of all samples, we select several carbonate samples, all of which are pore carbonate rocks (as are shown in Figure 1).
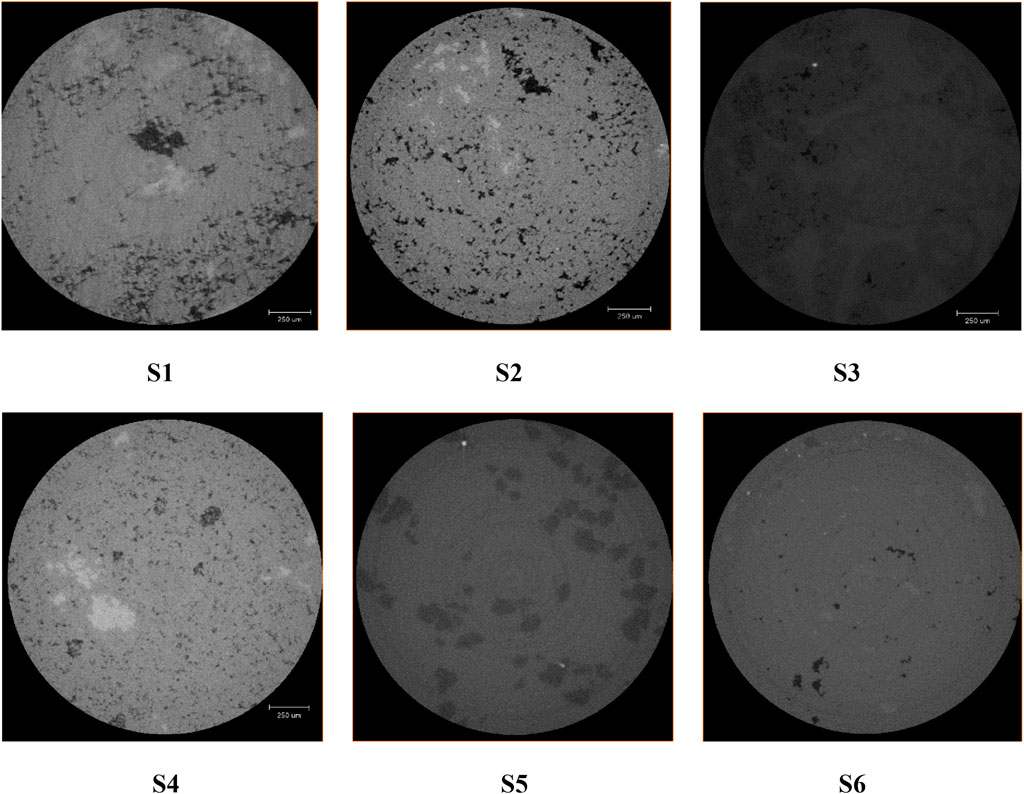
FIGURE 1. 2D slice image of core sample.
In the process of CT image acquisition, due to external interference, the collected image has some shortcomings, such as dark or bright, not obvious contrast, image blur, etc., which will bring large errors to the image analysis. Therefore, it is necessary to preprocess the image to improve its quality without destroying the information contained in the image. The general steps of image processing are shown in Figure 2. In order to improve image processing efficiency, we extracted a sub-volume of image data with voxel size of 600 × 600 × 600 from the middle of the original grayscale digital rock (Figure 2A). Then it is filtered to reduce the noise of the image and improve the clarity of the image (Figure 2B). In the subsequent watershed segmentation, we divided the image into pore and skeleton phases by adjusting the segmentation threshold (Figure 2C). Finally, carbonate digital core is constructed by 3D digital reconstruction (Figure 3).
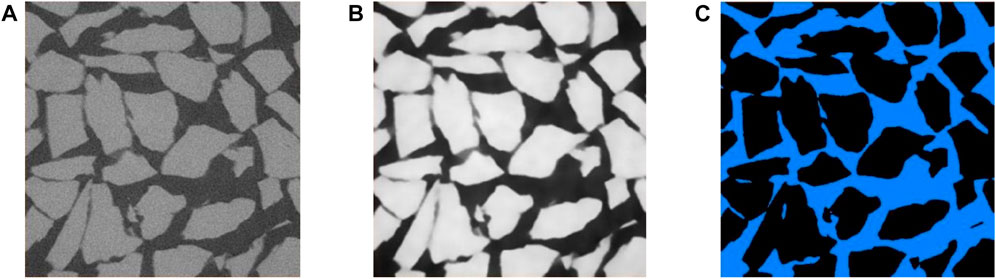
FIGURE 2. Core image processing process. (A) The sub-volume of image data (B) Core image after filtering to reduce noise and improve clarity (C) Core mage of pore phase and skeleton phase after threshold segmentation.
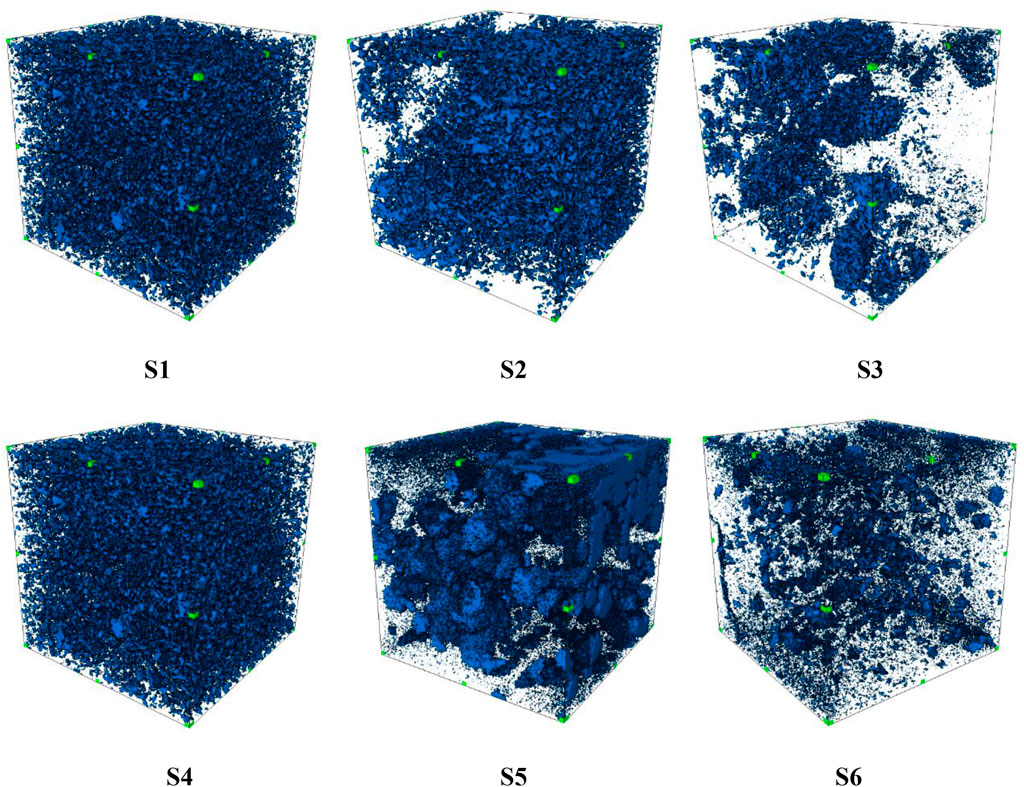
FIGURE 3. Reconstructed 3D digital core.
2.3 Lattice Boltzmann method
In this study, we applied the D3Q19 discrete velocity model (Benzi et al., 1992) to simulate the permeability of 3D digital rock. Lattice Bhatnagar-Gross-Krook (LBGK) collision approximation (Bhatnagar et al., 1954) is most widely used because of its simplicity. The basic evolution equation (Chen et al., 1992; Guo et al., 2000) can be described as:
where fα is the velocity distribution function that discrete directions are α (α = 0,1, 2, …18); r is the spatial position of the node; eα is the vector expression of discrete directions α; δt is the time step; t is the time; τ is the dimensionless relaxation time;
The equilibrium distribution function is the distribution function of fluid particles when the system reaches equilibrium. The equilibrium distribution function (Filippova and Hänel, 1998) of the D3Q19 model is expressed as:
where ρ is the fluid macroscopic density, u is macroscopic velocity, cs=
The macroscopic pressure and velocity of the fluid at each node in the model can be expressed as:
When simulating the inherent permeability of digital rock, the wall is usually treated as a no-slip boundary condition. Bouncing boundary condition is a common format for dealing with no-slip boundary. When the fluid particles reach the solid boundary from the pore space, they will return to the pore space along the original path. Thus, the normal velocity of the fluid on the solid boundary can be 0. The evolution equation after the collision between fluid and solid boundary can be described as:
where
Since the fluid flow is driven by pressure, periodic pressure boundary conditions are set at the left and right boundaries, and set the fixed pressure gradient to 0.0005. It should be noted that all the above variables in this chapter are dimensionless lattice units. In the flow simulation, if the difference of the macroscopic velocity of the fluid is less than 10−6 within two steps, it means that the system has reached the equilibrium state, and the simulation is terminated. At this time, the macro flow can be calculated by the area fraction of the flow rate at each node on the outlet end face:
where U is dimensionless flow at outlet. Finally, the dimensionless permeability of low permeability digital rock can be calculated by Darcy’s Law (Darcy, 1968):
where k′ is dimensionless permeability. The actual permeability of digital rock can be calculated from dimensionless permeability and image resolution:
where k is the permeability of digital rock, μm2; R is the image resolution, μm.
3 Results and discussions
3.1 Pore structure characterization
To characterize the pore structures of the different core samples, the digital rocks were reconstructed based on the associated CT images after a series of image processes, i.e., denoising, binary segmentation, and so on. The pore networks were extracted subsequently for the quantitative characterization of the structure, as shown in Figure 4.
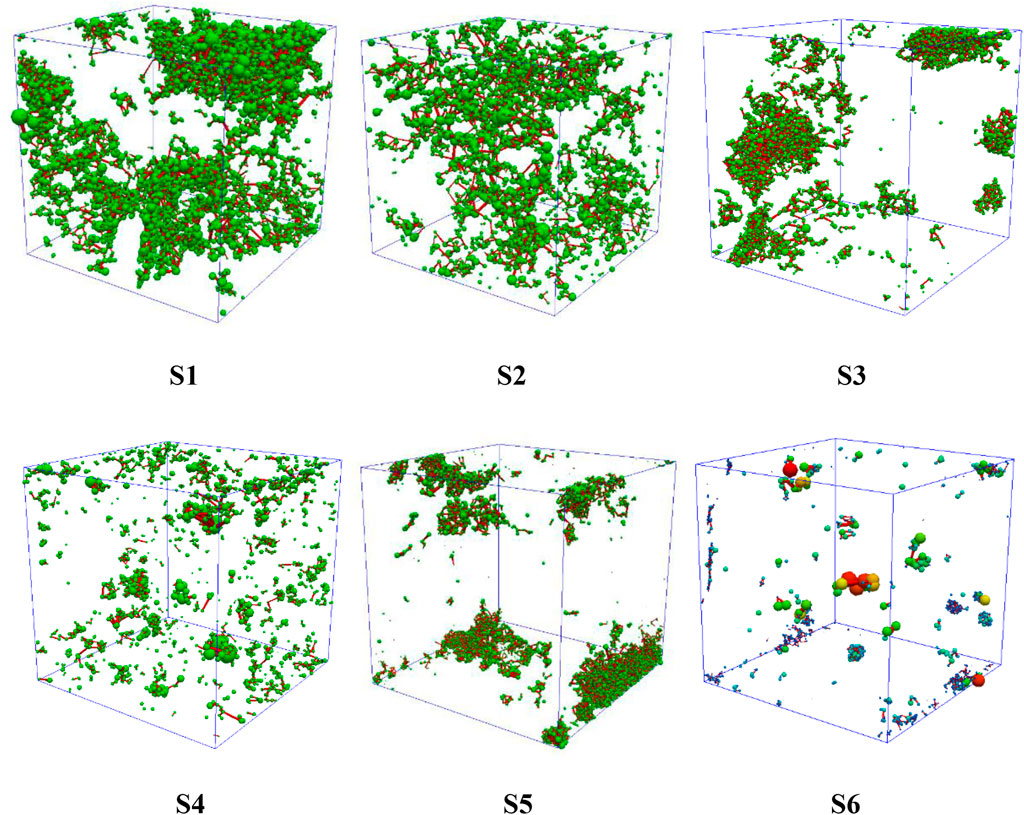
FIGURE 4. Pore networks of different digital rocks.
As shown in Figure 5, the pore radius of sample S1 is larger than most of all samples, with more pores and better connectivity, indicating high porosity and moderate permeability. A peak value of the pore radius distribution occurred at 5.5 μm, accounting for 21.6% of the total pores, while the throats with the radius of 4 μm (peak) accounting for 17.8%. The radius of most pores (86.9%) are less than 10 μm and the average pore radius is 6.5 μm. Moreover, the averages of throat length, shape factor, coordination number, and tortuosity are 15.3 μm, 0.042, 3.42 and 2.48, respectively.
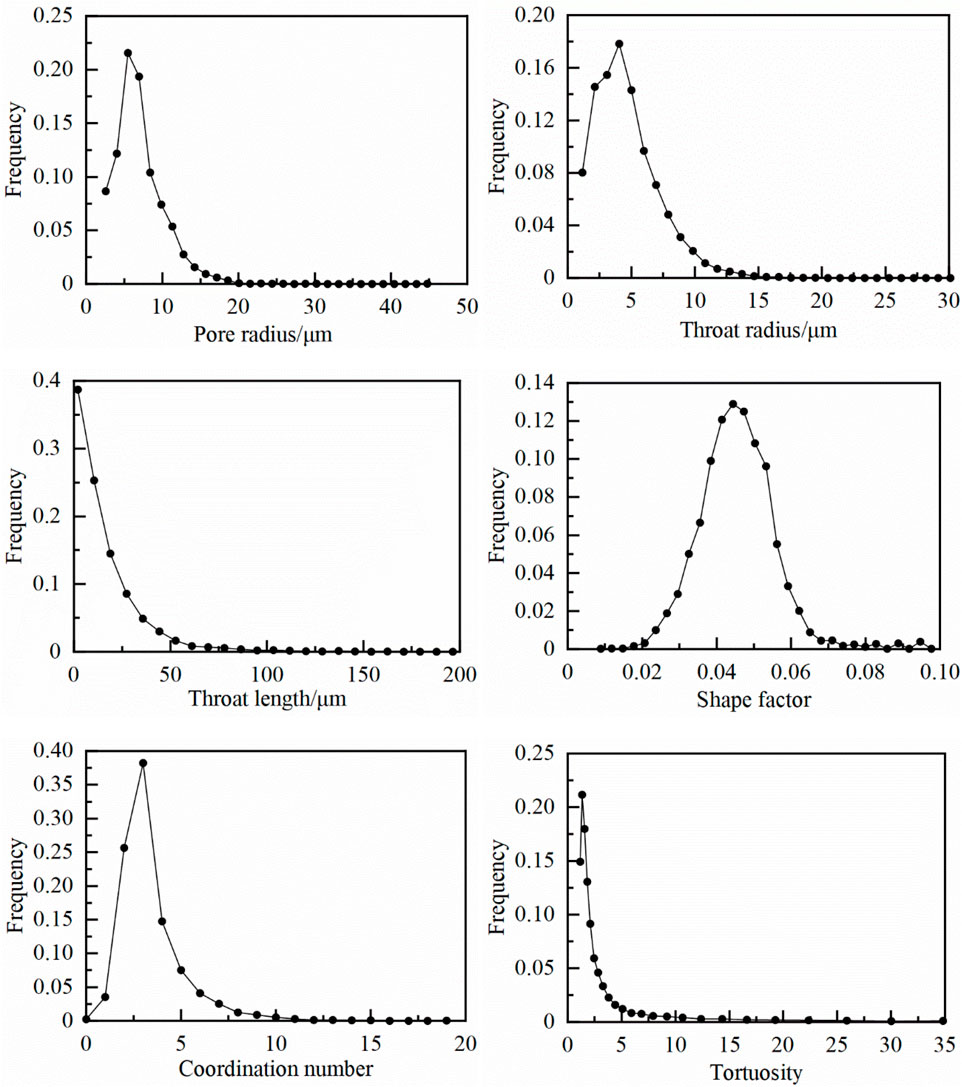
FIGURE 5. The pore structure parameter distribution of sample S1.
As shown in Figure 6, the pore radius of sample S2 is largest, with best connectivity, but the pore number of sample S2 is less than other samples. Therefore, the sample S2 is of high porosity and moderate permeability. A peak value of the pore radius distribution occurred at 5 μm, accounting for 19.5% of the total pores, while the throats with the radius of 3.6 μm (peak) accounting for 17.7%. The radius of most pores (85.2%) are less than 10 μm and the average pore radius is 6.85 μm. Moreover, the averages of throat length, shape factor, coordination number, and tortuosity are 22.3 μm, 0.042, 2.83 and 2.31, respectively.
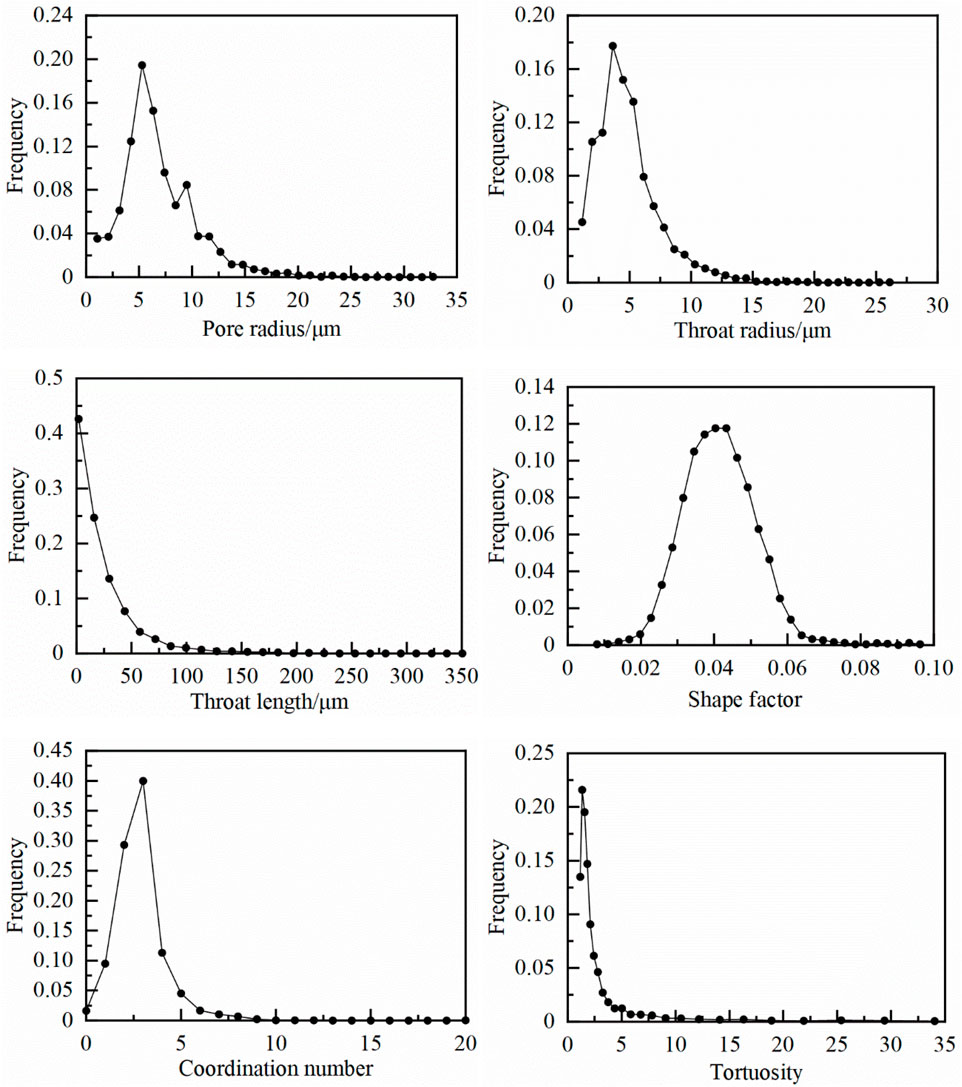
FIGURE 6. The pore structure parameter distribution of sample S2.
As shown in Figure 7, Sample S3 have more pores than others, but its pore radius is relatively small and throat length is short. The orientation of the pore and throat channels is at a large angle to the flow direction. Its tortuosity is larger and reduces its permeability, indicating high porosity and low permeability. A peak value of the pore radius distribution occurred at 3.29 μm, accounting for 28.1% of the total pores, while the throats with the radius of 1 μm (peak) accounting for 29%. The radius of most pores (93.2%) are less than 7 μm and the average pore radius is 3.95 μm. Moreover, the averages of throat length, shape factor, coordination number, and tortuosity are 7.2 μm, 0.046, 4.26 and 3.01, respectively.
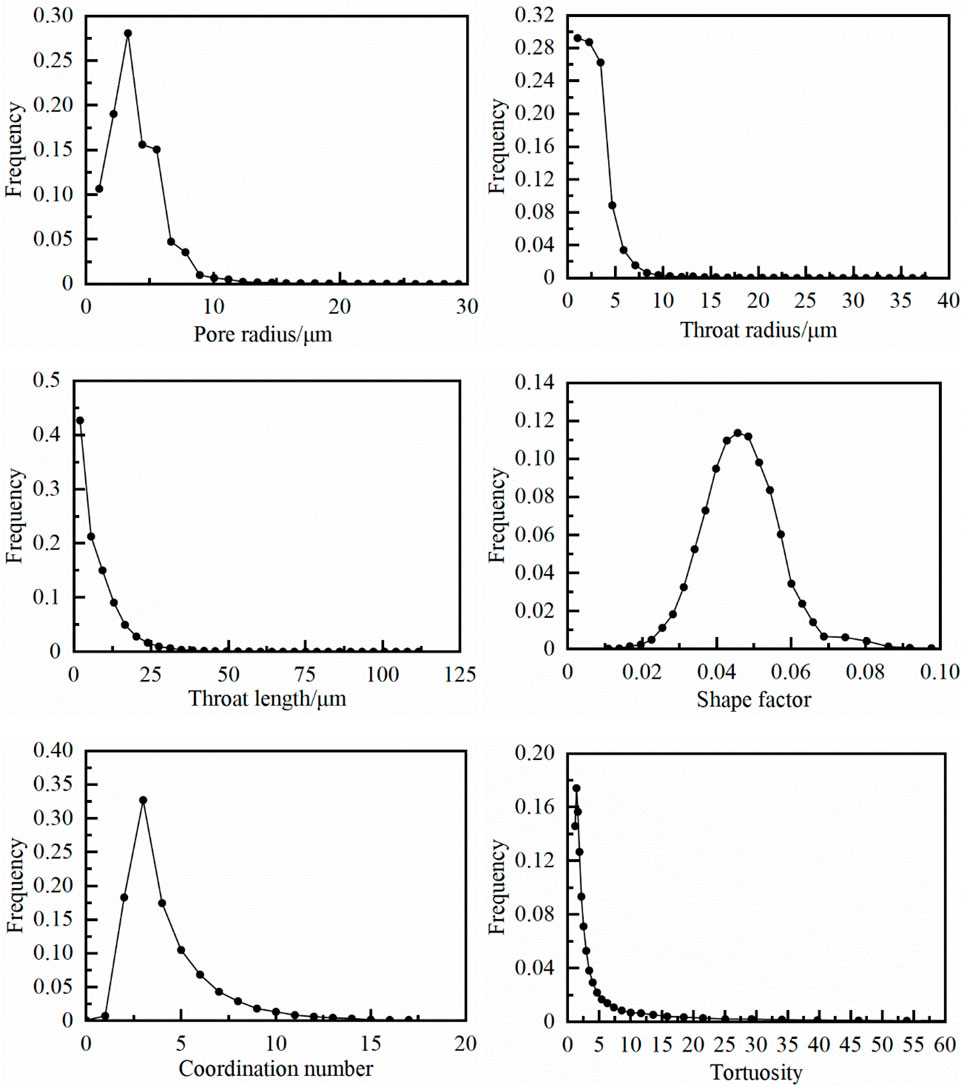
FIGURE 7. The pore structure parameter distribution of sample S3.
As shown in Figure 8, the pore radius of sample S4 is smaller than others, with few pores and poor connectivity, indicating its moderate porosity and low permeability. A peak value of the pore radius distribution occurred at 5.4 μm, accounting for 22.8% of the total pores, while the throats with the radius of 2 μm (peak) accounting for 23.2%. The radius of most pores (95.7%) are less than 10 μm and the average pore radius is 5.21 μm. Moreover, the averages of throat length, shape factor, coordination number, and tortuosity are 13.4 μm, 0.045, 2.64 and 3.03, respectively.
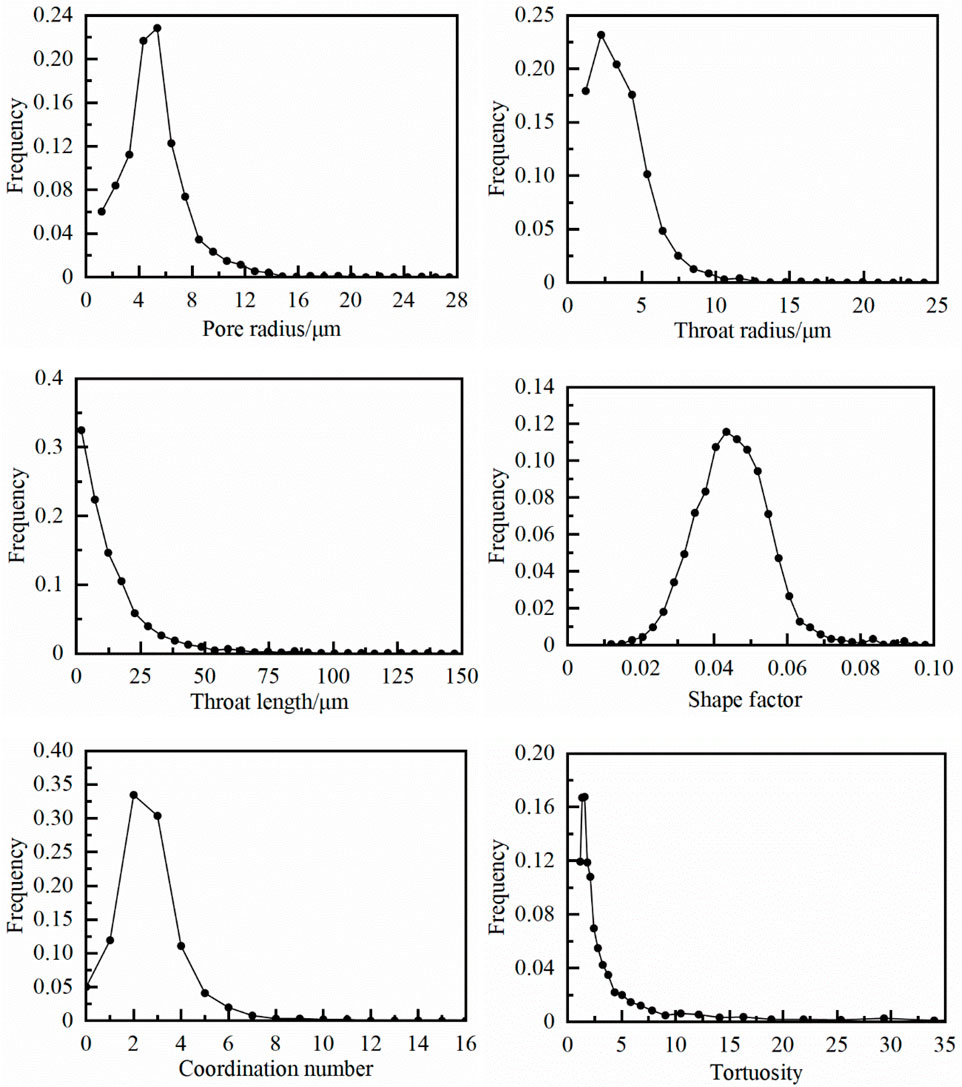
FIGURE 8. The pore structure parameter distribution of sample S4.
As shown in Figure 9, sample S5 has a smallest number pore throat radius, with poor connectivity and great non-homogeneity, indicating low porosity and low permeability. A peak value of the pore radius distribution occurred at 5.8 μm, accounting for 15.8% of the total pores, while the throats with the radius of 4.1 μm (peak) accounting for 11.3%. The radius of most pores (96.6%) are less than 10 μm and the average pore radius is 5.48 μm. Moreover, the averages of throat length, shape factor, coordination number, and tortuosity are 12.5 μm, 0.045, 3.48 and 2.64 respectively.
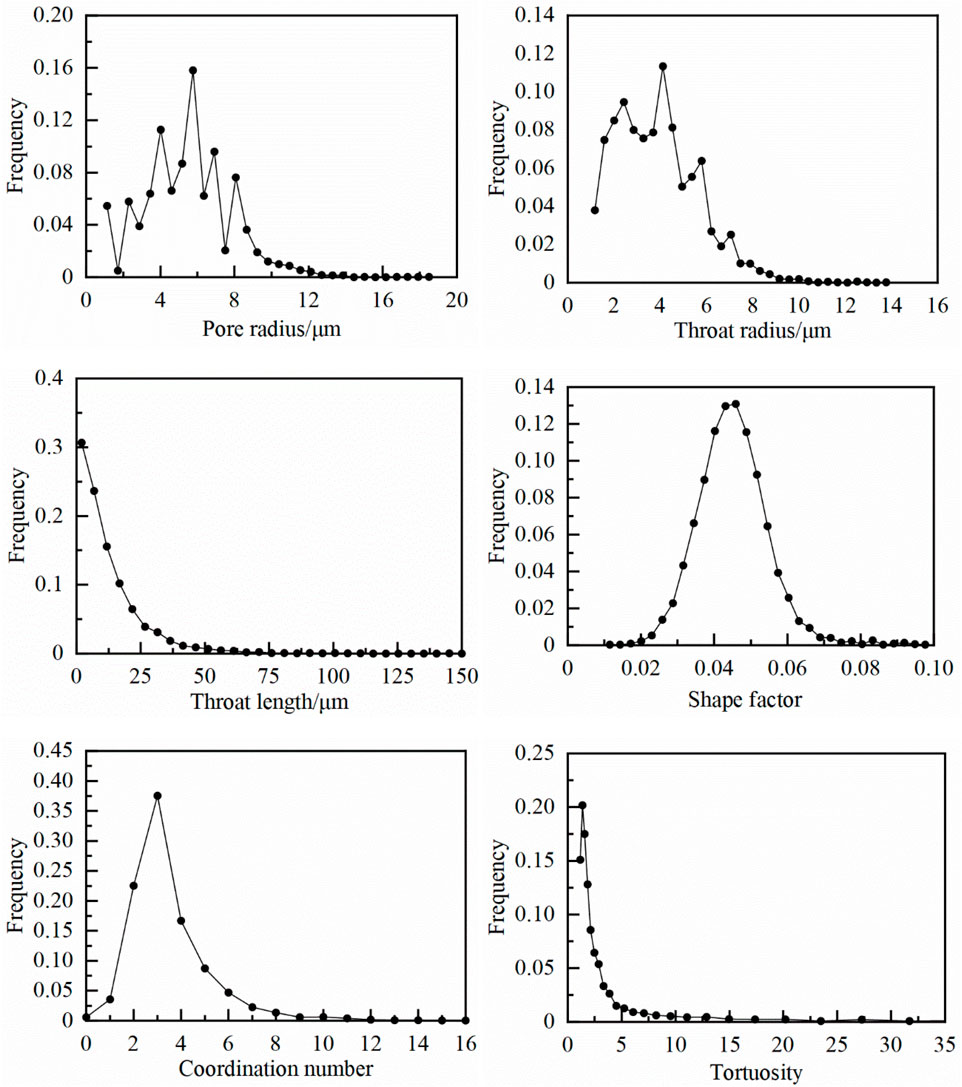
FIGURE 9. The pore structure parameter distribution of sample S5.
As shown in Figure 10, sample S6 has a smaller number of pores and a smaller pore throat radius, with poorest connectivity and greatest non-homogeneity, indicating low porosity and ultra-low permeability. A peak value of the pore radius distribution occurred at 3.5 μm, accounting for 26.9% of the total pores, while the throats with the radius of 1.1 μm (peak) accounting for 23.7%. The radius of most pores (91.4%) are less than 8 μm and the average pore radius is 3.99 μm. Moreover, the averages of throat length, shape factor, coordination number, and tortuosity are 10.5 μm, 0.048, 2.97 and 2.65, respectively.
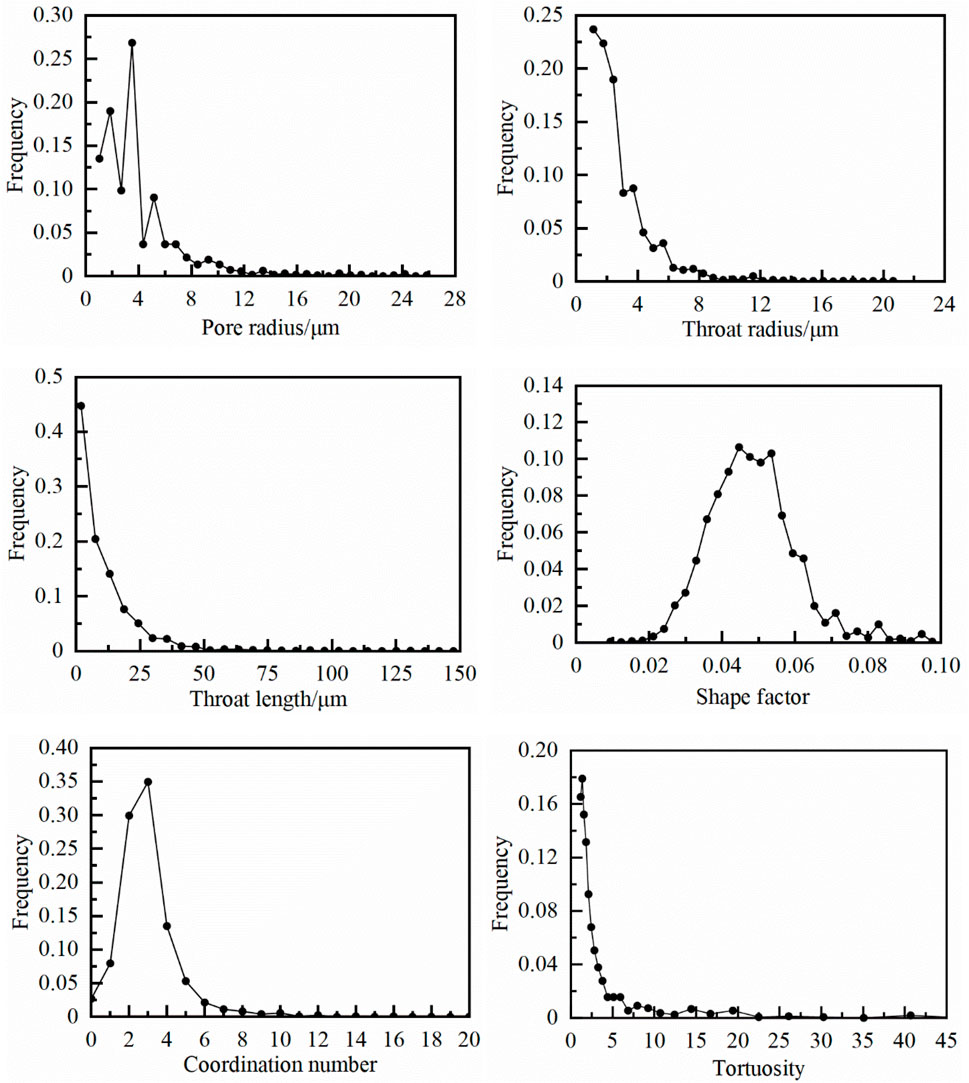
FIGURE 10. The pore structure parameter distribution of sample S6.
3.2 Analysis for influencing factors on permeability
The LBM method was used to simulate the permeability of the digital core of Sinian Dengying Formation, and the pore network model was extracted from the same digital core to obtain the pore structure parameters of this digital core, as shown in Table 2.We also use partial least squares regression (PLS) analysis of the parameters to study the influence factors of each parameter on the permeability of the Sinian Dengying Formation.
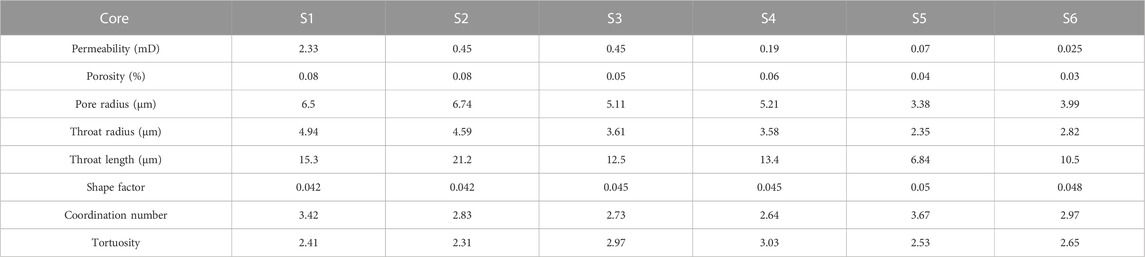
TABLE 2. Permeability and pore structure parameters for digital core simulation.
Since the parameters of pore/throat radius and number have a certain autocorrelation, the product of the two parameters is taken as a parameter to consider their effects on seepage:
where Sp and St represent the area fraction of pores and throat in a single cross section respectively; A represents the area of the cross section.
Seven parameters, including porosity, pore area fraction, throat area fraction, average throat length, shape factor, coordination number and tortuosity, were taken as independent variables, and simulated permeability was taken as dependent variables and transformed into a matrix for multi-parameter linear fitting, and the fitting equation was given as:
The fitting diagram and the degree of influence of parameters is shown in Figure 3 and Figure 4. It can be seen that the data points are distributed on both sides of the line y = x, and the correlation coefficient reaches 0.786 (as given in Figure 11). According to the influence degree of seven parameters on permeability (as are shown in Figure 12), the permeability of the Sinian Dengying Formation is mainly affected by the size and quantity of pore and throat developed, porosity and tortuosity of the core also have an impact on permeability, but relatively small, while the influence of other parameters on permeability can be ignored. This is due to the fact that the Sinian Dengying Formation reservoir has well developed pores and relatively good connectivity, so the influence of pore radius and connectivity on permeability will increase and the influence of porosity will be weakened.
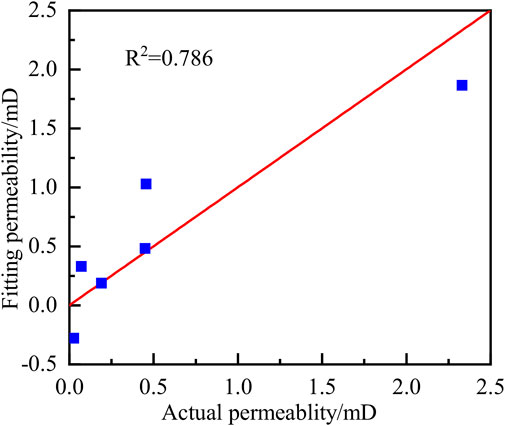
FIGURE 11. Relationship between fitting value and simulation value.
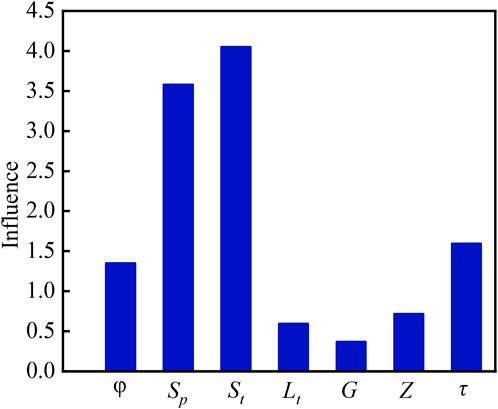
FIGURE 12. Degrees of influence of parameters.
After removing several parameters that have a low weight on the influence of permeability, the parameters of permeability and porosity, pore/throat radius, number of pore/throat and tortuosity are fitted linearly again. The fitting equation and diagram are as follows.
From the fitting diagram (as given in Figure 13), the correlation coefficient is 0.8, and the fitting is better than the previous fitting equation, so this equation can be used to characterize the relationship between the permeability of the core of the Sinian Dengying Formation and its pore structure parameters.
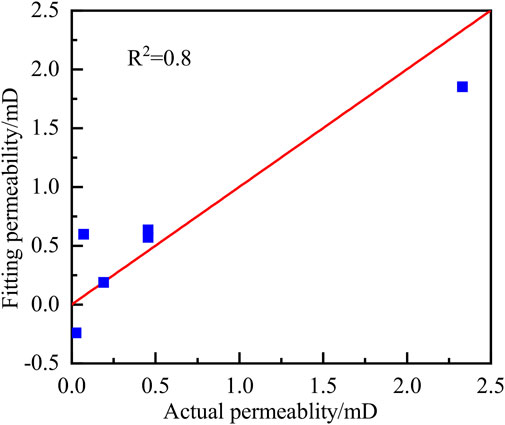
FIGURE 13. Relationship between fitting value and simulation value.
4 Conclusion
This study investigates the impact of various pore structure parameters on core permeability. To that end, we performed micro-CT imaging for different carbonate rocks and obtained pore structure parameters based on pore network modelling. Then we carried simulations using the lattice Boltzmann method and a quantitative evaluation method was used to quantitate the influence of different pore structure parameters on rock permeability. The results imply that the porosity, pore area fraction, throat area fraction, mean throat length, shape factor, coordination number and tortuosity are the factors affecting the absolute permeability of carbonate rocks. Subsequently, the relationship between different pore structure parameters and absolute permeability was obtained by multi-parameter fitting method, which provided a new research method for directly predicting the absolute permeability of carbonate rocks by using pore structure parameters.
Data availability statement
The original contributions presented in the study are included in the article/Supplementary Material, further inquiries can be directed to the corresponding author.
Author contributions
SY: investigation, writing–original draft, and writing–review and editing. HY: investigation and supervision. XP: investigation and supervision. XL: writing–review and editing. YY: methodology, investigation, and writing–review and editing. YZ: writing. KZ: editing. HC: investigation, conceptualization, and supervision.
Conflict of interest
Authors SY, HY, XP, XL, YZ, and KZ were employed by PetroChina Southwest Oil and Gas Field Company.
The remaining authors declare that the research was conducted in the absence of any commercial or financial relationships that could be construed as a potential conflict of interest.
Publisher’s note
All claims expressed in this article are solely those of the authors and do not necessarily represent those of their affiliated organizations, or those of the publisher, the editors and the reviewers. Any product that may be evaluated in this article, or claim that may be made by its manufacturer, is not guaranteed or endorsed by the publisher.
References
Al-Khulaifi, Y., Lin, Q., Blunt, M. J., and Bijeljic, B. (2018). Reservoir-condition pore-scale imaging of dolomite reaction with supercritical CO2 acidified brine: Effect of pore-structure on reaction rate using velocity distribution analysis. Int. J. Greenh. Gas Control 68, 99–111. doi:10.1016/j.ijggc.2017.11.011
Benzi, R., Succi, S., and Vergassola, M. (1992). The lattice Boltzmann equation: Theory and applications. Phys. Rep. 222 (3), 145–197. doi:10.1016/0370-1573(92)90090-M
Bhatnagar, P. L., Gross, E. P., and Krook, M. (1954). A model for collision processes in gases. I. Small amplitude processes in charged and neutral one-component systems. Phys. Rev. 94 (3), 511–525. doi:10.1103/PhysRev.94.511
Blunt, M. J., Bijeljic, B., Dong, H., Gharbi, O., Iglauer, S., Mostaghimi, P., et al. (2013). Pore-scale imaging and modelling. Adv. Water Resour. 51, 197–216. doi:10.1016/j.advwatres.2012.03.003
Chen, H., Chen, S., and Matthaeus, W. H. (1992). Recovery of the Navier-Stokes equations using a lattice-gas Boltzmann method. Phys. Rev. A 45 (8), R5339–R5342. doi:10.1103/PhysRevA.45.R5339
Filippova, O., and Hänel, D. (1998). Grid refinement for lattice-BGK models. J. Comput. Phys. 147 (1), 219–228. doi:10.1006/jcph.1998.6089
Guo, Z., Shi, B., and Wang, N. (2000). Lattice BGK model for incompressible Navier–Stokes equation. J. Comput. Phys. 165 (1), 288–306. doi:10.1006/jcph.2000.6616
Hu, T., Pang, X., Jiang, F., Zhang, C., Wu, G., Hu, M., et al. (2022). Dynamic continuous hydrocarbon accumulation (DCHA): Existing theories and a new unified accumulation model. Earth-Science Rev. 232, 104109. doi:10.1016/j.earscirev.2022.104109
Iglauer, S., Paluszny, A., Pentland, C. H., and Blunt, M. J. (2011). Residual CO2 imaged with X-ray micro-tomography. Geophys. Res. Lett. 38 (21). doi:10.1029/2011GL049680
Jia, A., He, D., Wei, Y., and Li, Y. (2021). Predictions on natural gas development trend in China for the next fifteen years. J. Nat. Gas Geoscience 6 (2), 67–78. doi:10.1016/j.jnggs.2021.04.005
Kiani, S., Jafari, S., Apourvari, S. N., and Mehrjoo, H. (2021). Simulation study of wormhole formation and propagation during matrix acidizing of carbonate reservoirs using a novel in-situ generated hydrochloric acid. Adv. Geo-Energy Res. 5 (1), 64–74. doi:10.46690/ager.2021.01.07
Li, L. (2022). Development of natural gas industry in China: Review and prospect. Nat. Gas. Ind. B 9 (2), 187–196. doi:10.1016/j.ngib.2022.03.001
Li, Y., Yang, Y., Dong, M., Liu, C., Iglauer, S., Kang, L., et al. (2022). Effect of pore structure and capillary number on gas-water flow patterns in carbonate rocks. SPE J. 27, 1895–1904. doi:10.2118/209615-pa
Liu, C., Zhang, L., Li, Y., Liu, F., Martyushev, D. A., and Yang, Y. (2022). Effects of microfractures on permeability in carbonate rocks based on digital core technology. Adv. Geo-Energy Res. 6 (1), 86–90. doi:10.46690/ager.2022.01.07
Mahesar, A. A., Shar, A. M., Ali, M., Tunio, A. H., Uqailli, M. A., Mohanty, U. S., et al. (2020). Morphological and petro physical estimation of Eocene tight carbonate formation cracking by cryogenic liquid nitrogen; a case study of Lower Indus basin, Pakistan. J. Petroleum Sci. Eng. 192, 107318. doi:10.1016/j.petrol.2020.107318
McClure, J. E., Li, Z., Berrill, M., and Ramstad, T. (2021). The LBPM software package for simulating multiphase flow on digital images of porous rocks. Comput. Geosci. 25, 871–895. doi:10.1007/S10596-020-10028-9
Namaee-Ghasemi, A., Ayatollahi, S., and Mahani, H. (2021). Pore-scale simulation of the interplay between wettability, capillary number, and salt dispersion on the efficiency of oil mobilization by low-salinity waterflooding. SPE J. 26 (6), 4000–4021. doi:10.2118/206728-pa
Pan, C., Hilpert, M., and Miller, C. T. (2004). Lattice-Boltzmann simulation of two-phase flow in porous media. Water Resour. Res. 40 (1), W01501. doi:10.1029/2003wr002120
Pan, Y., Huang, Z., Guo, X., Liu, B., Wang, G., and Xu, X. (2022). Study on the pore structure, fluid mobility, and oiliness of the lacustrine organic-rich shale affected by volcanic ash from the Permian Lucaogou Formation in the Santanghu Basin, Northwest China. J. Petroleum Sci. Eng. 208, 109351. doi:10.1016/j.petrol.2021.109351
Premnath, K. N., and Abraham, J. (2007). Three-dimensional multi-relaxation time (MRT) lattice-Boltzmann models for multiphase flow. J. Comput. Phys. 224 (2), 539–559. doi:10.1016/j.jcp.2006.10.023
Raeini, A. Q., Blunt, M. J., and Bijeljic, B. (2014). Direct simulations of two-phase flow on micro-CT images of porous media and upscaling of pore-scale forces. Adv. Water Resour. 74, 116–126. doi:10.1016/j.advwatres.2014.08.012
Shams, M., Raeini, A. Q., Blunt, M. J., and Bijeljic, B. (2018). A numerical model of two-phase flow at the micro-scale using the volume-of-fluid method. J. Comput. Phys. 357, 159–182. doi:10.1016/j.jcp.2017.12.027
Shan, X., and Chen, H. (1993). Lattice Boltzmann model for simulating flows with multiple phases and components. Phys. Rev. E 47 (3), 1815–1819. doi:10.1103/PhysRevE.47.1815
Valvatne, P. H., and Blunt, M. J. (2004). Predictive pore-scale modeling of two-phase flow in mixed wet media. Water Resour. Res. 40 (7), W07406. doi:10.1029/2003wr002627
Wang, H., Yuan, X., Liang, H., Chai, Z., and Shi, B. (2019). A brief review of the phase-field-based lattice Boltzmann method for multiphase flows. Capillarity 2 (3), 33–52. doi:10.26804/capi.2019.03.01
Yang, J., Zhang, J., Ji, Y., Lv, W., Wu, H., He, Z., et al. (2022). Pore structure characteristics and controlling factors of a tight sandstone reservoir in the paleogene shahejie formation, nanpu sag, bohai bay basin, China. ACS Omega 7 (2), 1740–1756. doi:10.1021/acsomega.1c04573
Yang, Y., Cai, S., Yao, J., Zhong, J., Zhang, K., Song, W., et al. (2021). Pore-scale simulation of remaining oil distribution in 3D porous media affected by wettability and capillarity based on volume of fluid method. Int. J. Multiph. Flow 143, 103746. doi:10.1016/j.ijmultiphaseflow.2021.103746
Yang, Y., Li, Y., Yao, J., Iglauer, S., Luquot, L., Zhang, K., et al. (2020). Dynamic pore-scale dissolution by CO2-saturated brine in carbonates: Impact of homogeneous versus fractured versus vuggy pore structure. Water Resour. Res. 56 (4), e2019WR026112. doi:10.1029/2019wr026112
Zhang, J., Sun, Z., Zhang, Y., Sun, Y., and Nafi, T. (2010). Risk-opportunity analyses and production peak forecasting on world conventional oil and gas perspectives. Petroleum Sci. 7 (1), 136–146. doi:10.1007/S12182-010-0018-8
Zhao, J., Dong, X., Zhang, J., Chen, H., and Zhang, W. (2021). A 3D FIB-SEM technique for quantitative characterization of oil shale's microstructure: A case study from the shahejie Formation in dongying depression, China. Energy Sci. Eng. 9 (1), 116–128. doi:10.1002/ese3.819
Zhu, G., Yao, J., Li, A., Sun, H., and Zhang, L. (2017). Pore-scale investigation of carbon dioxide-enhanced oil recovery. Energy & Fuels 31 (5), 5324–5332. doi:10.1021/acs.energyfuels.7b00058
Zhu, L., Zhang, C., Zhang, C., Zhou, X., Zhang, Z., Nie, X., et al. (2019). Challenges and prospects of digital core-reconstruction research, 2019, 29. doi:10.1155/2019/7814180Geofluids
Keywords: low-permeability, pore-throat characteristic in pore-scale, fluid transport in porous media, Sichuan Basin, digital rock
Citation: Yang S, Yang H, Peng X, Lan X, Yang Y, Zhao Y, Zhang K and Chen H (2023) Research of influencing factors on permeability for carbonate rocks based on LBM simulation: A case study of low-permeability gas reservoir of Sinian Dengying Formation in Sichuan Basin. Front. Earth Sci. 11:1091431. doi: 10.3389/feart.2023.1091431
Received: 07 November 2022; Accepted: 07 April 2023;
Published: 21 April 2023.
Edited by:
Chen Zhang, Chengdu University of Technology, ChinaReviewed by:
Jianchao Cai, China University of Petroleum, Beijing, ChinaWenhui Song, China University of Petroleum, Huadong, China
Xin Wang, China University of Petroleum, Beijing, China
Copyright © 2023 Yang, Yang, Peng, Lan, Yang, Zhao, Zhang and Chen. This is an open-access article distributed under the terms of the Creative Commons Attribution License (CC BY). The use, distribution or reproduction in other forums is permitted, provided the original author(s) and the copyright owner(s) are credited and that the original publication in this journal is cited, in accordance with accepted academic practice. No use, distribution or reproduction is permitted which does not comply with these terms.
*Correspondence: Shan Yang, eWFuZ3NoYW4wMUBwZXRyb2NoaW5hLmNvbS5jbg==