 Zhengjun Yu1
 Youzhuang Sun
- 1Shengli Oil Field, Geophysical Institute, Dongying, Shandong, China
- 2China University of Petroleum (East China), College of Earth Sciences and Technology, Qingdao, Shandong, China
- 3China University of Petroleum (East China), College of Computer Science, Qingdao, Shandong, China
The prediction of reservoir parameters is the most important part of reservoir evaluation, and porosity is very important among many reservoir parameters. In order to accurately measure the porosity of the core, it is necessary to take cores for indoor experiments, which is tedious and difficult. To solve this problem, this paper introduces machine learning models to estimate porosity through logging parameters. In this paper, gated recurrent unit neural network based on quantile regression method is introduced to predict porosity. Porosity measurement is implemented by taking cores for indoor experiments. The data is divided into training set and test set. The logging parameters are used as the input parameters of the prediction model, and the porosity parameters measured in the laboratory are used as the output parameters. Experimental results show that the quantile regression method improves the accuracy of the gated recurrent unit neural network, and the RMSE (Root Mean Square Error) of the unoptimized GRU neural network is 0.1774, after optimization, the RMSE is 0.1061. By comparing with the most widely used BP neural network, the accuracy of the method proposed in this paper is much higher than that of BP neural network. This shows that the gated recurrent neural network method based on quantile regression is excellent in predicting reservoir parameters.
1 Introduction
Nowadays, with the development of oil and gas exploration to deep layers, oil and gas exploration is becoming more and more complex (Tao et al., 2010). Using new technologies to study reservoir identification and prediction has become more and more important (Sun et al., 2011). As an important reservoir parameter, porosity (Sun, 1995) is the basis and key to interpret the reservoir. Therefore, it is very important to accurately predict porosity. The determination of porosity can be divided into direct determination methods [core analysis (Yakimchuk et al., 2019) and cuttings analysis (Siddiqui et al., 2005)] and indirect interpretation methods [seismic data (Angeleri and Carpi, 1982), logging data (Zhang et al., 2019)]. Among them, logging data is the geological data with the highest resolution (Serra and Serra, 2004). Under the circumstances of less coring and the resolution of seismic data cannot meet the requirements, it is very necessary and important to use logging data to predict reservoir parameters such as porosity, permeability and saturation, which has always been an important topic for researchers (Serra and Abbott, 1982).
In terms of porosity prediction using logging data, conventional methods mainly include inversion method (Leite and Vidal, 2011), empirical formula method (Li et al., 2004), multiple regression (Adegbite et al., 2021) and other linear methods. Although these methods are simple in principle and easy to operate, interpretation results are poor. Machine learning methods such as artificial neural networks (Gamal and Elkatatny, 2021), support vector machines (Varol et al., 2008), decision trees (Erofeev et al., 2019) and so on cannot only solve complex non-linear problems, but also have stronger learning ability, adaptive ability and information processing ability than conventional methods, and the accuracy of interpretation results is higher, so they are widely used in prediction.
Fuzzy logic and neural network technology were used to determine reservoir physical properties from logging data (Lim and Kim, 2004; El-Shahat et al., 2010). Porosity and permeability predication could be carried out by feedforward back propagation artificial neural network optimized by imperialist competition algorithm (ICA). The results showed that this model was superior to the traditional neural network in accuracy and efficiency (Jamshidian et al., 2015). Singh et al. (2016) used back propagation artificial neural network (BP-ANN) to predict porosity, setting acoustic, density and resistivity logging data as input and porosity as output. The results showed that there was a good correlation between the calculation results of empirical formula and predication results of neural network.
In this paper, GRU network is used for porosity prediction, GRU as a powerful tool for time series forecasting, and the logging curve of the formation has relatively good time series characteristics, which has strong advantages in predicting porosity. This network has a relatively good improvement in prediction accuracy.
2 Methodology
2.1 GRU
GRU (Gated Recursive Unit) network (Fu et al., 2016) is a special kind of recurrent neural network, which solves the problem of gradient explosion and gradient vanishing in the training process of traditional recurrent neural network with unique threshold strategy and state memory, and has excellent generalization performance when analyzing and processing time series data. Compared with the long short-term memory network structure, GRU combines the cell state and gate structure to realize data transmission and state memory. The internal structure of the GRU is shown in Figure 1.
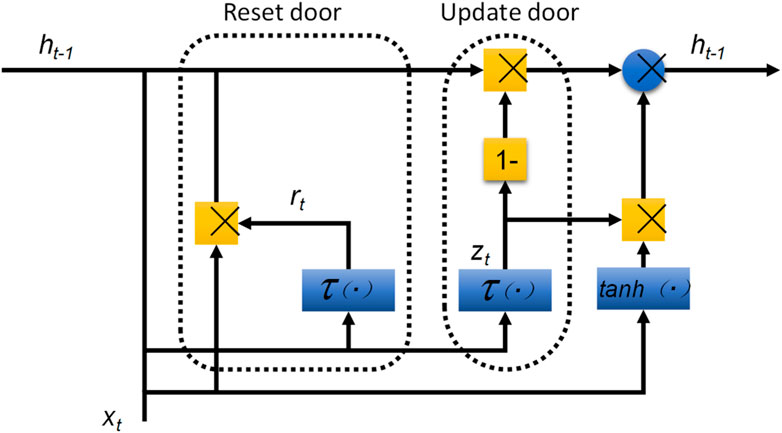
FIGURE 1. Internal structure of GRU.
Figure 1 shows two important gate structures, namely the update gate and the reset gate. GRU forward transmission is:
where:
2.2 QRGRU
QRGRU (Quantile Regression Gated Recursive Unit) retains the original network structure and function of GRU, aiming to achieve non-linear quantile regression by optimizing the objective function.
The objective function is:
where:
Indicator function
where:
QRGRU combines the advantages of neural network and quantile regression, and gives conditional quantiles of corresponding variables at different quantiles by adjusting the value of
2.3 Improved QRGRU principle
The GRU network structure has the function of state memory of data flowing to itself, which is more sensitive to the information feedback of historical moments. Compared with traditional machine learning, GRU strengthens the feedback adjustment ability of the intrinsic features of the data, but due to its own sensitivity, it will inevitably be affected by noise during the training process, reducing the generalization of the model. In order to overcome the above problems, the network structure constraint is used as the penalty term of the objective function, and the deviation degree of network weights in the iterative correction process is smoothed according to the correlation between variables, so as to improve the robustness of prediction. The network structure constraint is a non-negative quadratic form based on graph theory of the Laplace matrix L, as shown in Eq. 7.
where:
Adding this penalty to the objective function to construct an improved QRGRU network with network structure constraints, then Eq. 5 is rewritten as:
2.4 Non-parametric kernel density estimation
Non-parametric kernel density estimation estimates probability density distributions from observations of a set of random variables without any prior assumptions. If the QRGRU output is improved, the conditional quantile estimate is
where:
where:
3 Data interpretation and analysis
The logging data comes from oilfield in western China, the cores are taken from the data of three wells, the cores are subjected to indoor porosity experiments, and the accurate porosity values are obtained, and then it is related to the logging parameters (acoustic AC, gamma GR, resistivity RD, resistivity RS, resistivity RL, resistivity RN, spontaneous potential SP, neutron CNL, resistivity RT, resistivity RXO). The number of sample points for porosity experiments in this paper is 315 (Due to the porosity chamber experiment consuming a lot of manpower and material resources, only these samples were used in the sample points used in this paper). Of these, 200 sample points were used to train machine learning models and 115 sample points were used to test machine learning models. The data of the three wells are all in the same formation, the lithology of the formation is mainly mudstone, some of the rock is mixed with sandstone, the color of the formation in this section is mainly gray and gray-purple, and the sandstone development of this section of the formation is general. The thickness of the single layer is up to 8.00 m, the sedimentary environment is a weak oxidation environment, and combined with the results of regional sedimentary facies division, it is believed that the stratigraphic sedimentary facies in this section belong to the coastal shallow Lagophase sedimentation. Figure 2 shows the QRGRU optimization flow chart. Figure 3 shows a photo of the cores from the three wells, which are those used for porosity experiments. Figure 4 shows a picture taken by a scanning electron microscope of the core, and it can be observed that the main type of porosity in the core is intergranular pores. Figure 5 shows the graph of logging parameters and porosity values. In order to further explore whether the output parameters are sensitive to the input parameters, the Pearson (Benesty et al., 2009) and Spearman (Myers and Sirois, 2004) correlation coefficients are selected in this paper. Figure 6 is a heat map of the correlation, and it can be seen from the figure that the correlation between porosity and AC is the best and the correlation with CNL is the worst. Table 1 shows the statistics of logging data.
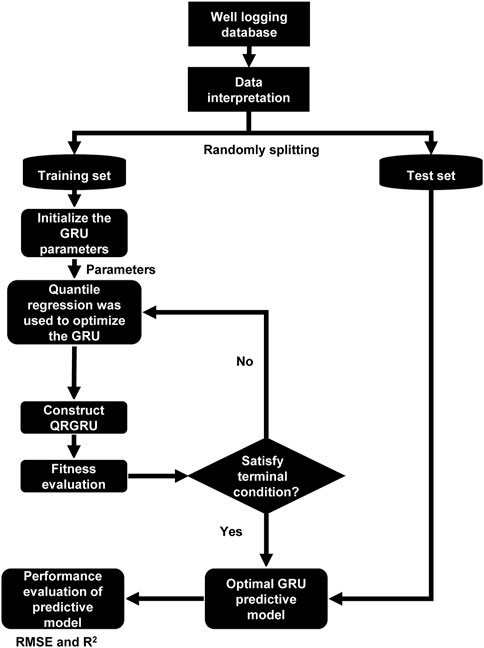
FIGURE 2. Flow of gated recurrent unit neural network based on quantile regression.
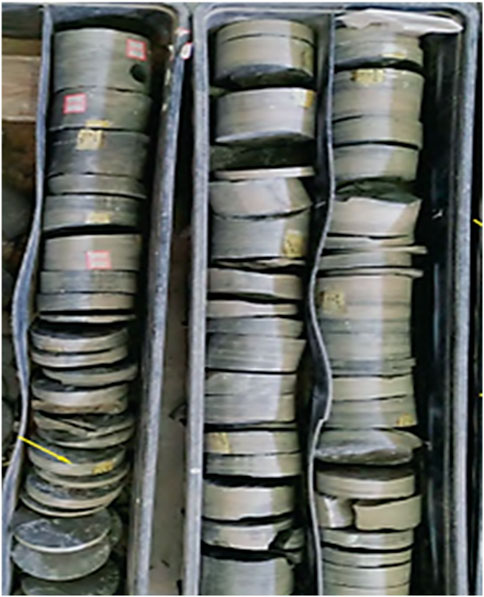
FIGURE 3. Partial photos of the cores.

FIGURE 4. Pictures of cores scanning electron microscope.
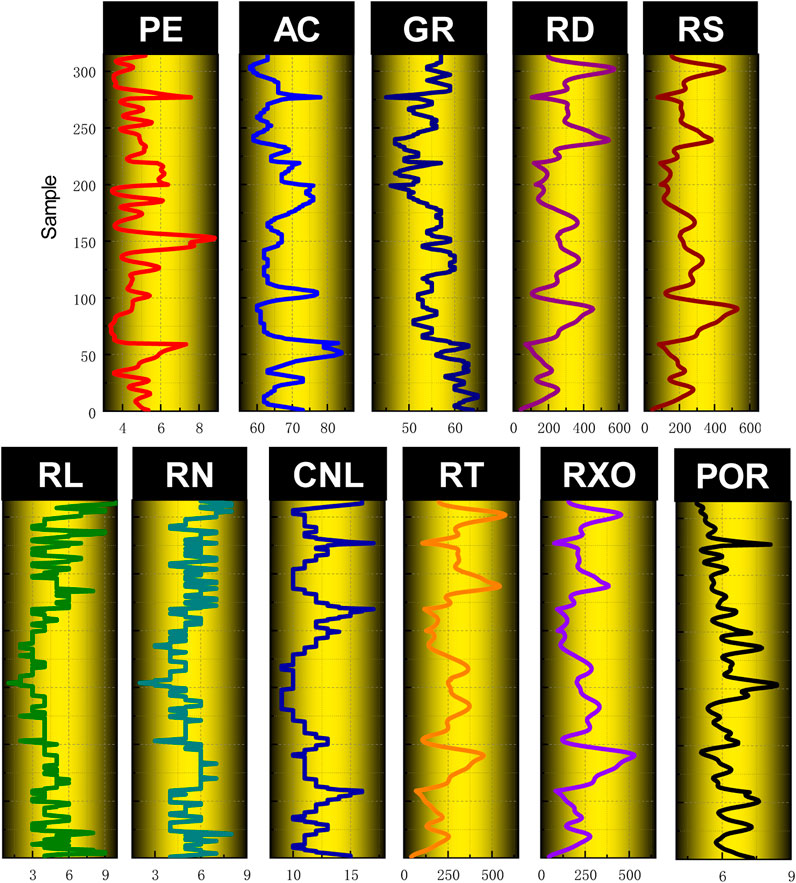
FIGURE 5. Logging parameters and porosity logging curve.
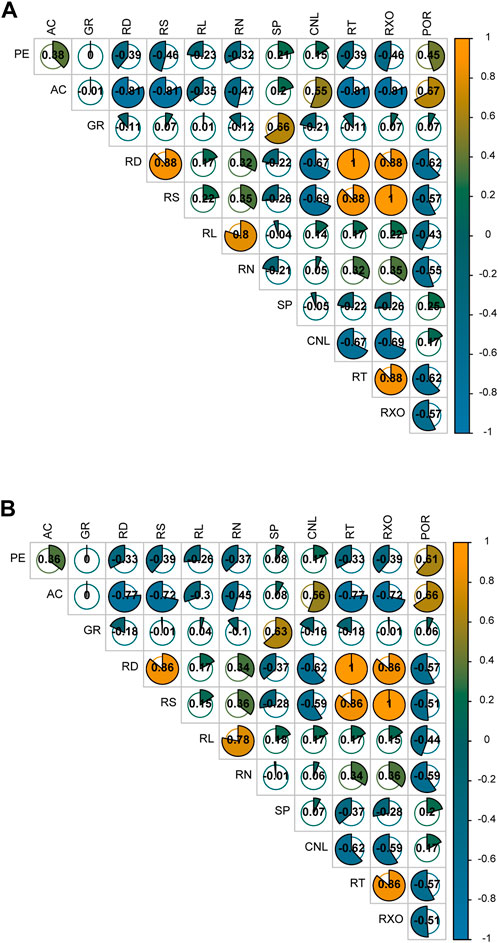
FIGURE 6. (A) is algorithm correlation heat map based on Pearson between the various parameters (B) is algorithm correlation heat map based on Spearman between the various parameters.
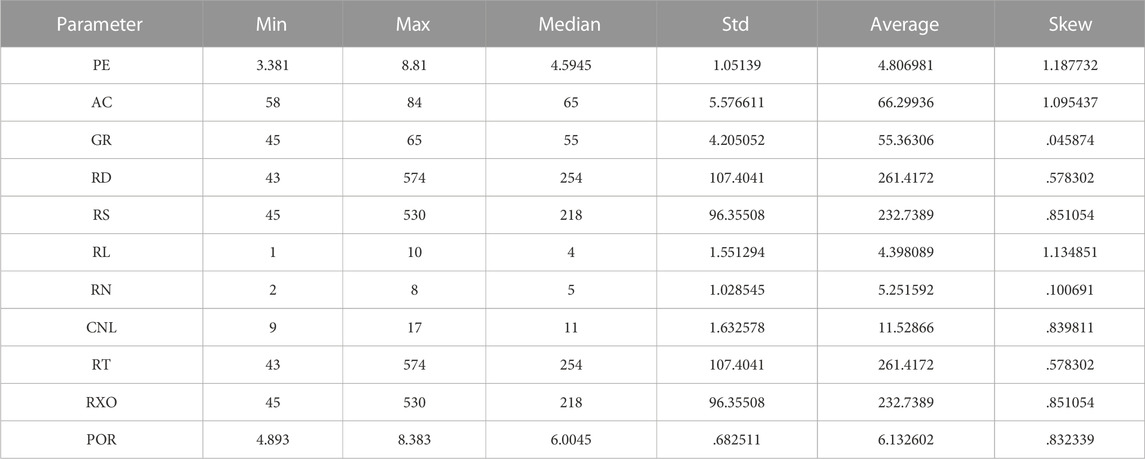
TABLE 1. Statistical values of various logging parameters.
4 Result analysis
First, initialize the parameters of the QRGRU, GRU and BP neural networks, and set the values as shown in Table 2. After the model parameter setting is completed, the model is tested, and the sample is divided into the training set and the test set, and the experimental results are shown in Figure 7.
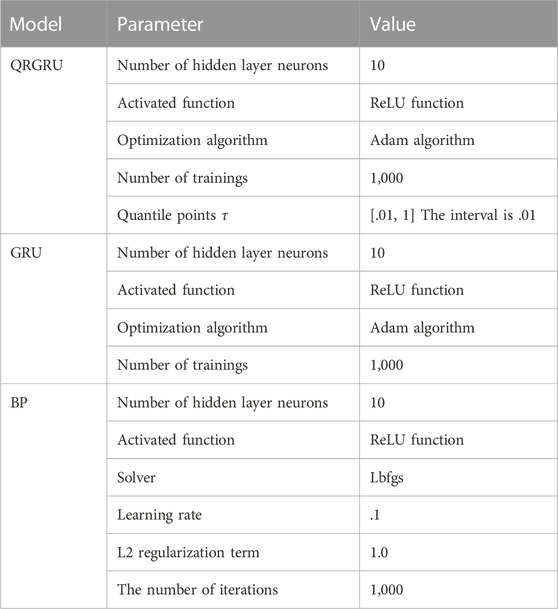
TABLE 2. Model and model parameter setting table.
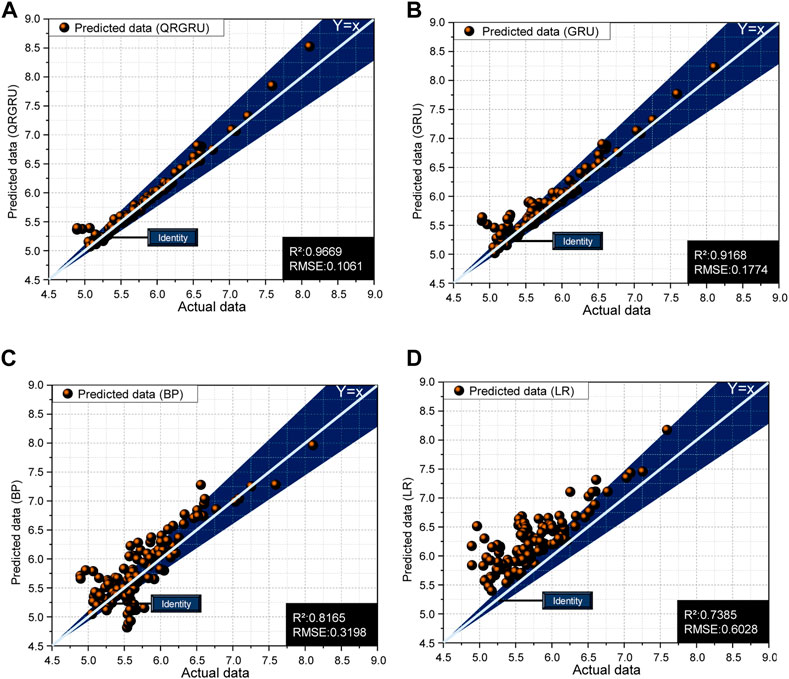
FIGURE 7. (A) is a scatter plot of the prediction results of QRGRU model (B) is a scatter plot of the prediction results of GRU model (C) is a scatter plot of the prediction results of BP model (D) is a scatter plot of the prediction results of LR model.
The model used in this article runs on the processor of the machine that is Inter Core i5-7200U, the running memory is 24G, and the system type is a 64-bit operating system.
In this paper, R2 and RMSE evaluation criteria were used. R2 represents the percentage of variance in the model that the dependent variable can be explained by the independent variable, and the closer the value of R2 is to 1, the better the model performs. RMSE is the root mean square error, representing the error of the model, the smaller RMSE is, the smaller the error is, the higher the model accuracy is.
Figure 7 shows a scatter plot of the true and predicted values of the four prediction models, where the closer the scatter points are to the center line, the better the prediction accuracy of the model is. It can be clearly seen from Figure 7 that the scatters predicted by the gated recurrent unit neural network based on quantile regression are basically distributed near the center line, indicating that the effect of the model is better in the four prediction models. R2 and RMSE are also introduced to evaluate the effect of prediction. The higher R2 is, the better the quality of the model is. The quality of QRGRU is the highest of the four prediction models and the R2 is 0.9669, followed by GRU (R2 = 0.9168). The worst is the LR model, with R2 only 0.7385. RMSE can reflect the prediction accuracy of the model, and the smaller RMSE is, the higher the accuracy is. Among them, the model accuracy of QRGRU is the highest among the four models, and RMSE is only 0.1061. LR’s model accuracy is the lowest (RMSE = 0.6028). It can be seen from the results that the quantile regression method introduced in this paper improves the accuracy of GRU. By comparing with traditional predictive models (BP neural networks and linear regression methods), QRGRU outperforms traditional predictive models.
Figure 8 shows boxplots of the distribution of predicted and true data. It can be seen from the figure that the distribution of the predicted data of the QRGRU method is consistent with the true data, and the agreement degree of other models is not as good as that of QRGRU. Figure 9 shows the bar chart of four predictive model evaluation indicators, from which it can be clearly seen that the R2 of QRGRU is the highest and RMSE is the lowest.
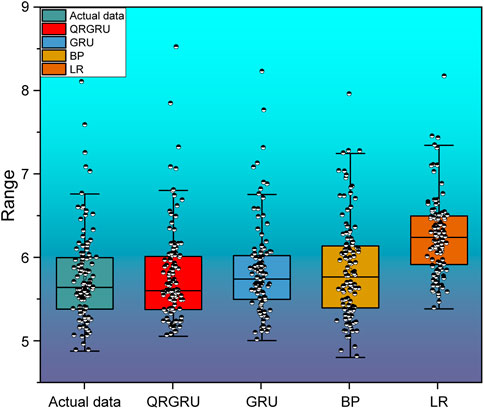
FIGURE 8. Boxplot of the distribution of predicted and true value data of four predictive models.
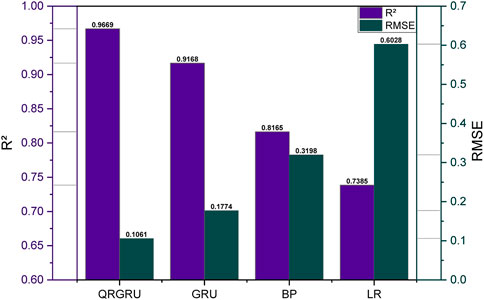
FIGURE 9. Forecast model evaluation index histogram.
5 Conclusion
In this paper, the prediction model is tested based on real logging data and porosity data measured in the laboratory, and a new method (gated recurrent unit neural network based on quantile regression) is proposed to predict the parameters of the reservoir. By comparing the new method with the traditional gated recurrent unit neural network, it is shown that the introduction of the quantile regression method greatly improves the prediction accuracy of the traditional gated recurrent unit neural network. In the test set, the model accuracy of QRGRU is the highest of the four models, and the RMSE is only 0.1061. The model accuracy of GRU is lower than that of QRGRU, and RMSE reaches 0.1774. This paper also introduces two of the most widely used prediction models (BP neural network and linear regression), which can be compared with QRGRU to show that the QRGRU method is superior to BP neural networks and linear regression.
Data availability statement
The original contributions presented in the study are included in the article/supplementary material, further inquiries can be directed to the corresponding author.
Author contributions
ZY: Data collection; YS: Thesis writing; JZ: Thesis revision; YZ: Model establishment; ZL: Result analysis.
Conflict of interest
The authors declare that the research was conducted in the absence of any commercial or financial relationships that could be construed as a potential conflict of interest.
Publisher’s note
All claims expressed in this article are solely those of the authors and do not necessarily represent those of their affiliated organizations, or those of the publisher, the editors and the reviewers. Any product that may be evaluated in this article, or claim that may be made by its manufacturer, is not guaranteed or endorsed by the publisher.
References
Adegbite, J. O., Belhaj, H., and Bera, A. (2021). Investigations on the relationship among the porosity, permeability and pore throat size of transition zone samples in carbonate reservoirs using multiple regression analysis, artificial neural network and adaptive neuro-fuzzy interface system. Petroleum Res. 6 (4), 321–332. doi:10.1016/j.ptlrs.2021.05.005
Angeleri, G. P., and Carpi, R. (1982). Porosity prediction from seismic data[J]. Geophys. Prospect. 30 (5), 580–607. doi:10.1111/j.1365-2478.1982.tb01328.x
Benesty, J., Chen, J., and Huang, Y. (2009). “Pearson correlation coefficient[M],” in Noise reduction in speech processing (Berlin, Heidelberg: Springer), 1–4.
El-Shahat, W., Afify, W., and Hassan, A. (2010). Permeability and porosity prediction from wireline logs using Neuro-Fuzzy technique[J]. Ozean J. Appl. Sci. 3 (1), 157–175.
Erofeev, A., Orlov, D., Ryzhov, A., and Koroteev, D. (2019). Prediction of porosity and permeability alteration based on machine learning algorithms. Transp. Porous Media 128 (2), 677–700. doi:10.1007/s11242-019-01265-3
Fu, R., Zhang, Z., and Li, L. (2016). “Using LSTM and GRU neural network methods for traffic flow prediction[C],” in 2016 31st Youth Academic Annual Conference of Chinese Association of Automation (YAC) (IEEE), 324–328.
Gamal, H., and Elkatatny, S. (2021). Prediction model based on an artificial neural network for rock porosity. Arabian J. Sci. Eng. 47, 11211–11221. doi:10.1007/s13369-021-05912-0
Jamshidian, M., Hadian, M., Zadeh, M. M., Kazempoor, Z., Bazargan, P., and Salehi, H. (2015). Prediction of free flowing porosity and permeability based on conventional well logging data using artificial neural networks optimized by Imperialist competitive algorithm – a case study in the South Pars gas field. J. Nat. Gas Sci. Eng. 24, 89–98. doi:10.1016/j.jngse.2015.02.026
Leite, E. P., and Vidal, A. C. (2011). 3D porosity prediction from seismic inversion and neural networks. Comput. Geosciences 37 (8), 1174–1180. doi:10.1016/j.cageo.2010.08.001
Li, C., Chen, X., and Du, Z. (2004). “A new relationship of rock compressibility with porosity[C],” in SPE Asia Pacific oil and gas conference and exhibition (Perth, Australia: OnePetro).
Lim, J. S., and Kim, J. (2004). “Reservoir porosity and permeability estimation from well logs using fuzzy logic and neural networks[C],” in SPE Asia Pacific Oil and Gas Conference and Exhibition (Perth, Australia: OnePetro).
Myers, L., and Sirois, M. J. (2004). Spearman correlation coefficients, differences between[J]. Encycl. Stat. Sci. 12. doi:10.1002/0471667196.ess5050.pub2
Serra, O., and Abbott, H. T. (1982). The contribution of logging data to sedimentology and stratigraphy. Soc. Petroleum Eng. J. 22 (01), 117–131. doi:10.2118/9270-pa
Serra, O., and Serra, L. (2004). Well logging. Data acquisitions and applications[J]. France: ETDEWEB.
Siddiqui, S., Grader, A. S., and Touati, M. (2005). “Techniques for extracting reliable density and porosity data from cuttings[C],” in SPE Annual Technical Conference and Exhibition (Texas: OnePetro).
Singh, S., Kanli, A. I., and Sevgen, S. (2016). A general approach for porosity estimation using artificial neural network method: A case study from Kansas gas field. Studia Geophys. Geod. 60 (1), 130–140. doi:10.1007/s11200-015-0820-2
Sun, S. Q. (1995). Dolomite reservoirs: Porosity evolution and reservoir characteristics[J]. AAPG Bull. 79 (2), 186–204.
Sun, Y. X., Xiao, C., and Zhao, J. Y. (2011). New method for predicating reservoir sensitivity rapidly[C].2011 international conference on machine learning and cybernetics. IEEE 3, 1404–1408.
Tao, L., Li, Z., Bi, Y., Li, B., and Zhang, J. (2010). Multi-combination exploiting technique of ultra-heavy oil reservoirs with deep and thin layers in Shengli Oilfield. Petroleum Explor. Dev. 37 (6), 732–736. doi:10.1016/s1876-3804(11)60007-4
Varol, Y., Oztop, H. F., and Avci, E. (2008). Estimation of thermal and flow fields due to natural convection using support vector machines (SVM) in a porous cavity with discrete heat sources. Int. Commun. Heat Mass Transf. 35 (8), 928–936. doi:10.1016/j.icheatmasstransfer.2008.04.016
Yakimchuk, I., Evseev, N., and Korobkov, D. (2019). “Permeability and porosity study of achimov formation using digital core analysis[C],” in SPE Russian Petroleum Technology Conference (Moscow, Russia: OnePetro).
Keywords: QRGRU, quantile regression, gated recurrent unit network, reservoir parameter prediction, gated recurrent unit neural network
Citation: Yu Z, Sun Y, Zhang J, Zhang Y and Liu Z (2023) Gated recurrent unit neural network (GRU) based on quantile regression (QR) predicts reservoir parameters through well logging data. Front. Earth Sci. 11:1087385. doi: 10.3389/feart.2023.1087385
Received: 02 November 2022; Accepted: 04 January 2023;
Published: 17 January 2023.
Edited by:
Saulo Oliveira, Federal University of Paraná, BrazilReviewed by:
Natasha Khan, Abbottabad University of Science and Technology, PakistanZhuofan Liu, China University of Petroleum, Huadong, China
Shike Zhang, Anyang Normal University, China
Copyright © 2023 Yu, Sun, Zhang, Zhang and Liu. This is an open-access article distributed under the terms of the Creative Commons Attribution License (CC BY). The use, distribution or reproduction in other forums is permitted, provided the original author(s) and the copyright owner(s) are credited and that the original publication in this journal is cited, in accordance with accepted academic practice. No use, distribution or reproduction is permitted which does not comply with these terms.
*Correspondence: Youzhuang Sun, OTA1NzM2NTc5QHFxLmNvbQ==