 Chao Ma1
 Yufa Liu
- 1Sichuan Earthquake Agency, Chengdu, China
- 2Department of Geophysics, Kyoto University, Kyoto, Japan
Faults along the boundaries of active tectonic blocks are the main structures that are responsible for major earthquakes in mainland China. Investigating the geometric distribution, rupture behavior, and paleoseismic history of these faults is the prerequisite for constraining geodynamic models and regional seismic hazard analyses. The Nanhe Fault, located at the eastern boundary of the Sichuan–Yunnan Block near Mianning County, has been paid less attention so far due to insufficient historical records of major earthquakes. In this paper, we focused on the Nanhe Fault and conducted satellite imagery interpretation, field investigations, and trench excavations. Our findings indicate that the Nanhe Fault initiates north of Mianning County; the north segment of the fault is connected with the Anninghe Fault; and it extends for about 70 km south-westward and terminates southwest of Ermaga Village. The fault has been faulting in the late Late Pleistocene with a left-lateral strike-slip rate of 2.40–2.56 mm/yr, while in the late Holocene, the left-lateral strike-slip and vertical slip rates are 2.50–2.60 mm/yr and about 0.60 mm/yr, respectively. Three paleoseismic events (5373–4525 BC, AD 1193–1576, and AD 1496–1843) were identified by excavating trenches at the Nanhe Fault. A comparative analysis of paleoseismic events between the Nanhe and the Anninghe fault indicates that both faults may have induced cascade rupture or triggered earthquakes—such related events may have occurred in 1496–1627. Additionally, by comparing the kinematic relationship of the faults at the eastern boundary of the Sichuan–Yunnan Block, we propose that the Nanhe Fault takes part in strain partitioning along the boundary. This interpretation reasonably explains the loss of the sliding rate between the Anninghe and Zemuhe faults, which also supports the GPS inversion results, and the discontinuous deformation model for the eastern margin of the Tibetan Plateau.
1 Introduction
The ongoing collision of the Indian and Eurasian plates over the past 50 million years has caused the uplift of the Tibetan Plateau. The deformation mechanism of the eastern margin of the plateau is controversially discussed for decades (Tapponnier et al., 1982; Molnar and Qidong, 1984; Tapponnier et al., 1986; Peltzer et al., 1988; Tapponnier et al., 2001; Zhang et al., 2004). Two end-member hypotheses have been proposed to illustrate the deformation: 1) the continuous deformation model implies that the deformation is distributed over thousands of kilometers throughout the entire eastern Tibetan Plateau. Major faults played a negligible role in the eastward motion of the plateau. 2) On the contrary, the discontinuous deformation model considers that the deformation is mainly localized on the major faults along the margins of the active block. A way to explore the problem is to study the interaction of major fault systems in the eastern margin of the plateau, including the deformation decomposition of the slip rate and the interrelation of paleoseismicity.
Tectonically active blocks are the main geological units that are affected by deformation in mainland China nowadays and control the strong earthquake activity and distribution characteristics in this area (Deng, 1980; Ding, 1991; Zhang, 1999; Zhang et al., 2003). The hierarchy and classification of such active blocks can be considered a geological way of coupling the “continuous deformation model” with the “discontinuous deformation model.” Further refinement of active blocks can accurately analyze regional deformation modes more precisely (Gao, 2021). Previous studies, including the block division at the regional level in mainland China (Zhang et al., 2003), the block division at the Tibetan Plateau level, and the detailed block division in the Sichuan–Yunnan region (Xu et al., 2003; Xu et al., 2013), have further documented the important role of the boundary faults in the areas of active blocks. The NW-NS-striking Xianshuihe–Anninghe Fault zone, a major left-lateral strike fault along the eastern boundary of the Sichuan–Yunnan Block, has a complex structure and is connected with a series of NE-NNW-trending faults. In the past 150 years before 1973, 10 major earthquakes occurred along the Xianshuihe and Anninghe faults (XSHF and ANHF) with magnitudes ≥7. On 5 September 2022, an M 6.8 earthquake occurred along the southeast section of the XSHF near Luding County in Sichuan Province, China. A total of 93 people died during the earthquake which furthermore caused numerous casualties and heavy property losses. This earthquake indicates that the Xianshuihe–Anninghe Fault zone still represents a major seismic hazard. Several detailed studies on the Xianshuihe–Anninghe Fault zone segmentation, slip rate, deformation history, and other aspects of the fault zone have been conducted (Qian et al., 1988; Wen, 1989; Allen et al., 1991; Wen et al., 2000a; Wen, 2000b; Wen et al., 2001; Zhou et al., 2001; Wen et al., 2007; Ran et al., 2008a; Ran et al., 2008b; Chen et al., 2011; Wang et al., 2018). These studies focused on the main faults. However, the secondary branch fault on the side of the main faults also plays an important role in the regional tectonic deformation. For instance, the Tazang Fault, the southern segment of the East Kunlun Fault, and the Diebu–Bailongjiang Fault together form a large strike-slip fault series with a NW parallel distribution, which jointly bears the structural deformation from the west side.
The Nanhe Fault (NHF) is an active fault, and the north segment of the fault is connected with the Anninghe Fault (ANHF) near Mianning County (Figures 1, 2). The NHF extends for about 70 km south-westward and terminates southwest of Ermaga Village (Figure 2). Due to the absence of major earthquakes records and low slip rate, the NHF has been poorly studied so far, and its characteristics and evolution are hardly known. Therefore, the study of the slip rate and paleoseismic events of the NHF is of major significance for understanding the strain distribution in the ANHF and for evaluating the regional seismic hazard related to this fault.
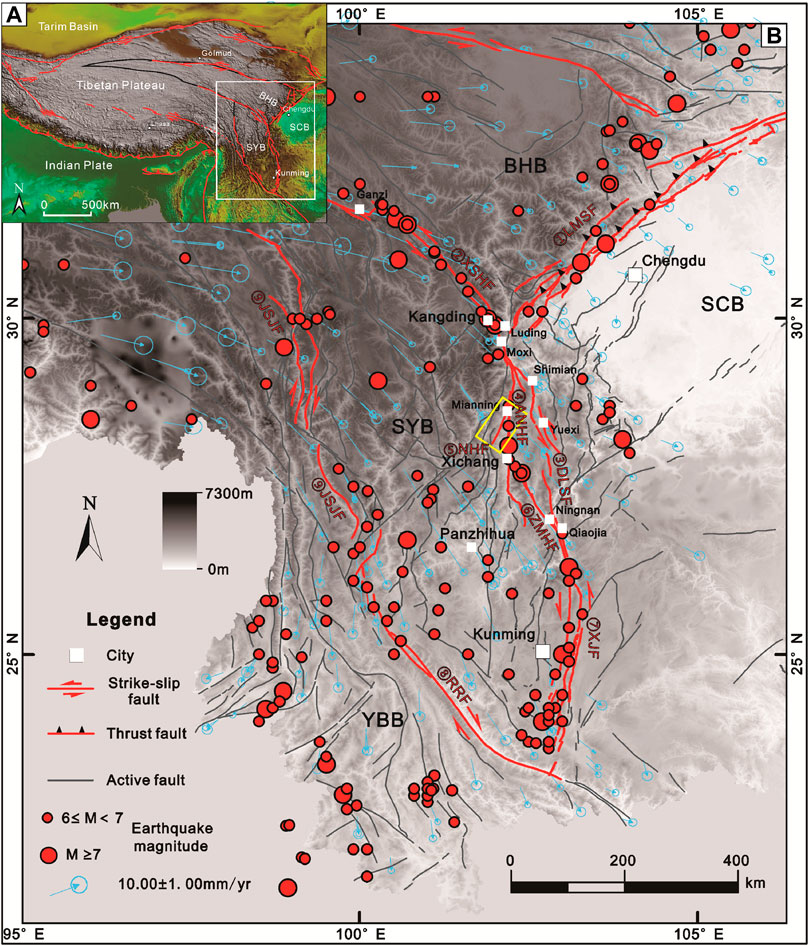
FIGURE 1. Tectonic setting at the southeastern Tibetan Plateau. (A) Regional tectonics of the Tibetan Plateau. (B) Tectonic setting at the eastern margin of the Sichuan–Yunnan Block. The distribution of the active faults is modified from Deng (2007). The yellow rectangle marks the study area which is shown in Figure 2 in more detail. Red circles show earthquakes recorded in this area, and the size of the circles represents different magnitudes. Blue arrows show GPS velocities of crustal motion of the southeastern Tibetan Plateau relative to Eurasia (Gan et al., 2007; Liang et al., 2013). The base map is the 3-arc-second SRTM digital elevation model (DEM). SCB, South China Block; BHB, Bayan Har Block; SYB, Sichuan–Yunnan Block; YBB, Yunnan–Burma Block; ①LMSFZ, Longmenshan Fault zone; ②XSHF, Xianshuihe Fault; ③DLSF, Daliangshan Fault; ④ANHF, Anninghe Fault; ⑤NHF, Nanhe Fault; ⑥ZMHF, Zemuhe Fault; ⑦XJF, Xiaojiang Fault; ⑧RRF, Red River Fault; ⑨JSJF, Jinshajiang Fault.
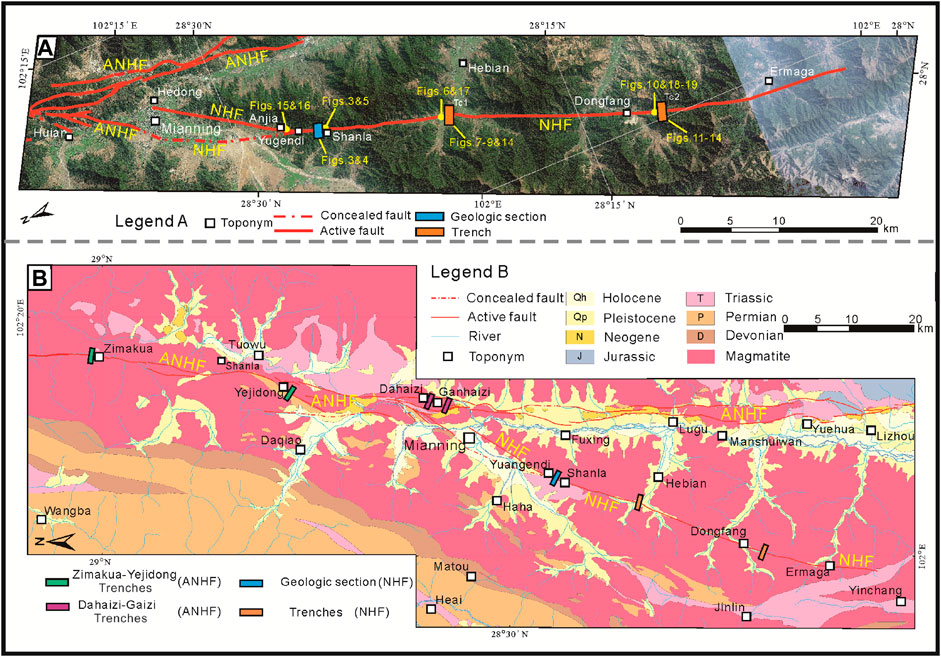
FIGURE 2. Satellite image (taken from Google Earth) and geologic map of the Nanhe Fault (NHF). (A) Satellite image illustrates the spatial distribution, structure, and intersecting relationship of the NHF and ANHF. The yellow dots represent the other images in this study. (B) Map of the surface geology of the study area, showing local geology and location of towns, trenches, and geological sections.
In this study, we conducted remote sensing, field investigations, unmanned aerial vehicle (UAV) mapping, and trench excavations on the NHF. Based on the new data, we constrained the fault characteristics, slip rate, and paleoseismic history of the NHF, and we discussed the possible max potential magnitudes in the future of the fault. By analyzing the structural characteristics of the NHF and ANHF, along with their paleoseismic histories, we discussed the ruptured relationship between the NHF and ANHF and the role of the NHF in the regional tectonic model.
2 Geological setting
Since 70–34 Ma, the Tibetan Plateau was strongly uplifted as a response to the continuous collision between the Eurasian and Indian plates (Kirby et al., 2002; Wan et al., 2002; Clark et al., 2005; Aitchison et al., 2007). Due to the northward movement of the Indian Plate during the collision, tectonic blocks that were initially situated at the eastern Qinghai–Tibetan Plateau, including the Bayan Har Block (BYB), the South China Block (SCB), and the Sichuan–Yunnan Block (SYB), started to be pushed eastwards, along the direction of a large-scale strike-slip fault zone (Xu et al., 2003; Xu et al., 2013). Brittle deformation within this strike-slip fault zone caused the occurrence of earthquakes in China mainly along the block boundary faults (Xu et al., 2003; Zhang et al., 2003).
The SYB is located to the southeast of the Qinghai–Tibetan Plateau, which is mainly bounded by several major faults, including the XSHF, ANHF, Daliangshan Fault (DLSF), Zemuhe Fault (ZMHF), Xiaojiang Fault (XJF), Red River Fault (RRF), and Jinshajiang Fault (JSJF), from east to west (Figure 1). Among the tectonic blocks, the SYB is one of the best studied blocks, as it is one of the most seismic active blocks in the SW China. The eastern boundary of the SYB is characterized by four left-lateral strike-slip faults, namely, (from north to south) the XSHF, ANHF, DLSF, and ZMHF (Xu et al., 2003; Xu et al., 2005; Zhang et al., 2002; Zhang et al., 2004).
The overall moving direction of the SYB, as revealed by the GPS velocity, is south–southeast (150°–160°). In the Xianshuihe area, the moving direction of the northern SYB is SE120°, while in the Kunming area, the southern SYB is moved toward SE165° (Figure 1) (Wang et al., 2001; Zhang et al., 2002; Xu et al., 2003; Xu et al., 2005; Zhang et al., 2004; Gan et al., 2007). The GPS velocity tangential documents strong left-lateral shear along the XSHF–ANHF–ZMHF–XJF fault system (Wang and Shen, 2020). The moving velocity on the southern side of the XSHF is higher than that on the northern side, inducing the left-lateral strike-slip movement of the fault. In the area where the ANHF and DLSF intersect, the GPS velocity vector to the east of the Anning River deflects more eastward and increases, causing the maintenance of the dominant left-lateral strike-slip with a minor amount of a thrust component. On both sides of the ZMHF, the direction of the GPS velocity vector is almost parallel to the strike of the fault, causing the predominance of the left-lateral strike-slip movement of the ZMHF (Zhang et al., 2002; Xu et al., 2003).
The XSHF can be divided into northwest and southeast segments, concerning the Huiyuansi pull-apart basin. The northwest segment is about 200 km long and is a single fault with a left-laterally horizontal slip rate of 10.00–15.00 mm/yr (Qian et al., 1988; Wen, 1989; Allen et al., 1991). The structure of the southeast segment is more complex. Between Qianning and Kangding, the southeast segment of the XSHF is characterized by three parallel secondary faults. To the south of Kangding City, the XSHF manifests as a single fault and is named the Moxi Fault (MXF), with a sliding rate of about 9.00–10.00 mm/yr (Wen et al., 2001; Zhou et al., 2001). The MXF is the most critical component of the southeast segment of the XSHF and strikes N20°–30°W and starts close to the small village Yuejinping. Heading to the south, the MXF passes through Moxi, Tianwan, and Anshun. Further south, evidence of recent seismic activity of the MXF gradually diminishes (Zhou et al., 2001). The left-lateral displacement of MXF in an abandoned channel ditch on the Moxi platform shows a late Holocene sliding rate of 9.40 ± 1.70 mm/yr for MXF (Wen et al., 2001). According to trench analysis and carbon dating, the latest major earthquake in the southeastern segment of the XSHF, the Moxi Mw 7.75 earthquake, occurred in 1786 (Chen et al., 2011).
The ANHF is exposed to the south of XSHF and is one of the most active faults in the east of the SYB. The ANHF commences at Shimian and continues southward through Zimakua, Yejidong, Mianning, Lugu, and Dechang. Further south, the ANHF gradually disappears at Huili. The overall direction of the ANHF is approximately north–south, and its total length is approximately 150–160 km (Ran et al., 2008a; Ran et al., 2008b). The ANHF can be subdivided into three segments based on fault structure, geomorphology, and paleoseismicity (Wen et al., 2000a; Wen, 2000b; Wen et al., 2007; Ran et al., 2008a; Ran et al., 2008b). The two boundaries of these three segments of ANHF are located close to the cities of Mianning and Xichang. The northern segment of the ANHF is situated in Mianning. The central segment of the ANHF occurs between Mianning and Xichang, and the southern segment is exposed to the south of Xichang. The horizontal component of the slip rate from the late Holocene is 6.20 mm/yr for the northern segment of ANHF, and the vertical component is 1.40 mm/yr (Ran et al., 2008a; Ran et al., 2008b). Based on a block model, Wang et al. (2008) calculated a slip rate of about 5.10 ± 2.50 mm/yr for the entire ANHF. Several major paleoseismic events on the northern segment of the ANHF have been revealed (Wen et al., 2000a; Wen, 2000b; Wen et al., 2007; Ran et al., 2008a; Ran et al., 2008b). The southern segment of the ANHF is about 175 km long, and seismic activity since the late Quaternary is not recorded.
Near Xichang, the DLSF is situated to the east of the ANHF, and the DLSF is composed of six secondary faults. Major earthquakes were not recorded for these faults in recent times. The total length of the DLSF is about 280 km. The northern segment of the DLSF forms a left stage en échelon with the XSHF (Zhou et al., 2003) through Haitang, Yuexi, Puxiong, Zhuhai, Butuo, Jiaojihe, and Qiaojia. Continuing further south, it forms a right-stage en échelon with the XJF. The overall horizontal slip rate of the DLSF since the Holocene is 3.00–4.00 mm/yr (Zhang, 2008), and it is 3.10 mm/yr for its southern segment (Shen et al., 2005; He and Oguchi, 2008; Wei et al., 2012; Sun et al., 2015). Many paleoseismic events have been identified on the secondary faults of the DLSF (Song et al., 2002; Zhou et al., 2003; Gao et al., 2016). Recent paleoseismic studies have been focused on the southern segment of the DLSF (Gao et al., 2016; Sun et al., 2019) and have documented the potential for the generation of M6.5+ earthquake in this segment (Sun et al., 2019).
The northern end of the ZMHF is connected to the ANHF at Xichang. The deformation of the ZMHF is also dominated by a left-lateral strike-slip movement since the late Quaternary, thus resembling the movement of the ANHF and the XSHF (Wang et al., 2014). The overall length of the ZMHF is roughly 140 km, and it passes through Xichang, Puge, Ningnan, and Qiaojia from north to south where it intersects with the XJF (Huang and Tang, 1983). Recent studies on the ZMHF have focused on the characterization of the surface rupture caused by the Mw7 earthquake in 1850 (Ren and Li, 1993; Ren, 1994; Feng and Du, 2000; Yu et al., 2001; He and Oguchi, 2008; Ren et al., 2010; Wang et al., 2011; Wang et al., 2013). Analyses of the paleoseismic events in the northern segment of the ZMHF have indicated an average recurrence interval of about 2,300 years for large-magnitude earthquakes in this area (Du, 2000; He and Ren, 2003; Tian et al., 2008; Ren et al., 2010). The slip rate of the ZMHF, estimated through geological and geomorphological analyses, is 2.40–3.60 mm/yr with an average of 3.00 mm/yr (Wang, 2012; Wang et al., 2013; Wang et al., 2017). Wang et al. (2008) calculated a left-lateral strike-slip rate of 2.80 ± 2.30 mm/yr for the ZMHF zone using a tectonic block model.
3 Methods
3.1 Fault mapping and surveying
Based on satellite imageries, such as the 2 m resolution GF-2 imagery and high-resolution Google Earth image, faults were identified and traced on a surface map. By interpreting the high-resolution imageries, fault-related geomorphic features, such as the displacement of terraces, gullies, vegetation boundaries, fault scarps, and troughs, were identified. In addition, geological maps, and digital elevation maps (DEMs) were used to refine the identification of geomorphic expressions and the tracing of faults.
We validated and modified our indoor interpretations through field investigations. We conducted fault UAV field mapping and high-resolution migration geomorphological survey to understand the characteristics of the NHF in the late Quaternary. Based on the structure-from-motion technique, we used unmanned aerial vehicles (UAVs, DJI Phanton 3 Pro) at selected key locations to construct high-resolution digital orthographic and digital surface models (DSMs) using Agisoft PhotoScan software. Additionally, to improve the visual contrast of the geomorphic features, we established shaded relief maps, using resultant DSMs and Golden Surfer software. For base maps, we used printed orthographic and shaded relief maps to elaborate detailed tectonic landforms. The use of these maps enhances the visual contrast for visualizing geomorphic features, thus improving the identification of features on the maps. By utilizing high-resolution DSMs, we subsequently measured displacements of geomorphic features based on piercing points on both sides of the fault trace.
3.2 Trench investigation
To accurately reveal the paleoseismic history of the NHF, we excavated two trenches in a Holocene sedimentary environment which has been continuously filled with debris transported from hillslopes. Thus, the sedimentary successions record and preserve evidence of fault displacement. By excavating trenches that cut across the fault strike, evidence for displacement was recognized on the trench wall. To acquire clear strata and faulting information from the sedimentary layers, trench walls were cleaned and gridded into 0.5 × 1 m squares with white yarn. Subsequently, pictures were taken for the trench walls and edited using Adobe Photoshop and CorelDRAW. Finally, strata on the trench walls were interpreted to construct a schematic cross section that elucidates the determination of surface-rupturing events.
3.3 Sample dating
To constrain the age of surface-rupturing events that were identified from the trench walls, we collected samples for chronological analysis from the bottom of the diluvial fans and displaced sedimentary strata. The samples were collected from the trench wall and were sealed, preserved in plastic bags, and sent to Beta Analytic Inc. in Miami (United States) for further data processing and radiocarbon dating analysis.
As the slip rate of a fault is defined as the ratio of displacement to the time interval over which that slip accumulated (Keller and Pinter, 2002), we calculated the slip rates of the NHF by dividing the displacements of the gullies by the sediment ages around them. The displacements were measured in the field and the sediment ages were revealed from carbon dating. The timing of the paleoseismic events, which were revealed from the trench wall, was constrained by the age of the sedimentary layers above and below the faulting event. The radiocarbon ages were acquired through stratigraphic sequence calibration using the OxCal 4.3.2 program with the IntCal20 atmospheric curve (Bronk Ramsey, 2009; Reimer et al., 2020; https://c14.arch.ox.ac.uk/oxcal/OxCal.html). Conventional radiocarbon ages of the determined paleoseismic events were eventually converted into calendar years.
3.4 Seismic hazard analysis
To predict the scale of possible future, seismic hazards on the NHF, we calculated the maximum magnitude of the earthquakes that may be induced by the NHF using five published equations (Bonilla et al., 1984; Deng et al., 1992; Wells and Coppersmith, 1994; Wen, 1995) (Table 1). Additionally, the maximum fault displacement that the NHF can generate was calculated using published equations, and the calculated result of the NHF was compared with other faults (Bonilla et al., 1984; Deng et al., 1992; Wells and Coppersmith, 1994; Wen, 1995; Li et al., 1997) (Table 2).
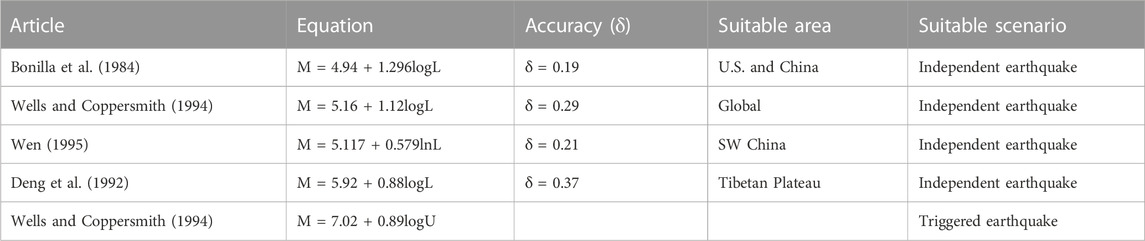
TABLE 1. Equations for the calculation of the maximum magnitude of an earthquake potentially generated by a specific fault (Bonilla et al., 1984; Deng et al., 1992; Wells and Coppersmith, 1994; Wen, 1995) (M, maximum earthquake magnitude; L, fault length; U, fault displacement in one earthquake).
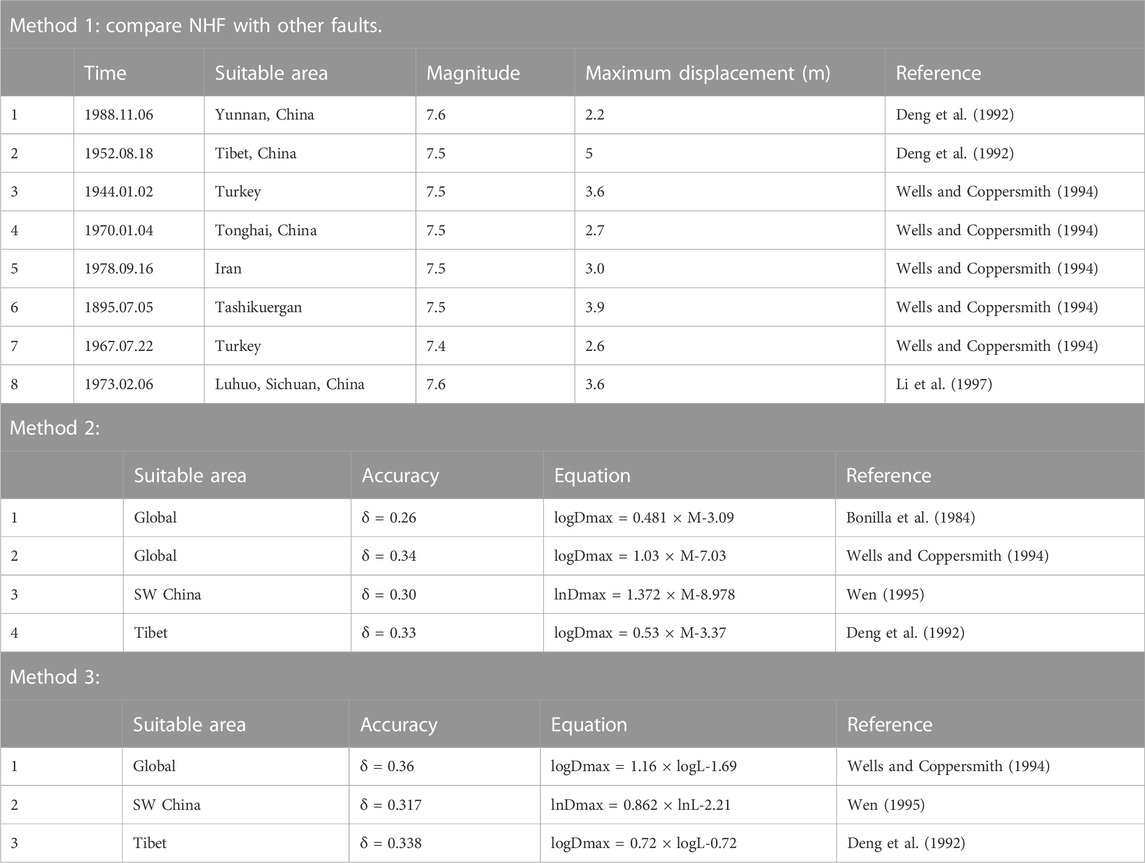
TABLE 2. Equations for the calculation of the maximum fault displacement potentially produced by a specific earthquake (Bonilla et al., 1984; Deng et al., 1992; Wells and Coppersmith, 1994; Wen, 1995) (Dmax, maximum fault displacement; M, earthquake magnitude; L, fault length).
4 Results
4.1 Field investigation
Based on the interpretation of satellite images, we detected that the northern end of the NHF starts in the Anninghe valley and that the NHF intersects with the ANHF at an angle of around 30°. While the trend of the NHF is to the N25°E, the ANHF is roughly north–south-oriented (Figure 2). As the NHF extends to the southwest, it passes through Mianning County and Anjia Village, Yuangendi, Hebian Township, and Dongfang Village. After the NHF passes the village of Ermaga, its further continuation remains uncertain. Further south, the NHF is poorly visible on the satellite images. The total length of the NHF is about 70 km. Negative landforms, such as fault trough, fault scarp, and fault sag pond, are formed by fault displacements, which display obvious linear characteristics in the satellite images.
Based on the interpretation of satellite images, remote sensing, and field investigation, we detected one displacement of the diluvial fans, four displacements of gullies, four fault scarps, two geological sections, and two fault striations (Figure 2). Three locations with geomorphic features were mapped in more detail by UAV, and two trenches were excavated (Figure 2).
Around Anjia Village, we recognized the formations of fault troughs, gullies, left-lateral synchronous displacement, fault sag pond, fault scarp, and other landforms that are related to the faulting of the NHF. To the south of Anjia Village, about 1.5 km south of the Yuangendi, the NHF truncates the mountains, forming a 1.0-m-high fault scarp (Figures 3B,C). From the regional stress field of the SYB and field investigations, it is evident that the fault scarp is formed by the compressional tectonic regime. A geological section was excavated across the NHF in this area (Figures 3A–C, Figure 4), which revealed evidence of two seismic events. The geological section demonstrates the characteristics of compression and shows that the NHF is developed in Triassic mixed diorite at this locality. The first event caused the displacement of the bedrock (U1, the Triassic mixed diorite) before the deposition of U2 (U2 is the colluvial wedge formed by the seismic event). The second event is the deformation of U3 (surface soil) and the formation of fault scarps that are around 1 m high. This was the latest event revealed by the geologic investigation.
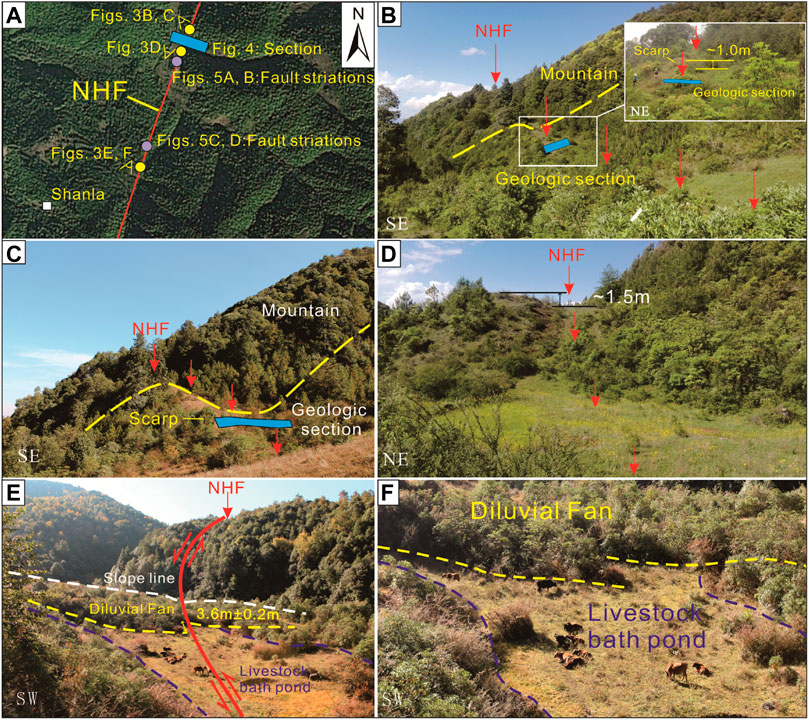
FIGURE 3. Landform displacement to the north of Shanla. (A) Satellite image from Google Earth that shows the location of the NHF survey points near Shanla, south of Yuangendi (see Figure 2 for location). (B) Field setting around the geological section (the geological section is shown in Figure 4). (C) Fault scarp of 1.0 m high near a geological section. (D) Fault scarp with a height of ∼1.5 m. (E) Diluvial fan left-laterally displaced by 3.6 ± 0.2 m east of Shanla. (F) Nearby the diluvial fan, a depression occurs that is used as a livestock bath pond (according to local residents).
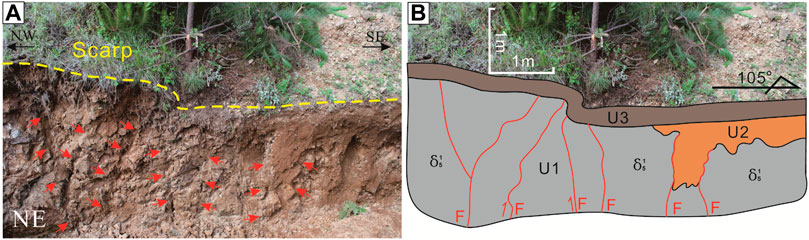
FIGURE 4. Geological section of the NHF south of Yuangendi (location is shown in Figures 2, 3). (A) Photograph of the location of the geological section. Red arrows and red lines indicate the fault trace/plane. (B) Annotations on (A): U3, humus soil layer; U2: colluvium; U1, Triassic mixed diorite δ51.
To the northeast of Shanla, the NHF traverses mountains and forms a 1.5-m-high fault scarp (Figure 3D). To the south of this fault scarp, we observed fault striations on the northeastern fault face near Shanla (GPS: 28.438,813°N; 102.105,692°E). The fault striations show a southwest–northeast orientation, and we observed developments of steps, indicating that the fault has a left-lateral strike-slip motion (Figure 5A). The plunge of the fault striations is 10°–15° (Figure 5B). Thus, we estimated ratios between 4:1 and 3:1 for the horizontal to vertical displacement of the fault. To the southwest of this striation, we recognized another fault striation on the fault surface of the NHF (GPS:28.436,158°N; 102.104,460°E). These fault striations strike NE (Figure 5C), and the dips are approximately 8°–10° (Figure 5D). Thus, a ratio of 5:1 is calculated for the horizontal to vertical displacement of the fault. Based on the plunge of the fault striations at the two locations, a left-lateral strike-slip with a minor thrust component is determined for the movement at the fault. The ratio of horizontal to vertical displacement is about 5:1–3:1.
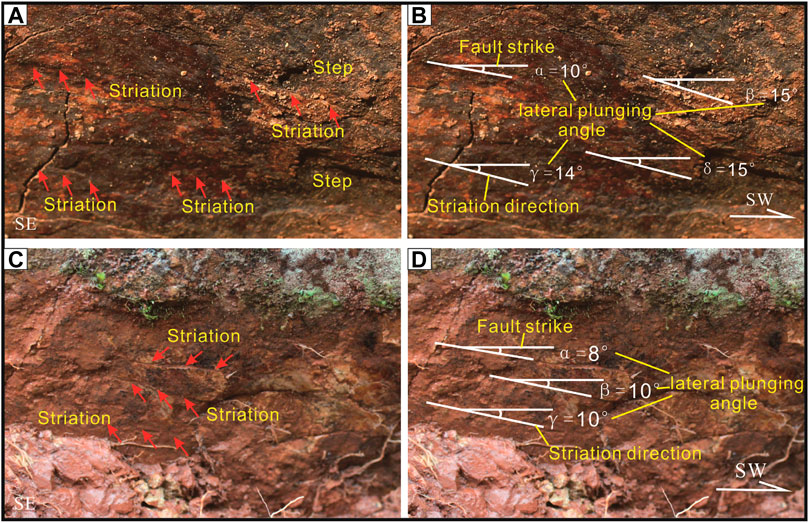
FIGURE 5. Fault striations. The location of these striations is marked in Figures 2A, 3A. (A, C) Red arrows mark the striations and steps. (B, D) Horizontal white lines trace the strike of the fault. Tilted white lines indicate the trend of the striations. Greek letters (α, β, γ, and δ) represent lateral plunging angles of the fault striations.
To the east of Shanla, on the extension line of the fault–sill, the fault passes through a diluvial fan and subsequently displaces the diluvial fan margin (Figure 3E). The edge of the vegetation marks the boundary of the diluvial fan (Figure 3F). The left-lateral displacement of the boundary for the diluvial fan is about 3.6 ± 0.2 m, probably representing the surface displacement caused by the latest seismic event (Figure 3E).
According to the field investigation, the movement of the NHF is dominated by a left-lateral component, which is indicated by the left-laterally displaced rivers, vegetation boundary, and fault striations. A minor thrust component is constrained by the presence of 1.0–1.5-m-high fault scarps. Our field investigations demonstrate that the NHF and ANHF share the same type of tectonic movements which are dominated by left-lateral strike-slip with minor thrusting.
4.2 Paleoseismic analysis
4.2.1 Stratigraphic units from Tc1 and Tc2
We excavated two trenches for our study. The trench near Hebian Township was named Tc1, and the trench near Dongfang Village was named Tc2 (Figure 2). To constrain the age of the paleoseismic events, Tc1 was excavated across the diluvial fan near Hebian, and Tc2 was excavated across the first terrace (T1) of the gully near Dongfang. The two locations were chosen because they are characterized by the accumulation of recent sediments. In such an environment, successive layers of fine-grained sediments are deposited, and therefore organic-rich material, suitable for radiocarbon dating, may occur in such sequences.
By analyzing soil characteristics from the trench wall, the sediments were grouped into six stratigraphic units in Tc1 (Figures 7, 14) and nine stratigraphic units in Tc2 (Figures 11, 14). We analyzed the cross-cutting relationships and thus constrained the timing of paleoseismic events. Based on the cross-cutting relationships, the timing of two events was constrained in Tc1, and that of three events in Tc2. Details of each stratigraphic unit are summarized in Table 3.
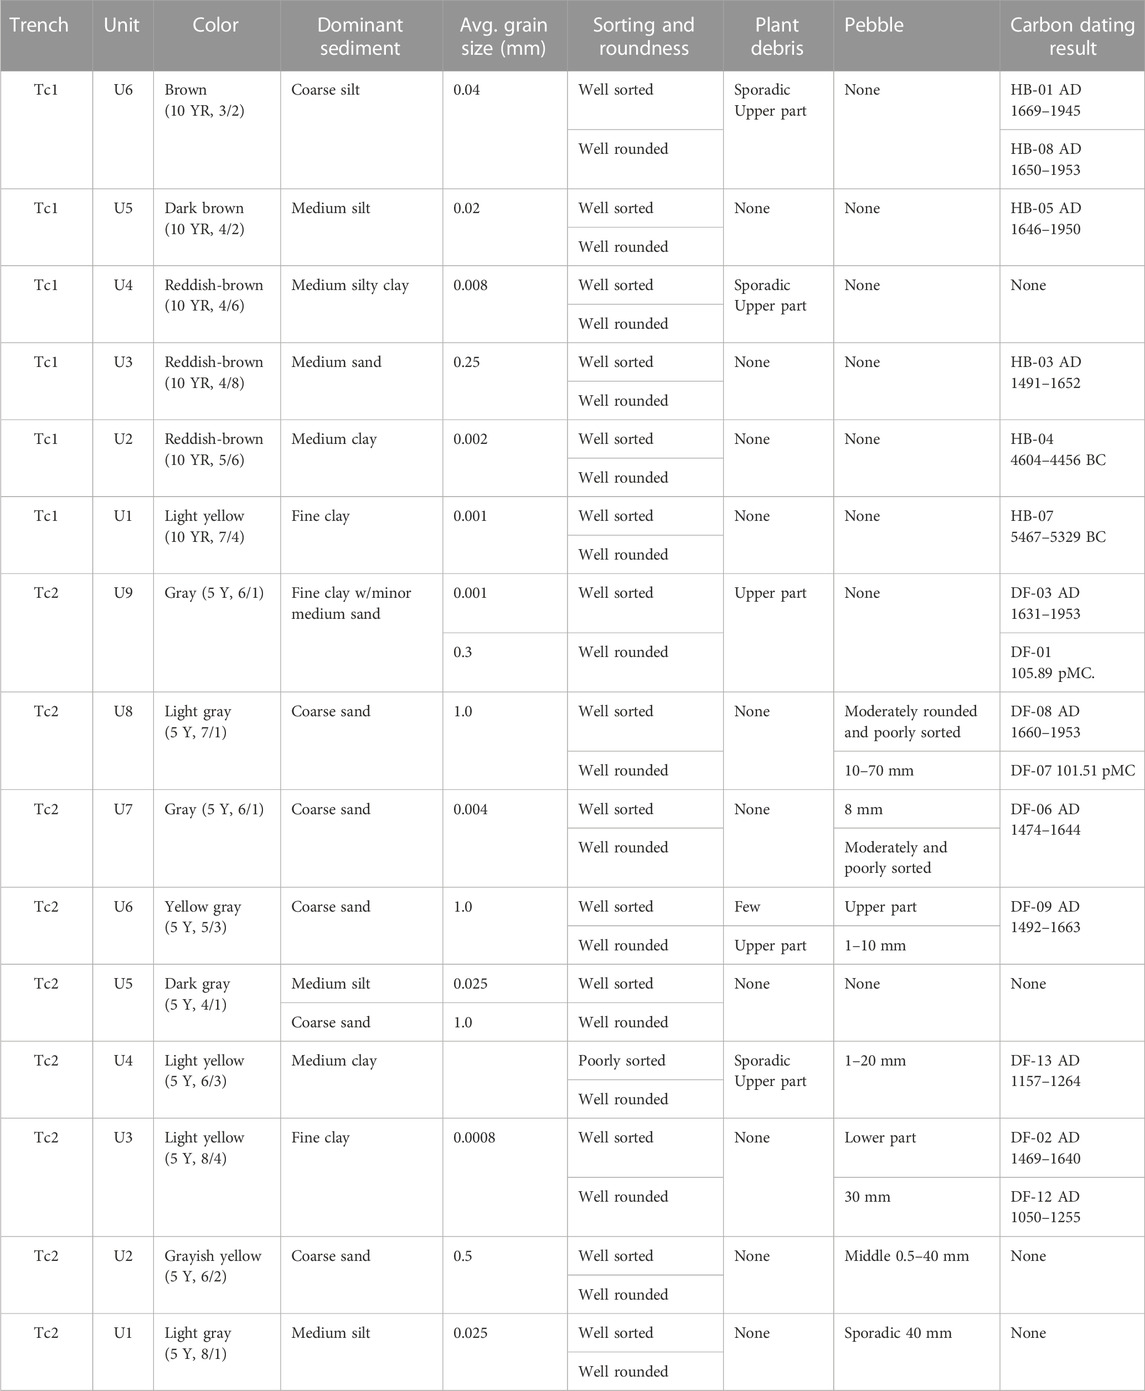
TABLE 3. Summary of stratigraphic units in Tc1 and Tc2.
4.2.2 Paleoseismic events revealed from Tc1 in Hebian Township
Based on the results of the field investigation in Hebian Township, we studied the displacements of two gullies to the north of Hebian (Figures 6A, 17). A left-lateral synchronous displacement of approximately 15 ± 0.2 m and 14 ± 0.2 m, respectively, of these two gullies, is obtained by UAV mapping (Figure 17) (see Section 4.4.2 for details). The bedrock section of the NHF is exposed in the south of the two gullies (Figure 6C). In this area, a series of fault scarps with an average height of 1.5 m occurs. An unequivocal fault pass is observed to the south of the fault scarp (Figure 6D). Tc1 was excavated on a diluvial fan, representing a fine sediment environment in the northern part of the central segment of the NHF (Figures 2, 6A,B). The trench has a length of 8 m and a depth of 2 m.
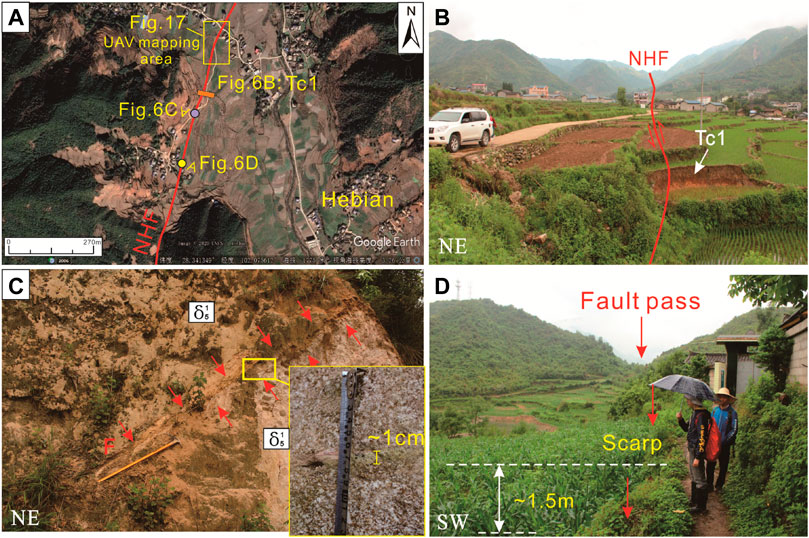
FIGURE 6. Tectonic landforms around Hebian Township where Tc1 was excavated. The location of this area is marked in Figure 2. (A) Satellite image (taken from Google Earth) showing geological and geomorphological survey sites, trench locations, and a UAV mapping area near Hebian. (B) Close-up of the geomorphology near Tc1 in Hebian. (C) Bedrock section of the NHF near Tc1. The fault occurs within the Triassic mixed diorite (δ51), which strikes 305° and dips 39°. A 1-cm-wide fault gouge is recognized near this fault. The diorite is heavily weathered. (D) Series of fault scarps to the south of Tc1. The average height of these fault scarps is approximately 1.5 m. To the south, a fault pass is observed.
The radiocarbon ages of the six lithostratigraphic units detected for the samples of Tc1 are summarized in Table 3. Based on the age of each unit and their position, the units are labeled from U1 to U6 with U1 as the oldest unit and U6 as the youngest one. Two faults are identified which are marked as F1 and F2 (Figure 7) by analyzing the trench wall.
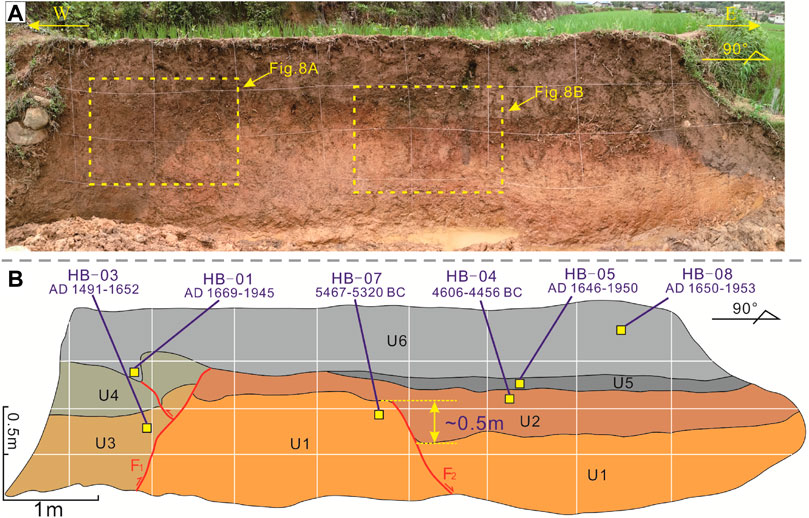
FIGURE 7. Northern wall of Tc1. (A) Photograph of Tc1. The dashed yellow rectangular marks of the region are shown in Figures 8A,B. (B) Interpretation of (A). The yellow rectangles represent radiocarbon dating sample locations. The sample locations are labeled with their sample number and the corresponding radiocarbon age. The black lines show the contact relationship of the strata. The red lines represent faults. A vertical displacement of approximately 0.5 m is observed in U1.
The first event (E1_Tc1): The fault F2 is considered to be formed by the first event that is revealed in Tc1. Because F2 displaced the entire U1 and barely displaced U2, the timing of E1_Tc1 after the deposition of U1 but before or during the deposition of U2 is constrained. Since the F2 barely extends to the upper part of U2, it is most likely that E1_Tc1 occurred after the deposition of lower U2 but before the deposition of upper U2 (Figures 7, 8B). Thus, according to the ages of the carbon samples retrieved from U1 (HB-07) and U2 (HB-04), the timing of E1_Tc1 is constrained.
The second event (E2_Tc1): This event in Tc1 is considered the event that formed the fault F1, which marks the unit boundary between U3–U4 and U1–U2 on the trench wall. Because F1 transects U4 but does not truncate U6, E2_Tc1 must postdate the deposition of U4 but predate the deposition of U6. Because U5 is a thin layer that hardly provides a cross-cutting relationship for E2_Tc1, it remains uncertain whether the timing of E2_Tc1 predates or postdates the deposition of U5. At least, the formation of F1 is bracketed between the deposition of U4 and U6 (Figures 7, 8A). Therefore, the timing of E2_Tc1 should lie between the ages of U4 and U6 which were constrained by the samples HB-03 and HB-08.
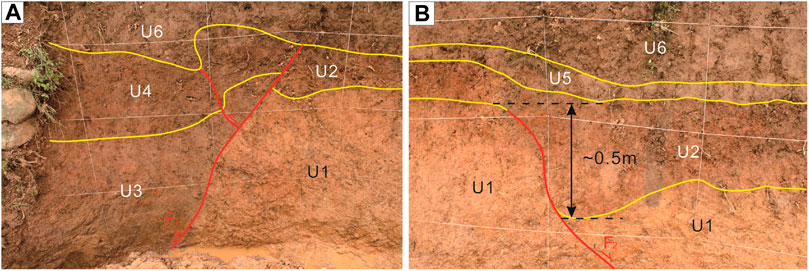
FIGURE 8. (A) Photograph on the western side of the TC1. (B) Photograph on the middle part of the TC1. Annotated photographs of close-up details of the faults in Tc1. The yellow lines show the contact relationships of the strata. The red lines represent faults. See Figure 7 for locations.
After conversion into a common format, the timing of the events is constrained as 5373–4525 BC for E1_Tc1 (Figure 9A) and AD 1520–1842 for E2_Tc1 (Figure 9B).
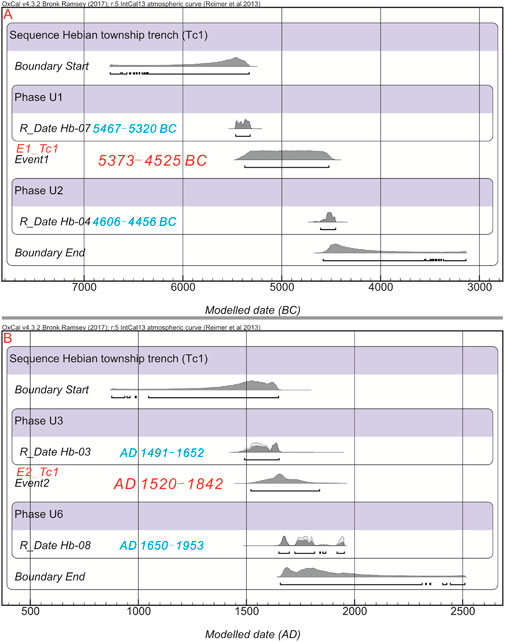
FIGURE 9. (A) The timing of paleoseismic event 1 (E1_Tc1) in Tc1 is constrained to 5373–4525 BC. (B) The timing of paleoseismic event 2 (E2_Tc1) in Tc1 is constrained to AD 1520–1842. Probability density functions (PDFs) for the timing of events observed at Tc1 were calculated using OxCal 4.3.2 (https://c14.arch.ox.ac.uk/oxcal/OxCal.html).
4.2.3 Paleoseismic events revealed from Tc2 in Dongfang Village
According to the results of our field investigation close to Dongfang Village, the NHF constitutes a left-lateral and right-order pressure ridge (Figures 10A,B), forming a strip-shaped pressure uplift. Based on UAV mapping of landforms near Dongfang Village, another topographic profile is observed which is approximately 0.5–1.5 m high (Figures 18, 19) (see Section 4.4.3 for details). Tc2 is located on the southern segment of the NHF (Figures 2, Figures 10A, C, D). Along the NHF, the first terrace (T1) of the gully is well preserved. The height of the T1 above the gully is approximately 1–2 m, and the sediment is fine-grained, indicating that the location here is in a sedimentary environment, thus providing a high likelihood to obtain carbon samples suited for dating purposes. We excavated a trench perpendicular to the fault trace. The trench had a length of 12 m, a width of 2 m, and a depth of 1.8 m (Figures 10D, 11). Because of the wet soil at the trench site, and the rainy weather during the excavation, the northeastern wall of the Tc2 was partially destructed and the southwestern wall of the Tc2 collapsed. Therefore, we only present data for the well-preserved wall of the trench.
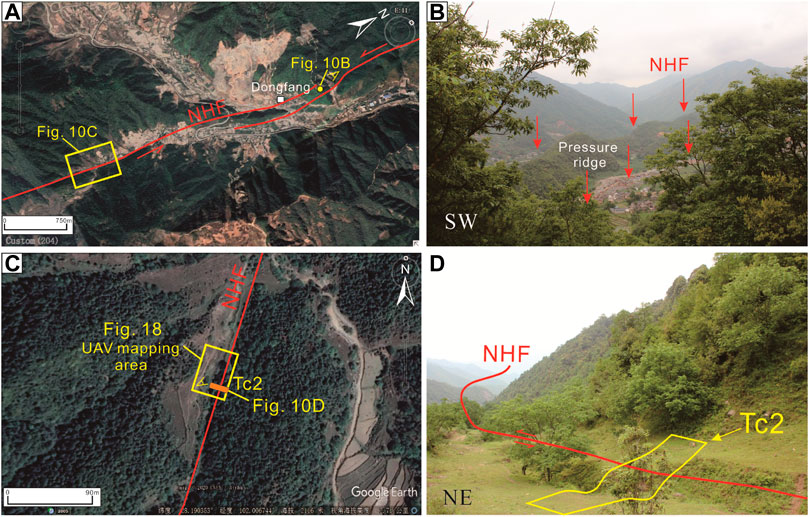
FIGURE 10. Tectonic landforms in Dongfang Village where Tc2 was excavated. The location of this area is marked in Figure 2. (A) Satellite image (taken from Google Earth) showing the location of the observed geomorphological features. (B) Location of the ridge near Dongfang. (C) Satellite image (from Google Earth) showing the trench locations and UAV mapping area near Dongfang. (D) Close-up geomorphology near Tc2 in Dongfang.
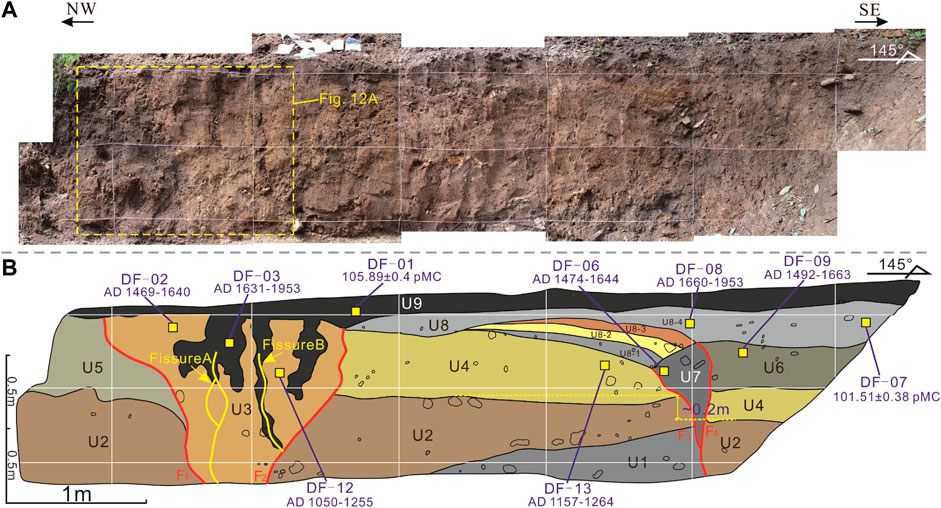
FIGURE 11. Eastern wall of Tc2. (A) Photograph of Tc2. The dashed yellow rectangle is the region shown in Figure 12A. (B) Interpretation of (A). The yellow rectangles represent radiocarbon dating sample locations. The sample locations are labeled with their sample number and the corresponding radiocarbon age. The black lines show the contact relationships of the strata. The red lines represent faults, and the yellow lines represent fissures. A vertical displacement of approximately 0.2 m is observed in U2.
The radiocarbon ages of the nine lithostratigraphic units recognized in Tc2 are summarized in Table 3. Based on the age of each unit and their position, the units are labeled from U1 to U9 with U1 as the oldest and U9 as the youngest unit. By analyzing the trench wall, four faults are identified, which are marked as F1, F2, F3, and F4 (Figure 11), that are related to three events (E1_Tc2, E2_Tc2, E3_Tc2).
The first event (E1_Tc2): This event is considered the event that formed F3 and F4 in Tc2 (Figure 11). Because U4 is the youngest unit that is truncated by both F3 and F4, and U8 is on the top of U4, the timing of E1 in Tc2 is constrained after the deposition of U4 but before the deposition of U8. F3 displaces U2 and U4 and forms a vertical displacement of up to 0.2 m. Since no samples were collected at the bottom of U8 (U8-1), we have constrained the timing of this event with the samples DF-06 in U7 and DF-13 in U4.
The second event (E2_Tc2): F1 and F2 are formed by E2_Tc2 which displaces U2, U4, U5, and possibly U8 in Tc2. U9 overlies U8, U5, and U3 at the top of the trench. U2 is the oldest stratum that was displaced by F1 and F2, indicating that E2_Tc2 occurred after the deposition of U2. U4 and U8 are only found to the east of F2, which may have been displaced by the horizontal movement of the NHF. However, E2_Tc2 must have occurred after the deposition of U3. Moreover, sedimentary sequences of the other stratum are lacking in the middle and lower U3, indicating that U3 was displaced by the left-lateral fault movement. This seismic event may have been of major magnitude and probably comprises a major horizontal strike-slip component.
F1 and F2 exhibited compressive structures, as obtained from field investigation, and the fault plane was tightly closed. Seismic fissures A and B developed in U3 and the lower part of U9. During the E2_Tc2 earthquake, F1 and F2 formed a left-lateral and left-order structure and produced tensile stress that prompted the formation of the seismic fissures A and B (Figures 11, 12A). This event occurred after the deposition of U3 and before the deposition of upper U9. Thus, the timing of E2_Tc2 can be constrained by samples DF-12 and DF-02 in U3 and DF-03 in U9.
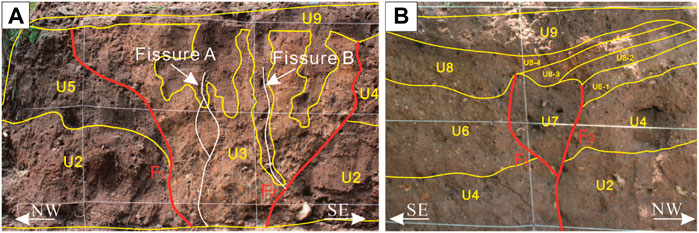
FIGURE 12. Annotated photograph of close-ups of the faults in Tc2. The yellow lines show the contact relationships of the strata. The red lines represent faults, and the white lines represent fissures. (A) (Partial) Eastern wall of the trench. (B) (Partial) Western wall of the trench.
Third event (E3_Tc2): After deposition of U8-1 to U8-3, movement on F3 and F4 caused the flexing of U8-1 and U8-3. Because the top of U8-4 is flat, its deposition must postdate the flexing of the underlying units. Thus, the earthquake occurred after the deposition of U8-3 and before the deposition of U8-4. U8-1 is very thin and sampling was impossible. Therefore, sample DF-06 in U7 was used to constrain the lower limit of these seismic events, while sample DF-08 in U8 was used to establish the upper limit. Since sample DF-07 in U8 was modern carbon which provided no paleotiming information, it was discarded for further consideration. The E3_Tc2 was recorded by consistent stratigraphic deformation on the west wall of the trench (Figure 12B).
After converting the timing of events into common age data, the timing of the three events detected in Tc2 is AD 1193–1576 for E1_Tc2 (Figure 13A), AD 1496–1790 for E2_Tc2 (Figure 13B), and AD 1520–1843 for E3_Tc2 (Figure 13C).
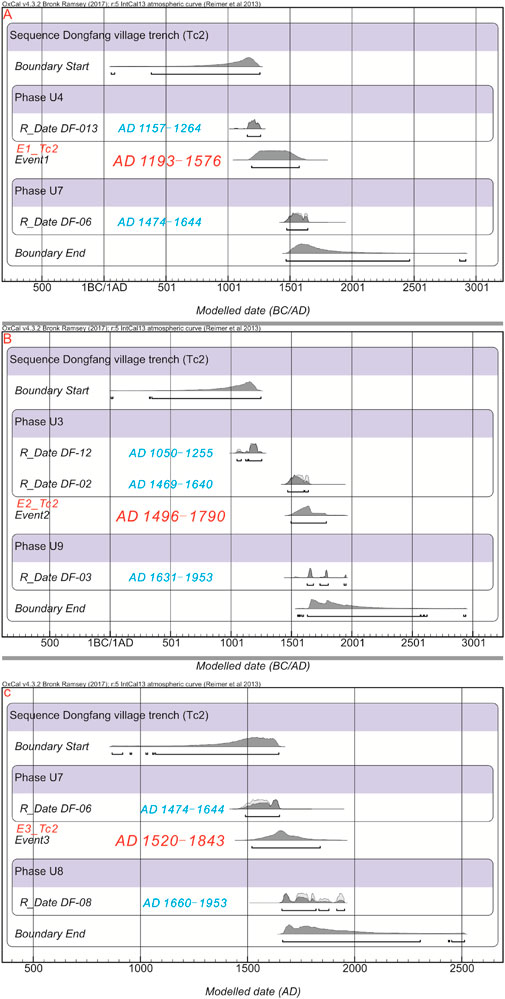
FIGURE 13. (A) The timing of paleoseismic event 1 (E1_Tc2) in Tc2 is constrained to AD 1193–1576. (B) The timing of paleoseismic event 2 (E2_Tc2) in Tc2 is constrained to AD 1496–1790. (C) The timing of paleoseismic event 3 (E3_Tc2) in Tc2 is constrained to AD 1520–1843. Probability density functions (PDFs) for the timing of events observed at Tc2 were calculated using OxCal 4.3.2 (https://c14.arch.ox.ac.uk/oxcal/OxCal.html).
4.3 Paleoseismic event analysis of the NHF
To understand the timing relationships of the paleoseismic events revealed from Tc1 and Tc2, we have projected the timing of the events on a timeline (Figure 20). Two events were identified in Tc1, which occurred between 5373–4525 BC and AD 1520–1842. Three paleoseismic events were identified in Tc2, which took place around AD 1193–1576, AD 1496–1790, and AD 1520–1843. For events with overlapping timing, we propose that these events are related to the same seismic event or they share a triggering relationship. Figure 20 documents that E2_Tc1, E2_Tc2, and E3_Tc2 occurred almost contemporaneously, and it is thus likely that the three seismic events are related to a common tectonic event. The event E2_Tc2, revealed from Tc2, widely overlaps with the age of E3_Tc2 in the same trench. Therefore, we propose that E2_Tc2 and E3_Tc2 in Tc2 record a common seismic event. However, considering the uncertainty of sample dating, the timing of this event that was identified as E2_Tc1 in Tc1 as well as E2_Tc2 and E3_Tc2 in Tc2 is roughly AD 1496–1843. Accordingly, the paleoseismic events detected in the NHF can be summarized as E1_NHF: 5373–4525 BC, E2_NHF: AD 1193–1576, and E3_NHF: AD 1496–1843 (Figure 21).
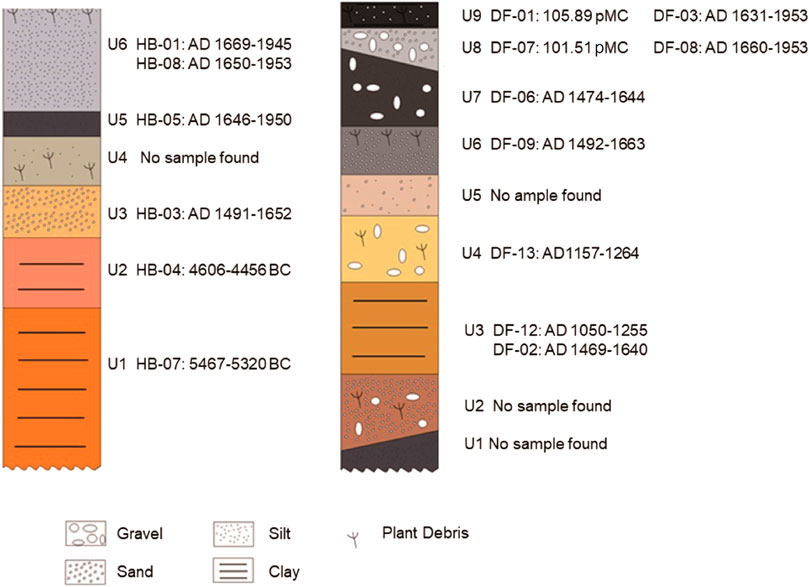
FIGURE 14. Schematic column of the units in Tc1 and Tc2. The age of the units is determined by radiocarbon samples detected within the units.
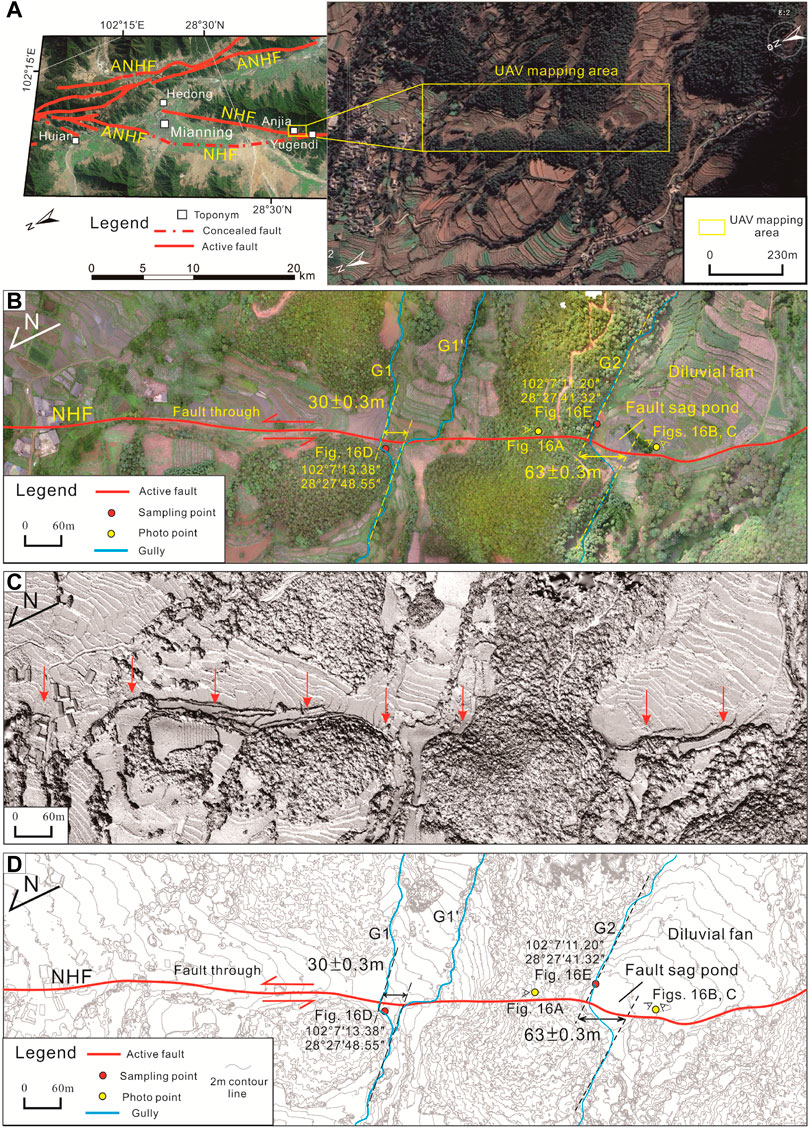
FIGURE 15. Tectonic landforms revealed by UAV mapping in the Anjia area. The position of this area is marked in Figure 2. (A) Satellite image (from Google Earth) of the UAV mapping area. (B) Landforms mapped by UAV. (C) Shaded relief map from UAV-derived DSM. (D) Interpreted map from UAV-derived contour, showing the displacement of the gullies (G1 and G2) displaced by the left-lateral displacement of NHF.
Additionally, a geological section in Yuangendi (Figure 4) shows that the most recent event on the NHF has caused surface deformation of soil and has formed a 1-m-high fault scarp. Therefore, the latest seismic event on the northern segment of the NHF may have occurred coevally with the latest event that was identified in Tc1 and Tc2. Following this model, the NHF may break through the entire fault in recent paleoseismic events.
4.4 Slip rates
4.4.1 Anjia Village site
The NHF exhibits striking linear characteristics in satellite images and aerial photographs near Anjia Village. During our on-site investigations, we detected that these faulted structures are negative landforms, such as fault trough, fault scarp, and fault sag pond (Figures 15, 16). A major fault trough formed by the NHF is 10–25 m wide and about 1.4 km long (Figures 15B, 16A). In addition, left-lateral synchronous displacement of the gullies G1 and G2 is observed. The upstream width of the G1 gully is 3–4 m, which is equivalent to the downstream width. Thus, we propose that the formation age of the upstream and downstream are equivalent. Under the headward-migrating erosion, G1 forms G1’. The gully G1 was displaced left-laterally by the fault for about 30 ± 0.3 m (Figures 15B,D). The debris sample was taken near the bottom of the trough of the G1 gully fault for 14C isotope analysis and was dated at 11,740 ± 40 BP (Figures 16A,D). The calculated left-lateral horizontal slip rate of the NHF at this position is 2.56 ± 0.03 mm/yr. Along the fault to the southwest, the NHF has displaced the diluvial fan and formed a 2.5 m high and 120 m long fault scarp (Figure 16C). A fault sag pond was developed on the south and east side of this scarp (Figure 16B). The gully G2 was displaced left-laterally for about 63 m ± 0.3 m (Figures 15B,D). A debris sample was collected for 14C isotope analysis near the bottom of the fault sag pond and yielded an age of 26,660 ± 110 BP (Figures 16B, E). Thus, based on the calculations, the slip rate of the NHF is 2.40 ± 0.01 mm/yr. Consequently, the horizontal slip rate of the NHF since the late Late Pleistocene obtained near Anjia Village is 2.40–2.56 mm/yr.
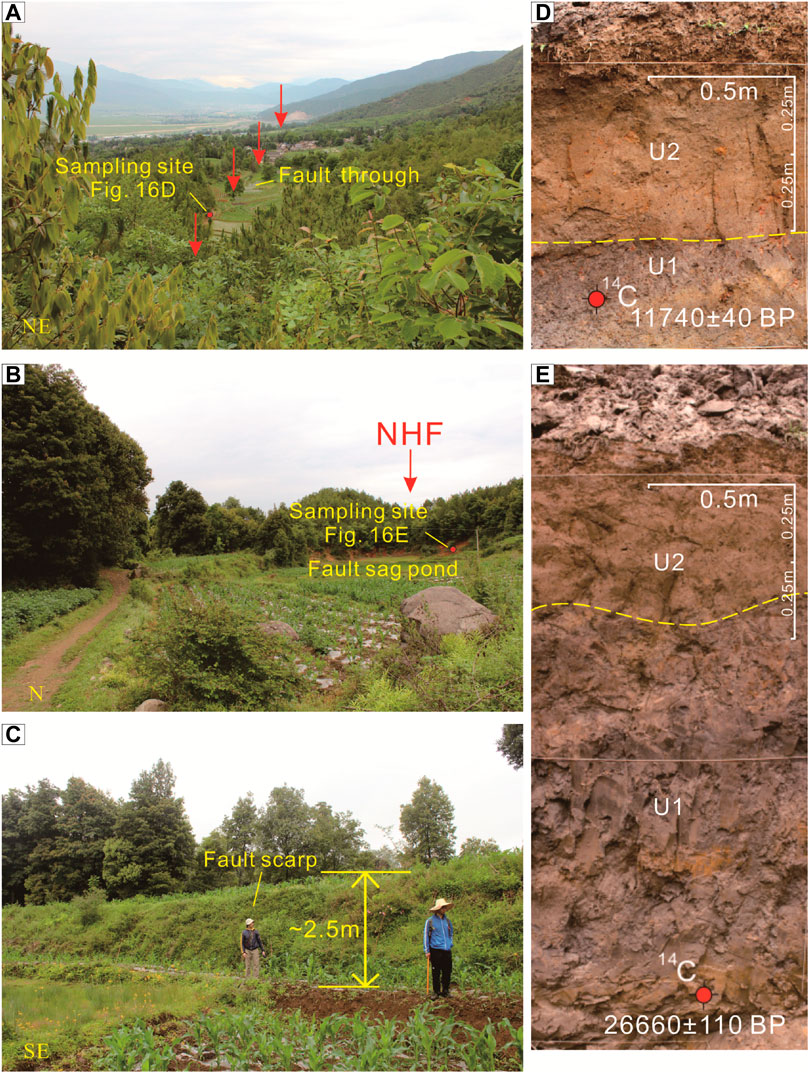
FIGURE 16. (A) Field photograph of the fault trough with red dots showing the sampling locations. (B) Field photograph of the fault sag pond; red dots show the sampling locations. (C) Field photograph of the fault scarp. (D), (E) Field photographs of the locations and ages of the radiocarbon samples, respectively, (see Figures 15B,D) for the specific sampling locations. U2 represents the humus layer, U1 represents mucky soil, and the yellow dotted line indicates the stratigraphic boundary.
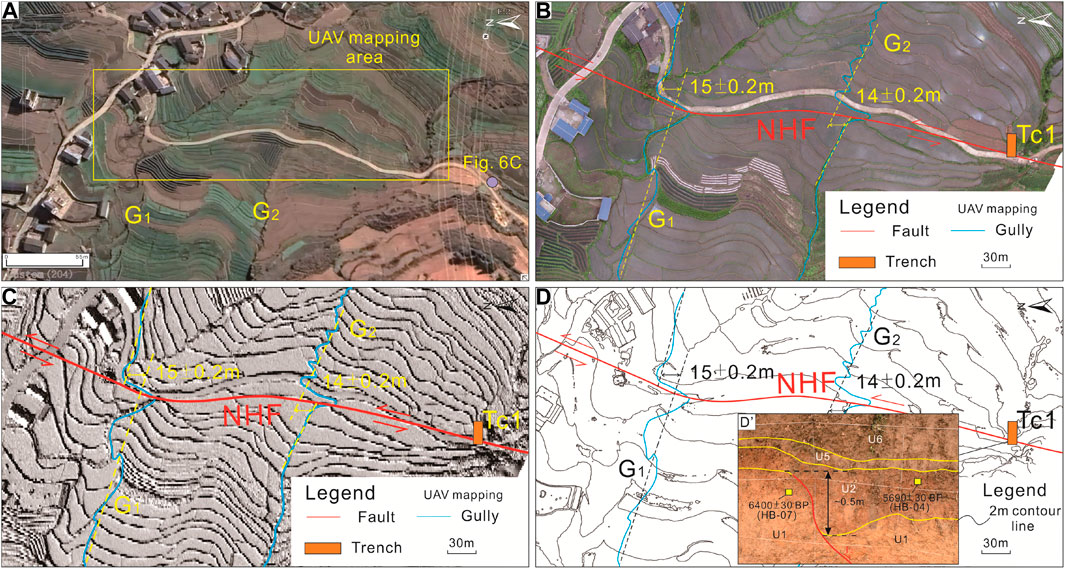
FIGURE 17. Tectonic landforms revealed by UAV mapping around Hebian Township. The location of this area is marked in Figure 2. (A) Satellite image of the UAV mapping area from Google Earth. The purple dot shows the location of the geological section in Figure 6C. (B) Landforms mapped by UAV, showing the location of displacement and Tc1. (C) Shaded relief map from UAV-derived DSM. (D) Interpreted map, illustrating the displacement of the gullies G1 and G2 caused by NHF left-lateral movement, and trench location. (D’) Simplified map showing the displacement revealed from Tc1.
4.4.2 Hebian Township site
On the diluvial fan to the north of Hebian Township, the fault synchronously displaced the two gullies G1 and G2. The left-lateral displacements of G1 and G2 are 15 ± 0.2 m and 14 ± 0.2 m, respectively (Figure 17). Because no chronological samples were collected around the river, we used the timing of sample HB-4 after excluding the interference of the surface humus layer in Tc1 as the upper limit of the timing for the diluvial fan. The sample in Tc1 was collected on the south side of gully G1 and stemmed from the same geomorphic surface as the diluvial fan.
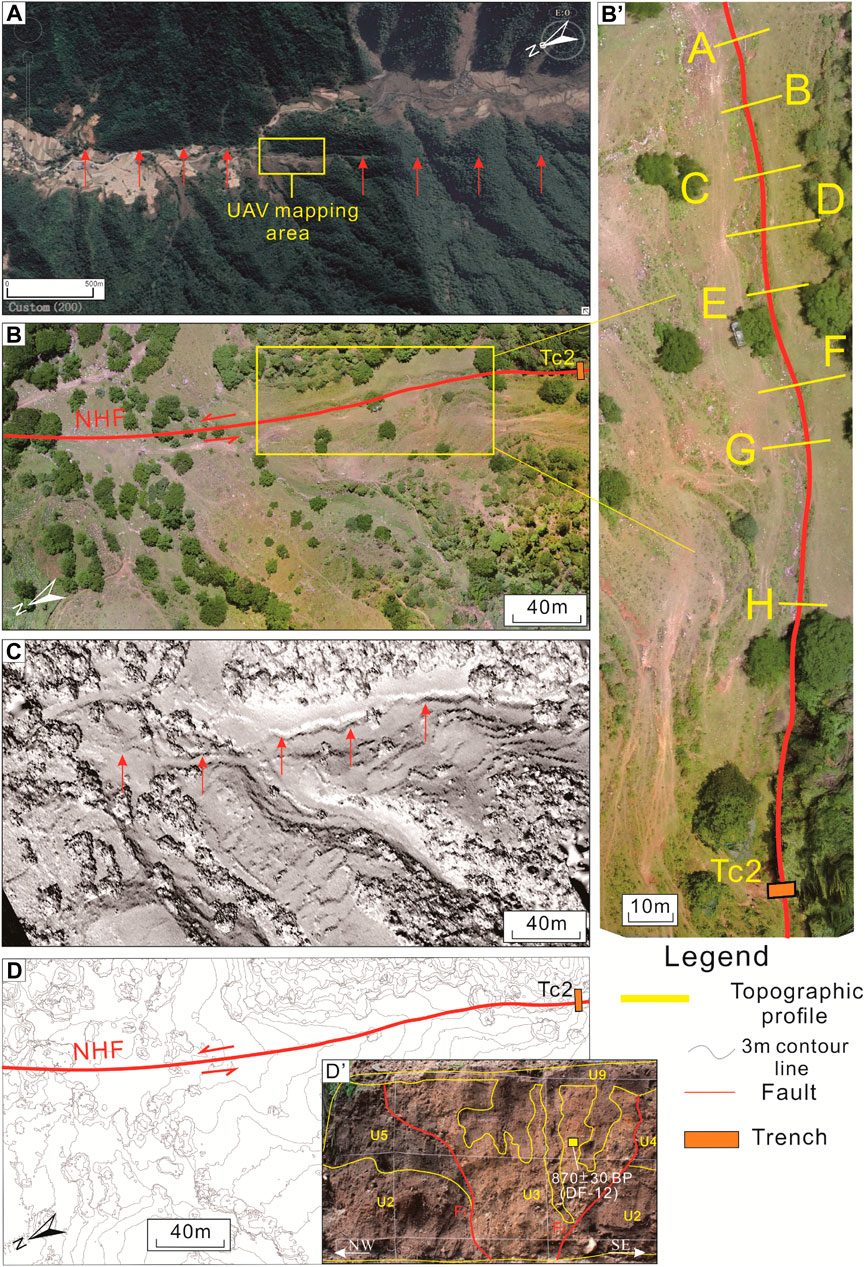
FIGURE 18. Tectonic landforms mapped by UAV around Dongfang Village. The location of this area is marked in Figure 2. (A) Satellite image of the UAV mapping area from Google Earth. (B) Landforms mapped by UAV. (B’) Locally enlarged landforms mapped by UAV of (B). Yellow lines in (B’) show the location of terrain sections from Figure 19. (C) Shaded relief map (from UAV-derived DSM). (D) Interpreted map (from UAV-derived contour), representing terrain sections. (D’) Sample in the Tc2.
F2 in Tc1 displaces U1 vertically by about 50 cm (Figures 7B, 8B, 17D′). The timing of F2 was constrained by the carbon sample in U1 (HB-07: 6400 ± 30 BP) and U2 (HB-04: 5690 ± 30 BP). Thus, the left-lateral horizontal slip rates of the NHF near Hebian Township are calculated as 2.60 ± 0.09 mm/yr and 2.50 ± 0.09 mm/yr. The vertical slip rate of the NHF in Hebian can be approximated by the time that forms the vertical slip and the magnitude of the slip. By dividing the amount of slip by the time required for the formation of this slip, a vertical slip rate of 0.09–0.08 mm/yr, approximately about 0.10 mm/yr. Therefore, the late Holocene horizontal slip rate of the NHF near Hebian Township is 2.50–2.60 mm/yr, and the vertical slip rate is about 0.10 mm/yr.
4.4.3 Dongfang Village site
Near Dongfang Village, the NHF passes through the first-level terrace (T1) of gullies that spreads out SW-NE. The height of the terraces from the gully surface is about 1–2 m. We conducted UAV mapping (Figure 18) and took eight topographic profiles perpendicular to the fault to estimate the height differences between the two sides of the terraces. The height difference represents the vertical displacement of the fault and is in the range of 0.5–1.5 m (Figure 19), with an average value of 0.9 m. The data document a significant vertical component of the fault displacement.
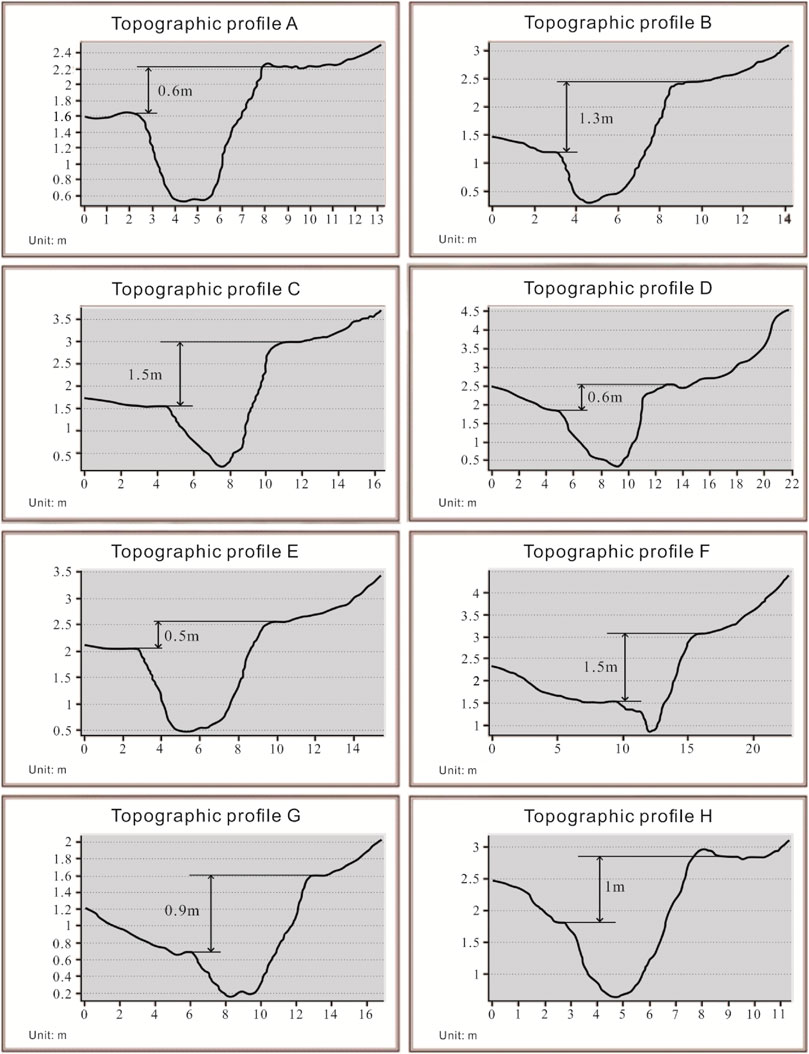
FIGURE 19. Profiles from Figures 18B, B’. Eight topographic profiles represent height differences in the range of 0.5–1.5 m between two sides of the terraces near the north of Tc2.
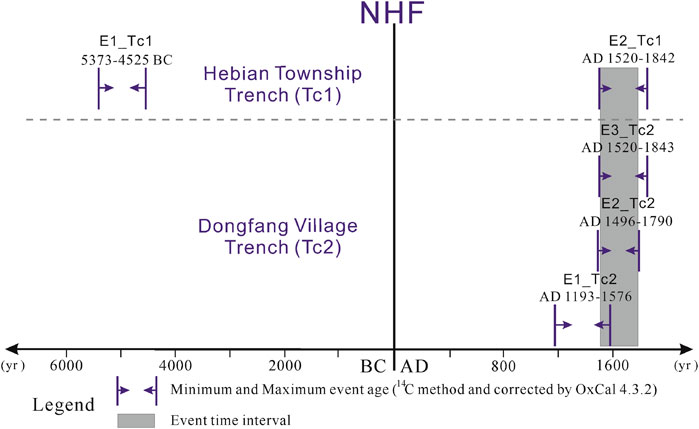
FIGURE 20. Timeline of the events constrained at Tc1 and Tc2 on the NHF.
By using the original 870 ± 30 BP age of the sample DF-12 in Tc2, after excluding the interference of the surface humus layer, as the age of the top of the terrace (T1), and the average vertical height, the late Holocene vertical component of the slip rate in Dongfang Village for NHF is calculated as 1.00 ± 0.04 mm/yr.
Combined with the vertical slip rate obtained in Hebian Township, which is 0.1 mm/yr, the vertical slip rate of the NHF is between 0.1 and 1.0 mm/yr, with an average of 0.60 mm/yr. Based on our calculations, the horizontal slip rate of the NHF since the late Holocene is 2.50–2.60 mm/yr. Consequently, the ratio of the horizontal slip rate to the vertical slip rate is about 4:1, which is generally consistent with the ratio of fault motion components revealed by fault striations.
Based on the integrated analysis of the aforementioned data, the horizontal slip rate of the NHF since the late Late Pleistocene is 2.40–2.56 mm/yr, the horizontal slip rate of the NHF since the late Holocene is 2.50–2.60 mm/yr, and the late Holocene vertical slip rate is about 0.60 mm/yr.
4.5 The calculation for further hazards
According to satellite imagery interpretations and field investigation, the length of the NHF is approximately 70 km. Based on published equations (Bonilla et al., 1984; Deng et al., 1992; Wells and Coppersmith, 1994; Wen, 1995), the maximum earthquake magnitudes potentially induced by the NHF are 7.33 ± 0.19, 7.23 ± 0.29, 7.58 ± 0.21, and 7.54 ± 0.37, in M scale, with an average of M 7.4 ± 0.1. Based on the equation from Wells and Coppersmith (1994), the maximum magnitude of a triggered earthquake on the NHF is M 7.5 ± 0.2.
Based on the published equations (Deng et al., 1992; Wells and Coppersmith, 1994; Wen, 1995), the average maximum horizontal fault displacements of NHF are calculated by three empirical formulae. The calculated value of 3.55 ± 1.38 m resembles the value of left-lateral displacement of the diluvial fan (3.6 ± 0.2 m) that was obtained on the NHF (Figure 3E). Therefore, combined with the co-seismic displacements obtained on other faults in Table 2, we believe that the displacement of 3.6 ± 0.2 m revealed in the NHF represents the surface displacement caused by the latest seismic event.
5 Discussion
5.1 Relationship between the ANHF and NHF
Three paleoseismic events affected the Zimakua–Yejidong area on the northern segment of the ANHF (Wen et al., 2000a; Ran et al., 2008a). The three events occurred at approximately 280–550 BP, 1030–1050 BP, and 1634–1811 BP. On the northern segment of the ANHF, trench analysis at Dahaizi–Ganhaizi revealed four paleoseismic events (Ran et al., 2008a), which occurred at 50–1310 BP, 1768–1826 BP, 2755–4018 BP, and 4108–6593 BP.
After conversion into BC and AD, the paleoseismic events revealed by Wen et al. (2000a) and Ran et al. (2008a) on the Zimakua–Yejidong are AD 23–511 for E1, AD 785–1053 for E2, and AD 1335–1627 for E3. The paleoseismic events in the Dahaizi–Ganhaizi area are 4597–2204 BC for E1, 2131–816 BC for E2, AD 62–290 for E3, and AD 557–1827 for E4 (Figure 21). Trench analysis of the Dahaizi–Ganhaizi on the ANHF reveals that the time of the seismic event E4 is closer to AD 1800 (Ran et al., 2008a). In Figure 21, the events on the NHF are compared with events on the different segments of the ANHF in a common plot. A well-defined overlap of the timing of two events suggests a common event or a triggering relationship.
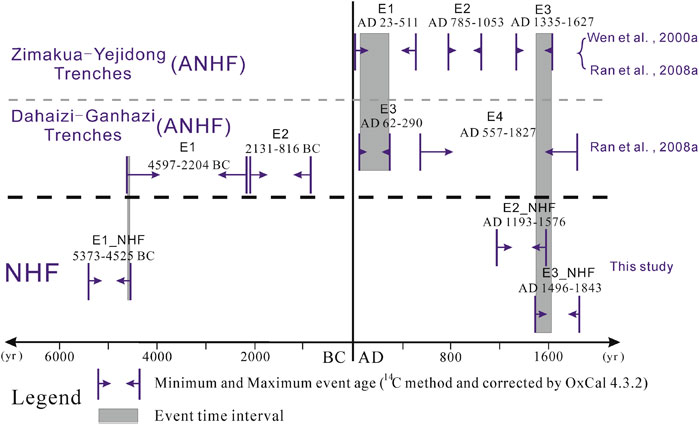
FIGURE 21. Timeline of events detected in the trenches along the NHF and ANHF. The data used in each of the studies were calibrated using OxCal 4.3.2.
Figure 21 illustrates that E3_NHF on the NHF partially overlaps with E3 (revealed in the Zimakua–Yejidong area) and E4 (revealed in the Dahaizi–Ganhaizi area) of the ANHF. Thus, at least two possible correlations between the three earthquakes of the NHF and ANHF exist. 1) In the first model the earthquake on the ANHF triggered the earthquake on the NHF, or the earthquake on the NHF triggered the earthquake on the ANHF. However, because the NHF is a secondary fault, it is more likely that earthquakes on the ANHF triggered that on the NHF. 2) In the second model E3 (AD 1335–1627) on the ANHF in the Zimakua–Yejidong area and the E4 (AD 557–1827) in the Dahaizi–Ganhaizi area ruptured with E3_NHF (AD 1496–1843) of the NHF. This co-rupture would imply that these events have occurred during the same earthquake, and thus the ANHF and NHF could represent a cascade rupture.
Based on our field investigation and paleoseismic analysis, we propose that during the E3_NHF of the NHF, surface rupture may have broken through the entire NHF which may make the ANHF and NHF both in the same seismic events. Therefore, the timing of the triggering or cascade rupture between the ANHF and the NHF may have happened between AD 1496–1627.
The NHF connects with the ANHF in the north of Mianning (Figures 1, 2). The connecting geometry between ANHF and NHF shows a “y” shape. Therefore, the NHF and ANHF also provide geological preconditions for the occurrence of triggered or cascade earthquakes.
The 2002 Denali Mw7.9 in the United States (Eberhart-Phillips et al., 2003) is a comparable example of the triggering effect. The earthquake started with a thrusting event on the Susitna Glacier Fault (SGF) and subsequently proceeded with a right-slip movement on the Denali Fault (DF), but the surface ruptures to the south do not extend along the DF. Then, the surface ruptures took a right step and continued with the right-slip movement on the Totschunda Fault (TF) (Eberhart-Phillips et al., 2003). During the earthquake, the SGF generated 48 km, the DF induced 218 km, and the TF formed 76 km of surface rupture (Eberhart-Phillips et al., 2003; Crone et al., 2004). The TF which is situated to the south of the DF also forms a “y”-shaped connection with the DF. On the medium-sized or secondary fault that forms a “y”-shaped connection with the main fault, cascade rupture or trigger earthquakes on the secondary faults are likely by the surface rupture of the main fault.
Thus, according to our paleoseismic analysis, the NHF can generate self-contained earthquakes and can also induce cascade rupture or trigger earthquakes with the ANHF. The timing of their triggering or cascade rupture events is dated AD 1496–1627.
5.2 Tectonic implication between the NHF and ANHF
5.2.1 Kinematic relationship between NHF and ANHF
Our remote sensing studies and field investigations indicate that the NHF is dominated by left-lateral strike-slip movement, which is consistent with the movement of the ANHF. In a previous study, a value of 3.0 ± 0.3 m has been reported for the fault displacements discovered in the north of the Yejidong (Wen et al., 2000a). A value of 2.7 m has been published for the horizontal displacement of the latest seismic event that is detected around Zimakua (Wen et al., 2000a; Ran et al., 2008a; Ran et al., 2008b). The horizontal displacement of the latest seismic event on the NHF, which we have recognized to the south of Yuangendi, is estimated as 3.6 ± 0.2 m. This value is roughly equivalent to the displacement in the ANHF. The ratio of horizontal to vertical displacement that is recorded by the striations on the NHF fault surface is about 3:1–5:1, which is equivalent to the displacement ratio of the ANHF reported in previous studies (Wen et al., 2000a; Ran et al., 2008a; Ran et al., 2008b).
5.2.2 Kinematic relationship in the eastern boundary of SYB
To understand the kinematic characteristics of the faults along the eastern margin of the SYB, we used the slip rate of faults during the same period (the late Holocene) and combined the GPS data to analyze the potential kinematic relationship between these faults.
The late Holocene left-lateral slip rate of the XSHF is about 9.40 ± 1.70 mm/yr (Wen et al., 2001). In the Shimian area, one part of the fault slip rate is transferred to the ANHF, and another part is decomposed by the DLSF. Since the late Holocene, the horizontal slip rate of the decomposition of the DLSF is 3.00–4.00 mm/yr and 3.10 mm/yr in the southern segment (He and Oguchi, 2008; Wei et al., 2012; Sun et al., 2015). Based on GPS data, the left-lateral strike-slip of both the ANHF and DLSF is about 4.00 ± 2.00 mm/yr (Shen et al., 2005). Based on calculations from the block model, the overall left-lateral strike-slip of the ANHF is about 5.10 ± 2.50 mm/yr (Wang et al., 2008). Ran et al. (2008a) and Ran et al. (2008b) obtained a left-lateral strike-slip of 6.20 mm/yr since the late Holocene on the northern segment of the ANHF from the displacement of the water system. Thus, the slip rates from the GPS data and that obtained on the northern of the ANHF in the late Holocene are broadly the same. The sum of the slip rates of the northern ANHF (6.20 mm/yr) and DLSF (3.00–4.00 mm/yr) is almost the same as the slip rate of the XSHF (9.40 ± 1.70 mm/yr). This indicates that the decomposition of the slip rates is concentrated along the block boundary, whereas the amount of plastic deformation within the block is relatively small.
Shear slip continues to extend southward along the ZMHF with a rate of 2.40–3.60 mm/yr (Wang, 2012; Wang et al., 2013; Wang et al., 2017), with an average value of 3.00 mm/yr. The left-lateral strike-slip of the ANHF is about 2.8 ± 2.5 mm/yr, which is roughly equivalent to that obtained by the block model calculation (Wang et al., 2008). The question remains, how the loss of the slip rate of about 3.00–4.00 mm/yr since the late Holocene in the ANHF and ZMHF can be explained? The slip rate of the NHF is about 2.50–2.60 mm/yr, and the average left-lateral strike-slip rate on the southern segment of the ANHF in Dashuigou in the past 3,300 years is about 4.40 mm/yr (Wang et al., 2018). The data confirm that the NHF decomposed the slip rate of the northern segment of the ANHF. By comparing the kinematic relationship in the eastern boundary faults of the SYB, we propose that the NHF participates in strain partitioning along the boundary. This conclusion reasonably explains the loss of the sliding rate between the ANHF and ZMHF, which also supports the GPS inversion results and the discontinuous deformation model of the eastern edge of the Tibetan Plateau (Figure 22).
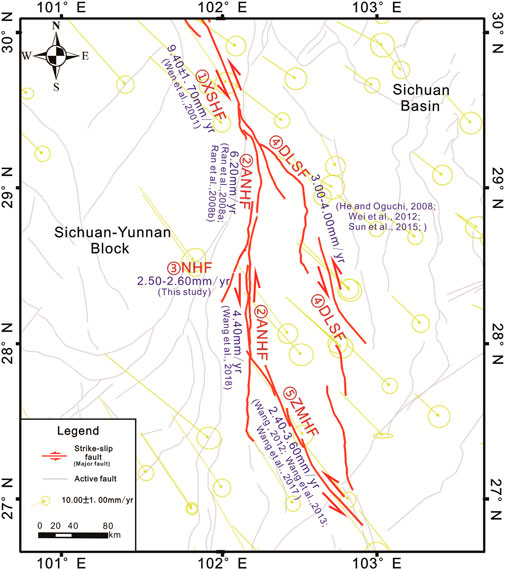
FIGURE 22. Slip rates of the major faults and at the eastern boundary of the Sichuan–Yunnan Block. Yellow arrows show GPS velocities (partial) of crustal motion of the southeastern Tibetan Plateau relative to Eurasia (Gan et al., 2007; Liang et al., 2013). ①XSHF, Xianshuihe Fault; ②ANHF, Anninghe Fault; ③NHF, Nanhe Fault; ④DLSF, Daliangshan Fault; ⑤ZMHF, Zemuhe Fault.
By comparing the structural characteristics, paleoseismic relationship, movement property, slip rate, and other seismic and geological elements of the NHF and ANHF, we re-interpret the NHF to be a part of the ANHF. The NHF represents a branch fault of ANHF that is connected to the northern segment of the ANHF near Mianning. Thus, to determine the seismic hazard in the Mianning area and to understand the crustal deformation mechanism of the southeastern Tibetan Plateau, the fault behavior of the ANHF and NHF should be analyzed as an entity.
6 Conclusion
Based on detailed satellite imagery interpretation, we conducted a field survey, high-resolution measurements of offset geomorphic features, and trench excavations on the Nanhe Fault to understand its tectonic activity. We demonstrated that the Nanhe Fault is active in the Holocene. The left-lateral strike-slip rate of the Nanhe Fault since the late Late Pleistocene is 2.40–2.56 mm/yr, the left-lateral strike-slip rate since the late Holocene is 2.50–2.60 mm/yr, and the late Holocene vertical slip rate is about 0.60 mm/yr. Based on our paleoseismic investigations and analysis in the Nanhe Fault and Anninghe Fault, we identified three paleoseismic events (5373−4525 BC, AD 1193–1576, AD 1496–1843) on the Nanhe Fault. Our analysis suggested that the Anninghe and Nanhe faults may have produced cascade rupture or triggered earthquakes, and such related events probably occurred between 1496–1627. We calculated that the maximum magnitude of a triggered earthquake in the Nanhe Fault is about M 7.5. By comparing the kinematic relationship in the eastern boundary faults of the Sichuan–Yunnan Block, we proposed that the Nanhe Fault participates in strain partitioning along the boundary. This conclusion reasonably explains the loss of the sliding rate between the Anninghe Fault and Zemuhe Fault, which also supports the GPS inversion results and the discontinuous deformation model of the eastern edge of the Tibetan Plateau.
Overall, by comparing the geometric structure, paleoseismic relationship, movement property, slip rate, and other seismic geological elements of the Nanhe Fault and Anninghe Fault, we re-interpret the Nanhe Fault as a part of the ANHF and as a branch fault of the Anninghe Fault in the Mianning area.
Data availability statement
The original contributions presented in the study are included in the article/supplementary material; further inquiries can be directed to the corresponding author.
Author contributions
CM contributed to all sections. YL contributed to field work, thesis conception and manuscript writing instruction. LA contributed to data compiling and processing. WZ and SL contributed to trench investigation and data sampling. XY contributed to seismic risk analysis and calculation.
Funding
This study was supported by the Spark Program of Earthquake Sciences (Grant Nos XH18039Y and XH20050Y) and the Earthquake Science and Technology Special Project of the Sichuan Earthquake Agency (Grant Nos LY2205 and LY2206). This work was also supported by the Sichuan Province Key R&D Program Project Research on the Structural Basis and Risk Assessment of Earthquake Pregnancy in Southern Sichuan (Grant No. 2020YFS0451) and the Research on Seismogenic Structure, Earthquake Disaster Risk Prevention and Earthquake Monitoring Network Layout Plan in Southern Sichuan.
Acknowledgments
The authors are very grateful to Wang Hu from Southwest Jiaotong University of China for detailed and constructive suggestions on the manuscript. The authors are grateful to the editor and three reviewers for their detailed suggestions and comments, which have significantly improved the quality of the manuscript.
Conflict of interest
The authors declare that the research was conducted in the absence of any commercial or financial relationships that could be construed as a potential conflict of interest.
Publisher’s note
All claims expressed in this article are solely those of the authors and do not necessarily represent those of their affiliated organizations, or those of the publisher, the editors, and the reviewers. Any product that may be evaluated in this article, or claim that may be made by its manufacturer, is not guaranteed or endorsed by the publisher.
References
Aitchison, J. C., Ali, J. R., and Davis, A. M. (2007). When and where did India and Asia collide? J. Geophys. Res. 112 (B5), B05423. doi:10.1029/2006jb004706
Allen, C. R., Luo, Z. L., Qian, H., Wen, X. Z., Zhou, H. W., and H, W. S. (1991). Field study of a highly active fault zone: The Xianshuihe fault of southwestern China. Geol. Soc. Am. Bull. 103 (9), 1178–1199. doi:10.1130/0016-606(1991)103<1178:FSOAHA>2.3.CO;2
Bonilla, M. G., Mark, R. K., and Lienkaemper, J. J. (1984). Statistical relations among earthquake magnitude, surface rupture length, and surface fault displacement. Bull. Seis. Soc. Am. 74, 2379–2411.
Bronk Ramsey, C. (2009). Bayesian analysis of radiocarbon dates. Radiocarbon 51 (01), 337–360. doi:10.1017/s0033822200033865
Chen, G., Min, W., Song, F., Jiao, D., and Xu, H. (2011). Preservation of Co-seismic surface rupture in different geomorphological settings from the study of the 1786 Moxi earthquake. Seismol. Geol. 33 (4), 804–817. doi:10.3969/j.issn.0253-4967.2011.04.006·
Clark, M. K., Bush, J. W. M., and Royden, L. H. (2005). Dynamic topography produced by lower crustal flow against rheological strength heterogeneities bordering the Tibetan Plateau. Geophys. J. Int. 162 (2), 575–590. doi:10.1111/j.1365-246X.2005.02580.x
Crone, A. J., Personius, S. F., Craw, P. A., Haeussler, P. J., and Staft, L. A. (2004). The Susitna Glacier thrust fault: Characteristics of surface ruptures on the fault that initiated the 2002 Denali fault earthquake. Bull. Seismol. Soc. Am. 94 (6B), S5–S22. doi:10.1785/0120040619
Deng, Q. D., Yu, G. H., and Ye, W. H. (1992). Relationship between earthquake magnitude and parameters of surface ruptures associated with historical earthquakes Research on Active Fault (2). Beijing: Seismological Press, 247–264. (in Chinese).
Deng, Q. D. (1980). The main characteristics of Cenozoic fault block structures in China. Beijing: Geological Press, 101–108. (in Chinese).
Ding, G. Y. (1991). Introduction to lithospheric dynamics in China. Beijing: Seismological Press, 1–49. (in Chinese).
Du, P. S. (2000). Slip displacement and its rate along Zemuhe fault. Earthq. Res. Sichuan 1, 49–64. doi:10.3969/j.issn.1001-8115.2000.02.004
Eberhart-Phillips, D., Haeussler, P. J., Freymueller, J. T., Frankel, A. D., Rubin, C. M., Craw, P., et al. (2003). The 2002 Denali Fault earthquake, Alaska: A large magnitude, slip-partitioned event. Science 300 (5622), 1113–1118. doi:10.1126/science.1082703
Feng, Y., and Du, P. (2000). Geologic tectonic and earthquake preparation conditions about the 1850 Xichang earthquake. Earthq. Res. Sichuan 2000 (1), 97–101. doi:10.3969/j.issn.1001-8115.2000.02.007
Gan, W., Zhang, P., Shen, Z., Niu, Z., Wang, M., Wang, Y., et al. (2007). Present-day crustal motion within the Tibetan Plateau inferred from GPS measurements. J. Geophys. Research-Solid Earth 112 (B8), B08416–B08596. doi:10.1029/2005jb004120
Gao, S. P. (2021). “Late Quaternary paleoseismology and faulting behavior of the internal and Western boundary faults of Northwest Sichuan Subblock,” (China: Institute of Geology). Ph.D. thesis.
Gao, W., He, H., Sun, H., and Wei, Z. (2016). Paleoearthquakes along Puxiong fault of daliangshan Fault Zone during late quaternary. Seismol. Geol. 38 (4), 797–816. doi:10.3969/j.issn.0253-4967.2016.04.001
He, H., and Oguchi, T. (2008). Late Quaternary activity of the Zemuhe and Xiaojiang faults in southwest China from geomorphological mapping. Geomorphology 96 (1-2), 62–85. doi:10.1016/j.geomorph.2007.07.009
He, H., and Ren, J. W. (2003). Holocene earthquakes on the Zemuhe Fault in southwestern China. Ann. Geophys. 46 (5), 1035–1051. doi:10.4401/ag-3444
Huang, Z., and Tang, R. (1983). The Zemuhe fault and earthquake. J. Seismol. Res. 1983 (02), 167–177.
Keller, E. A., and Pinter, N. (2002). Active tectonics: Earthquakes, uplift, and landscape. New Jersey, U.S: Prentice Hall.
Kirby, E., Reiners, P. W., Krol, M. A., Whipple, K. X., Hodges, K. V., Farley, K. A., et al. (2002). Late Cenozoic evolution of the eastern margin of the Tibetan Plateau: Inferences from 40 Ar/39 Ar and (U-Th)/He thermochronology. Tectonics 21 (1), 1-1–1-20. doi:10.1029/2000tc001246
Li, T. S., Du, Q. F., and Yang, Z. L. (1997). The active Xianshuihe Fault and seismic risk assessment. Chengdu: Chengdu Cartographic Publishing House. (in Chinese).
Liang, S. M., Gan, W. J., Shen, C. Z., Xiao, G. R., Liu, J., Chen, W. T., et al. (2013). Three-dimensional velocity field of present-day crustal motion of the Tibetan Plateau derived from GPS measurements. J. Geophys. Res. Solid Earth 118 (10), 5722–5732. doi:10.1002/2013jb010503
Molnar, P., and Qidong, D. (1984). Faulting associated with large earthquakes and the average rate of deformation in central and eastern Asia. Geophys. Res. 89, 6203–6227. doi:10.1029/jb089ib07p06203
Peltzer, G., Tapponnier, P., Gaudemer, Y., Meyer, B., Guo, S., Yin, K., et al. (1988). Offsets of late Quaternary morphology, rate of slip, and recurrence of large earthquakes on the Chang Ma fault (Gansu, China). J. Geophys. Res. 93 (B7), 7793–7812. doi:10.1029/jb093ib07p07793
Qian, H. C., Allen, R., Luo, Z. L., Wen, X. Z., Zhou, H. Y., and Huang, W. X. (1988). The active characteristics of the Xianshuihe fault in the Holocene. Earthq. Res. China 02, 11–20.
Ran, Y., Chen, L., Cheng, J., and Gong, H. (2008a). Late Quaternary surface deformation and rupture behavior of strong earthquake on the segment north of Mianning of the Anninghe fault. Sci. China Ser. D Earth Sci. 51 (9), 1224–1237. doi:10.1007/s11430-008-0104-6
Ran, Y., Chen, L., Cheng, J., and Gong, H. (2008b). New evidence of paleoearthquakes and date of the latest event on the Xiaoxiangling Mountain segment of the Anninghe fault zone. Seismol. Geol. 22 (1), 1–8. doi:10.3969/j.issn.0253-4967.2008.01.006
Reimer, P., Austin, W., Bard, E., Bayliss, A., Blackwell, P., Bronk Ramsey, C., et al. (2020). The IntCal20 Northern Hemisphere radiocarbon age calibration curve (0-55 cal kBP). Radiocarbon 62 (4), 725–757. doi:10.1017/RDC.2020.41
Ren, J. (1994). Late quaternary displacement and slip rate of Zemuhe Fault In sichuan, China. Seismol. Geol. 16 (2), 146.
Ren, J., and Li, P. (1993). The characters of surface faulting of the 1850 earthquake in Xichang, Sichuan. Seismol. Geol. 15 (2), 97–106.
Ren, Z. K., Lin, A. M., and Rao, G. (2010). Late pleistocene-holocene activity of the Zemuhe Fault on the southeastern margin of the Tibetan plateau. Tectonophysics 495, 324–336. doi:10.1016/j.tecto.2010.09.039
Shen, Z. K., Lü, J. N., Wang, M., and Bürgmann, R. (2005). Contemporary crustal deformation around the southeast borderland of the Tibetan Plateau. J. Geophys. Res. 110 (B11409). doi:10.1029/2004JB003421
Song, F., Li, R., and Xu, X. (2002). Preliminary results of the investigation of paleo-earthquakes along the daliangshan Fault Zone, sichuan Province, China. Seismol. Geol. 24 (1), 27–34. doi:10.3969/j.issn.0253-4967.2002.01.003
Sun, H. Y., He, H. L., Ikeda, Y., Wei, Z. Y., Chen, C. Y., Xu, Y. R., et al. (2019). Paleoearthquake history along the southern segment of the Daliangshan fault zone in the southeastern Tibetan Plateau. Tectonics 38, 2208–2231. doi:10.1029/2018tc005009
Sun, H. Y., He, H. L., Wei, Z. Y., Shi, F., and Gao, W. (2015). The late Quaternary activity of Zhuma fault on the north segment of the Daliangshan fault zone. Seismol. Geol. 37 (02), 440–454. doi:10.3969/j.issn.0253-4967.2015.02.008
Tapponnier, P., Peltzer, G., Le Dain, A. Y., Armijo, R., and Cobbold, P. (1982). Propagating extrusion tectonics in Asia: New insights from simple experiments with plasticine. Geology 10 (12), 611–616. doi:10.1130/0091-7613(1982)10<611:petian>2.0.co;2
Tapponnier, P., Zhiqin, X., Roger, F., Meyer, B., Arnaud, N., Wittlinger, G., et al. (2001). Oblique stepwise rise and growth of the tibet plateau. Science 294 (5547), 1671–1677. doi:10.1126/science.105978
Tapponnier, P., Peltzer, G., and Armijo, R.(1986) On the mechanics of the collision between India and Asia. In M. P. Coward, and A. C. Ries (Eds.) Collision tectonics. London: Special Publication Geological Society, 115–157.
Tian, Q., Ren, Z. K., and Zhang, J. L. (2008). Study of paleoearthquakes by combined trench on Zemuhe fault around Daqingliangzi Xichang, Sichuan. Seismol. Geol. 30 (2), 400–411. doi:10.3969/j.issn.0253-4967.2008.02.006
Wan, X. Q., Jansa, L. F., and Sarti, M. (2002). Cretaceous and Paleogene boundary strata in southern Tibet and their implication for the India-Eur-Asia collision. Lethaia 35 (2), 131–146. doi:10.1111/j.1502-3931.2002.tb00074.x
Wang, H., Ran, Y., Chen, L., and Li, Y. (2017). Paleoearthquakes on the Anninghe and Zemuhe fault along the southeastern margin of the Tibetan Plateau and implications for fault rupture behavior at fault bends on strike-slip faults. Tectonophysics 721, 167–178. doi:10.1016/j.tecto.2017.08.030
Wang, H., Ran, Y., Chen, L., Liang, M., Gao, S., Li, Y., et al. (2018). Determination of slip rate on the southern segment of the Anninghe fault. Seismol. Geol. 40 (5), 967–979. doi:10.3969/j.issn.0253-4967.2018.05.002
Wang, H., Ran, Y. K., and Li, Y. B. (2011). Growth of a small pull-apart basin and slip rate of strike-slip fault: With the example of the Zemuhe fault on the southeastern margin of the Tibetan Plateau. Seismol. Geol. 33 (4), 818–827. doi:10.3969/j.issn.0253-4967.2011.04.007
Wang, H., Ran, Y., Li, Y., and Chen, L. (2014). Paleoseismic behavior of the Anninghe fault and its comparison with the Zemuhe fault in Western Sichuan. Seismol. Geol. 36 (3), 706–717. doi:10.3969/j.issn.0253-4967.2014.03.013
Wang, H., Ran, Y., Li, Y., Gomez, F., and Chen, L. (2013). Holocene palaeoseismologic record of earthquakes on the Zemuhe fault on the southeastern margin of the Tibetan Plateau. Geophys. J. Int. 193 (1), 11–28. doi:10.1093/gji/ggs095
Wang, H. (2012). “Recurrence behavior and interactions of large earthquakes on the Anninghe Fault and Zemuhe Fault along the eastern margin of the sichuan-yunnan faulted block,” (China: Institute of Geology). Ph.D. thesis.
Wang, M., and Shen, Z. K. (2020). Present day crustal deformation of continental China derived from GPS and its tectonic implications. J. Geophys. Res. Solid Earth 125, e2019JB018774. doi:10.1029/2019JB018774
Wang, Q., Zhang, P. Z., Freymueller, J. T., Bilham, R., Larson, K. M., Lai, X., et al. (2001). Present-day crustal deformation in China constrained by global positioning system measurements. Science 294 (5542), 574–577. doi:10.1126/science.1063647
Wang, Y. Z., Wang, E. N., Shen, Z. K., Wang, M., Gan, W. J., Qiao, X. J., et al. (2008). GPS-constrained inversion of present-day slip rates along major faults of the Sichuan-Yunnan region, China.Scientia Sin. (Terrae) 38(5), 582–597. doi:10.3321/j.issn:1006-9267.2008.05.006
Wei, Z. Y., He, H. L., Shi, F., Xu, Y. R., Bi, L. S., and Sun, H. Y. (2012). Slip rate on the south segment of Daliangshang fault zone. Seismol. Geol. 34 (02), 282–293. doi:10.3969/j.issn.0253-4967.2012.02.007
Wells, D. L., and Coppersmith, K. J. (1994). New empirical relationships among magnitude, rupture length, rupture width, rupture area, and surface displacement. Bull. Seismol. Soc. Am. 84 (4), 974–1002.
Wen, X. (2000b). The character of rupture segmentation of the Xianshuihe-Anninghe-Zemuhe fault zone, Western China. Seismol. Geol. 22 (3), 239–249. doi:10.3969/j.issn.0253-4967.2000.03.005
Wen, X. Z. (1989). An overview of the research on the future first risk of strong earthquakes in the xianshuihe fracture zone. Recent Dev. World Seismol. 7, 1–5.
Wen, X. Z. (1995). Quantitative estimates of seismic potential on active faults. Maharashtra: Seismological Press.
Wen, X. Z., Xu, X., Zheng, R., Long, D., Du, P., Xie, Y., et al. (2001). “The Late Quaternary activity of the Moxi fault and the recurrence interval of the large earthquake,” in Neostructure and environment (Peking: Seismological Press), 255–265.
Wen, X., Du, P., and Long, D. (2000a). New evidence of paleoearthquakes and date of the latest event on the Xiaoxiangling Mountain segment of the Anninghe fault zone. Seismol. Geol. 22 (1), 1–8. doi:10.3969/j.issn.0253-4967.2000.01.001
Wen, X. Z., Ma, S. L., Lei, X. L., Nishizawa (Kuwahara), Y., Tsutomu, K., and Chen, Q. (2007). Newly found surface rupture remains of large historical earthquakes on and near the transition segment of the Anninghe and Zemuhe fault zones, Western Sichuan, China. Seismol. Geol. 29 (4), 826–833. doi:10.3969/j.issn.0253-4967.2007.04.013
Xu, X., Tan, X., Yu, G., Wu, G., Fang, W., Chen, J., et al. (2013). Normal-and oblique-slip of the 2008 yutian earthquake: Evidence for eastward block motion, northern Tibetan plateau. Tectonophysics 584, 152–165. doi:10.1016/j.tecto.2012.08.007
Xu, X., Wen, X., Zheng, R., Ma, W., Song, F., and Yu, G. (2003). Pattern of latest tectonic motion and its dynamics for active blocks in Sichuan-Yunnan region, China. Sci. China Ser. D Earth Sci. 46 (2), 210–226. doi:10.1360/03dz0017
Xu, X., Zhang, P., Wen, X., Qin, Z., Chen, G., and Zhu, A. (2005). Features of active tectonics and recurrence behaviour of strong earthquakes in the Western Sichuan Province and its adjacent regions. Seismol. Geol. 27 (3), 446–461. doi:10.1103/PhysRevB.73.104437
Yu, W. X., Song, F. M., Wen, X. Z., and Li, X. Z. (2001). Study of the surface rupture zone of the Xichang earthquake in 1850. J. Seismol. Res. 2001 (04), 346–350. doi:10.3969/j.issn.1000-0666.2001.04.011
Zhang, P. Z. (1999). Late Quaternary tectonic deformation and earthquake hazard in continental China. Quat. Res. 1999 (05), 404–413.
Zhang, P. Z., Deng, Q. D., Zhang, G. M., Ma, J., Gan, W., Min, W., et al. (2003). Active tectonic blocks and strong earthquakes in the continent of China. Sci. China Ser. D Earth Sci. 2003 (2), 13–24. doi:10.1360/03dz0002
Zhang, P. Z. (2008). Present tectonic deformation, strain distribution, and deep dynamic process in the Western Sichuan area on the eastern margin of the Qinghai-Tibet Plateau (in Chinese). Sci. China Ser. D Earth Sci. 38 (9), 1041. doi:10.1360/zd2008-38-9-1041
Zhang, P. Z., Shen, Z., Wang, M., Gan, W., Bürgmann, R., Molnar, P., et al. (2004). Continuous deformation of the Tibetan Plateau from global positioning system data. Geology 32 (9), 809–812. doi:10.1130/g20554.1
Zhang, P. Z., Wang, Q., and Ma, Z. (2002). GPS velocity field and active crustal blocks of contemporary tectonic deformation in continental China. Earth Sci. Front. 9 (2), 430–441. doi:10.3321/j.issn:1005-2321.2002.02.022
Zhou, R. J., He, Y., Huang, Z., Li, X., and Yan, T. (2001). The slip rate and strong earthquake recurrence interval on the Qianning-Kangding segment of the Xianshuihe fault zone. ACTA Seismol. SIN. 2001 (03), 250–261+336. doi:10.3321/j.issn:0253-3782.2001.03.004
Keywords: Anninghe Fault, Nanhe Fault, late Quaternary slip rate, paleoseismology, seismic hazard, Tibetan Plateau, Sichuan–Yunnan Block
Citation: Ma C, Liu Y, An L, Yang X, Liu S and Zhang W (2023) Active faulting of the Nanhe Fault and relation to the Anninghe Fault zone in the late Quaternary, eastern Tibetan Plateau. Front. Earth Sci. 11:1086854. doi: 10.3389/feart.2023.1086854
Received: 01 November 2022; Accepted: 18 January 2023;
Published: 20 April 2023.
Edited by:
Fuqiong Huang, China Earthquake Networks Center, ChinaReviewed by:
Chong Xu, Ministry of Emergency Management, ChinaBiagio Giaccio, Italian National Research Council, Italy
Xiwei Xu, Ministry of Emergency Management, China
Copyright © 2023 Ma, Liu, An, Yang, Liu and Zhang. This is an open-access article distributed under the terms of the Creative Commons Attribution License (CC BY). The use, distribution or reproduction in other forums is permitted, provided the original author(s) and the copyright owner(s) are credited and that the original publication in this journal is cited, in accordance with accepted academic practice. No use, distribution or reproduction is permitted which does not comply with these terms.
*Correspondence: Yufa Liu, bHlmZHJlYW1lckBhbGl5dW4uY29t