 Zhilu Wu
 Cuixian Lu1*
- 1School of Geodesy and Geomatics, Wuhan University, Wuhan, China
- 2First Institute of Oceanography, Ministry of Natural Resources, Qingdao, China
- 3State Key Laboratory of Geodesy and Earth’s Dynamics, Wuhan, China
- 4Zhejiang Intelligent Video Security Innovation Center Co., Ltd., Hangzhou, China
Introduction: As a successor to Haiyang-2A (HY-2A), HY-2B is China’s second marine dynamic satellite. Equipped with a scanning microwave radiometer (SMR), it can measure the precipitable water vapor (PWV) over the oceans, providing valuable climate and weather insights. This study aims to evaluate the accuracy of HY-2B SMR PWV data from January 2019 to December 2021 using various validation methods.
Methods: to validate HY-2B SMR PWV, fifth-generation European Centre for Medium-Range Weather Forecasts (ECMWF) reanalysis (ERA5) data, radiosonde data, and global navigation satellite system (GNSS) observations are used.
Results: the validation shows that the HY-2B SMR PWV data agree well with the ERA5 PWV data, with a root mean square error (RMSE) of 1.61 mm and a mean value of 0.71 mm. However, RMSEs of approximately 3.5 mm are observed when comparing the HY-2B SMR PWV data to GNSS and radiosonde data, likely due to temporal and spatial gaps. Geographically, there are greater differences between the HY-2B SMR and ERA5 in lower-latitude areas. The reason could be attributed to a higher water vapor content and more frequent cloudy weather in the areas.
Discussion: The results demonstrate that the HY-2B SMR PWV meets requirement (RMSE≤3.5 mm). The HY-2B SMR PWV has a high quality, with a slight observational drift of only 0.1 mm/year, but regular validation and calibration are still necessary.
1 Introduction
Despite accounting for less than 5% of the atmosphere, water vapor plays a crucial role in the hydrologic cycle, global energy balance, and climate change processes (Held and Soden, 2000; Galewsky et al., 2016). In addition, it also serves as the primary source of error in geodetic measurements such as satellite altimetry (Wu et al., 2022), the global navigation satellite system (GNSS) (Wang and Liu, 2019), and very long baseline interferometry (VLBI) (Nilsson and Haas, 2010), resulting in a vertical delay of approximately 25 cm (Böhm and Schuh, 2013). With the ocean making up 71% of the Earth’s surface and supplying over 80% of the atmospheric water vapor, accurately retrieving the water vapor over oceans is very important.
Various technologies, such as radiosounding (Durre et al., 2006), GNSS meteorology (Bevis et al., 1992), and satellite remote sensing (He and Liu, 2019), can be used to observe water vapor. However, due to the complex ocean environment, in situ measurements are difficult to obtain (Wang et al., 2019). As a result, satellite remote sensing has become the main method for obtaining ocean-atmosphere observations. Satellite-borne remote sensing technology can be divided into two types which includes satellite-borne optical sensors and microwave sensors (NelsonCrisp et al., 2016). Near-infrared sensors (Kaufman and Gao, 1992; Gao and Kaufman, 2003; He and Liu, 2019) and infrared sensors (Aoki and Inoue, 1982; Knabb and Fuelberg, 1997) are commonly used in optical remote sensing, and can provide high-resolution (1 km–5 km) and accurate measurements of the precipitable water vapor (PWV) over oceans in clear weather (Ji and Shi, 2014). However, the performance of water vapor estimates is adversely affected in cloudy weather, as the retrieving algorithms of optical sensors are sensitive to clouds (Li and Long, 2020).
Satellite-borne microwave sensors are able to observe the atmosphere over the ocean through clouds due to their long wavelength. Several satellite-borne microwave radiometers, such as Scanning Multichannel Microwave Radiometer (SMMR) (Wilheit et al., 1984), Advanced Microwave Scanning Radiometer-Earth Observing System (AMSR-E) (Kawanishi et al., 2003; Du et al., 2014), WindSat (Gaiser et al., 2004), and Fengyun-3D (FY-3D) (Du et al., 2020), have been launched for this purpose. Algorithms for retrieving PWV include statistical, physical radiative transfer (RT) model, and machine learning approaches. Statistical approaches directly establish a regression equation between the brightness temperature (TB) and atmospheric water vapor, which requires fewer parameters and has a simple algorithm but lacks physical meaning and applicability to other fields (Alishouse et al., 1990; Schulz et al., 1993). Physical methods are based on the substantiated physical principles method, which has a high theoretical accuracy and clear physical significance, but technical limitations make inversion difficult (Tjemkes et al., 1991; Wentz, 1997). Machine learning can provide an the optimal solution but it does not capture the physical relationship between inputs and outputs (Bonafoni et al., 2011; Zabolotskikh and Chapron, 2017). These algorithms have achieved high accuracy in measuring PWV over the oceans, which has enabled the successful applications of microwave satellites in numerical weather prediction (NWP) and extreme weather forecasting (Kazumori et al., 2016; Xiao et al., 2020).
The PWV algorithm is typically developed prior to the launch of a satellite, and the satellite sensors gradually lose radiometric sensitivity and stability over time (Yang et al., 2013). Therefore, in-flight validation is necessary, which is done through numerical studies based on European Centre for Medium-Range Weather Forecasts (ECMWF) products, GNSS observations, and radiosonde data (Wentz, 1997; Wentz et al., 2005; Obligis et al., 2006; Chen et al., 2018). Haiyang-2B (HY-2B) is China’s second marine dynamic environment satellite (Yu et al., 2021). Liu et al. validated the HY-2B SMR PWV from November 2018 to 31 August 2019, which revealed a standard deviation (STD) of 1.23 mm compared to the standard WindSat products (Liu et al., 2021). While previous studies have mainly focused on validating the HY-2B SST products, few studies have been conducted on the HY-2B SMR PWV products (Liu et al., 2016; Zhou et al., 2019; Zhang et al., 2020; Liu et al., 2021). Validation of the HY-2B SMR PWV is crucial for its use in NWP, weather forecasting, and climate change research. This study assesses 3-year PWV products of the HY-2B SMR from 1 January 2019, to 31 December 2021, using fifth-generation ECMWF reanalysis (ERA5) products, GNSS observations, and radiosonde data.
Section 2 provides an overview of the HY-2B SMR PWV, ERA5 products, GNSS observations, and radiosonde data. Section 3 presents our findings and analyses, including an assessment of the overall agreement, the temporal and spatial characteristics of the HY-2B SMR PWV, and validation results based on the GNSS and radiosonde data. Section 4 summarizes the main achievements and our future work.
2 Materials and methods
2.1 Haiyang-2B scanning microwave radiometer
The HY-2 series satellites are Chinese satellites designed to monitor the marine environment. They were developed by the National Satellite Ocean Applications Service (NSOAS). The first satellite in the series, HY-2A, was launched in August 2011. The scientific mission of the HY-2A satellite ended in November 2020, and the HY-2B satellite was launched on 25 October 2018. More recently, HY-2C and HY-2D were launched successfully in 2020 and 2021, respectively. Together, they form a satellite observation constellation over the oceans (Wentz, 1997).
HY-2B operates in a sun-synchronous orbit at a height of 967 km with an inclination of 99.3°, and it has a repeat cycle of 14 days. The HY-2B SMR, designed to operate for 5 years, is a linearly polarized passive microwave radiometer that can measure the atmosphere and surface. It has a swath of approximately 1,600 km and an earth incidence angle of 53.15°, which allows it to cover 90% of the Earth in 1 day. The working frequencies for the HY-2B SMR are 6.925, 10.7, 18.7, 23.8, and 37 GHz, and the footprint size of each channel ranges from 19 km × 31 km–73 km × 109 km. For more detailed specifications of the SMR, please refer to Table 1. The retrieval algorithm is based on a log-linear regression with multichannel observations, i.e., TB.
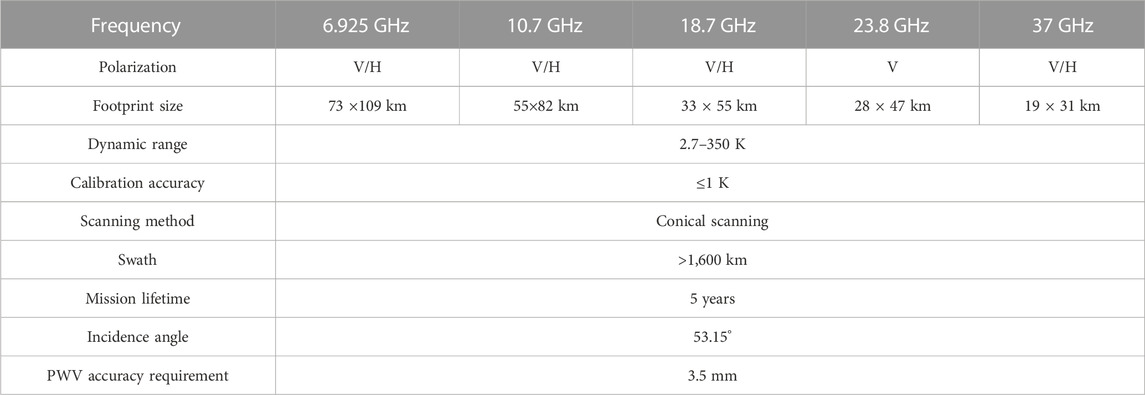
TABLE 1. Main specifications of the Haiyang-2B (HY-2B) scanning microwave radiometer.
HY-2B SMR PWV products are generated and distributed by the NSOAS, and are available at https://osdds.nsoas.org.cn/. In this article, HY-2B SMR level-2D PWV data from January 2019 to December 2021 (cycle 5 to cycle 83) are used. The monthly average PWV values of the HY-2B SMR in September 2020 are shown in Figure 1. The monthly global water vapor ranges from 0 to 70 mm, and the water vapor content in tropical areas is much higher than that in high-latitude regions.
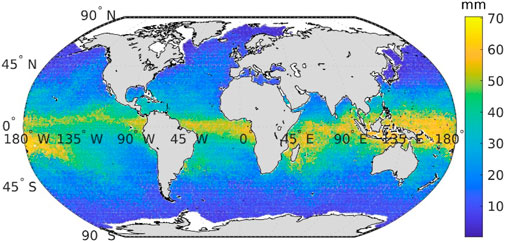
FIGURE 1. Monthly averaged water vapor in September 2020 derived from the Haiyang-2B scanning microwave radiometer.
Additionally, PWV data from the HY-2A SMR and Global Precipitation Measurement (GPM) Microwave Imager (GMI) are also compared for validation. The HY-2A orbits at a similar altitude as the HY-2B (971 km) and has the same five working frequencies (6.6, 10.7, 18.7, 23.8, and 37 GHz) as the HY-2B except for the frequency of 6.6 GHz (Liu et al., 2021). The NSOAS has generated and distributed HY-2A SMR PWV products for January to December 2014, but they are not publicly available at https://osdds.nsoas.org.cn/. Personal requests can be made to obtain them.
The GPM mission, jointly launched by the U.S. National Aeronautics and Space Administration (NASA) and Japan Aerospace Exploration Agency (JAXA), aims to standardize and advance global precipitation measurements (Zhang et al., 2020). The GPM core observatory was launched in February 2014 and operates at an inclination of 99.3° and a height of 407 km. The GMI has 13 channels ranging from 10.6 GHz to 183.31 GHz (Zhou et al., 2019). Daily GMI PWV products from 2019 to 2021 are used, and they can be accessed at http://www.remss.com/missions/gmi/.
2.2 Observations used for validation
In this study, ECMWF ERA5 PWV products are used to validate the HY-2B SMR PWV data. The ECMWF generates and maintains the largest archive of NWP, and ERA5 is the latest version of high-quality atmosphere reanalysis data (Wentz et al., 2005). The total column water vapor (TCWV) product from ERA5 with a temporal resolution of 1 h, and a horizontal resolution of 0.25° × 0.25° is utilized as the reference. To obtain the PWV values for the HY-2B SMR that corresponds to the same coordinates and time, we employ bilinear interpolation in the horizontal direction and cubic spline interpolation in the temporal domain. Since the ERA5 PWV product represents the water vapor content of the entire atmosphere, we directly compare the two datasets in the vertical direction.
GNSS observations are utilized to validate the HY-2B PWV products, which consist of coastal ground-based and shipborne GNSS observations. To ensure the accuracy of the validation process, GNSS sites provided by the International GNSS Service (IGS) are selected if they meet the following criteria: a distance of less than 50 km and time difference of less than 5 min compared to the HY-2B SMR observations. This selection process results in a total of 242 GNSS sites, and their geographical distribution is shown by red stars in Figure 2. Additionally, shipborne GNSS observations from day of year 236–253 in 2021 are included, and their trajectory is illustrated as black circles in Figure 2.
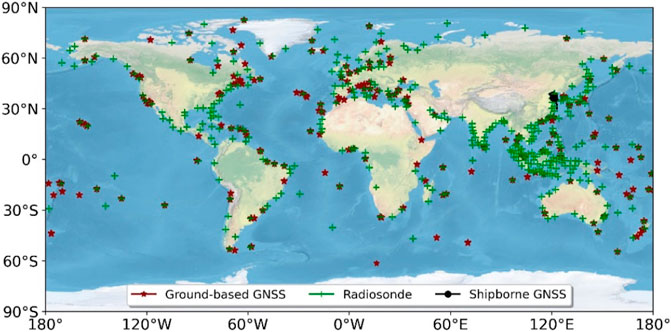
FIGURE 2. Geophysical distribution of GNSS sites and radiosondes. In the panel, the red stars represent the coastal GNSS stations, the green crosses refer to the ground-launched radiosondes, and the black circles represent shipborne GNSS observations.
The IGS offers zenith total delay (ZTD) products for ground-based GNSS observations, which can be accessed at http://www.igs.org/products. Shipborne GNSS ZTDs are obtained using GNSS + Research, Application and Teaching (GREAT) (Li et al., 2021). To calculate the zenith wet delay (ZWD), the zenith hydrostatic delay is subtracted using the Saastamoinen model (Saastamoinen, 1972). The ZWD is then used to determine the precipitable water vapor (PWV) values using a conversion factor (Bevis et al., 1992), and meteorological parameters are provided by GPT3 (Landskron and Böhm, 2018).
Coastal radiosonde profiles are also used to validate the HY-2B SMR PWV products. In this work, the quality-assured radiosonde observations provided by the Integrated Global Radiosonde Archive (IGRA) are utilized. The selected radiosonde sites are those that exhibit a distance of 50 km or less between the ground radiosonde stations observations and the HY-2B SMR data. In addition, a threshold of 2 h is set since coastal radiosondes cannot provide all-day observations. Finally, 418 radiosonde sites are selected, as shown in Figure 2 (in green crosses).
2.3 Validation method
PWV matchup values obtained from the HY-2B SMR are based on the locations of the GNSS/radiosonde sites and ERA5 grid, as the previously-mentioned criteria. Prior to the evaluation, PWV values greater than 90 mm are excluded. Outliers that may result from instrumental, record or processing errors are also removed from the datasets. These outliers are identified when the absolute differences between their values and the mean value are greater than three times the STD. To quantitatively evaluate the performance of the HY-2B SMR PWV, five statistical metrics are employed: correlation coefficient, mean value, STD, root mean square error (RMSE), and relative error. Scatter plots are used to analyze the variations between HY-2B SMR PWV and reference data.
3 Results and discussion
In this section, the assessment results of the HY-2B SMR PWV product based on the ERA5 water vapor data are presented. The detailed PWV agreement between the HY-2B SMR and ERA5 PWV is investigated, and HY-2A and GMI PWV are also validated by ERA5 PWV products. The spatial and temporal characteristics of SMR water vapor retrievals are also analyzed. In addition, GNSS observations and radiosonde data are also used to validate the HY-2B SMR PWV product.
3.1 Assessment of HY-2B scanning microwave radiometer water vapor
Before the comparison, the mean value and STD between the HY-2B SMR PWV and ERA5 products are obtained. Figure 3A shows the validation results based on the ERA5 product, and statistical analysis is conducted after applying the three-STDs criterion, i.e., HY-2B PWV values greater than three STD values of the mean value are excluded (red points in the figure). In this study, the differences are the HY-2B SMR PWV values minus ERA5 data.
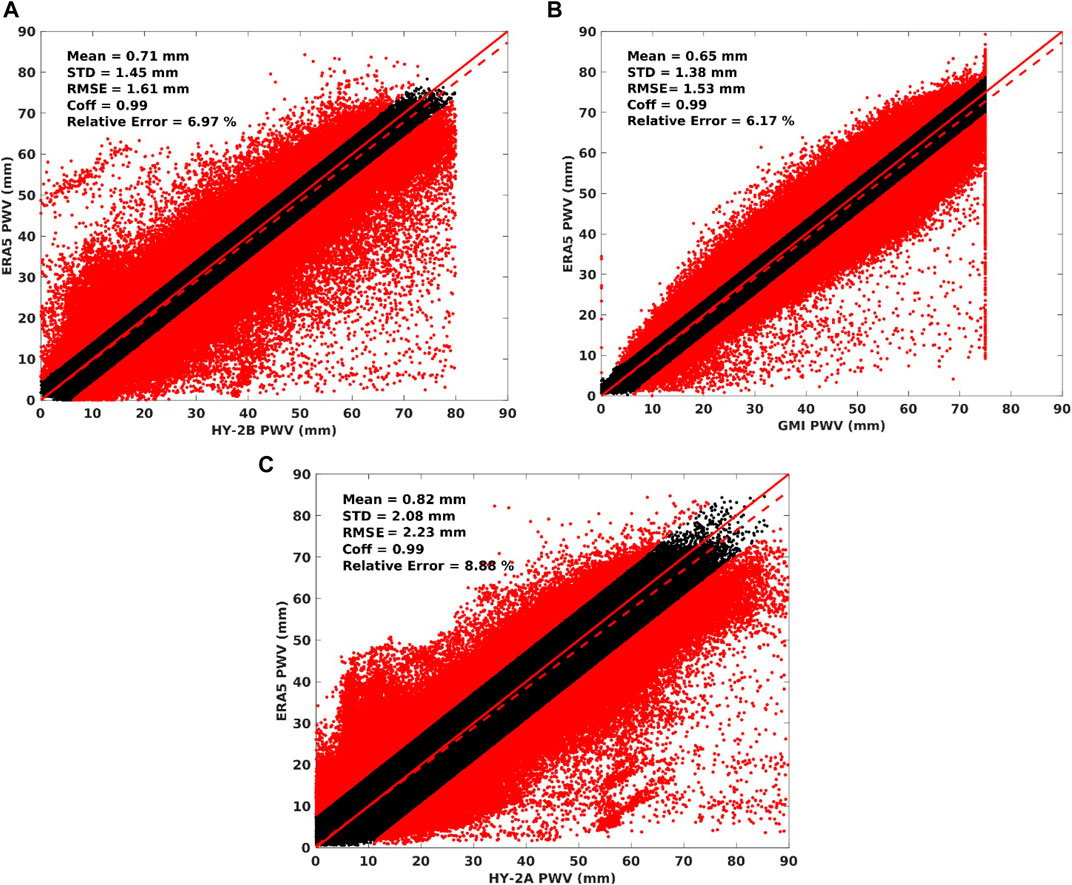
FIGURE 3. Scatter diagram of the ERA5 PWV versus the HY-2B PWV (A), GMI PWV (B) and HY-2A PWV (C) products. The dashed red line is the fitted line between the HY-2B SMR PWV products and ERA5 PWV, and the solid red line represents the simulated line of y = x. The black points represent valid values, and red points represent outliers.
The HY-2B SMR PWV demonstrates good agreement with the ERA5 PWV product, with an RMSE of 1.61 mm and a mean value of 0.71 mm. However, during the first 3 years, the HY-2B SMR is larger than that of the ERA5 PWV data. The correlation coefficient between HY-2B SMR PWV and ECMWF is 0.99, indicating a very high positive correlation. The relative error of HY-2B is 7.01%. Additionally, the fitted line (dashed red line) closely aligns with the simulated line (solid red line), further confirming the good agreement between the HY-2B SMR PWV and the ERA5 PWV products. Non-etheless, it is important to note that some significant deviations (red points) still exist between the ERA5 and HY-2B PWV products in Figure 3A, though they only represent less than 0.5% of the total comparison points.
In addition, the PWV values from the GMI and HY-2A are also validated by ERA5 data as a comparison, which is shown in Figure 3B, C, respectively. The GMI PWV agrees better with the ERA5 PWV than does the HY-2B PWV, with an RMSE of 1.53 mm and a mean value of 0.65 mm. The GMI PWV data are more stable, likely due to more stable onboard equipment and fewer observations with large errors. Moreover, it can be found that the HY-2A PWV product performs worse than the other satellite-measured PWV product, with an RMSE of 2.23 mm and a mean value of 0.82 mm. In addition, the HY-2A PWV shows many more outliers and a larger relative error (8.88%). The HY-2A PWV retrieval algorithm is similar to that of the HY-2B PWV (Wang, 2014; Lin and Jia, 2022), and the instrumentation of the HY-2A may face unexpected problems in the space environment. The HY-2B improves the quality of onboard SMR and obtains more accurate PWV measurements.
Furthermore, we examined the PWV discrepancy between the HY-2B SMR and ERA5 products across varying environmental conditions, including cloud liquid water content and wind speed, which significantly impact the retrieval accuracy of the HY-2B SMR PWV. Statistical analyses of the differences between the HY-2B SMR PWV and ERA5 data under distinct environmental conditions are presented in Table 2 and Table 3. Table 2 shows that the PWV discrepancies between the HY-2B SMR and ERA5 PWV are notably greater under high wind speeds larger than 16 m/s, which yields an RMSE of 1.81 mm and an average of over 1 mm. However, PWV differences are minimal under wind speeds ranging from 4 to 8 m/s, with an average of 0.17 mm and an RMSE of 1.05 mm. Additionally, as indicated in Table 3, PWV differences escalate with an increase in cloud liquid water (CLW) content, with PWV differences exceeding a 2.5 mm RMSE under CLW conditions of over 0.3 kg/m2.
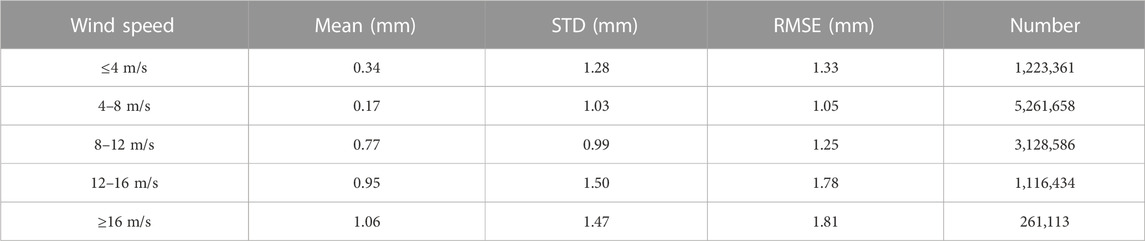
TABLE 2. PWV difference between HY-2B SMR and ERA5 PWV under different wind speed.
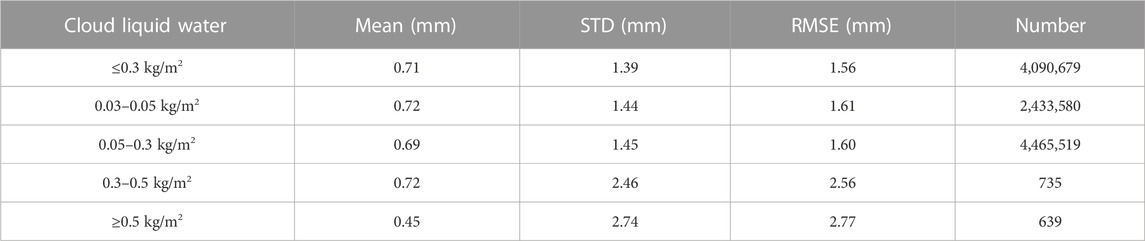
TABLE 3. PWV difference between HY-2B SMR and ERA5 PWV under different cloud liquid water content.
3.2 Spatial and temporal analyses of water vapor retrievals
To get the knowledge of the spatial characteristics of the HY-2B SMR PWV data, three different study areas are selected according to the range of latitude which include polar (>66.5°), mid-latitude (23.5°–66.5°), and tropical (23.5°N-23.5°S) areas. Table 4 shows the statistical analysis of the differences between the HY-2B SMR PWV and ERA5 data, including the mean values, STD, and RMSE. In tropical regions, the RMSE is 2.31 mm with a mean value of 1.47 mm. In contrast, in polar regions, the RMSE is less than 1 mm with a mean value of 0.11 mm. The agreement between datasets is higher at lower latitudes compared to higher latitudes. These results are consistent with those of previous studies, potentially because of high PWV content in these regions (Chen and Liu, 2016; Wu et al., 2020). In addition, rainfall can decrease the clarity of the atmosphere, especially at higher frequencies like 37 GHz. This can restrict observations made through vertical and horizontal polarization channels, and affect measurements of PWV obtained by satellite-based microwave radiometers. Rainy and cloudy weather is more prevalent in tropical regions, which could be another contributing factor (Wentz, 1997; Wang et al., 2020).
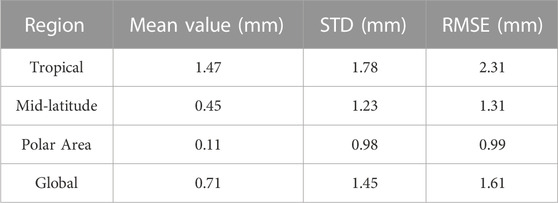
TABLE 4. PWV difference between HY-2B SMR and ERA5 PWV in different regions.
To examine the variation in the HY-2B SMR PWV over time, we compare the differences between the HY-2B SMR PWV and the ERA5 PWV product for each month from January 2019 to December 2021. The monthly comparison results are presented in Figure 4. The mean values remain stable during the first 3 years. The STDs reveal an annual variation, increasing in the first half of the year and decreasing in the latter half. The RMSE values show an increasing trend, from approximately 1.5 mm to over 1.7 mm. The mean RMSE values for 2019, 2020, and 2021 are 1.54 mm, 1.62 mm, and 1.72 mm, respectively. Assuming the stability and accuracy of ECMWF, the observation drift refers to the annual variation of RMSE. Our results indicate a slight observational drift of 0.1 mm/year in the HY-2B SMR PWV, which is currently negligible, but regular validation and calibration are necessary.
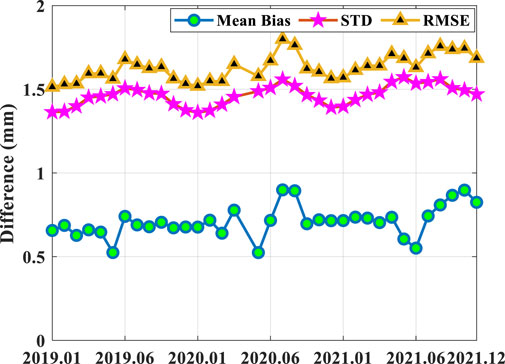
FIGURE 4. Monthly difference in the HY-2B SMR PWV and ERA5 PWV products. Circles represent the mean values, stars represent the STD values and triangles represent the RMSE values, respectively.
Furthermore, we also examine the temporal variations in the HY-2B SMR PWV across the three regions. Monthly variations are displayed in Figure 5, presenting both the mean and standard deviation (STD) values. Notably, the STD values in tropical areas are significantly higher than those in the other two regions. Additionally, the temporal variation in the STD in polar areas is more pronounced, exhibiting an annual pattern. Regarding the mean values, we observe that HY-2B SMR PWV values in Polar areas are higher in summer and lower in other seasons compared to the ERA5 product. Conversely, in tropical areas, the mean values indicate an increasing trend.
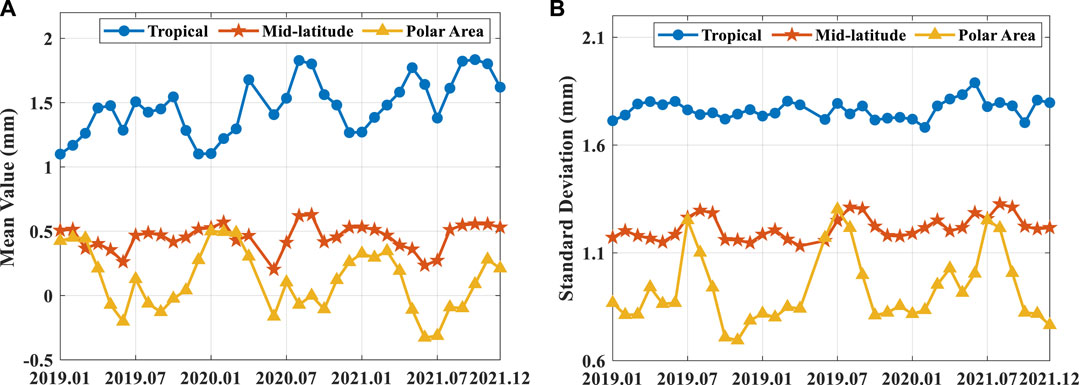
FIGURE 5. Monthly differences between the HY-2B SMR PWV and ERA5 PWV products in different regions. The blue circle represents the result in the tropical area, the red star represents the mid-latitude area and the yellow triangle represents the RMSE value. (A) shows the mean value and (B) shows the STD value.
Moreover, the global distributions of the yearly average differences between the HY-2B SMR PWV and ERA5 from 2019 to 2021 are obtained to show the annual variation in the HY-2B SMR products globally, as shown in Figure 6. The HY-2B SMR PWV products are larger than the ERA5 data in tropical areas, while they are not obvious in other areas. The reason possible be that areas with frequent cloudy and rainy weather are more likely to have retrieval results that are affected (Wentz, 1997). In addition, the STD values are greater in tropical areas and smaller in other regions. The annual variation over the 3 years is not obvious, which implies the stability and high accuracy of the HY-2B SMR PWV products.
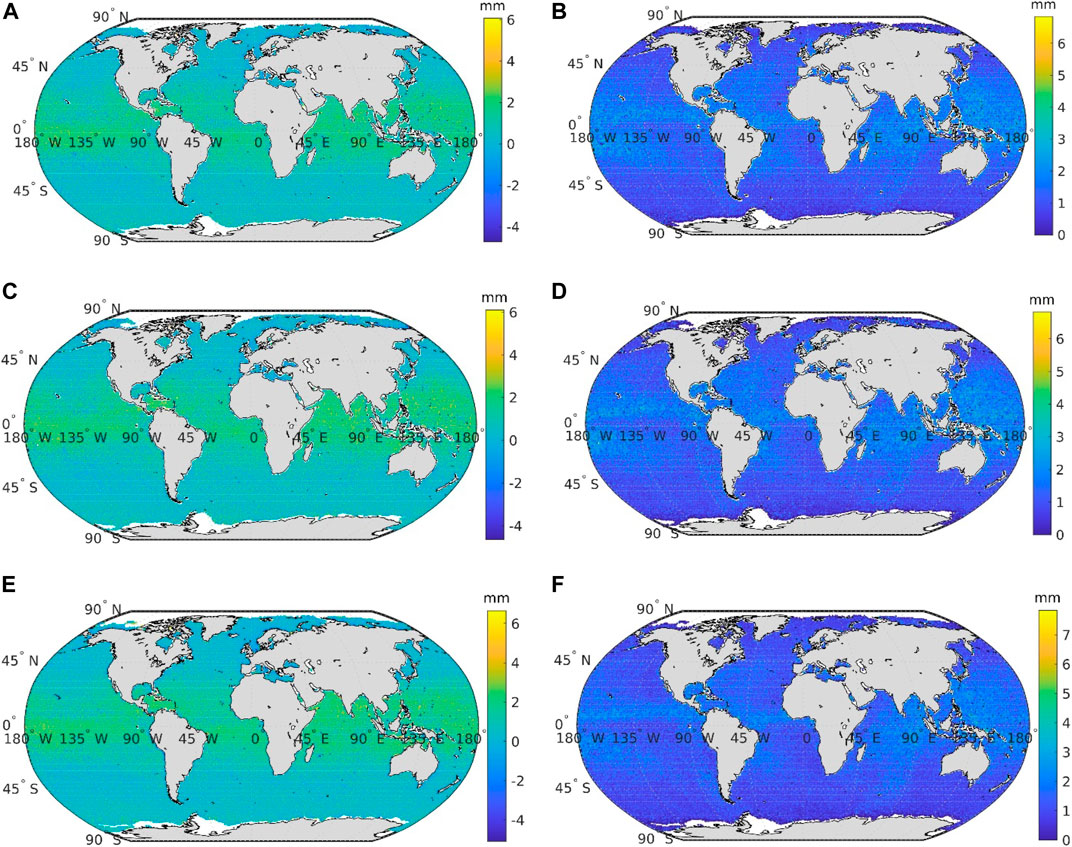
FIGURE 6. The global distribution of PWV differences between the HY-2B SMR and ERA5 PWV products. The left panel represents the mean value between HY-2B SMR and ERA5, and the right panel represents the STD value. (A, B) represent the results of 2019, (C, D) represent the results of 2020, and (E, F) represent the results of 2021.
3.3 Validation based on GNSS observations
GNSS-derived PWV values are used to validate the HY-2B SMR PWV product, which is comprised of ground-based and shipborne GNSS PWV. Figure 7A shows a comparison between ground-based GNSS PWV and HY-2B SMR products, with red points (those exceeding the three-STDs criterion) removed. The RMSE of the differences is 3.41 mm, indicating a systematic bias of 1.03 mm within 50 km. The correlation coefficient is 0.97, suggesting good agreement between the HY-2B PWV and ground-based GNSS PWV. However, the validation based on the ground-based GNSS PWV is larger than that based on the ERA5 PWV data mainly due to spatial and temporal gaps.
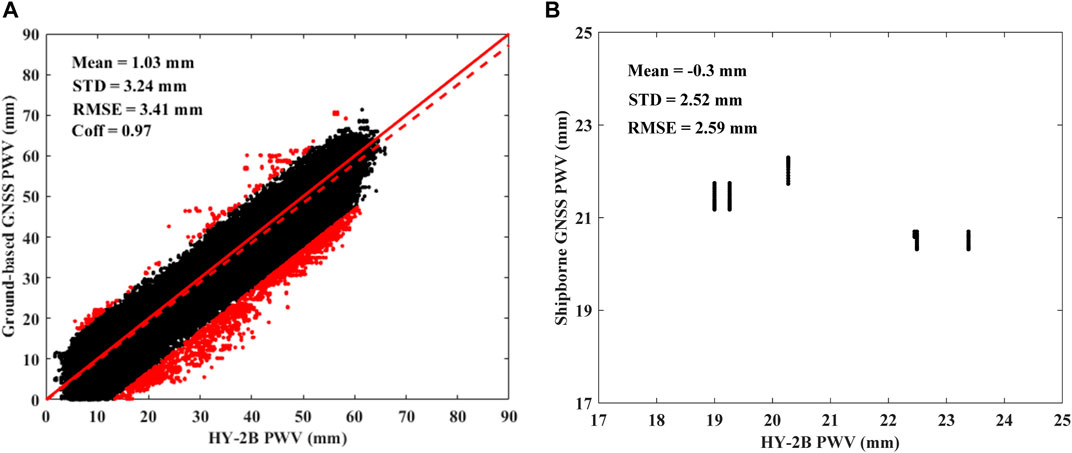
FIGURE 7. Scatter diagram of HY-2B PWV versus ground-based GNSS PWV (A), and shipborne GNSS PWV (B). The dashed red line is the fitted line between the HY-2B SMR PWV products and the GNSS PWV, and the solid red line represents the simulated line of y = x. The black points represent valid values, and the red points represent outliers.
Additionally, GNSS PWV values collected onboard ships are utilized, and their results are presented in Figure 7B. The findings demonstrate that the agreement between the shipborne GNSS PWV and HY-2B SMR PWV data is superior to that between ground-based GNSS PWV and HY-2B SMR PWV data, with an RMSE of 2.59 mm and a mean value of 0.3 mm. However, as both the ships and the satellite are mobile platforms, and the shipborne GNSS experiment only lasted for 17 days, there are only a few crossover points available.
3.4 Validation based on coastal radiosondes data
In addition, we evaluate the HY-2B SMR PWV data using coastal radiosonde data, and the results of this comparison are shown in Figure 8. Overall, the HY-2B and radiosonde data differ by an average RMSE of 3.61 mm, with a mean difference of 0.97 mm. The two sets of data are highly correlated, with a correlation coefficient of 0.97, and the fitted line closely follows the reference line (y=x). It is worth noting that the mean difference is larger than that obtained using ground-based GNSS PWV, partly due to the longer temporal gap between the datasets.
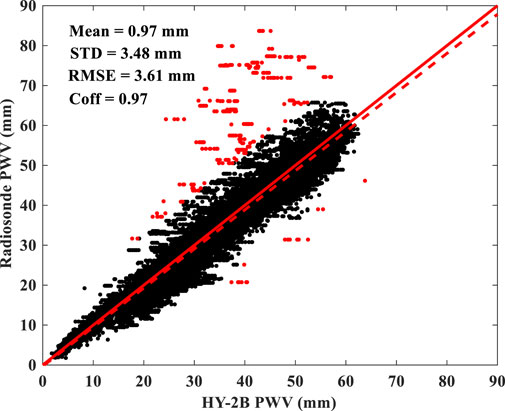
FIGURE 8. Scatter diagram of HY-2B PWV versus radiosonde PWV. The dashed red line is the fitted line between the HY-2B SMR PWV products and radiosonde PWV, and the solid red line represents the simulated line of y = x. The black points represent valid values, and red points represent outliers.
4 Conclusion
The atmospheric water vapor over the oceans plays a critical role in geodetic measurements, climate systems, and weather processes. HY-2B, China’s second marine dynamic satellite, is equipped with an SMR that allows it to measure water vapor over the oceans. It is therefore essential to validate the accuracy of the HY-2B SMR PWV for its application in geodetic and meteorological fields.
To this end, this study evaluates 3 years of HY-2B SMR PWV data from 1 January 2019, to 31 December 2021, using ERA5 PWV products. The results show that the difference between the HY-2B SMR and ERA5 has a RMSE of 1.61 mm and a 0.71 mm mean value. The GMI PWV and HY-2A PWV are also evaluated, with GMI PWV demonstrating better agreement than HY-2A and HY-2B PWV. Furthermore, the difference in PWV Precipitable Water Vapor between HY-2B SMR and ERA5 products is analyzed across varying levels of cloud liquid water content and wind speed. The examination reveals greater discrepancies at higher levels of water vapor content and wind speeds. Additionally, PWV values derived from GNSS and radiosonde data are used to validate the HY-2B PWV, which both show an agreement with an RMSE of approximately 3.5 mm. The results reveal obvious spatial characteristics, with smaller differences observed in high-latitude areas and greater differences in lower-latitude areas, which could be attributed to a higher water vapor content and more frequent cloudy weather in the areas. Temporally, the accuracy of HY-2B SMR PWV remains stable during the first 3 years, with only a slight observational drift of 0.1 mm/year. Overall, the assessment shows that the HY-2B SMR PWV meets the requirements and can be applied to geodetic and meteorological fields. Nevertheless, regular validation and calibration for the HY-2B are still essential.
The PWV products provided by the NSOAS are generated based on a linear regression model. However, the relationship between water vapor and the measured TB of different channels is complicated and affected by other parameters. In the future, we plan to investigate the use of a deep learning model to retrieve water vapor data over the oceans. Additionally, since the HY-2B SMR provides only the PWV over the oceans, it is necessary to retrieve high-accuracy PWV data over land based on the HY-2B SMR, as the current PWV measurements over land are not sufficiently accurate and significantly limit the application of HY-2B SMR products.
Data availability statement
The HY-2B SMR data used in this study can be accessed at https://osdds.nsoas.org.cn/. The GMI PWV used in this study can be accessed at https://www.remss.com/missions/gmi/. ECMWF ERA5 TCWV product can be accessed at https://cds.climate.copernicus.eu/cdsapp#!/dataset/reanalysis-era5-single-levels?tab=form. IGS zenith total delay can be accessed at http://www.igs.org/products. Radiosonde data can be accessed at https://www1.ncdc.noaa.gov/pub/data/igra/data/.
Author contributions
All authors have made a great contribution to this study and paper. Funding acquisition, CL; methodology, ZW and YZ; project administration, YxL; software, HL and QW; validation, YL; writing—original draft, ZW; writing—review and editing, CL, YZ, YxL, and YL.
Funding
This research is supported by the National Key R&D Program of China (2021YFC3000504), the National Natural Science Foundation of China (Grant 41974029, Grant 42204018), the Fundamental Research Funds for the Central Universities (2042021kf0005), the Fellowship of China Postdoctoral Science Foundation (2020M682481), the State Key Laboratory of Geodesy and Earth’s Dynamics, Innovation Academy for Precision Measurement Science and Technology, CAS, China (Grant SKLGED 2022-3-8), the Key Laboratory of Aerospace Environment and Geodesy, Ministry of Education, Wuhan University (21-02-01).
Acknowledgments
We would like to thank NSOAS for HY-2B and HY-2A SMR PWV data, Remote Sensing Systems for GMI PWV, IGRA for radiosonde data, IGS for zenith total delay, and ECMWF for ERA5 PWV data. The numerical calculations in this paper have been done on the supercomputing system in the Supercomputing Center of Wuhan University.
Conflict of interest
Author HL is employed by Zhejiang Intelligent Video Security Innovation Center Co., Ltd., China.
The remaining authors declare that the research was conducted in the absence of any commercial or financial relationships that could be construed as a potential conflict of interest.
Publisher’s note
All claims expressed in this article are solely those of the authors and do not necessarily represent those of their affiliated organizations, or those of the publisher, the editors and the reviewers. Any product that may be evaluated in this article, or claim that may be made by its manufacturer, is not guaranteed or endorsed by the publisher.
References
Alishouse, J. C., Snyder, S., Vongsathorn, J., and Ferraro, R. (1990). Determination of oceanic total precipitable water from the SSM/I. IEEE Trans. Geoscience Remote Sens. 28 (5), 811–816. doi:10.1109/36.58967
Aoki, T., and Inoue, T. (1982). Estimation of the precipitable water from the IR channel of the geostationary satellite. Remote Sens. Environ. 12 (3), 219–228. doi:10.1016/0034-4257(82)90054-2
Chen, B., Dai, W., Liu, Z., Wu, L., and Xia, P. 2018 Assessments of GMI-derived precipitable water vapor products over the south and east China seas using radiosonde and GNSS,” Adv. Meteorology, 2018, 1-12, doi:10.1155/2018/7161328
Chen, B., and Liu, Z., 2016 “Global water vapor variability and trend from the latest 36 year (1979 to 2014) data of ECMWF and NCEP reanalyses, radiosonde, GPS, and microwave satellite,” J. Geophys. Res. Atmos., 121, 19, 11, doi:10.1002/2016jd024917
Bevis, M., Businger, S., Herring, T. A., Rocken, C., Anthes, R. A., and Ware, R. H. (1992). GPS meteorology: Remote sensing of atmospheric water vapor using the Global Positioning System. J. Geophys. Res. Atmos. 97 (D14), 15787–15801. doi:10.1029/92jd01517
Bonafoni, S., Mattioli, V., Basili, P., Ciotti, P., and Pierdicca, N. (2011). Satellite-based retrieval of precipitable water vapor over land by using a neural network approach. IEEE Trans. geoscience remote Sens. 49 (9), 3236–3248. doi:10.1109/tgrs.2011.2160184
Du, B., Ji, D., Shi, J., Wang, Y., Lei, T., Zhang, P., et al. (2020). The retrieval of total precipitable water over global land based on FY-3D/MWRI data. Remote Sens. 12 (9), 1508. doi:10.3390/rs12091508
Du, J., Kimball, J. S., and Jones, L. A. (2014). Satellite microwave retrieval of total precipitable water vapor and surface air temperature over land from AMSR2. IEEE Trans. Geoscience Remote Sens. 53 (5), 2520–2531. doi:10.1109/tgrs.2014.2361344
Durre, I., Vose, R. S., and Wuertz, D. B. (2006). Overview of the integrated global radiosonde archive. J. Clim. 19 (1), 53–68. doi:10.1175/jcli3594.1
Gaiser, P. W., St Germain, K., Twarog, E., Poe, G., Purdy, W., Richardson, D., et al. (2004). The WindSat spaceborne polarimetric microwave radiometer: Sensor description and early orbit performance. IEEE Trans. Geoscience Remote Sens. 42 (11), 2347–2361. doi:10.1109/tgrs.2004.836867
Galewsky, J., Steen-Larsen, H. C., Field, R. D., Worden, J., Risi, C., and Schneider, M. (2016). Stable isotopes in atmospheric water vapor and applications to the hydrologic cycle. Rev. Geophys. 54 (4), 809–865. doi:10.1002/2015rg000512
Gao, B. C., and Kaufman, Y. J. (2003). Water vapor retrievals using Moderate Resolution Imaging Spectroradiometer (MODIS) near-infrared channels. J. Geophys. Res. Atmos. 108. doi:10.1029/2002jd003023
He, J., and Liu, Z. (2019). Comparison of satellite-derived precipitable water vapor through near-infrared remote sensing channels. IEEE Trans. Geoscience Remote Sens. 57 (12), 10252–10262. doi:10.1109/tgrs.2019.2932847
Held, I. M., and Soden, B. J. (2000). Water vapor feedback and global warming. Annu. Rev. energy Environ. 25 (1), 441–475. doi:10.1146/annurev.energy.25.1.441
Ji, D., and Shi, J. (2014). Water vapor retrieval over cloud cover area on land using AMSR-E and MODIS. IEEE J. Sel. Top. Appl. Earth Observations Remote Sens. 7 (7), 3105–3116. doi:10.1109/jstars.2014.2298979
Kaufman, Y. J., and Gao, B.-C. (1992). Remote sensing of water vapor in the near IR from EOS/MODIS. IEEE Trans. Geoscience Remote Sens. 30 (5), 871–884. doi:10.1109/36.175321
Kawanishi, T., Sezai, T., Ito, Y., Imaoka, K., Takeshima, T., Ishido, Y., et al. (2003). The Advanced Microwave Scanning Radiometer for the Earth Observing System (AMSR-E), NASDA's contribution to the EOS for global energy and water cycle studies. IEEE Trans. Geoscience Remote Sens. 41 (2), 184–194. doi:10.1109/tgrs.2002.808331
Kazumori, M., Geer, A. J., and English, S. J. (2016). Effects of all-sky assimilation of GCOM-W/AMSR2 radiances in the ECMWF numerical weather prediction system. Q. J. R. Meteorological Soc. 142 (695), 721–737. doi:10.1002/qj.2669
Knabb, R. D., and Fuelberg, H. E. (1997). A comparison of the first-guess dependence of precipitable water estimates from three techniques using GOES data. J. Appl. Meteorology 36 (5), 417–427. doi:10.1175/1520-0450(1997)036<0417:acotfg>2.0.co;2
Landskron, D., and Böhm, J. (2018). VMF3/GPT3: Refined discrete and empirical troposphere mapping functions. J. Geodesy 92 (4), 349–360. doi:10.1007/s00190-017-1066-2
Li, X., Han, X., Li, X., Liu, G., Feng, G., Wang, B., et al. (2021). GREAT-UPD: An open-source software for uncalibrated phase delay estimation based on multi-GNSS and multi-frequency observations. GPS Solutions 25 (2), 66–69. doi:10.1007/s10291-020-01070-2
Li, X., and Long, D. (2020). An improvement in accuracy and spatiotemporal continuity of the MODIS precipitable water vapor product based on a data fusion approach. Remote Sens. Environ. 248, 111966. doi:10.1016/j.rse.2020.111966
Lin, M., and Jia, Y. (2022). Past, present and future marine microwave satellite missions in China. Remote Sens. 14 (6), 1330. doi:10.3390/rs14061330
Liu, M., Guan, L., Zhao, W., and Chen, G. (2016). Evaluation of sea surface temperature from the HY-2 scanning microwave radiometer. IEEE Trans. Geoscience Remote Sens. 55 (3), 1372–1380. doi:10.1109/tgrs.2016.2623641
Liu, S.-B., Cui, X. D., Li, Y. N., Jin, X., Zhou, W., Dang, H. X., et al. (2021). Retrieval of sea surface temperature from the scanning microwave radiometer aboard HY-2B. Int. J. Remote Sens. 42 (12), 4621–4643. doi:10.1080/01431161.2021.1899330
Nilsson, T., and Haas, R. (2010). Impact of atmospheric turbulence on geodetic very long baseline interferometry. J. Geophys. Res. Solid Earth 115. doi:10.1029/2009JB006579
Obligis, E., Eymard, L., Tran, N., Labroue, S., and Femenias, P. (2006). First three years of the microwave radiometer aboard Envisat: In-flight calibration, processing, and validation of the geophysical products. J. Atmos. Ocean. Technol. 23 (6), 802–814. doi:10.1175/jtech1878.1
Nelson, R. R., Crisp, D., Ott, L. E., and O'Dell, C. W. 2016 High-accuracy measurements of total column water vapor from the Orbiting Carbon Observatory-2,” Geophys. Res. Lett., 43, 261–312, doi:10.1002/2016gl071200
Saastamoinen, J. (1972). Atmospheric correction for the troposphere and stratosphere in radio ranging satellites. use Artif. Satell. geodesy 15 (3), 247–251.
Schulz, J., Schluessel, P., and Graßl, H. (1993). Water vapour in the atmospheric boundary layer over oceans from SSM/I measurements. Int. J. Remote Sens. 14 (15), 2773–2789. doi:10.1080/01431169308904308
Tjemkes, S. A., Stephens, G. L., and Jackson, D. L. (1991). Spaceborne observation of columnar water vapor: SSMI observations and algorithm. J. Geophys. Res. Atmos. 96 (D6), 10941–10954. doi:10.1029/91jd00272
Wang, J., and Liu, Z. (2019). Improving GNSS PPP accuracy through WVR PWV augmentation. J. Geodesy 93 (9), 1685–1705. doi:10.1007/s00190-019-01278-2
Wang, S., Xu, T., Nie, W., Jiang, C., Yang, Y., Fang, Z., et al. (2020). Evaluation of precipitable water vapor from five reanalysis products with ground-based GNSS observations. Remote Sens. 12 (11), 1817. doi:10.3390/rs12111817
Wang, S., Wu, Z., Semmling, M., Zus, F., Gerland, S., Ramatschi, M., et al. (2019). Retrieving precipitable water vapor from shipborne multi-GNSS observations. Geophys. Res. Lett. 46 (9), 5000–5008. doi:10.1029/2019gl082136
Wang, Z. (2014). Study on retrieval algorithm of ocean parameters for the HY-2 scanning microwave radiometer. Eng. Sci. 16 (6), 70–82.
Wentz, F. J. (1997). A well-calibrated ocean algorithm for special sensor microwave/imager. J. Geophys. Res. Oceans 102 (C4), 8703–8718. doi:10.1029/96jc01751
Wentz, F. J., Gentemann, C., and Hilburn, K. (2005). “Three years of ocean products from AMSR-E: Evaluation and applications,” in Proceedings Of The International Geoscience And Remote Sensing Symposium, Kuala Lumpur, Malaysia, 17 - 22 July, 2022.
Wilheit, T. T., Greaves, J. R., Gatlin, J. A., Han, D., Krupp, B. M., Milman, A. S., et al. (1984). Retrieval of ocean surface parameters from the scanning multifrequency microwave radiometer (SMMR) on the nimbus-7 satellite. IEEE Trans. geoscience remote Sens. GE-22, 133–143. doi:10.1109/tgrs.1984.350605
Wu, Z., Liu, Y., Liu, Y., Lu, C., He, X., Jin, K., et al. (2022). Rapid calibration of HY-2A satellite-borne microwave radiometer using coastal GNSS observations. J. Geodesy 96 (4), 24–13. doi:10.1007/s00190-022-01617-w
Wu, Z., Liu, Y., Liu, Y., Wang, J., He, X., Xu, W., et al. (2020). Validating HY-2A CMR precipitable water vapor using ground-based and shipborne GNSS observations. Atmos. Meas. Tech. 13 (9), 4963–4972. doi:10.5194/amt-13-4963-2020
Xiao, H., Han, W., Wang, H., Wang, J., Liu, G., and Xu, C. (2020). Impact of FY-3D MWRI radiance assimilation in GRAPES 4DVar on forecasts of Typhoon Shanshan. J. Meteorological Res. 34 (4), 836–850. doi:10.1007/s13351-020-9122-x
Yang, J., Gong, P., Fu, R., Zhang, M., Chen, J., Liang, S., et al. (2013). The role of satellite remote sensing in climate change studies. Nat. Clim. change 3 (10), 875–883. doi:10.1038/nclimate1908
Yu, R., Lu, H., Li, S., Zhu, D., Zhou, W., Dang, P., et al. (2021). Instrument design and early in-orbit performance of HY-2B scanning microwave radiometer. IEEE Trans. Geoscience Remote Sens. 60, 1–13. doi:10.1109/tgrs.2021.3095400
Zabolotskikh, E., and Chapron, B. (2017). Improvements in atmospheric water vapor content retrievals over open oceans from satellite passive microwave radiometers. IEEE J. Sel. Top. Appl. Earth Observations Remote Sens. 10 (7), 3125–3133. doi:10.1109/jstars.2017.2671920
Zhang, L., Yu, H., Wang, Z., Yin, X., Yang, L., Du, H., et al. (2020). Evaluation of the initial sea surface temperature from the HY-2B scanning microwave radiometer. IEEE Geosci. Remote Sens. Lett. 18 (1), 137–141. doi:10.1109/lgrs.2020.2968635
Zhou, W., Lin, M., Yin, X., Ma, X., Huang, L., Wang, S., et al. (2019). “Preliminary estimate of sea surface temperature from the scanning microwave radiometer onboard HY-2B satellite,” in Proceedings of the IGARSS 2019-2019 IEEE international geoscience and remote sensing symposium (Yokohama: Japan, 28 July 2019 - 02 August 2019), 8173–8176.
Keywords: Haiyang-2B, scanning microwave radiometer, precipitable water vapor, ocean, GNSS, radiosonde
Citation: Wu Z, Lu C, Liu Y, Lin H, Zheng Y, Wei Q and Liu Y (2023) Global statistical assessment of Haiyang-2B scanning microwave radiometer precipitable water vapor. Front. Earth Sci. 11:1084285. doi: 10.3389/feart.2023.1084285
Received: 30 October 2022; Accepted: 27 February 2023;
Published: 09 March 2023.
Edited by:
Jane Liu, University of Toronto, CanadaReviewed by:
Yang Wang, Fujian Normal University, ChinaHongtao Shi, China University of Mining and Technology, China
Copyright © 2023 Wu, Lu, Liu, Lin, Zheng, Wei and Liu. This is an open-access article distributed under the terms of the Creative Commons Attribution License (CC BY). The use, distribution or reproduction in other forums is permitted, provided the original author(s) and the copyright owner(s) are credited and that the original publication in this journal is cited, in accordance with accepted academic practice. No use, distribution or reproduction is permitted which does not comply with these terms.
*Correspondence: Cuixian Lu, Y3hsdkBzZ2cud2h1LmVkdS5jbg==