 Mengying Li
 Zhihong Zhang*
95% of researchers rate our articles as excellent or good
Learn more about the work of our research integrity team to safeguard the quality of each article we publish.
Find out more
ORIGINAL RESEARCH article
Front. Earth Sci. , 10 August 2023
Sec. Solid Earth Geophysics
Volume 11 - 2023 | https://doi.org/10.3389/feart.2023.1082707
This article is part of the Research Topic From Preparation to Faulting: Multidisciplinary Investigations on Earthquake Processes, volume II View all 16 articles
In this article, the daily brightness temperature data from January 2006 to May 2020 of China’s geostationary meteorological satellite FY-2E/G were used to identify the brightness temperature differences before deep and shallow earthquakes in the study area using wavelet transform and the relative wavelet power spectrum (RWPS) methods. The objective was to explore the characteristics of thermal infrared (TIR) radiation anomaly changes before deep and shallow earthquakes in Northeast China by carrying out anomaly extraction and data analysis. The research has shown that five significant earthquakes experienced TIR radiation anomalies in the vicinity of the epicenter approximately 1–2 months before the event. The amplitude of the anomaly ranged from seven to twenty times higher than average, and the anomaly lasted about 3 months. The infrared radiation anomaly characteristics before the earthquake were especially significant in the case of two earthquakes in the Songyuan area. From the research, it was concluded that the TIR radiation anomaly could act as a short-term precursor for earthquake prediction. The method employed in this study would provide great support for predicting deep and shallow earthquakes in Northeast China using satellite thermal infrared technology.
An earthquake is a seismic and deformation phenomenon that occurs within the earth’s crust. Earthquakes not only cause significant losses to human life and property but also have a profound impact on social and economic development and the human living environment. Therefore, earthquake prediction has become a research topic of significant academic and practical value in seismology. With the continuous development of technology, scientists have discovered a close relationship between earthquake activity and thermal infrared (TIR) phenomena. Due to the influence of various geophysical processes, such as underground geothermal flow and fluid movement, on the radiation energy emitted by surface objects in the thermal infrared band, earthquake activity can create abnormal changes in TIR radiation. By observing and analyzing these anomalies, scientists can predict earthquakes (Zhang et al., 2021; Xu et al., 2020; Li et al., 2019; Wang et al., 2018; Dong et al., 2017).
With the development of satellite remote sensing technology, many scientists and research teams have been committed to studying the geothermal precursor phenomena before earthquakes and corresponding earthquake predictions. Scientists have studied the relationship between satellite TIR remote sensing information and earthquakes since the 1980s (Qiang et al., 1991; Qiang et al., 1998; Zhang et al., 2002). The early reports of temperature changes prior to earthquakes are from ground observations (Asteriadis and Livieratos, 1989; You, 1990). For example, Qiang et al. (1992) believed that the TIR anomaly was the friction between tectonic plates during an earthquake, which caused the greenhouse gases in the rock body to escape along the fractured fissures; they described the phenomenon as “the earth deflates.” The inert gas was ionized by the low-altitude electric field to form infrared light of various bands. In recent years, many experts (Kang et al., 2011; Liu et al., 2007; Guo et al., 2014) carried out research in related fields in China and concluded that there were TIR radiation anomalies before earthquakes. Other researchers found significant TIR radiation anomalies before moderate and strong earthquakes in mainland China in recent years (Dai et al., 2016; Xu and Xu, 2013; Zhang et al., 2013; Xie et al., 2015a). The robust satellite technique (RST) method based on statistics was adopted and applied to the Athens Ms5.9 earthquake in 1999. The increase in surface temperature in the adjacent area is considered to be a thermal anomaly related to tectonic activities and earthquakes. Tronin et al. (2002) and Lv et al. (2000) studied some earthquakes and found that thermal anomalies on infrared images were related to linear crustal structures and fault zones. Chen et al. (2004)and Chen et al. (2009) proposed and extracted a base field for the annual variation of surface brightness temperature that provided a reference background for extracting crustal activity information using TIR radiation data.
Satellite TIR remote sensing instruments can directly observe the thermal radiation intensity of ground objects. After calibration and geometric correction, it is called the radiance of the corresponding channel (band). We applied the blackbody radiation formula of Planck’s radiation theorem to calculate the radiation temperature (Zhang et al., 2010). The data are from FY-2 Geostationary Meteorological Satellites, and we used the FY-2C/E/G brightness temperature hourly data product to distinguish the true radiation temperature of the object. This is called the brightness temperature. FY-2C was launched on 19 October 2004, FY-2E was launched on 15 June 2008, and FY-2G, a replacement satellite for FY-2E was launched on 31 December 2014. This data product was available from geostationary satellites before infrared remote sensing. Most of the data were polar orbiting satellite data. However, for seismic research, the comparability of data was weak due to the differences between polar orbiting satellite orbits and transit time, and it was difficult to find thermal anomalies before earthquakes. Today, observation data from the FY-2G satellite are commonly used. The orbit of FY-2G is located at 105°E above the equator, 35,000 km from the ground, with an effective observation range of 45°–165°E and 60°S-60°N. The observation range is approximately one-third of the earth’s surface. The satellite resolution of brightness temperature observation is 5 km. The FY-2G satellite began to provide valid data service in June 2015. The position of the satellite to each pixel is fixed, so the propagation path of thermal radiation for each pixel from the land surface to the satellite is also almost fixed. Images of brightness temperature and the relative wavelet power spectrum (RWPS) amplitudes can be directly depicted according to the pixel coordinates without the orbit splicing needed for data from polar orbit satellites. The valid data from January 2006 to 1 January 2019 were used to analyze the possible thermal anomalies before earthquake cases. To avoid the impact of direct solar radiation, five real-time observation data collection instances were selected at midnight every day (the data product time interval was taken once an hour), using Beijing time at the 01:00, 02:00, 03:00, 04:00, and 05:00 data points. These observation data points were used to obtain the daily value data that formed the daily brightness temperature data by the window-filling method (Zhang et al., 2010).
The data processing methods are wavelet transform and RWP estimation. Wavelet transform evolved on the basis of Fourier transform and is an effective method for analyzing unsteady signals. It has been well evolved in the time and frequency domains and has been applied to the fields of geophysics and seismic exploration (Kumar and Foufoula, 1997). The biggest features of wavelet transform technology are self-adaptability and mathematical microscopy. The technology can reconstruct the original signal with almost no loss and focus on any detail of the signal. It is an effective tool for current signal time–frequency analysis. The wavelet transform formula of finite time series is as follows:
By calculating the power spectrum of the aforementioned wavelet transform and the data after removing the influencing factors, considering the mid-short-term earthquakes have a period of occurrence, so taking n = 64 days as the window length and m = 1 day as the sliding window length for Fourier transform, the latest time of the data in the window is considered, and a set of power spectra are obtained by sliding the time history data on each pixel once. Relative amplitude is used to compare the similarities and differences of the power spectra before and after the earthquake. The calculated time and frequency space data are used to scan the whole time and space. The entire frequency band is used to extract and identify the spatiotemporal change characteristics of the abnormal area. The RWP time series value of the region is calculated using a 0.05° × 0.05° unit.
In this study, the daily surface brightness temperature data observed by China Geostationary Meteorological Satellite FY-2C/E/G were collected. After spatial correction and calibration, the brightness temperature data in Northeast China (longitude 110°–135°E, latitude 35°–50°N) were selected. A total of 22 earthquakes above magnitude Ms4.9 that occurred in the study area since 2006 were analyzed using the RWP analysis method. Among them, five earthquakes showed significant TIR anomalies before their occurrence.
(1) The Ms6.2 earthquake occurred in Hunchun, Jilin, on 19 May 2008, with a focal depth of 540 km, which is a deep earthquake. The epicenter of the earthquake is located at the intersection of the Badaogou and Tumenjiang faults, and the focal mechanism solution shows a strike-slip type. Figure 1 shows that the high-value anomaly of the 5th frequency band in the Badaogou fault zone appeared on 30 April, the anomaly area gradually increased on 19 May, the amplitude reached 15, and then, the anomaly area gradually migrated to the southeast. The RWP high value showed a gathering phenomenon, and then, the amplitude and area gradually increased. On 4 June, the high-value areas appeared in a concentrated manner, the amplitude and area reached the maximum and then gradually decreased, and the high-value areas disappeared on 24 June. The abnormality lasted about 56 days.
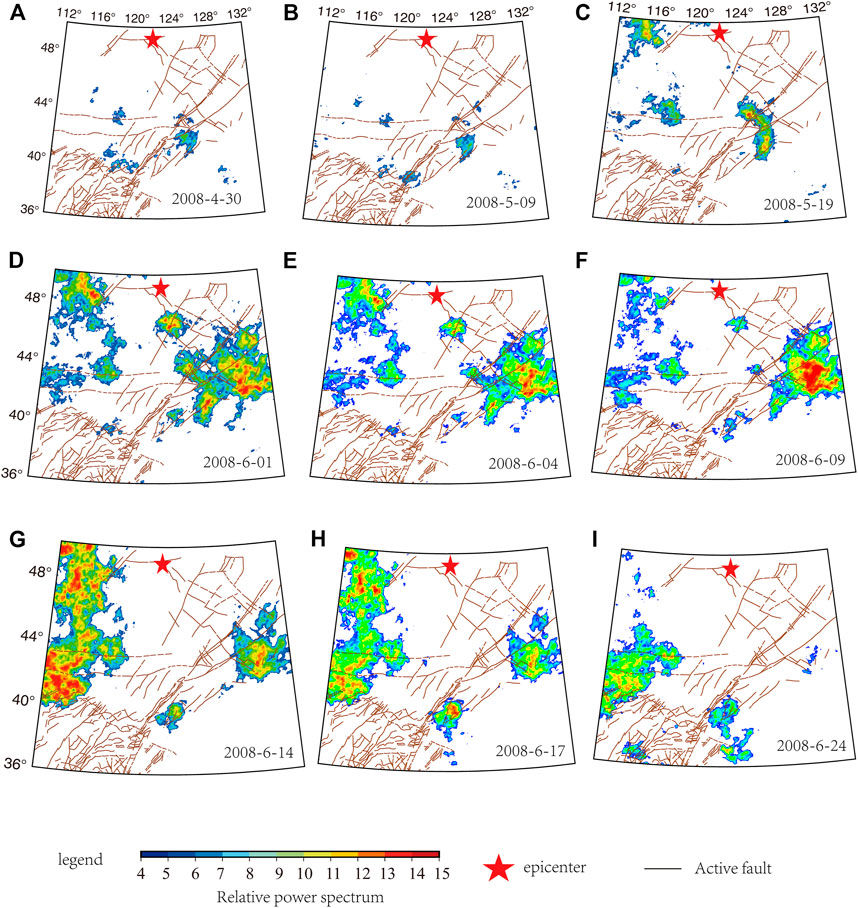
FIGURE 1. Temporal and spatial evolution of the RWPs of the Jilin Hunchun Ms6.2 earthquake (red star) on 19 May 2008.
The Ms6.2 earthquake on 19 May was obviously related to the abnormality that had appeared earlier in this position. The change of the abnormality can be summarized as a process of “appearance → enhancement → earthquake → extreme value → attenuation → disappearance.” Therefore, it can be inferred that the Huichun Ms6.2 earthquake occurred in the range of abnormality on 19 May. The average value in the power spectrum value region of the location was analyzed to visually inspect the changes in the TIR brightness temperature power spectrum before and after the Huichun earthquake in Jilin Province. The relative amplitude time variation sequence showed that from 16 April, the RWP value slowly increased from low to high, then decreased from high to low, and finally increased from low to high, and lasted until 19 May. After the earthquake, the peak value was greatly increased by the abnormality, reaching the maximum value of 9.46 on 16 June (Figure 2). The data difference between each period also reflects the changes before and after the event, showing that the TIR brightness temperature power spectrum has a very significant monitoring value for the earthquake. The aforementioned analysis shows that after the earthquake, the abnormal phenomenon of the TIR brightness temperature power spectrum changed. This phenomenon can accurately reflect the arrival of the earthquake, indicating its value and importance in earthquake monitoring and prediction. Therefore, to more accurately analyze and predict earthquakes, we could make full use of the information on the TIR brightness temperature power spectrum and other related information, effectively coordinate and comprehensively analyze each forecasting means, and then judge the possibility of earthquakes so that it can better cope with natural disasters in the form of earthquakes.
(2) The Ms5.2 earthquake occurred in Ayong Banner, Inner Mongolia, on 10 June 2008. It was a deep earthquake. The earthquake was located in the northern section of the Greater Khingan Mountains gradient belt, and the focal mechanism solution showed a right-handed strike-slip type. Figure 3 shows that on 9 May 2008, the 5th frequency band of the main ridge fault of the Great Khingan Mountains showed a high-value anomaly. After 1 June, the anomaly was concentrated in a small area, and its amplitude increased. On 4 June, the anomaly weakened. On 9 June, the anomaly extended southward along the fault of the main ridge of the Great Hinggan Mountains. The anomaly area was concentrated along the fault, and the amplitude of the RWPs reached its maximum. The earthquake occurred on 10 June, with the epicenter at the edge of the anomaly area. On 24 June, the anomaly disappeared and gradually recovered to the normal background value. The time-series curve of RWPs in the high anomaly area is shown in Figure 4. The RWPs gradually “increased → decreased → increased → decreased” on 14 April before the earthquake and reached the peak value of 9.19 on 13 June. Then, after reaching the peak on 10 June, an Ms5.2 earthquake occurred. It indicates the obvious changes in the RWPs in the months prior to the earthquake, giving an effective clue for the prediction of the earthquake. Additionally, the changes in the range and value of the fault anomaly area of the main ridge of the Great Khingan before and after the earthquake were noted.
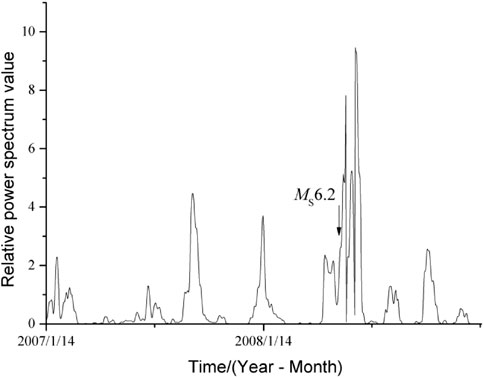
FIGURE 2. Regional mean time sequence diagram of the Hunchun Ms6.2 earthquake in Jilin on 19 May 2008.
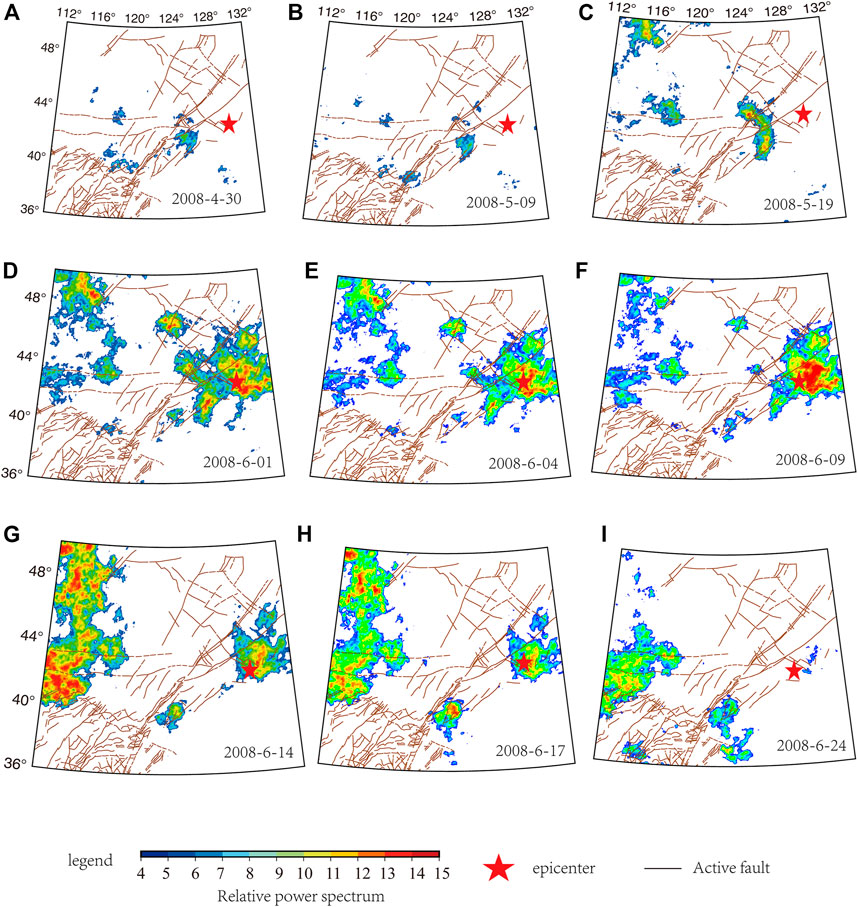
FIGURE 3. Time-space evolution of the RWPs of the Ms5.2 earthquake (red star) in Arong Banner, Inner Mongolia, on 10 June 2008.
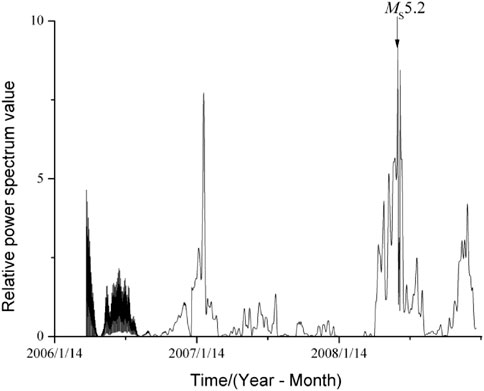
FIGURE 4. Historical time sequence diagram of the regional mean value of the high brightness temperature anomaly of the Ms5.2 earthquake in Arong Banner, Inner Mongolia, on 10 June 2008.
Understanding the genesis of mountain geology can help researchers understand the structural characteristics of the earthquake and better explain the prediction results.
(3) The Ms6.4 earthquake that occurred in Linkou County, Heilongjiang Province, on 2 January 2016 had a focal depth of 580 km, making it a deep earthquake. Calculating and scanning the TIR data before the earthquake, Figure 5 shows that the 5th frequency band presented a significantly abnormally high TIR value. The anomaly occurred at the Kubin River fault on 16 October 2015. On 23 October, the amplitude of the RWPs increased in the anomaly area, and then, the anomaly extended southward along the Kubin River fault. The abnormal area and amplitude continued to increase. On 25 October, the abnormal amplitude reached the maximum and then gradually declined until 31 October 2015, when the anomaly disappeared. The duration of the anomaly was 16 days. Sixty-four days later, the Ms6.4 earthquake occurred in Linkou County, Heilongjiang Province, with the epicenter at the edge of the abnormal area, near the Muling River segment crack. The time-series curve of RWPs in the high-anomaly area is shown in Figure 6. The results showed that there had been four periods of high RWPs in the high-anomaly area since 2011. The high value began to appear at the end of August 2015, before the earthquake, and the RWPs gradually increased → decreased → increased → decreased and reached a peak of 6.21 on 5 June. There was a significant thermal anomaly in the early stage of the Ms6.4 earthquake in Linkou County, and it is worth studying the TIR data before the earthquake and the thermal anomaly mechanism during the deep earthquake.
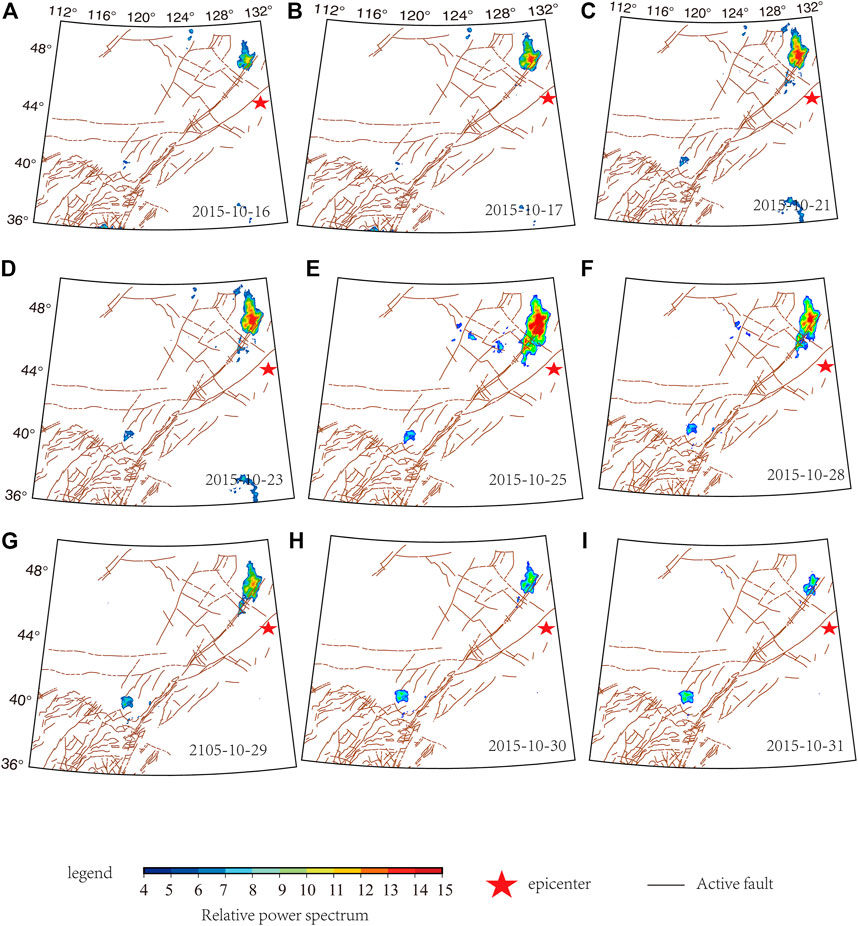
FIGURE 5. Time-space evolution of the RWPs of the Linkou Ms6.4 earthquake (red star) in Heilongjiang on 2 January 2016.
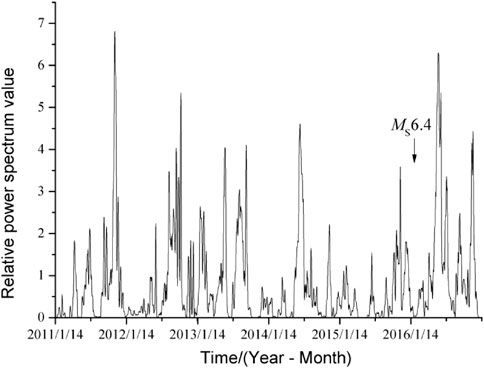
FIGURE 6. Historical time sequence diagram of the regional mean value of the high brightness temperature anomaly in the Linkou Ms 6.4 earthquake on 2 January 2016.
The Songyuan area is located in the central and western parts of Jilin Province. It is located in the central depression belt and southeast uplift belt in the southern part of the Songliao Fault Basin. The Songliao Basin is the largest Mesozoic and Cenozoic continental sedimentary basin in Northeast China. The direction of the basin basement structure and the neotectonic line is NNE. During the Cenozoic, the internal faults in the basin were still active. The main faults are the second Songhuajiang fault in the northwest direction and the Fuyu–Zhaodong, Yilian–Yitong, and Mishan–Duhua faults in the northeast direction (Figure 7). Those faults are Quaternary active faults. These faults and their intersections are the structural conditions for the occurrence of shallow-source moderate earthquakes in the Songyuan area. The Ms4.9 earthquake in 2017, the Ms5.7 earthquake in 2018, and the Ms5.1 earthquake in 2019 occurred successively in the Songyuan area in recent years. However, before the Songyuan Ms5.1 earthquake in 2019, there was no obvious thermal anomaly, suggesting that the greatest amount of greenhouse gases were released in the basin before and after the previous two earthquakes. Based on the aforementioned studies, the TIR of the previous two earthquakes in this area can be researched and analyzed.
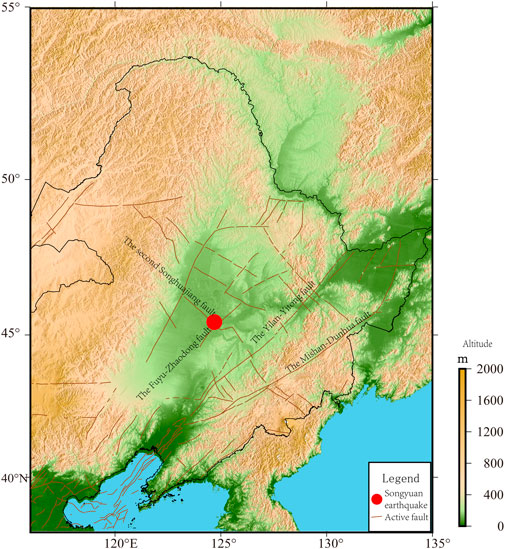
FIGURE 7. Geological structure map of the Songyuan area. The epicenters of the three Songyuan earthquakes (red circles, Ms4.9 earthquake in 2017, Ms5.7 earthquake in 2018, and Ms5.1 earthquake in 2019) and the main active faults in the study area. The black circle represents the Jilin Songyuan Oil and Gas field.
An Ms4.9 earthquake occurred in Songyuan on 23 July 2017, with a focal depth of 12 km and an epicenter located at 45.3°N, 124.81°E. Scanning the aforementioned area, we found that the RWPs of the 5-band wavelet (Figure 8) gradually increased before the earthquake after 1 June 2017, and the high-value areas expanded on 20 June. The anomalies of amplitude and area reached a maximum on 5 July, and then gradually attenuated. The earthquake occurred on 23 July, until the high value disappeared on 27 July, and the abnormality lasted for more than a month. Analyzing the temporal and spatial evolution of the TIR anomaly, we found that the RWPs of the TIR brightness temperature data were significantly abnormal, and the abnormal change lasted for some time before and after the earthquake. The TIR anomaly was relatively large, and the shape was more prominent before the earthquake. The whole anomaly evolution followed this process: normal background → anomaly appearance → anomaly enhancement → reaching maximum → anomaly attenuation → earthquake → anomaly disappearance. From Figure 8, it can be clearly seen that the infrared radiation presented little change in the initial stage and slowly increased in the elastic stage. The plastic anomaly gradually returned to the normal background value from the maximum value. The Songyuan Ms4.9 earthquake occurred on 23 July, at the edge of the abnormal area on the 18th day after the peak.
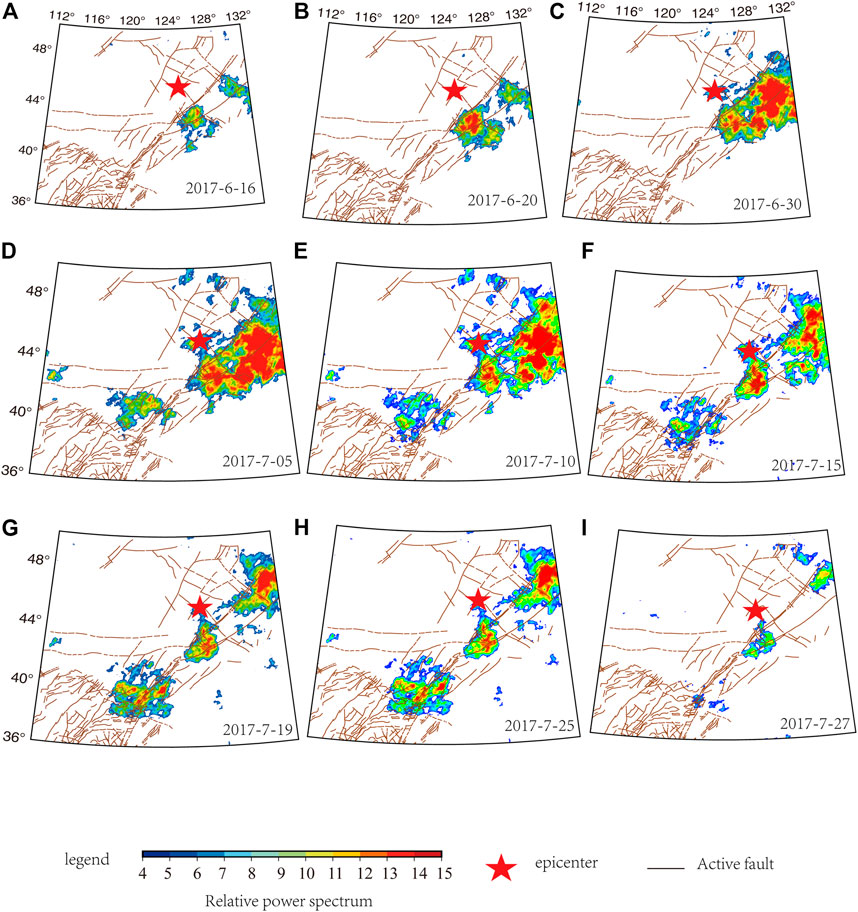
FIGURE 8. Time-space evolution of the 5th frequency band RWP anomalies before the Songyuan Ms4.9 earthquake (red star) on 23 July 2017.
In the same area, an Ms5.7 earthquake occurred in Songyuan Jilin Province on 28 May 2018. The calculation results showed that 1 week before the earthquake, the RWPs had an abnormal phenomenon around the Jilin-Fengman fault that exceeded the background value. When the time of earthquake occurrence approaches, anomalies expanded along the second Songhuajiang fault in the NW direction, and the anomalies’ amplitude gradually increased. After the earthquake occurred, the amplitude and area of the anomaly gradually increased, and in the following month, the anomaly gradually weakened.
The spatiotemporal evolution images of the RWPs in six frequency bands were checked. The 5th frequency band showed significant TIR anomalies before the Songyuan Ms5.7 earthquake (Figure 9). Figure 9 shows that in mid-May 2018, the brightness temperature anomalies first appeared in the Jilin–Fengman fault zone. The initial anomaly amplitude was weak, and the anomaly area was small at the beginning. Then, the anomaly area extended along the Tanlu fault zone. The anomaly area gradually enlarged on 27 May. The Songyuan Ms5.7 earthquake occurred at a distance of approximately 200 km from the anomaly area on 28 May. After the earthquake, the anomaly area further expanded. The anomaly area and amplitude reached a maximum peak in the area on 12 June and then gradually shrank. The anomaly disappeared on 17 June.
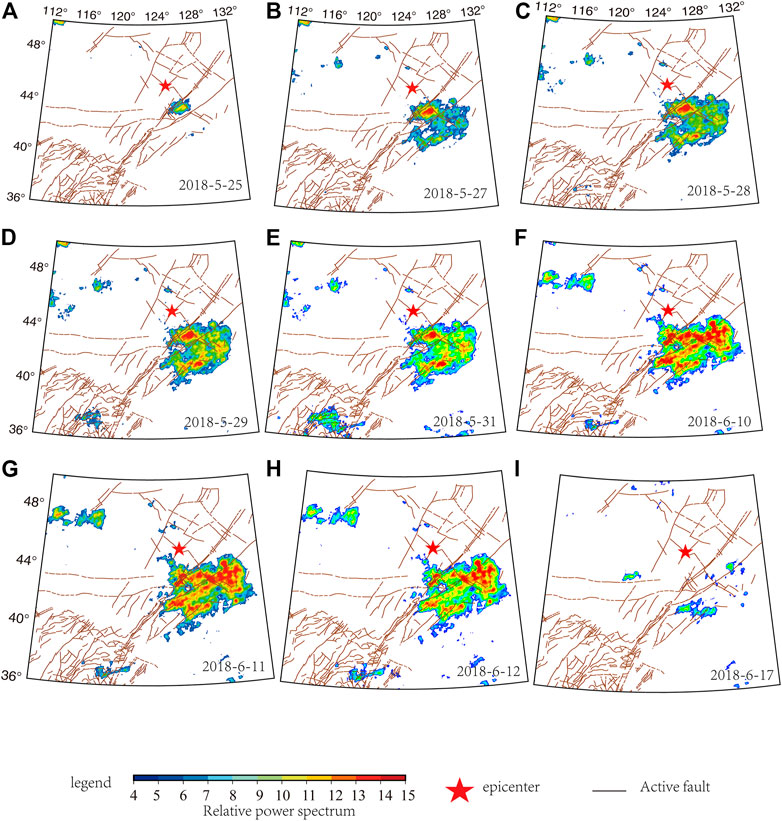
FIGURE 9. Time-space evolution of the 5th frequency band RWP anomalies before the Songyuan Ms5.7 earthquake (red star) on 28 June 2018.
After the two Songyuan earthquakes occurred in the same abnormally high brightness temperature area, the historical time sequence diagram of the regional mean value of the high brightness temperature abnormal area was extracted to present the abnormal amplitude more clearly. It can reflect the duration of the anomaly and the relative rate of change. Therefore, the mean value of the RWPs was extracted in the 0.5° × 0.5° range of the significantly abnormal area. The background value and standard deviation of the power spectrum were calculated to form a time-series curve.
In order to analyze the change process of the TIR brightness temperature power spectrum before and after the Songyuan Ms4.9 and Ms5.7 earthquakes, the average value of the high-value area of the power spectrum was studied. The time sequence of the relative amplitude changes can be seen in Figure 10. Since 2012, the relative amplitude of the average power spectrum of the study area brightness temperature has been higher than six times the mean value (normal background value) five times from 2013 to 2018. For the Songyuan Ms4.9 earthquake, the average RWP amplitude of brightness temperature was higher in the significantly abnormal region only from June to July 2017. The RWP amplitude was greater than 4 from 19 June, and the abnormality continued for 32 days. On 21 July, the RWP amplitude dropped to 1.62, and the amplitude was 0.63 on the day of the earthquake on 23 July. After the earthquake, the amplitude returned to the normal background level.
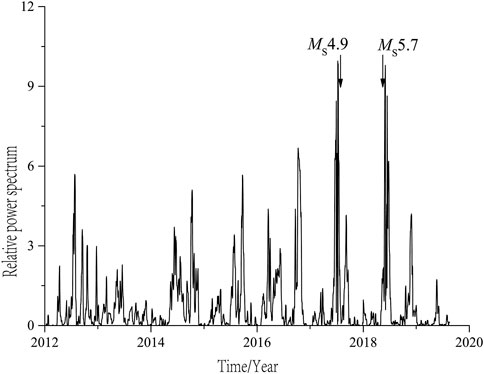
FIGURE 10. Time sequence diagram of regional historical mean value of abnormal high brightness temperature of the two earthquakes in Songyuan, Jilin. (1) Time series curve of mean RWPS in Ms5.7 Songyuan seismic anomaly area. (2) Time series curve of mean RWPS in Ms4.9 Songyuan seismic anomaly area.
Similarly, the relative amplitude was 4.04 on 26 May 2018 for the Songyuan Ms4.9 earthquake, and the relative amplitude reached 6.13 on 27 May. The relative amplitude was 8.22 on 28 May when the earthquake occurred. After the earthquake, the relative amplitude continued to increase. It reached a peak of 12.36 on 12 June, and then, the relative amplitude declined until it returned to 6.01 on 27 June. The Songyuan earthquake occurred in the continuously strengthening stage. There was an obvious anomaly around the Jilin–Fengman fault zone on 25 May 2018. Closer to the time of the earthquake, the anomaly area extended to the epicentral area. The entire anomaly process lasted only 3 days before the earthquake, but the increased abnormal area and amplitude continued for 1 month, after the earthquake when the abnormality recovered. Based on the previous earthquake example results and experience, the occurrence of two Songyuan earthquakes at different stages of amplitude may be related to the rate of stress accumulation in the epicenter areas.
The overall characteristics of the thermal anomalies of 22 earthquakes with a magnitude above Ms4.9 were summarized (Table 1). The spatio-temporal characteristics of thermal anomalies have certain indicative significance, including 1) more than 18% of the examples showed thermal anomalies before and after the earthquake with a missed detection rate of 82% and a total of 38 anomalies since 2006 with a false detection rate of 84%; 2) there are obvious periodicity and amplitude patterns of thermal anomalies before and after earthquakes; 3) there is no corresponding relationship between the size of the thermal anomaly area and the intensity of the earthquake; 4) there is no significant difference between shallow and deep earthquakes in terms of thermal anomalies. In terms of spatial evolution, the probability of earthquake occurrence is higher at the edge of the thermal anomaly area, and the epicenter is often located in the transition zone between the appearance and disappearance of the anomaly. In terms of time series, the duration of earthquake thermal anomalies is between approximately 1 month and half a year. Most earthquakes occurred during the high-value rise or fall stage (turning point signal). The advantages of TIR research for site prediction include fast information acquisition and spatiotemporal dynamic monitoring. Large-scale thermal infrared anomaly scanning can be conducted in the Northeast region, and local areas with high RWP values can be selected for planar scanning.
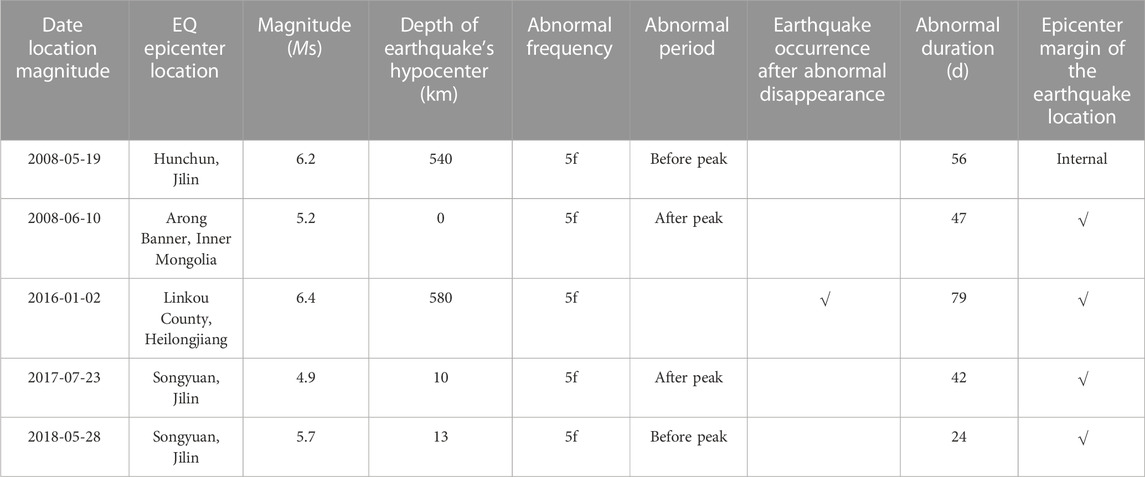
TABLE 1. Analysis of corresponding TIR anomalies before five earthquakes in the study area.
Guo et al. (2010) studied the TIR anomalies in the northwestern edge of the Tarim Basin before the Jiashi-Bachu Ms6.8 earthquake in 2003. Xie et al. (2015b) studied the Yutian, Xinjiang Ms7.3 earthquake in 2014 and found that anomalies began to appear in the western segment of the western marginal fault zone in the Tarim Basin, and then, the anomaly area further expanded and migrated to the fault zone, eventually formed an abnormal banding area along the fault zone around the Tarim Basin. Zhang et al. (2010) studied the characteristics of the TIR anomalies surrounding the Milin Ms6.9 earthquake in Tibet in 2017 and found that this phenomenon was more consistent with the distribution of geothermal resources. Previous studies by experts and scholars have shown that the satellite TIR anomalies before earthquakes are related to the basins rich in geothermal resources. This is a positive answer to the seismic TIR genesis. Therefore, Qiang et al. (2010) proposed the seismic basin effect that clearly supported the earth deflation theory.
The latest theory on the TIR anomaly characteristics of medium-to-strong earthquakes suggests that short-term horizontal strain and vibration within the tectonic fault zone prior to earthquakes can result in the rupture and fragmentation of underground rocks, leading to the release of a large amount of energy and causing changes in surface temperature (Zhang L. F. et al., 2020; Li et al., 2020; Han et al., 2018; Chen et al., 2019; Qin et al., 2019). Furthermore, tectonic activity can cause an increase in the amount of subterranean gas emitted, and the gas can surface and cause an increase in surface temperature, leading to TIR anomalies. Prior to an earthquake, the stresses at the fault zone intensify, and as the stress increases, underground rocks fracture and break, releasing heat and causing changes in surface temperature. Additionally, as tectonic activity intensifies, the amount of subterranean gas released will also increase, and these gases will spread through the surface, causing thermal infrared anomalies (Zhao et al., 2021; He et al., 2020; Zhou et al., 2019; Xu et al., 2019; Fang et al., 2017). Throughout the entire process of earthquake precursors, the characteristics of TIR anomalies are displayed as a process of “abnormal occurrence → strengthening → peak → weakening → abnormal disappearance → earthquake occurrence.” The physical parameters of rocks, such as thermal conductivity, heat capacity, and coefficient of thermal expansion, may also affect the characteristics of TIR anomalies prior to earthquakes. In summary, the TIR anomaly characteristics of medium-to-strong earthquakes are a prognostic manifestation prior to an earthquake, and monitoring and analyzing them can provide valuable information for earthquake prediction. However, it should be noted that TIR anomalies may also be influenced by other factors, such as meteorological factors. Therefore, it is necessary to carefully analyze the possibility of various factors affecting TIR anomalies when monitoring and identifying them to enhance the accuracy and reliability of monitoring.
The Songliao Basin is rich in oil and gas, and the faults around the basin are highly developed. The enhancement of stress is conducive to the acceleration of the gas with relatively high underground temperature along the existing or new fractures, and that gas causes the surface temperature to change. It may be that these factors caused the thermal anomalies distributed along the better-developed Jilin–Fengman fault zone before the Songyuan earthquake. In order to illustrate the possibility of the seismic basin effect, the two earthquakes that occurred in the periphery of the Songliao Basin were analyzed in 2017 and 2018.
Before an earthquake, the abnormal temperature increase phenomenon in the epicenter and adjacent areas has been confirmed by many observation results. At the same time, many experts have also found that long-term continuous temperature field changes reflect the activities of faults and large-scale linear structures in the crust (Qu et al., 2006; Ma et al., 2006; Chen et al., 2006; Qiang et al., 2009; Carreno et al., 2001). When the stress approaches the critical state of rock rupture, the number of cracks penetrating the surface increases, and the crustal gas overflows prior to the earthquake. Because of the increase in cracks, the heat convection between the underground rock layer and the surface is strengthened. It may be a combination of these factors that concentrate the TIR anomaly regions before the earthquake near the epicenter and adjacent areas and distribute them along the faults (Qiang et al., 1991; Qiang et al., 1992; Tronin, 1996; Tronin, 2000). Many researchers who have examined these phenomena have pointed out that areas with geothermal and oil and gas enrichment are more prone to thermal anomalies before an earthquake.
This study applied the brightness temperature data of the China Geostationary Meteorological Satellite FY-2C/E/G collected between January 2006 and May 2019 with an effective observation range of 35°–50°N and 110°–135°E. The study used the wavelet transform and RWP methods to analyze and study the brightness temperature data. Based on the analysis of thermal anomalies before and after the two Songyuan earthquakes, the following characteristics are summarized: 1) The RWPs of the brightness temperature data on the two earthquakes were significantly abnormal, and the abnormal initial amplitude and area were small. The anomaly first appeared at the intersection of the Yilan–Yitong and the Mishan–Dunhua faults, and then, the anomaly area gradually expanded, and the overall abnormality showed an increasing trend that was consistent with the distribution of the northern part of the Tanlu fault zone and finally formed an abnormal area distributed in a band. When the abnormal area reached the maximum peak value, it gradually shrank until it disappeared. The abnormal shape was persistent in the time domain and roughly experienced two stages of initial warming and enhanced warming, with a duration of more than 30 days. The abnormal area moved and expanded along the direction of the fault and increased rapidly. The epicenter did not appear in the largest anomaly area but was distributed on the edge of the basin, which might be related to the geological structure and underground environment near the epicenter. 2) The characteristic power spectrum amplitude of the abnormal area was up to 12 times higher than the average value. The abnormal peak value occurred before the earthquake; the earthquake occurred after the abnormal high value decreased. This is the time period when earthquakes are more likely to occur in most earthquake cases. The evolution direction and abnormal peak value characteristics could provide some clues for determining the occurrence time of future earthquakes and tracking the epicenter location.
Therefore, through the analysis of earthquake cases, the overall characteristics of thermal anomalies obtained from the aforementioned earthquakes are summarized. The spatial and temporal characteristics of thermal anomalies are more indicative, showing that there are obvious periods and amplitudes of thermal anomalies before and after earthquakes. There is no correlation between the area of thermal anomaly and its intensity. There is no significant difference between shallow and deep source earthquakes in terms of thermal anomalies. From the spatial evolution characteristics, the seismic probability of the edge of the thermal anomaly area is high. The epicenter is mostly located in the transitional zone between abnormal appearance and disappearance. From the perspective of time series, the duration of seismic thermal anomaly is approximately 1 month to half a year, and the situation is not the same in different regions. Most earthquakes occur in the stage of high-value rising or falling (turning signal).
In a word, TIR precursor anomalies are obviously related to the incubation, occurrence, and development of earthquakes, as well as to the time and location of earthquakes in this area. The abnormal morphological characteristics, evolution processes, and time series curves are all highly representative. We need to continuously improve data processing methods and enhance the accuracy of earthquake predictions in order to achieve greater effectiveness in earthquake prevention and disaster reduction.
The datasets presented in this study can be found in online repositories. The names of the repository/repositories and accession number(s) can be found at: http://satellite.nsmc.org.cn/portalsite/default.aspx.
ML analyzed these earthquake cases and wrote the manuscript. ZZ is the corresponding author of this article and was responsible for the operation of the processing program and image editing. XK and SY created figures and illustrations. MJ provides guidance on the overall thinking of article writing and the methods and theories used in the article. All authors performed the research, analyzed the results, and approved the manuscript. All authors contributed to the article and approved the submitted version.
This work was supported by the Science and Technology Project of Liaoning Earthquake Administration (grant number 2022035 and 202218), the China Earthquake Administration Earthquake Tracking Program (grant number 2023010407 and 2023010102), the Special Fund of the Institute of Geophysics, China Earthquake Administration (grant number DQJB21B34), the Special Fund of the National Institute of Natural Hazards, Ministry of Emergency Management of China (grant number ZD2019-16) and Open Fund for Earthquake Forecasting (XM15200700120230188).
Part of the geostationary satellite data in this study was provided by the National Satellite Meteorological Center of the China Meteorological Administration, and Yuansheng Zhang, a researcher from the Earthquake Administration of Gansu Province, provided the thermal infrared data analysis and calculation software. The authors would like to express their heartfelt gratitude.
The authors declare that the research was conducted in the absence of any commercial or financial relationships that could be construed as a potential conflict of interest.
All claims expressed in this article are solely those of the authors and do not necessarily represent those of their affiliated organizations, or those of the publisher, the editors, and the reviewers. Any product that may be evaluated in this article, or claim that may be made by its manufacturer, is not guaranteed or endorsed by the publisher.
Asteriadis, G., and Livieratos, E. (1989). Pre-seismic responses of underground water level and temperature concerning a 4.8 magnitude earthquake in Greece on october 20, 1988. Tectonophysics l70, 165–169. doi:10.1016/0040-1951(89)90111-x
Carreno, E., Capote, R., Yague, A., Tordesillas, J. M., Lopez, M. M., Ardizone, J., et al. (2001). Observations of thermal anomaly associated to seismic activity from remote sensing. Portuga1: Genera1 Assembly of European Seismology Commission, 265–269.
Chen, S. Y., Liu, P. X., Liu, L. Q., Ma, J., and Chen, G. Q. (2006). Wavelet analysis of thermal infrared radiation of land surface and its implication in the study of current tectonic activities. J. Chin. J. Geophys. 49 (3), 717–723. doi:10.1002/cjg2.886
Chen, S. Y., Ma, J., Liu, P. X., and Liu, L. Q. (2009). A study on the normal annual variation field of land surface temperature in China. J. Chin. J. Geophys. 52 (9), 962–971. doi:10.1002/cjg2.1421
Chen, S. Y., Ma, J., Liu, P. X., Liu, L. Q., and Chen, G. Q. (2004). Normal annual variation field of land surface brightness temperature in China. J. Seismol. Geol. 26 (3), 528–538.
Chen, X., Li, J., and Guo, N. (2019). Characteristic analysis of satellite thermal infrared anomalies before the Wenchuan Ms8.0 earthquake. Chin. J. Geophys. 62 (12), 4900–4911.
Dai, Y., Gao, L. X., Yang, Y. M., Wan, J. Z., Deng, L. L., Zhou, Z. Y., et al. (2016). Chikusetsusaponin V attenuates lipopolysaccharide-induced liver injury in mice. J. Earthq. 36 (2), 167–174. doi:10.3109/08923973.2016.1153109
Dong, X. D., Zhu, Z. P., Xu, W., Li, L., and Zhang, H. P. (2017). Thermal infrared remote sensing for earthquake prediction: A case study in south-west China. J. Geophys. Eng. 14 (3), 513–523.
Fang, H., Wang, J. P., Huang, X., Zhang, X. L., and Liu, Q. (2017). Statistical analysis of the thermal anomalies detected by satellite sensors before the 2013 Lushan Ms7.0 earthquake in China. Seismol. Res. Lett. 88 (1), 197–203.
Guo, X., Zhang, Y. S., Wei, C. X., Zhong, M. J., and Zhang, X. (2014). Medium wave infrared brightness anomalies of wenchuan 8.0 and zhongba 6.8 earthquakes. J. Acta Geosci. Sin. 35 (3), 338–344.
Guo, X., Zhang, Y. S., and Zhong, M. J. (2010). Variation characteristics of OLR for the wenchuan earthquake. J. Chin. J. Geophys. 53 (11), 2688–2695.
Han, Z., Chen, Y., Zhang, X., Liang, J., Ruthel, G., Berry, C. T., et al. (2018). Host protein BAG3 is a negative regulator of lassa VLP egress. J. Geophys. Eng. 15 (1), 64–73. doi:10.3390/diseases6030064
He, Q., Chen, J., Wang, J., Peng, W., and Zhang, P. (2020). Integrated application of multi-source remote sensing data for monitoring pre-earthquake thermal anomalies: A case study of the 2019 M6.0 changning earthquake. Remote Sens. 12 (12), 1931.
Kang, C. L., Liu, D. F., Jing, F., Xiong, P., and Cao, Z. Q. (2011). Study on the indication of infrared radiation prior to impending strong earthquakes. J. Prog. Geophys. 26 (6), 1897–1905.
Kumar, P., and Foufoula, E. J. (1997). Wavelet analysis for geophysical applications. J. Rev. Geophy. 35, 385–412. doi:10.1029/97rg00427
Li, T., Jin, S., Li, X., Zhou, M., and Xiong, C. Y. (2019). Stability analysis of sample data systems with input missing: A hybrid control approach. J. Earth Sci. 30 (1), 116–122. doi:10.1016/j.isatra.2019.01.009
Li, Y., Li, W., Shi, Z., Wang, H., and Yang, C. (2020). Investigation of thermal infrared anomaly associated with the Jiuzhaigou Ms7.0 earthquake, China. Nat. Hazards 103 (2), 2047–2056.
Liu, S. J., Wu, L. X., Li, J. P., Dong, Y. Q., and Ma, B. D. (2007). Features and mechanisms of the satellite thermal infrared anomaly before hengchun earthquake in taiwan region. J. Sci. Technol. Rev. 25 (6), 32–37.
Lv, Q. Q., Ding, J. H., and Cui, C. Y. (2000). Possible satellite thermal infrared anomalies before the Zhangbei M6.2 earthquake on January 10, 1998. J.Acta Seismol. Sin. 22 (2), 183–188+219.
Ma, J., Chen, S. Y., Liu, P. X., Wang, Y. P., and Liu, L. Q. (2006). Temporal-spatial variations of associated faulting inferred from satellite infrared information: A case study of the N-S seismo-tectonic zone in China. J. Chin. J. Geophys. 49 (3), 707–716. doi:10.1002/cjg2.885
Qiang, Z. J., Kong, L. C., and Wang, G. (1992). Earth gas emis-Sion,Infrared thermo-anomaly and seismicity. J. Chin. Sci. Bull. 37 (24), 2259–2262. doi:10.1360/csb1992-37-24-2259
Qiang, Z. J., Lin, C. G., and Li, L. Z. (1998). Brightness temperature anomalies of satellite thermal infrared image: Short-term and impending earthquakes. J. Sci. China(Series D) 28 (6), 564–573.
Qiang, Z. J., Ma, G. N., Zeng, Z. X., and Wang, J. (2010). A study of the method of satellite thermal infrared earthquake prediction in imminence. J. Earth Sci. Front. (5), 254–262.
Qiang, Z. J., Xu, X. D., and Lin, C. G. (1991). Thermal infrared anomaly precursor of impending earthquake. J. Sci. Bull. Engl. Version. 1991 (4), 319–323.
Qiang, Z. J., Yao, Q. L., Wei, L. J., Zeng, Z. X., and Guo, J. F. (2009). The characteristic of current stress hot field by satellite thermal infrared image in China. J. Acta Geosci. Sin., 873–884.
Qin, Y., Zhang, B., and Zhang, L. (2019). Analysis of thermal infrared anomaly characteristics before the Yutian Ms6.3 earthquake on August 8, 2019, Xinjiang, China. J. Earth Sci. 30 (6), 1242–1247.
Qu, C. Y., Shan, X. J., and Ma, J. (2006). Formation cause of thermal infrared high temperature belt along honghe fault and its relation to earthquake. J. Acta Seismol. Sin. 28 (1), 91–97.
Torrence, C., and Compo, G. P. (1998). A practical guide to wavelet analysis. J. Bull. Amer. Meteorol. Soc. 79 (6), 61–78. doi:10.1175/1520-0477(1998)079<0061:apgtwa>2.0.co;2
Tronin, A. A., Hayakawa, M., and Molchanov, O. A. (2002). Thermal IR satellite data application for earthquake research in Japan and China. J. Geodyn. 33, 519–534. doi:10.1016/s0264-3707(02)00013-3
Tronin, A. A. (1996). Satellite thermal survey—A new tool for the study of seismoactive regions. Int. J. Remote Sens. 17, 1439–1455. doi:10.1080/01431169608948716
Tronin, A. A. (2000). Thermal IR satellite sensor data application for earthquake research in China. Int. J. Remote Sens. 21, 3169–3177. doi:10.1080/01431160050145054
Wang, J. P., Zhang, Y. J., Feng, X., Wu, Y., and Wang, Q. Y. (2018). Identification of thermal infrared anomalies before earthquakes based on fuzzy clustering algorithm. Remote Sens. Lett. 9 (10), 966–975.
Xie, T., Zheng, X. D., Kang, C. L., Lu, J., and Ma, W. Y. (2015b). Possible thermal brightness temperature anomalies associated with the yutian, Xinjiang MS7.3 earthquake on february 12,2014. J. Earthq. Res. China 31 (1), 101–109.
Xie, T., Zheng, X. D., Kang, C. L., Ma, W. Y., and Lu, J. (2015a). Possible thermal brightness temperature anomalies association with the lushan(China) M7.0 earthquake on 20 April 2013. J. Seismol. Geol. 37 (1), 149–161.
Xu, X. D., and Xu, B. H. (2013). The infrared warming abnormality analysis of Lushan earthquake. J. Earth Sci. Front. 2013 (3), 25–28.
Xu, X., Ruan, X. D., Huang, Y., Ge, X. J., and Zhang, X. L. (2020). Mining thermal anomaly data of active faults from satellite hybrid observations for earthquake prediction. IEEE Trans. Geoscience Remote Sens. 58 (2), 963–977.
Xu, X., Ruan, X. D., Huang, Y., Li, L., and Li, L. (2019). Analysis of thermal infrared anomaly characteristics of active faults and fractures on Earth's surface by a new remote sensing model. IEEE Access 7, 121491–121500.
You, C. X. (1990). Anomalous variations of ground temperature before Lanchang-Gengma earthquake. J. Seismol. Res. 2, 196–202.
Zhang, L. F., Wang, P. L., Zhang, P. T., and Sun, X. H. (2020). Thermal infrared anomalies before Milin MS6.9 earthquake in 2017. J. China Earthq. Eng. J. 42 (2), 360–367.
Zhang, X. J., Li, Y., Wang, H. X., Lu, J., and Zhang, Y. B. (2021). Investigation of the relation between the anomaly of active faults and underground water using infrared technology. J. Appl. Remote Sens. 15 (1), 016524.
Zhang, X., Zhang, Y. S., Wei, C. X., Tian, X. F., Tang, Q., and Gao, J. (2013). Analysis of thermal infrared anomaly before the lushan Ms7.0 earthquake. J. China Earthq. Eng. J. 35 (2), 272–277.
Zhang, Y. S., Guo, X., Zhong, M. J., Shen, W., Li, W., and He, B. (2010). Wenchuan earthquake: Brightness temperature changes from satellite infrared information. J. Chin. Sci. Bull. 55 (18), 1917–1924. doi:10.1007/s11434-010-3016-8
Zhang, Y. S., Shen, W. R., and Xu, H. (2002). Satellite thermal infrared anomaly before the xinjiang-qinghai border M8.1 earthquake. J. Northwest. Seismol. J. 24 (1), 1–4.
Zhao, B., Li, J., Lin, F., Zhang, L., and Song, C. H. (2021). Thermal infrared anomaly analysis of the 2020 ML 5.8 Qinghai earthquake, China. Geomatics, Nat. Hazards Risk 12 (1), 1327–1346.
Keywords: earthquakes, northeast of China, brightness temperature, thermal infrared anomaly, relative wavelet power spectrum
Citation: Li M, Zhang Z, Yang S, Kong X and Jiao M (2023) Research on thermal infrared anomaly characteristics of moderate strong earthquakes in northeast China. Front. Earth Sci. 11:1082707. doi: 10.3389/feart.2023.1082707
Received: 28 October 2022; Accepted: 20 April 2023;
Published: 10 August 2023.
Edited by:
Mourad Bezzeghoud, Universidade de Évora, PortugalReviewed by:
Qingyan Meng, Chinese Academy of Sciences (CAS), ChinaCopyright © 2023 Li, Zhang, Yang, Kong and Jiao. This is an open-access article distributed under the terms of the Creative Commons Attribution License (CC BY). The use, distribution or reproduction in other forums is permitted, provided the original author(s) and the copyright owner(s) are credited and that the original publication in this journal is cited, in accordance with accepted academic practice. No use, distribution or reproduction is permitted which does not comply with these terms.
*Correspondence: Zhihong Zhang, NTY4OTUwNjEyQHFxLmNvbQ==
Disclaimer: All claims expressed in this article are solely those of the authors and do not necessarily represent those of their affiliated organizations, or those of the publisher, the editors and the reviewers. Any product that may be evaluated in this article or claim that may be made by its manufacturer is not guaranteed or endorsed by the publisher.
Research integrity at Frontiers
Learn more about the work of our research integrity team to safeguard the quality of each article we publish.