 Tor O. Sømme1,2*
 Simone Isabelle Huwe1
 Ole J. Martinsen1Pål Trygve Sandbakken1
 Jakob Skogseid1Lucas A. Valore2
- 1Equinor ASA, Oslo, Norway
- 2Department of Earth Science, University of Bergen, Bergen, Norway
Seismic geomorphology and stratigraphic analysis can reveal how source-to-sink systems dynamically respond to climatic and tectonic forcing. This study uses seismic reflection data from the Norwegian Sea to investigate the stratigraphic response to a short-lived (0.2 Myr) period of climate change during the Paleocene-Eocene Thermal Maximum (PETM), superimposed on a long-lived (∼8 Myr) period of hinterland uplift. The data show that long-term uplift resulted in ∼300 m of relative sea-level fall, forced regression and formation of incised valleys during the latest Paleocene-earliest Eocene. The short-lived PETM climate perturbation at ∼56 Ma changed the transport dynamics of the system, allowing sediment to be bypassed to wide channel complexes on the basin floor, feeding a large mud-rich basin-floor fan more than 50 km into the basin. Our analysis also suggest that sediment supply was up to four times higher during the PETM compared to earlier and later periods. Maximum regression at ∼55.5 Ma resulted in the formation of a subaerial unconformity. The style of subaerial incision was dictated by shelf accommodation and proximity to the area of direct sediment input. Out-of-grade shelves and slopes sourced by littoral drift were prone to incision, but direct-fed and graded shelves and slopes were not. Despite maximum regression, sediments were not transported significantly beyond the toe-of-slope aprons, suggesting that rapid climate change was more efficient in bypassing sediment to the deep-water than low stands of sea level. As long-term accommodation increased after the PETM, deltas were still able to reach shelf edge, but periods of maximum regression were not associated with deep incisions along the outer shelf and only smaller canyons and gullies formed. The shelf-slope wedge was finally transgressed at ∼51 Ma. The age of deep valley incisions overlaps with the time of subaerial erosion in the East Shetland and Faroe-Shetland basins, suggesting a common mechanism for North Atlantic uplift around 55–56 Ma. Other seismic stratigraphic surfaces do not seem to be regionally time-equivalent, highlighting the importance of local controls on internal architecture of shelf-slope wedges. This study demonstrates the high-resolution stratigraphic response to long- and short-term external forcing together with intrinsic processes and can help identify similar relationships in other areas.
Introduction
The stratigraphic record along continental margins captures the long-term interplay between allogenic tectonic and climatic forcing, autogenic dynamics, and environmental processes acting upon the sedimentary routing system. The environmental signals that result from such allogenic forcings or controls are expressed by changes in erosion, transport and deposition of sediment along the system (Tofelde et al., 2021). Although the ‘ideal’ stratigraphic response to allogenic forcing can be investigated in numerical stratigraphic models or flume tank experiments where boundary conditions are well known (Jerolmack and Paola, 2010; Armitage et al., 2011; Straub, 2019), natural systems are often more difficult to decipher. However, several studies have documented Milankovitch-driven climate signals in Pliocene-Pleistocene deep-water systems where the impact of tectonic processes often is small (Goodbred, 2003; Ducassou et al., 2009; Gong et al., 2018; Cullen et al., 2021). But separating short-lived climate signals from more long-lived tectonic signals in ancient greenhouse systems can be more challenging since the configuration of the original sediment routing system changes with time and because signals tend to overlap in time and space and become difficult to distinguish from more local environmental and autogenic processes (Muto et al., 2007; Hajek and Straub, 2017; Blum et al., 2018). In addition, the role of shallow-marine systems as conveyers of environmental signals to deep-marine basins may have been different during greenhouse times since shelf configurations and the amplitude and frequency of climatic fluctuations have varied throughout the Phanerozoic (e.g., Sømme et al., 2009a; Harris et al., 2020; Burgess et al., 2022).
Seismic stratigraphy and seismic geomorphological have the potential to image the interaction between signals resulting from allogenic forcing and more local autogenic and environmental processes (e.g., Bullimore et al., 2005; Ryan et al., 2009; Paumard et al., 2020; Posamentier et al., 2022). The strength of three-dimensional (3D) seismic geomorphology is that it provides: 1) a regional view of the strike and dip response of the routing system, 2) a linkage between sedimentary processes and stratigraphic architecture, and 3) high temporal and spatial resolution, which allows snapshots of closely spaced geological events to be imaged. When geomorphology from extensive seismic reflection datasets is combined with lithological and chronostratigraphic data from wells and two-dimensional (2D) seismic cross-sections, showing changes in stratigraphic stacking pattern and internal architecture, a three-dimensional image of the dynamic response to external forcing can be achieved.
The North Atlantic margin provides an ideal opportunity to apply this approach, as it experienced overlapping climatic and tectonic perturbations during the Paleocene and early Eocene. From ∼65 Ma, the region experienced uplift on the order of hundreds of meters, commonly linked to dynamic topography associated with the Iceland mantle plume (e.g., Nadin and Kusznir, 1995; White and Lovell, 1997; Skogseid et al., 2000; Hartley et al., 2011; Stucky de Quay et al., 2017). The consequence of this regional uplift was a significant increase in sediment supply to the North Atlantic margins, manifested as progradation of thick shallow to deep-marine clastic wedges (e.g., Hartog Jager et al., 1993; Liu and Galloway, 1997; Martinsen et al., 1999; Henriksen et al., 2005; Hovikoski et al., 2021). At the same time, expulsion of methane and carbon dioxide prior to North Atlantic break-up is believed to have been the main driver for the PETM (Svensen et al., 2004; Kjoberg et al., 2017), which was a short-lived (100–200 kyr) climate perturbation (Sluijs et al., 2007a; Li et al., 2022) superimposed on the longer term marginal uplift. Studies of the PETM suggest that this hypothermal event was associated with increased onshore weathering rates, higher seasonal variability in fluvial discharge and change in sediment delivery to shallow and deep-water basins (Pujalte et al., 2015; Carmichael et al., 2017; Rush et al., 2021; Jin et al., 2022), producing a stratigraphic response that can be distinguished from more long-term tectonic forcing (Samanta et al., 2016). Even though the PETM has been recognized several places in wells and outcrops in the North Atlantic (e.g., Beerling and Jolley, 1998; Dypvik et al., 2011; Harding et al., 2011; Kender et al., 2012; Eldrett et al., 2014; Stokke et al., 2021; Jolley et al., 2022), little is known about how the PETM influenced the dynamics of sedimentary systems in this region. However, recent studies from the North Sea suggest increased sediment supply and a change in depositional style during the event (Sømme et al., 2019; Vieira and Jolley, 2020; Jin et al., 2022).
This study aims to investigate the seismic architecture and seismic geomorphology of a ∼8 Myr shallow to deep-marine clastic system in the Froan Basin on the eastern margin of the Norwegian Sea (Figure 1). The intention was to analyze the stratigraphic response of long-term uplift and short-lived climate change in shelf, slope and deep-water settings in a source-to-sink perspective. Individual seismic stratigraphic units, their well-log response, seismic facies, and seismic geomorphology were described and linked to a robust chronological framework. An analysis of the sequence stratigraphic and geomorphological characteristics was performed, and the dynamic changes of the sediment routing system were captured. This dataset represents the only known preserved record of thick Paleocene-early Eocene shallow-marine and shelf sediments on the Norwegian continental shelf and the first documentation of the shallow to deep-marine response to PETM climate change using seismic geomorphology. The stratigraphic response observed here will act as a valuable reference point for other areas that experienced similar changes in forcing conditions in the North Atlantic or elsewhere. Improved knowledge of system response to natural climate fluctuations can also help to understand how anthropogenic influence and global warming may affect active sedimentary systems in the future.
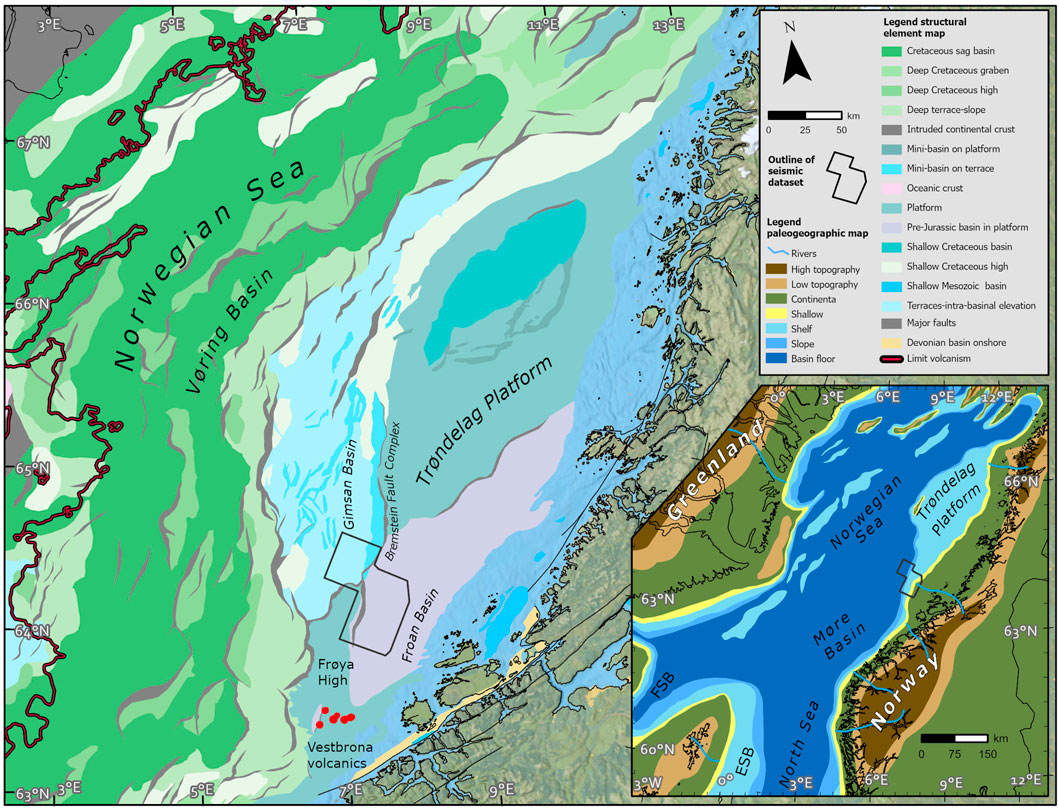
FIGURE 1. Location of the study area in the Froan Basin. Inset map show the paleogeographic situation for the Norwegian Sea and northern North Sea prior to break-up at ∼55 Ma. Structural elements from Gernigon et al. (2021). FSB = Faroe-Shetland Basin, ESB = East Shetland Basin.
The Froan Basin
As a part of the North Atlantic rifted margin (Doré et al., 1999), the Froan Basin and the greater Norwegian Sea (Figure 1) experienced three phases of rifting. The first phase took place in the Late Permian to Early Triassic and was associated with the formation of local rift basins filled by continental and marginal-marine sediments (Blystad et al., 1995; Bunkholt et al., 2021). The second phase occurred during the Middle Jurassic to earliest Cretaceous, resulting in the formation of deep rift basins, hyperextension and local mantle exhumation along the central part of the basin (Osmundsen et al., 2017). These rift basins were filled by shallow and deep-marine clastics derived from local fault blocks and the surrounding hinterland on the Greenland and Norwegian margins (e.g., Lien, 2005; Martinsen, 2005). The third and last rift phase commenced in the middle Campanian and continued until continental break-up and seafloor spreading around 55 Ma (e.g., Eldholm et al., 1989; Færseth and Lien, 2002; Zastrozhnov et al., 2020). Most of the deformation during this last phase of extension was centered along the axis of future break-up (Skogseid et al., 2000), and there is little evidence of rift-related (footwall) uplift of the hinterland east of the rift. Long-lived extension and crustal thinning resulted in thermal subsidence of the Froan Basin and the surrounding Trøndelag Platform, and the area was expressed by a low-relief basin tilted toward the west in the latest Cretaceous to earliest Paleocene.
As in many other North Atlantic regions (e.g., Jolley and Whitham, 2004; Ryan et al., 2009; Mudge, 2014; Hovikoski et al., 2021), the base Paleogene unconformity marks a shift from overall transgression to regression along the Norwegian margin (Martinsen et al., 1999; Gjelberg et al., 2001; Henriksen et al., 2005; Dmitrieva et al., 2017; Sømme et al., 2019). The angular unconformity and the abrupt increase in sediment supply observed in the Paleocene succession are often attributed to dynamic topography and the Icelandic mantle plume (e.g., Dam et al., 1998; Petersen, 2019; Sømme et al., 2019), but other mechanisms such as rift-related deformation and thermal effects related to pulses of volcanism could also have played a role, especially in the vicinity of the outer margin (Guarnieri, 2015; Stoker et al., 2017; Jolley et al., 2021).
High sediment supply and progradation in the North Atlantic was followed by a phase of transgression and backstepping around 55–54 Ma (Mudge and Jones, 2004; Henriksen et al., 2005; Hardman et al., 2018; Sømme et al., 2019). This transgression occurred just after sea-floor spreading at 55 Ma, and regional subsidence following break-up and deflation of the Iceland plume has been suggested to be a driving mechanism for this relative sea-level rise (Nadin and Kusznir, 1995; Hardman et al., 2018).
Prior to the PETM, the Paleocene Froan Basin experienced relative cooling and overall sea-level fall after the warm and humid Late Cretaceous period (Miller et al., 2020). The Froan Basin itself was situated between the relatively steep and high-relief Møre Basin to the south and the low-relief Trøndelag Platform in the North. The proximal part of the marine basin was characterized by a ramp-like morphology, bounded to the west by the Frøya High and the Bremstein Fault Complex, which created a steeper slope gradient into the deeper Gimsan Basin on the down-faulted Halten Terrace (Figure 2). Rivers feeding the Paleocene shoreline in the Froan Basin are believed to have had catchment areas on the scale of 2 × 10⁴ km2 and the full source-to-sink length was approximately 150 km (Figure 1) (Sømme et al., 2009b).
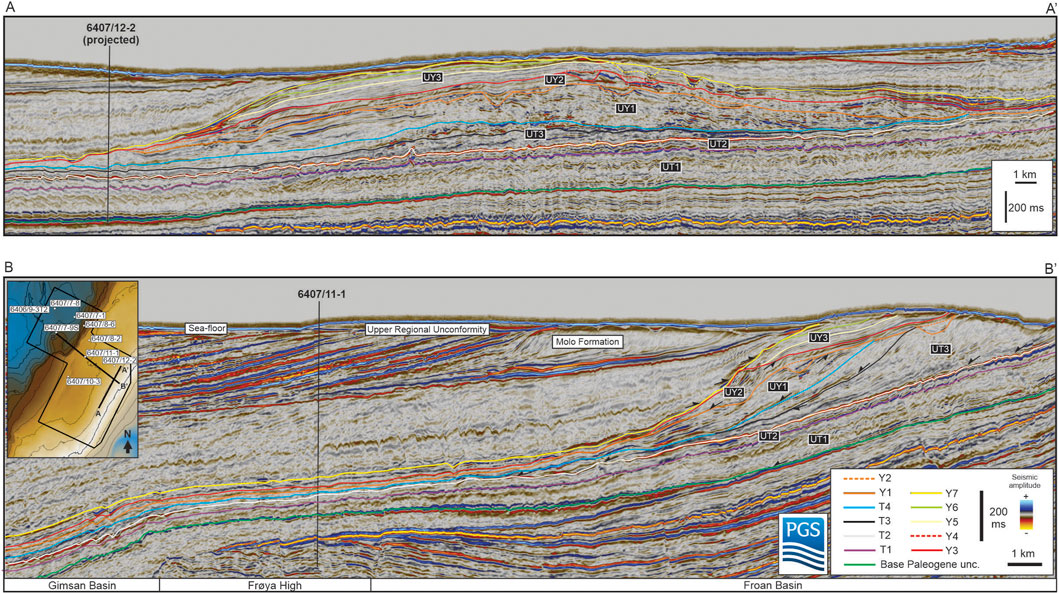
FIGURE 2. (A) Strike- and (B) dip-line across the study area covering the main Paleocene to Eocene depocenter. Units UT1-UY3 are defined by bounding surfaces expressed by downlap, onlap, toplap, and truncation relationships.
Data and methodology
High-resolution 3D seismic reflection datasets provide an unparalleled opportunity to analyze sediment routing systems in time and space (Posamentier and Kolla, 2003; Posamentier, 2005). Initially these data sets covered only smaller portions of sedimentary basins, while in recent years, larger datasets and regional megamerges >1,000 km2 have become the norm in many areas, not least offshore Norway (e.g., Keller et al., 2022). The seismic reflection data utilized in this study comprise a ∼2,700 km2 subset of PGS18M05 and PGS17M05. Both datasets have a line spacing of 12.5 × 12.5 m. The dominant frequency is ∼25 Hz and the velocity of the studied succession is ∼2000 m/s, which gives a vertical resolution of ∼20 m. The data are zero phase and an increase in acoustic impedance is shown as a (blue) peak (Figure 2).
Seismic well-tie was based on time-depth relationships from well 6407/12-2 (Figure 3). Well 6407/12-2 penetrates the toe-of-slope succession of the Paleocene wedge and has a full suite of electrical logs and biostratigraphic coverage. Palynological data from this well have been linked to the NW Europe dinoflagellate zonation scheme from Speijer et al. (2020). In addition, electrical logs and palynological data from several other wells in the area have been used to correlate and describe the lithology and log-response in the distal part of the Froan and Gimsan basins.
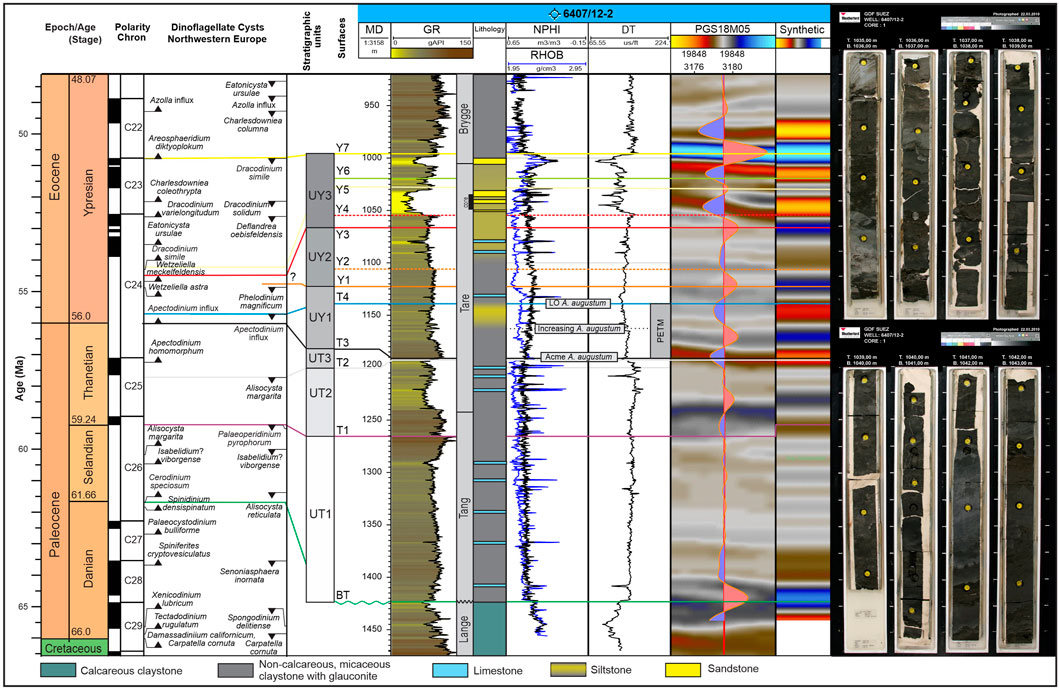
FIGURE 3. Seismic well tie for 6407/12-2 and dinoflagellate zonation in NW Europe (from Speijer et al., 2020). The PETM is defined by the presence of A. augustum. Position of core photos between 1,035 and 1,045 m are indicated on the lithology column. Core photos from www.npd.no.
No carbon isotope data are available in this study and the recognition of the PETM in well data is based on the occurrence of the dinocyst species Apectodinium augustum in palynological data (Sluijs et al., 2007b). A global review by Denison (2020) shows that the main body of the Carbon Isotope Excursion (CIE) defining the PETM is coeval with the acme of the genus Apectodinium. Recent work from the North Sea (Jin et al., 2022) and from Svalbard (Harding et al., 2011) also confirms that the onset, the main body and the recovery of the PETM CIE are reflected by the initial presence, acme and last occurrence of A. augustum.
Seismic stratigraphic surfaces (BPU-Y7; Figure 2) were mapped based on stratal terminations (toplap, downlap, onlap and truncation) (Mitchum et al., 1977), and were used to define the top and base of six seismic units (UT1-UY3). Changes in accommodation (A) and sediment supply (S), described as δA/δS, were investigated using shelf-break trajectory trends (Helland-Hansen and Martinsen, 1996), and geometrical descriptors of Aali et al. (2021). Here the geometries are described based on the shelf-break trajectory trend (down-stepping, stationary, up-stepping) and the landward and seaward termination styles (fore-stepping or back-stepping). Transgression occurs when the rate of accommodation creation is higher than the rate of sediment supply (δA>δS), normal regression occurs when sediment supply is higher than the rate of accommodation creation (δA<δS), and forced regression occurs when falling base level (A< 0) together with sediment supply forces the shoreline basinward (Posamentier et al., 1992; Catuneanu, 2002).
To preserve original shelf-edge trajectories and to quantify relative sea-level fluctuations, sequential backstripping was conducted following the methodology of Beelen et al. (2019), where individual clinothem units were backstripped, decompacted and adjusted for local and flexural subsidence. Lithology distribution and porosity-depth trends (for foresets and bottomsets) were derived from well 6407/12-2. Since topsets have not been penetrated by wells, lithology distribution was inferred from seismic facies and seismic geomorphology and assumed to comprise 70% sandstone. Thicknesses and slope gradients reported in this study are values after decompaction.
Seismic geomorphology of each seismic unit was extracted with two different attributes: i) a co-blend of Root Mean Square (RMS) and Variance (edge effect), which is useful for highlighting lateral changes in impedance (proxy for lithology), faults and channels etc.; and ii) frequency decomposition (FDC) and RGB color blending, which are useful for imaging subtle and lateral changes in depositional systems. For the RGB color blending, frequency bands of 15, 30 and 45 Hz were used.
Depositional environments present in the prograding wedge vary from coastal to deep-marine. We do not attempt a full hierarchical description of depositional elements (see Cullis et al. (2019) for a recent overview), but apply general terms linking scale and depositional setting. The term ‘channel’ is used to describe single-cycle features of erosion or deposition at the lower scale of seismic resolution (tens of meters wide) and “channel complex” to describe up to 2 km wide erosional or depositional features on the slope and basin floor. “Lobe” is used for single, sheet-like depositional features in front of channels, canyons and/or incised valleys, and “toe-of-slope apron” is used for stacking and coalescing of channels and lobes near the advancing shelf margin. “Basin-floor fan” is reserved for depositional features larger than lobes deposited tens of kilometers into the deep-water basin.
Results
Stratigraphic units
We split the Paleocene to lower Eocene succession in the Froan Basin into six units (Figure 4): three in the Selandian to Thanetian (Units T1-T3) and three in the Ypresian (Units Y1-Y3). The depositional setting and evolution of these units are described and interpreted in the following section using thickness and seismic attribute (RMS) maps (Figure 5) together with well log data (Figure 3, Figure 6). The seismic geomorphology is described from frequency decomposition (FDC) maps in Figure 7.
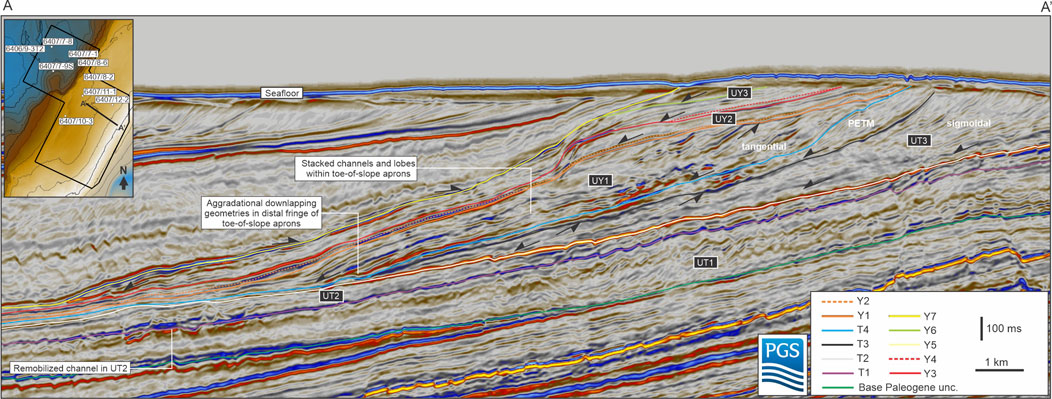
FIGURE 4. Key units and surfaces in the proximal part of the shelf-slope wedge with stratal terminations. First phase of progradation is defined by sigmoidal clinoforms. Main phase of progradation of UY1 is characterized by tangential clinoforms. The PETM is represented by the stratigraphic unit between surface T3 and T4.
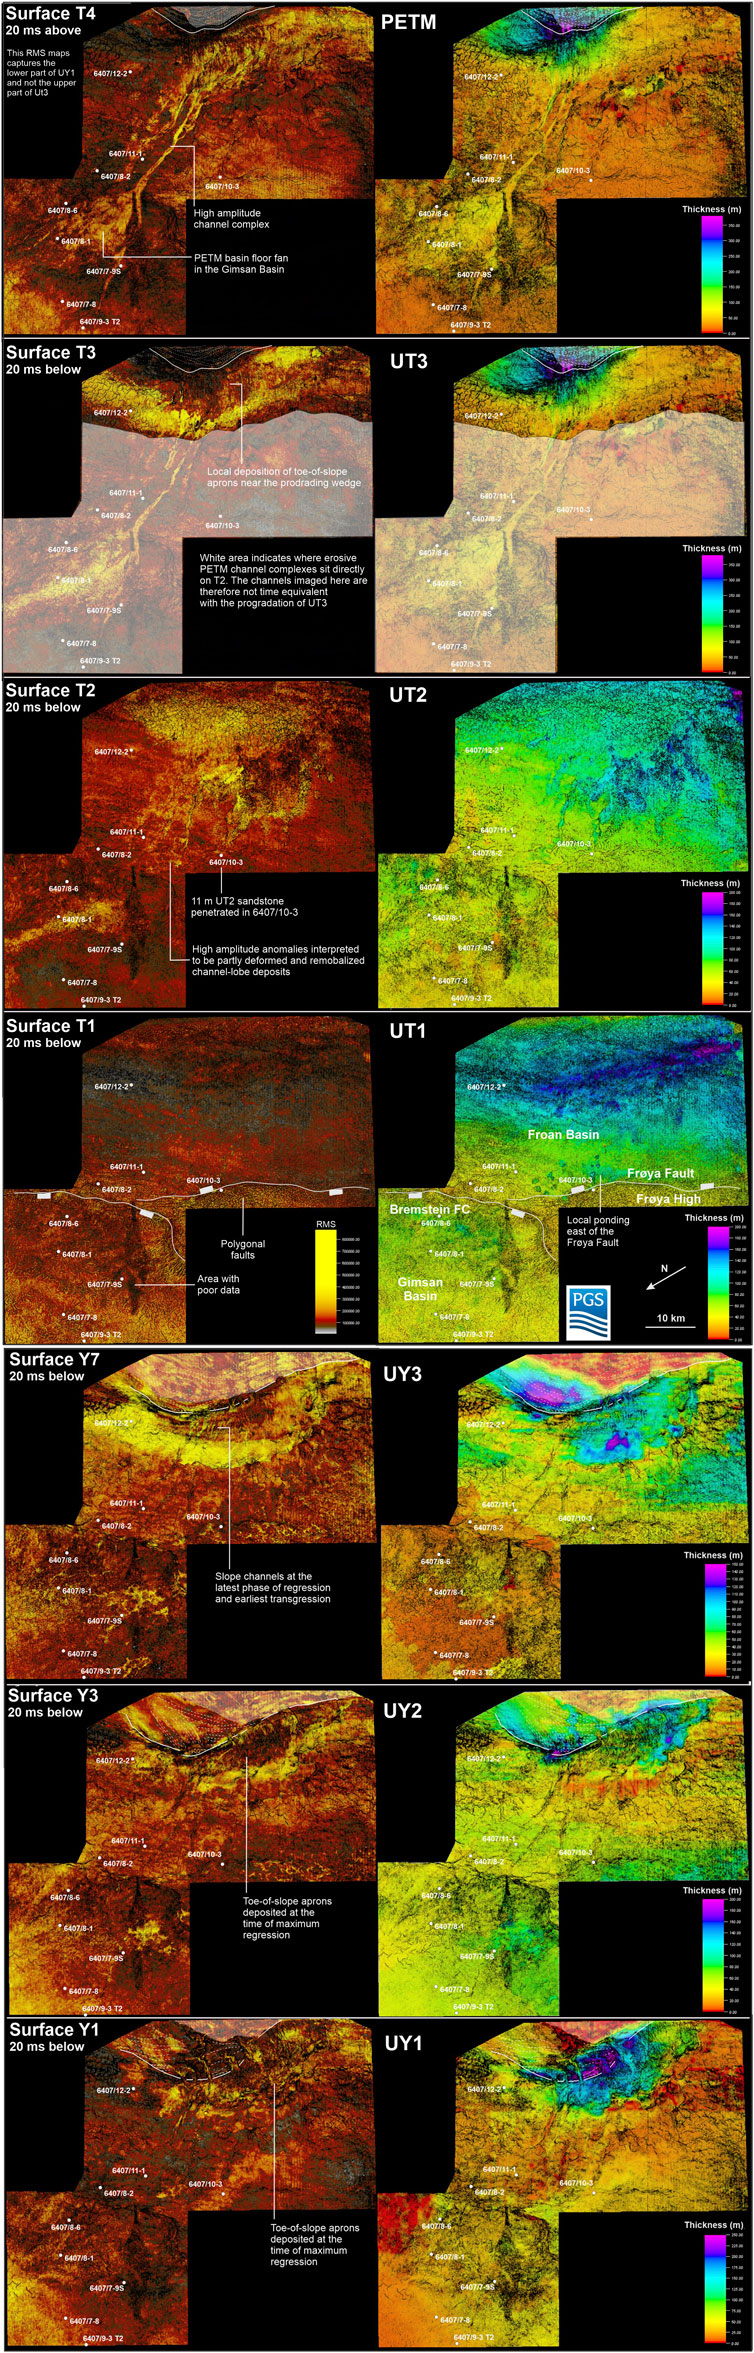
FIGURE 5. Co-blend of RMS amplitude and variance attributes, and thickness map for units UT1 to UY3. Since the PETM occur the base of UY1, UY1 has been split to show the PETM and the post-PETM part of UY1 separately. Continuous white lines show the shelf break at the top of each unit, hatched lines show curvilinear features indicating progradation direction. Note that the scale of the thickness maps varies between units.
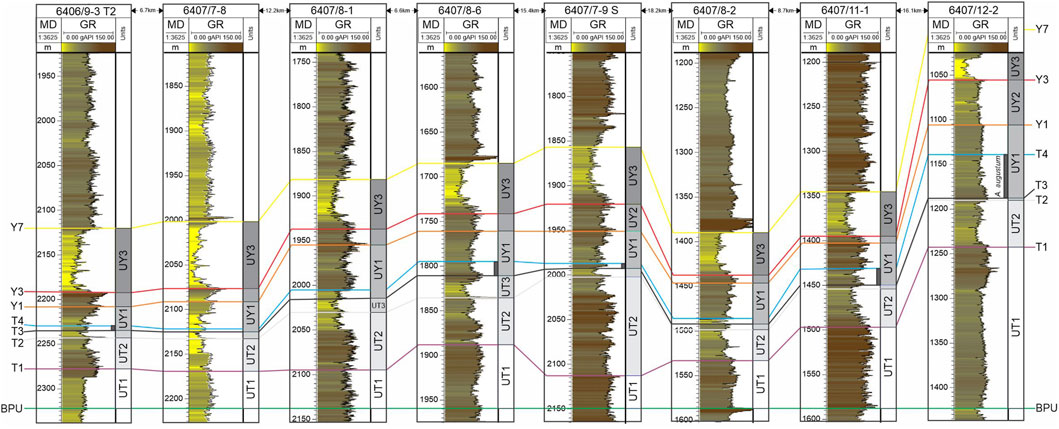
FIGURE 6. Log correlation from proximal (right) to distal (left) showing the gamma ray (GR) character of each unit and key bounding surfaces. Surface T2 is the regional downlap surface and Y7 is the uppermost onlap surface. Despite high variability in GR, the succession is generally mud-dominated and low GR signature tend to reflect silicious ooze and volcanic tuff. Where biostratigraphic data are available, the presence of A. augustum is shown with a grey bar, indicating the thickness of the PETM interval in each well. See Figure 5 for well locations. BPU = Base Paleogene unconformity.
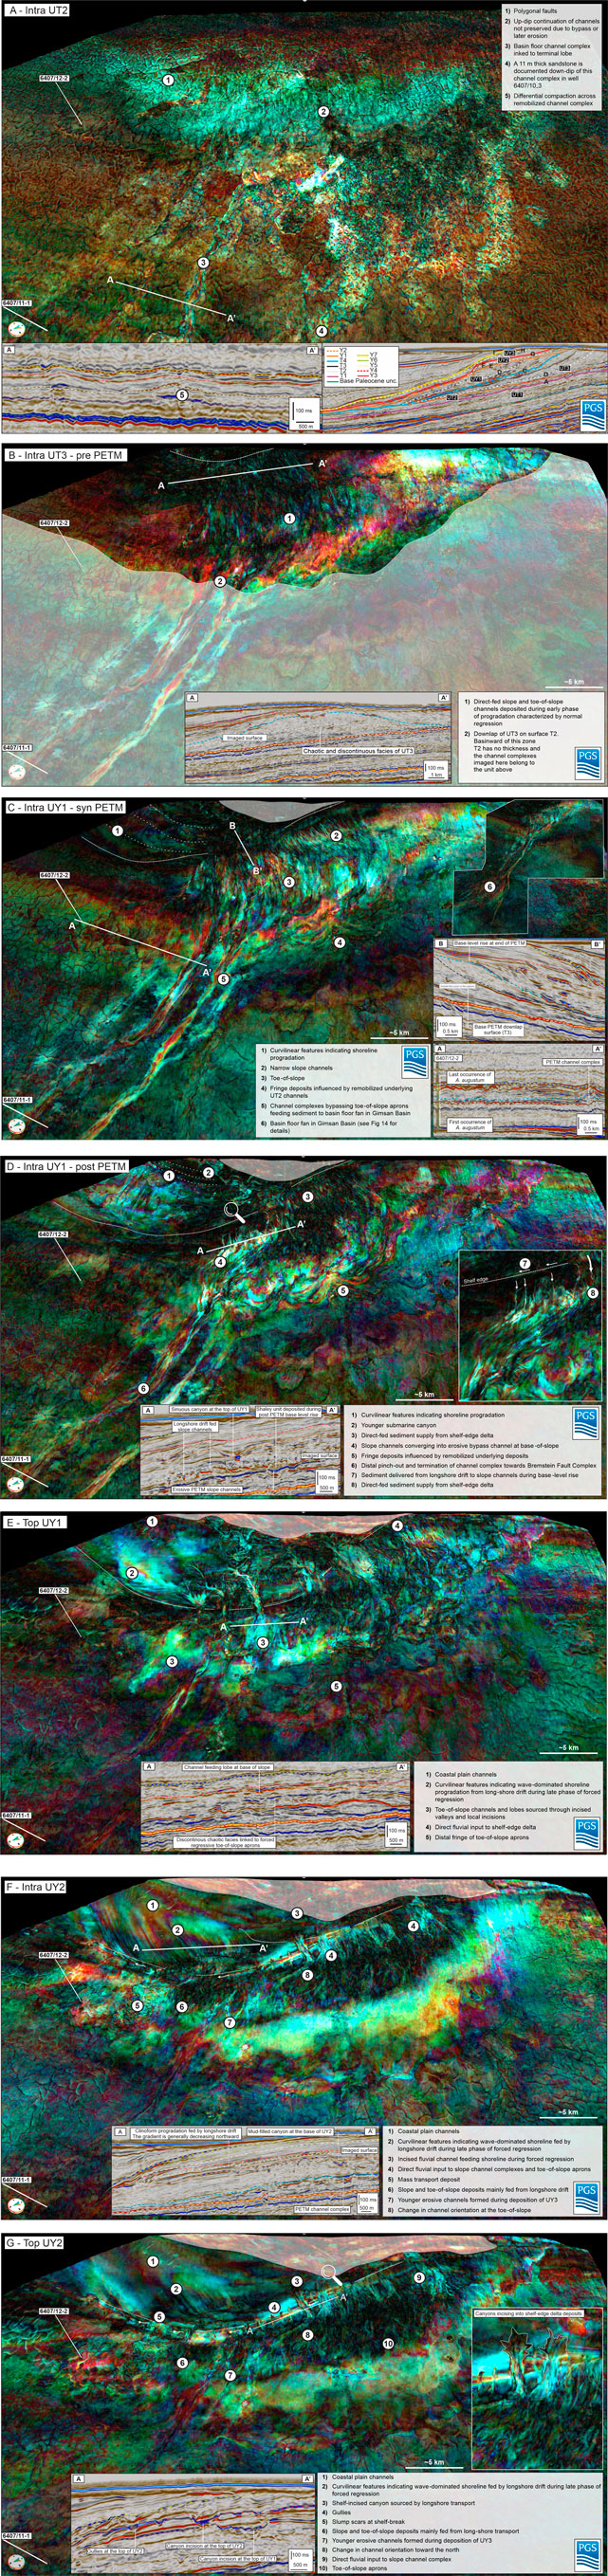
FIGURE 7. Frequency decomposition maps (FDC) with RGB blending showing seismic geomorphology within and between UT2 to UY3. (A) First phase of sand delivery to the Froan Basin. The map shows channel complexes and terminal lobes with poorly defined margins due to later remobilization. Line (A–A′) shows cross-section of remobilized and partly intruded channel sands into the overburden. (B) Pre-PETM map showing slope and toe-of-slope deposition during normal regression. The deposits downlap T2 and the channel complex in front of the system is younger. (C) Syn PETM deposition is characterized by direct sediment delivery to the shelf edge and slope bypass in wide erosive channel complexes. Channels merge at the toe-of-slope where they form larger channel complexes that bypass sediment to the basin floor and the Gimsan basin-floor fan. Inset map shows the full PETM shelf and deep-water system. Line (A–A′) shows the tie to well 6407/11-1 and the PETM interval defined by the presence of A. augustum. Line (B–B′) shows erosive bases of slope channel complexes. This indicates that the channels accommodated larger and more erosive gravity flows during the PETM. (D) Immediately after the PETM, sediment supply to the shelf break appears to have been more restricted. Narrow slope channels line (A–A′) show that these confluence at the toe-of-slope. (E) At the time of maximum regression of UY1, the subaerial unconformity was associated with incised valleys and erosional networks. These incisions formed during and at the time of maximum regression and some may have been modified during subsequent transgression. The map show that the main form of sediment delivery to the toe-of-slope was by unconfined, fluvial dominated shelf-edge deltas in the south and longshore transport to canyons in the north. Line (A–A′) shows a cross-section through the forced-regressive toe-of-slope aprons. (F) During progradation of UY2, there was a change in sediment transport direction and the northern part of the shelf was deposited as a result of longshore transport from the south Line (A–A′). (G) During maximum regression of UY2, sediment was delivered directly to fluvial dominated shelf-edge deltas in the south. Littoral currents transported sediment northward and was funneled through canyons, which formed during transgression. Line (A-A′) shows that UY2 canyons formed laterally from UY1 valleys suggesting that they formed during transgression. (H) Progradation during UY3 was characterized by significant aggradation on the shelf and sediment delivery was unconfined at the shelf break. Slope and toe-of-slope deposition was not as affected by bottom currents and have more radial depositional geometries. Line (A–A′) show the relatively dim toe-of-slope seismic facies compared to the higher amplitude forced regressive facies. (I) Ypresian backstepping resulted in transgressive erosion as shown in Line (A–A’). Immature slope channels reflect fine-grained sediment delivery during transgression. Transparent polygons show where units have been eroded by the upper regional unconformity or the seafloor, or where the image show younger stratigraphy as in (B). Main surfaces are shown as hatched lines in seismic cross sections to improve visibility. Dotted lines indicate shelf-break location. The seismic line in (A) shows the stratigraphic position of each FDC map (A–I). The stratigraphic position of extractions between main surfaces are indicated as a white hatched line and annotated.
Unit T1—Selandian-lowermost Thanetian (BPU to T1)
Unit T1 (UT1) is bounded below by the base Paleogene unconformity (BPU) and above by surface T1 (Figure 4). A Selandian age of this unit is constrained by the presence of Cerodinium speciosum in the lower part and the last occurrence of the dinoflagellate Palaeoperidinium pyrophorum at the top of the unit (Speijer et al., 2020) (Figure 3). In seismic cross section (Figure 4) and in RMS map view (Figure 5), the unit is locally characterized by low amplitude reflections and high-density faulting with a polygonal expression. In well logs, the unit is marked by higher gamma ray (GR) values compared to the Upper Cretaceous unit below and the unit above. Internally, the unit shows increasing GR values upward. The lithology also changes from carbonaceous claystones in the Cretaceous below, to mica-rich claystones with stringers of limestone in the Paleocene above. The thickness map shows a distinct north-south trend, reaching up to ∼200 m in the southern Froan Basin (Figure 5).
Interpretation
Selandian strata are interpreted to represent mudstones deposited in a deep-marine setting. The thickness trend reflects fault-related subsidence east of the Frøya High. The angular character of the BPU and the hiatus to Cretaceous sediments below (e.g., in well 6407/12-2) suggest a major unconformity at the base of the unit. At the time of deposition of UT1, the shoreline was located farther to the east and the deposits are thus interpreted to represent the distal equivalent to Selandian progradation further landward (later eroded by the URU (upper regional unconformity) and at the present-day seafloor) (Figure 4).
Unit T2—Lower Thanetian (T1 to T2)
Unit T2 (UT2) is bounded below by surface T1 and above by surface T2 (Figure 4). An early to middle Thanetian age of this unit is suggested by the last occurrence of Alisocysta margarita and Areoligera gippingensis at the top of the unit (Speijer et al., 2020; Vieira et al., 2020) (Figure 3). The unit is dominated by moderate to low amplitude reflections characterized by high-density faulting in the western part of the study area (Figure 4). The fault pattern appears polygonal in the RMS and FDC attribute maps (Figures 5, Figure 7A). In the eastern part of the study area, the RMS, thickness and FDC maps show channel complexes and lobe-like features; however, the easternmost part of the system is not visible due to bypass or subsequent erosion by the overlying unit. In the area between 6407/10-3 and 6407/11-1, a well-defined channel complex and terminal lobe is observed tapering out towards the Frøya Fault in the west (Figure 5). In seismic cross section, the channel complexes are locally associated with differential compaction (Figure 4, Figure 7A, section A), and locally also with wing-like intrusions in the upper part. A fault-controlled depocenter to the east of the Frøya Fault is suggested from the thickness map. In well logs, the unit generally shows an upward decrease in GR values and the lithology is dominated by claystones (Figure 6), but in 6407/10-3 (Figure 5), a 11 m thick sandstone unit is present.
Interpretation
UT2 is interpreted to represent the first input of sandy gravity flows to the Froan Basin during the Paleocene. The feeder system has a SE-NW orientation indicating sediment supply from the hinterland to the east, but no time-equivalent shoreline or shelf deposits are preserved. A common feature with this unit is that the channel complexes and lobes are strongly deformed and partly injected into the overlying sediments, resulting in the chaotic expression on the seismic attribute maps and in cross sections. A similar expression of Paleocene sands also occurs farther south in the North Sea (Dixon et al., 1995; Dmitrieva et al., 2017; Sømme et al., 2019). This deformation appears to have occurred soon after deposition, because there is no evidence of significant injection into overlying stratigraphic units and because later progradation was partly affected by the sea-floor topography caused by the injectites.
Unit T3—Uppermost Thanetian (T2 to T3)
Unit T3 (UT3) is bounded below by surface T2 and above by surface T3 (Figure 4). The upper T3 surface correlates with the influx of the dinoflagellate cyst Apectodinium augustum, suggesting a latest Thanetian (pre-PETM) age of this unit (Speijer et al., 2020; Vieira et al., 2020) (Figure 3). In seismic, the basal T2 is a regional downlap surface (Figures 2, 4). The first clinoforms to downlap the T2 surface in the easternmost part of the study area are 300–400 m thick and show sigmoidal geometries with foresets dips of 4–8 degrees (Figure 4). The clinothem thickness decreases rapidly as the toesets pinch out and downlap T2, and the thickness map in Figure 5 shows that the UT3 depocenter is constrained to the proximal part of the study area. The intra UT3 FDC map (Figure 7B) shows several narrow slope channels basinward of the shelf break feeding sediment to toe-of-slope aprons. In cross section these are characterized by chaotic and discontinuous seismic facies (Figure 7B, section A).
In all wells within the study area, the basal downlap surface is marked by increasing GR values (Figure 6). In 6407/12-2, which is located at the flank of the high-amplitude channelized area, UT3 is represented by an upward decrease in GR and density, and is dominated by silty, micaceous claystone with abundant glauconite (Figure 3).
Interpretation
The up to 400 m thick clinothems in UT3 represents a prograding shelf margin (Patruno and Helland-Hansen, 2018) and the first arrival of the prograding shelf-slope wedge in the study area, sourced from the hinterland in the SE. The variable amplitude character and seismic geomorphology suggests mixed lithologies where slope channels formed along a relatively narrow section of the slope. The thickness map in Figure 5 and the abrupt basinward thinning of the unit in cross section in Figure 4 show that sediments were largely trapped within the prograding wedge and at the proximal toe-of-slope during this early phase of progradation with no evidence of bypass to the more distal part of the basin.
Unit Y1—Ypresian (T3-Y1)
Unit Y1 (UY1) is bounded at the base by surface T3 and at the top by surface Y1 (Figure 4). The base coincides with the first occurrence of Apectodinium augustum, but except for the internal top A. augustum marker (surface T4), there are no major bioevents separating the top of UY1 from UY2. The top of UY2 coincides with the first occurrence of the dinoflagellate Cerodinium wardenense, suggesting a latest Thanetian to early Ypresian age for UY1 and UY2 (Bujak and Mudge, 1994; Brunstad et al., 2013). The PETM, defined by the presence of A. augustum, is thus present at the base of UY1, between surface T3 and T4 (Figure 3).
Surface T3 at the base of UY1 is a downlap surface, which locally truncates reflections below (Figure 7C, section B). The upper Y1 surface is an erosional toplap surface. Tangential clinothems of UY1 are initially 200–300 m thick, but thin basinward to less than 50 m and have foreset dips of 3–5 degrees. Internally, the unit has chaotic seismic facies in the central part, becoming more continuous as the reflections downlap to the north, south and west.
Figure 7C shows the seismic geomorphology at the T3 surface, which correlates with the lower part of the PETM in 6407/12-2 and 6407/11-1. The map shows a series of slope channels that merge into two NW-trending, low-sinuosity channel complexes (up to 1.8 km wide) (Figure 7C, section A). These channel complexes extend ∼20 km westward into the Gimsan Basin where they feed a basin floor fan (∼450 km2). Several smaller channels are observed in the medial and distal part of the fan. The fan outline is defined by moderate amplitudes in cross section and RMS maps, decreasing towards the NW (Figure 5). West of the Bremstein Fault Complex, UY1 is limited to a single peak-response in the seismic data (Figure 2). The FDC map in Figure 7D shows the intra UY1 geomorphology during continued progradation after the PETM. Sediment delivery to the outer shelf and slope appears more localized and several slope channels (Figure 7D, section A) converge at the base-of-slope.
The upper bounding surface of UY1 cuts as deep as 130 m into underlying strata of UY1 and UT3, forming several incised valleys, gullies and erosional networks along the shelf (Figure 7E). At the distal end of the valleys, the seismic facies appear chaotic in cross section (Figure 7E, section A), but the FDC map demonstrates a network of coalescing channels and lobes. In the northern part, the terminal lobes in front of the erosional networks are expressed at the upper part of the unit where they have a continuous seismic expression. In general, the amplitude strength often increases in the distal part and the seismic reflections show apparent aggradational downlap geometries (Figure 4). Farther west and into the basin, the attribute maps show a homogenous attribute expression and areas with polygonal faulting.
Biostratigraphic data from 6407/12-2 and 6407/11-1 show that the lower part of UY1 (between T3 and T4) is characterized by the presence of A. augustum and corresponds to the PETM (Figure 3). In 6407/12-2, the acme of A. augustum occurs just above the basal T3 surface and the diagnostic fossil is present within a 54 m thick interval. The basal part of this unit is also characterized by an increase in amorphous organic matter and a marked decrease in microfauna diversity and absence of agglutinated foraminifera. Wells in the distal part of the system show a similar trend, where the presence of A. augustum coincides with increased input of amorphous organic matter and absence of foraminifera. Here the PETM succession is more condensed and typically <20 m thick (Figure 6).
Across the study area, the pre-PETM Thanetian lithology is generally characterized by grey claystones with limestone beds. In 6407/12-2, which is located at the flank of the high-amplitude channelized area, the transition into the lower PETM part of UY1 is expressed by an increase followed by a decrease in GR and density, and the lithology is dominated by silty, micaceous claystone with abundant glauconite (Figure 3). In 6407/11-1, located between the two high-amplitude channel complexes, the unit is dominated by silty claystone. The distal part of the PETM basin floor fan is penetrated by 6407/8-1 (Figure 5), documenting claystone with traces of siltstone. Similarly, all other wells positioned along the flank of the system also show dominance of claystone (Figure 6) (Supplementary Table S1). Low GR in the distal wells reflect increasing content of silicious ooze.
Interpretation
UY1 documents ∼7 km of continued shelf-slope progradation relative to the previous UT3 shelf break. The base of the unit correlates with the transition from sigmoidal to tangential clinoforms in the proximal part of the system (Figure 4). In FDC maps, this transition is marked by a change from more localized sediment delivery to the shelf edge (Figure 7B), to a wider zone of direct sediment delivery to the shelf-edge delta during the PETM (Figure 7C).
Differential compaction across the PETM channel complexes suggests that they are sand-dominated in the proximal part (Figure 7C, section A), but gradually becoming less sand-rich basinward (higher aspect ratio basinward). Even though the wells show that the basin floor fan is mud-rich, the channel complexes did not develop pronounced levees, suggesting rapid deposition and down-dip changes in lithology. The transition from grey claystone with limestone beds to more micaceous claystones with local glauconite and siltstone is interpreted to reflect shoaling of the carbonate compensation depth and input of more terrestrial material during the PETM (Carmichael et al., 2017). The channel-lobe transition zone coincides with a decrease in basin-floor gradient west of the Bremstein Fault Complex, where the PETM fan widens and eventually tapers out toward the northwest.
Continued progradation above the PETM wedge resulted in the deposition of thick slope and toe-of-slope succession within ∼12 km of the advancing shelf-edge. Incised valleys, canyons, gullies, and erosional networks in Figure 7E formed at the last stage of UY1 progradation and during subsequent transgression within UY2. The curvilinear features seen in the FDC maps indicate that the early phase of progradation was toward the NE (Figure 7D), but that the orientation changed to a more northern direction at the last phase of regression (Figure 7E). The shelf-slope topography at the end of UY1 progradation formed a bathymetric template for later UY2-UY3 progradations.
Unit Y2—Ypresian (Y1-Y3)
Unit Y2 (UY2) is bounded below by surface Y1 and at the top by Y3 (Figure 4), and is of early Ypresian age (see above) (Figure 3). The basal Y1 surface is generally downlapped by a single set of tangential clinothems up to 80 m thick with foreset dips of 5–9 degrees (except for inside the main canyons where it is an onlap surface). The clinoforms of UY2 did generally not advance beyond the UY1 shelf break; however minor progradation of up to 1 km beyond the previous shelf break occurred locally (Figure 2). Similar to the unit below, the clinoform set is marked by a sharp toplap surface. The RMS and FDC maps in Figures 5, 7F,G show similar characteristics as the underlying unit, with incised valleys and gullies on the shelf (Figure 7G, section A) transitioning into channels and chaotic attribute expressions to the west. In contrast to UY1, the thickness of UY2 is more variable with a local depocenter in the north. Also in contrast to the unit below, the intra UY2 FDC map in Figure 7F shows well-defined curvilinear features suggesting significant northward shelfal progradation during the last phase of regression. The foreset angles of these clinoforms decrease northward, from as much as 9 degrees near the main canyon to less than 5 degrees in the northernmost part of the shelf (Figure 7F, section A).
In 6407/12-2, the unit shows a minor decrease in GR toward the top, comprising claystone with siltstone and sandstone stringers and minor limestone beds (Figure 3). In the distal part of the system, the unit is typically <20 m thick and comprise claystone with traces of siltstone, limestone and tuff. Low GR values reflect high content of silicious ooze (Figure 6).
Interpretation
The lowermost part of UY2 represents backfilling of submarine canyons formed during incision of surface Y1. Transgression associated with this surface shifted the shoreline at least 4.5 km to the east. The main body of UY2 is interpreted to represent a renewed phase of progradation following flooding of UY1. The single clinothem set represents a delta advancing across the flooded shelf (Patruno and Helland-Hansen, 2018), eventually reaching the UY1 shelf break. The FDC maps show that shelf progradation was mainly toward the north (Figure 7F); except for an MTD south of 6407/12-2, there are no indications of fluvial channels feeding the shoreline and no indications of slope channels and toe-of-slope aprons beyond the shelf break as observed in the south. The curvilinear features in the north are interpreted to reflect a wave dominated coastline (Nienhuis et al., 2015; Berton et al., 2021). The main point of sediment delivery to the outer shelf was in the south, where slope channels seem to connect to the shelf break (Figures 7F,G). This is evident from an incised channel linking up with the southern canyon in Figure 7F, indicating direct fluvial input to a shelf-edge delta. A lateral change in processes regime from fluvial dominance in the south to more wave dominance to the north is also expressed by the change in gradient of the delta clinoforms. To the south, direct supply from rivers is expressed by steep delta foresets up to 5–9 degrees, decreasing northwards to ∼5 degrees (Figure 7F, section A). A northward decrease in delta foreset gradient indicates increasing distance from the active fluvial system (Paumard et al., 2020; Zimmer et al., 2020). The progradation direction and the lack of feeder systems in the north suggest that the wave-dominated coastline was mainly supplied by long-shore sediment transport. Both the thickness maps and the seismic geomorphology show that most of the sediments were deposited within ∼11 km of the shelf break and that little sediment escaped to the Gimsan Basin in the west. This interpretation is also supported by the wells which show predominantly claystone with traces of siltstone, limestone and tuff (Figure 6).
Unit Y3—Ypresian (Y4-Y7)
Unit Y3 is bounded by surface Y4 at the base and by a regional flooding surface Y7 at the top (Figure 4). An Ypresian age is suggested as the top of the unit coincides with last occurrence of Dracodinium simile (Speijer et al., 2020) (Figure 3). The thickness map shows that the main depocenter was on the slope and toe-of-slope region in the south, but the unit also has a prominent depocenter in the north with thicknesses up to 150 m (Figures 2, 5). In cross sections the unit shows an overall aggradational character with three 30–70 m thick clinothem sets stacked on the shelf (Figure 4). These sets are not regional across the shelf and the foreset angle is lower than in the units below (2–4 degrees). They are all constrained to the topsets of the underlying unit and none of the clinothem sets prograded significantly beyond the underlying UY1 or UY2 shelf breaks. The upper bounding surface is a regional onlap surface, but it is also erosive near the outer shelf where several gullies formed along the outer shelf. The intra UY3 FDC map in Figure 7H shows the last regressive phase of UY3, imaging a wide zone of slope channels feeding toe-of-slope aprons (Figure 7H, section A). The aprons have a more radial geometry compared to the units below and there is less evidence of northward sediment transport. This shift in transport direction is also expressed by the curvilinear features on the shelf indicating more radial progradation towards the NW. Similar to the units below, the northern part of the system is less channelized and the FDC map in Figure 7H shows small gullies and slump scars in addition to mass-wasting deposits at the toe-of-slope. The mass wasting deposits were penetrated and partially cored by 6407/12-2, documenting an 80 m thick interval of interbedded sandstones and claystones (Figure 3). Specifically, the 16 m thick cored interval document fine to medium-grained sandstone beds deposited as turbidities, interbedded with layers of claystone, tuff and slumped heterolithic deposits with high terrestrial organic content. In the distal wells, the unit is dominated by low GR tuff and non-calcareous claystone (Figure 6). The character of the uppermost Y7 onlap surface is imaged by the FDC map in Figure 7I. The map shows several low-sinuous channels extending landward of the shelf break. The upper surface also has a terraced appearance in cross sections (Figure 7I, section A).
Interpretation
Unit Y3 represents several phases of shoreline regression and transgression following flooding of UY2. The main depocenter was on the shelf and seismic cross sections show that the individual phases of regression were able to reach the shelf-break, at least locally. Similar to the unit below, most of the gullies, slope channels and toe-of-slope aprons are located in the southern part of the system, suggesting that this was the area of direct sediment supply as before. The heterolithic tuffaceous sandstones in 6407/12-2 were deposited at the last stage of regression or earliest transgression when most of the sediment was trapped in topsets. The final backstepping of the system is documented by the local terraced morphology (Figure 7I), interpreted to be wave erosion along a backstepping shoreline. The low-sinuous channels seen in FDC map are interpreted to represent relatively immature shelf and slope fairways (Maier et al., 2013), formed during transgression and backstepping of the system.
Sequence stratigraphy and relative sea-level fluctuations
The Late Cretaceous and earliest Paleocene coastline was located landward of the Froan Basin and seismic data show that the basin had a ramp-like geometry with gradual deepening toward the Bremstein Fault Complex in the west (Figure 2). Initial hinterland uplift in the earliest Danian is documented by input of clastic material to the margin south of the study area (Gjelberg et al., 2001; Sømme et al., 2013). The first phase of sand delivery to the Froan Basin was in the early Thanetian (UT2) (Figure 8), but the shallow-marine system feeding these channels and lobes is not preserved. When the coastline reached the Froan Basin in the late Thanetian (easternmost UT3 clinoforms) (Figure 8), progradation was characterized by an up-stepping shelf-break trajectory, back-stepping landward terminations and fore-stepping seaward terminations (UBF, sensu Aali et al., 2021) (Figure 9), indicating moderately high δA/δS conditions during normal regression. Moderately high δA/δS is also expressed by sigmoidal clinoforms showing rapid basinward thinning and downlap onto the T2 surface (Figure 4). Continued progradation is characterized by a static shelf-break trajectory and fore-stepping landward and basinward terminations (SFF, sensu Aali et al., 2021), indicating gradual decrease in accommodation. This SFF unit represents a transitional phase between normal and forced regression. Backstripping and decompaction of the dip-transect in Figure 9 and the individual clinothems provide an indication of the water depth in front of the advancing system, suggesting ∼350 m near the shelf break and ∼800 m at a reference location 20 km along the dip transect (near well 6407/11-1) during this time (Figure 10).
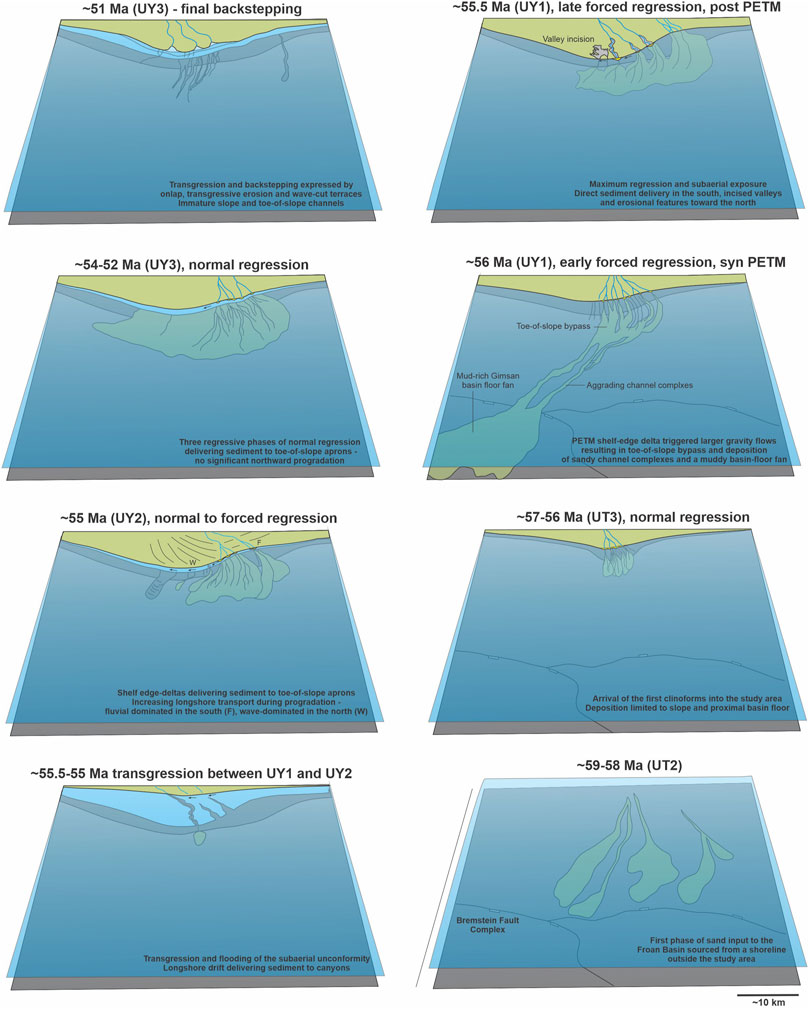
FIGURE 8. Evolution of the Thanetian to Ypresian system in the Froan Basin showing the response to long-lived marginal uplift and short-lived PETM climate perturbation and environmental processes.
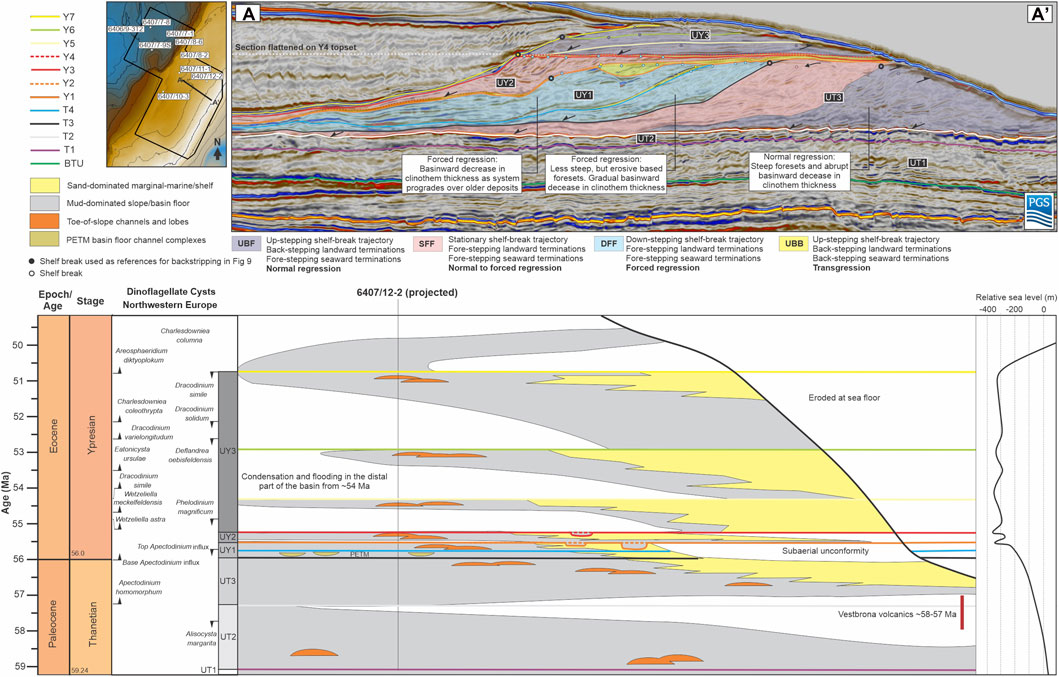
FIGURE 9. Flattened seismic line showing the geometric character of the main units defined by shelf-break trajectory and stratal terminations following Aali et al. (2021). The chronostratigraphic diagram below shows the age of the main phases of regression, transgression, and related unconformities. The relative sea-level curve is based on backstripping (Figure 10) and decompacted clinothem thicknesses.
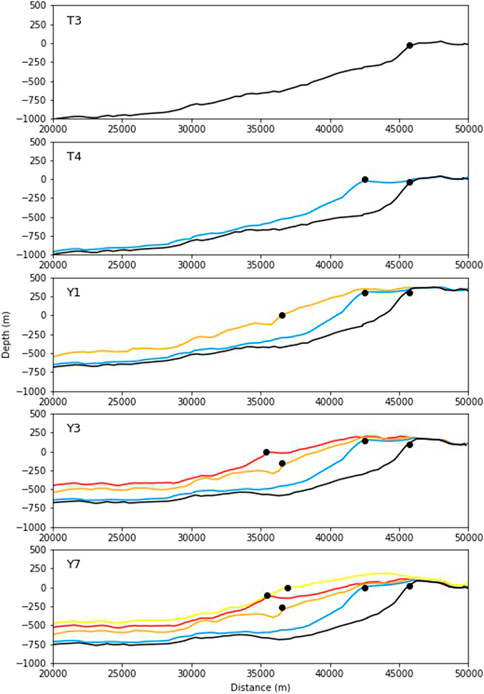
FIGURE 10. Backstripped and decompacted dip-profiles. Black circles indicate the shelf-break location for each unit. See Figure 9 for legend and line location.
Progradation at the base of UY1 is dominated by a down-stepping shelf-break trajectory and fore-stepping landward and seaward terminations (DFF, sensu Aali et al., 2021), indicating negative δA/δS conditions and forced regression. The unit is also marked by a basinward increase in thickness of the lower foresets and bottomsets pointing to loss of accommodation at the topset and increasing sediment accumulation on the slope and toe-of-slope region (Figure 9). The lower part of this unit coincides with the PETM (Figure 8). The FDC map in Figure 7C shows that the longest run-out of channel complexes and development of basin-floor fans occurred during the PETM, at the early phase of forced regression. This forced regressive unit is succeeded by a thin package (above T4) showing up-stepping and backstepping terminations (UBB, sensu Aali et al., 2021), high δA/δS conditions, and base-level rise. Backstripping and decompaction suggests water depths of 150–250 m near the shelf break and ∼750 m at the reference location at the PETM (Figure 10).
Subsequent progradation of UY1 above T4 and after the PETM is characterized by continued forced regression (DFF). The clinothem thicknesses rapidly decreased as relative sea-level fell and as the system prograded over older slope and toe-of-slope deposits (Figure 4), indicative of negative accommodation (Posamentier and Morris, 2000). Backstripping and decompaction of clinothems (Y1) suggests that the water depth was less than 50 m at the shelf edge and ∼345 m at the reference location during maximum regression of UY1 in the earliest Ypresian (Figure 10). At the reference location near 6407/11-1, this relative sea-level fall of ∼460 m reflects ∼260 m of deposition post PETM combined with ∼200 m of sea-level fall due to tectonic uplift.
Valley incision (up to 130 m deep) and erosional features on the outer shelf developed as a part of the subaerial unconformity (Y1) and the expression of this surface is shown in Figure 7E. At the time of maximum regression and subaerial exposure, ∼0.5 Myr after the PETM, deposition was largely constrained to toe-of-slope aprons within ∼15 km of the shelf break. The aprons were fed directly by unconfined shelf-edge deltas in the south and incised valleys and erosional features in the north (Figure 9). Valley incision ∼130 m below the shelf break at maximum regression suggests a total relative sea-level fall of more than 300 m between ∼57 and ∼55.5 Ma (between the earliest phase of UT3 progradation and maximum regression of UY1).
Y1 is overlain by another UBB (transgressive) unit indicating high δA/δS conditions and flooding of the shelf (Figure 9). Inside the canyons, the upper Y2 maximum flooding surface is marked by a trough in seismic reflection data and can be traced from the outer shelf to the distal toe-of-slope (Figure 4). This flooding resulted in a landward shift of the shoreline of at least ∼5 km as suggested by the most proximal clinoform above Y2.
Progradation of UY2 is characterized by a stationary shelf-break trajectory and fore-stepping landward and seaward terminations (SFF, sensu Aali et al., 2021), indicating negative to balanced δA/δS conditions and normal to forced regression (Figure 9). In contrast to UY1, UY2 deposits are preserved over a larger part of the shelf indicating higher accommodation during this phase of deposition. The decompacted clinothems are up to ∼85 m thick near the shelf break, showing that significant accommodation existed on the shelf after flooding of UY1. UY2 progradation stopped as the shoreline reached the previous shelf break. Similar to UY1, forced regression resulted in the formation of a subaerial unconformity; however, no erosional networks, valleys or large shelf-indented canyons formed at this time. The lack of shelf erosion and significant valley incision at the end of UY2 deposition is interpreted to reflect higher accommodation conditions compared to UY1. The FDC maps in Figures 7F,G show that the main area of deposition during maximum regression was within ∼15 km of the shelf break, similar to UY1, and there is no evidence of sediment bypass to the more distal Gimsan Basin. Backstripping suggests that the water depth at the reference location was ∼340 m during the end of UY2.
UY2 is locally overlain by another thin UBB package indicating high δA/δS conditions and transgression. The upper Y4 surface represents another maximum flooding surface, which can be mapped in canyons and locally on the shelf (Figure 7F, section A). This transgression shifted the shoreline at least 6 km landward. Above the Y4 surface, UY3 comprises three clinoforms sets (bounded by downlap surfaces Y5 and Y6) showing up-stepping shelf-break trajectories, backstepping landward terminations and fore-stepping seaward terminations (UBF) indicating high δA/δS conditions and normal regression (Figure 7F). UY3 is deeply eroded at the seafloor in the southern part of the study area and the stacking pattern cannot be determined. Decompacted clinothem thicknesses are 30–70 m for the three sets, giving an indication of the water depth at the outer shelf during each regressive phase. Despite higher shelf accommodation during UY3 deposition, each regressive phase was able to extend to the previous shelf-break before transgressing and backstepping. No deep valleys or canyons are observed within UY3 and the outer shelf is only cut by gullies that did not develop into larger canyons (Figure 7I). Backstripping and decompaction suggests that the water depth was 360 m at the reference location at the upper Y7 flooding surface.
Flooding and condensation commenced at ∼54 Ma in the distal part of the system as UY3 topsets started to aggrade on the shelf (Figure 9). This flooding is marked by increasing GR values, more diverse microfossils indicating open marine circulation and the absence of terrestrial derived pollen and organic matter. On the toe-of-slope and on the shelf, final flooding took place around 51 Ma (Figure 8), marked by the last input of sand to the basin (Figure 3). This transgression is expressed by backstepping shorelines and local wave-cut terraces during step-wise transgression, similar to what has been documented in Pleistocene systems (Lebrec et al., 2022).
In summary, the UT1-UY3 succession documents a long-lived (∼8 Myr) phase of relative sea-level fall of at least ∼300 m followed by aggradation, backstepping and abandonment (Figure 9). Within this long-term trend, at least four short-lived (0.5–3 Myrs) phases of regression and transgression occurred, reflecting relative sea-level fluctuation of 30–80 m, suggesting higher-frequency fluctuations in sediment supply and accommodation along the margin.
Controls on incised valley and canyon formation
Several dendritic incisions, valleys, canyons, and gullies formed during development of UY1 and UY2 (Figures 7E,G; Figure 11). A seismic strike-line through UY1 shows that the northern and southern dendritic incisions did not form at the same time (Figure 11, section A). The southern incision formed during early forced regression, but a short base-level rise and a shift in progradation direction caused the network to be abandoned and overlain by shallow-marine deposits. This shift was driven by littoral sediment transport, evident from the observed change in progradation direction along the outer shelf. As the system approached maximum UY1 regression, the northern dendritic incision formed. This development is evident from the different incision depths in the seismic cross section (Figure 11F). Both incisions occurred landward of the shelf break at maximum regression, and both are associated with low-sinuous, up to 150 m wide channels bypassing erosional products to terminal lobes at the toe-of-slope (Figure 11). These observations suggest that incision commenced during formation of the subaerial unconformity. Remnants of other dendritic incisions also occur farther south, pointing to a common development in areas away from main sediment entry points. Similar incisions have also been documented in Quaternary systems along-strike of large sediment entry points (Nordfjord et al., 2006).
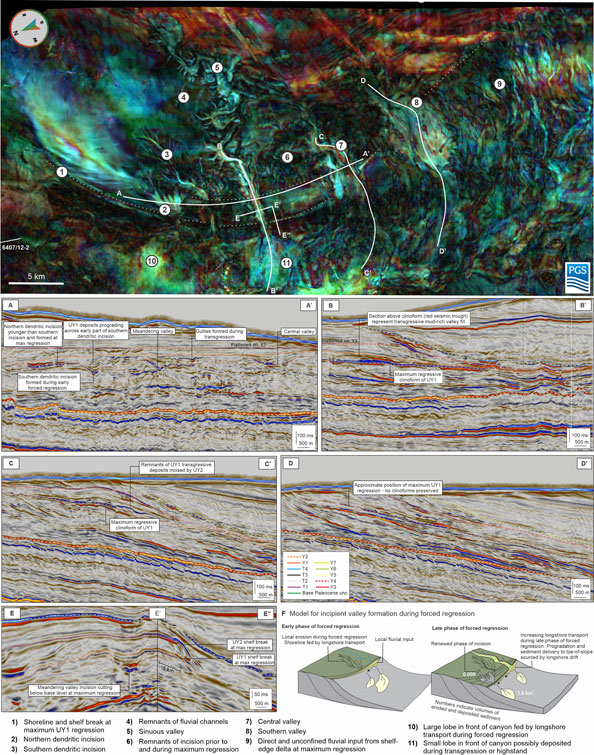
FIGURE 11. FDC map at the top of UY1 (surface Y1) showing the expression of the subaerial unconformity and associated erosional networks and incised valleys. Section (A–A′) how the different generations of erosional network incision during forced regression. The clinoforms overlying the southern incision show that longshore drift advanced the margin after the incision and prior to erosion of the northern network. Sections (B–B′), (C–C′), and (D–D′) show dip-sections through respective valleys. The recognition of clinoforms within the valleys suggest that they formed at maximum regression. Section (E–E′) show the deep incision of the sinuous valley below the shelf break. F illustrates the suggested model for network incision during forced regression observed in seismic section (A). Numbers indicate eroded and stored sediments volumes in the northern incision and its frontal lobe, respectively. Excess volume in front of the northern incision show that the lobe must have been supplied also by longshore drift during forced regression.
Farther south, the FDC map shows a ∼12 km long and up to 700 m wide sinuous valley incising up to 130 m into the underlying shelf and slope deposits. Remnants of fluvial channels on the subaerial unconformity and toe-of-slope channels within UY1 suggest that the area occupied by the sinuous valley also received sediment during forced regression. A seismic dip-line through the valley (Figure 11, section B) shows that the high amplitude reflections at the base of the valley terminate near the area of maximum regression, where a clinoform is observed. This clinoform is interpreted to represent the coastline at maximum forced regression. Basinward of this clinoform, the erosive valley changes into a channel attached to a terminal lobe in its distal end. The valley fill is expressed by a low-amplitude trough in seismic data, suggesting backfilling by fine-grained material during subsequent transgression. Despite being primarily formed towards the end of forced regression, it is possible that headward erosion extended the valley landward during subsequent transgression.
Toward the area of direct sediment input to the south, the UY1 valleys have a more funneled morphology (Figure 11). The central valley is up to ∼80 m deep and ∼1.5 km wide at the shelf break where it terminates. The valley head is located ∼5 km landward of the shelf break. Basinward, the FDC maps show a network of distributary channels (tens of meters wide) where the valley fed sediments to the toe-of-slope aprons. A cross section along the valley (Figure 11, section C) shows a clinoform at the position of maximum regression, indicating that valley incision primarily occurred during the last phase of forced regression. However, the canyon shape may also here have changed during subsequent transgression, resulting in the funneled morphology typical of transgressive estuarine systems (Dalrymple et al., 1992).
The southern valley has no preserved clinoforms at maximum regression but shows similar characteristics as the central valley. Incision is highest landward of the maximum regressive shoreline, reaching as deep as ∼70 m. The valley widens to ∼2.4 km near the shelf break, where it changes into submarine channels feeding sediment to toe-of-slope aprons. Up-dip, the valley head is located ∼5 km from the shelf break.
In the southern part of the shelf, the maximum regressive shoreline is eroded at the seafloor and the shelf break is not preserved. However, the FDC map shows that the area is dominated by nested channels up to 150 m wide instead of valleys, suggesting unconfined sediment supply from shelf-edge deltas to the slope during maximum forced regression.
Seismic reflection data show that the UY1 valley-fills are expressed by dim seismic facies (Figure 7G, Figure 10E), suggesting that subsequent transgression resulted in passive onlap and back-filling of valleys by fine-grained material, similar to many Pleistocene valleys (Blum et al., 2013; Wang et al., 2020).
As regression of UY2 commenced, previous incisions on the subaerial unconformity were filled to the extent that shorelines, slope channels and later incised canyons occupied new positions along the outer shelf. In contrast to UY1 valleys, UY2 canyons did not erode as far back across the shelf (maximum 1.5 km). Because these canyons eroded into the youngest clinoforms deposited at maximum regression, it is clear that UY2 canyon formation must have occurred during transgression. The FDC maps in Figures 7F,G show toe-of-slope channels linking up with the two canyons at the same time as there is no evidence of fluvial channels at the canyon heads. The absence of channels at the canyon heads, together with the northward prograding clinoforms, suggest that longshore transport from littoral drift was the main source of sediment to these northern canyons (Figure 8).
Collectively, the observations from UY1 and UY2 suggest that sediment was supplied by rivers directly to the shelf break along a wide section of the shelf. Incised valleys were not the main conveyers of sediment to the slope during forced regression. The different canyons and incision morphologies observed along the shelf are interpreted to reflect the proximity to the area of high sediment input. In areas of direct sediment delivery, the slope gradient was lower, and the system was graded, preventing deep canyon incision (Figure 12). Toward the north, where shelf-slope progradation mainly was maintained by littoral transport, steeper, out-of-grade slopes developed. These slopes were prone to mass-wasting, gully and canyon incision (Micallef et al., 2014; Prélat et al., 2015).
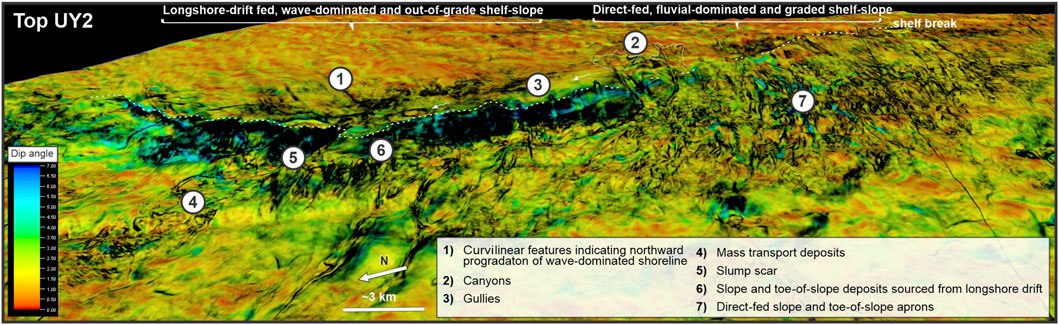
FIGURE 12. Dip-angle map (in degrees) from the top of UY2 showing along-strike variation in slope gradient. The southern area of direct fluvial input to the slope and toe-of-slope aprons has lower gradients reflecting a graded slope profile in the area of active sediment delivery. To the north, shelf progradation was mainly driven by longshore transport. Here the gradient is higher reflecting the out-of-grade margin development and inheritance from UY1 regression. Mass wasting processes are the dominant mechanism of sediment delivery to the toe-of-slope and canyon incision is deeper in this area.
Discussion
Stratigraphic expression of regional uplift—A North Atlantic comparison
The North Atlantic margins experienced regional uplift in the Paleocene and early Eocene (e.g., Parker, 1975). Although controversy still exists regarding the driving mechanisms behind the uplift, recent studies have documented several short- and long-lived phases of uplift along the Faroe-Shetland Basin (FSB) and East Shetland Basin (ESB) during the Paleocene and earliest Eocene (Nadin and Kusznir, 1995; Underhill, 2001; Mudge and Jones, 2004; Mackay et al., 2005; Champion et al., 2008; Hartley et al., 2011a; Stucky de Quay et al., 2017; Soutter et al., 2018; Conway-Jones and White, 2022). Comparison of surfaces and events between the FSB, ESB and the Froan Basin (Figure 13) is relevant because the regions are located with variable distance from the outer rifted margin, areas of active volcanism and the center of the Iceland mantle plume. Similarities and differences between the areas may help to understand the nature of allogenic controls and their stratigraphic expressions in different basin settings.
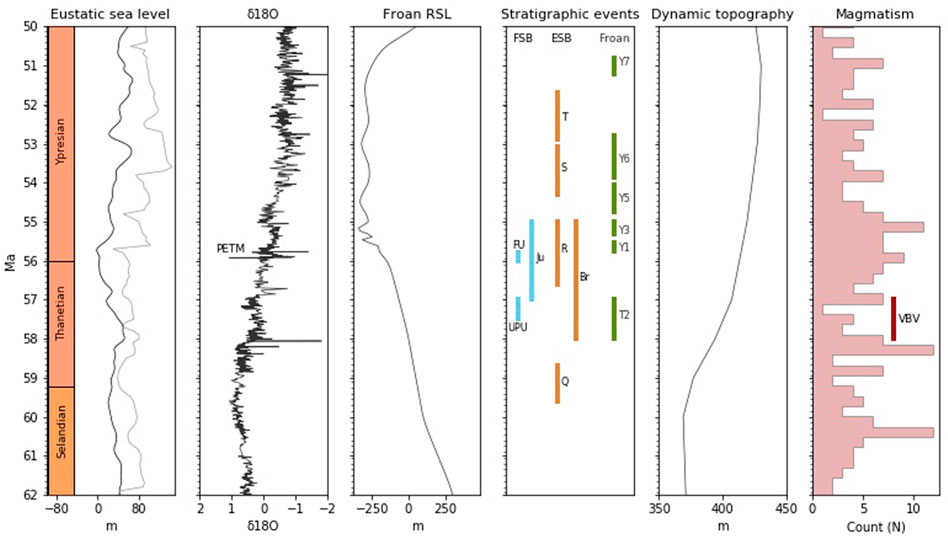
FIGURE 13. Comparison between key stratigraphic events in the Faroe-Shetland Basin (FSB), East Shetland Basin (ESB) and Froan Basin and other external tectonic and climatic controls. UPU = Upper Paleocene unconformity and FU = Flett unconformity from Jolley et al. (2021). JU = Judd unconformity from Hartely et al. (2011). Q-T landscapes from Conway-Jones and White (2021). Br=Bressay landscape from Stucky de Quay et al. (2017). Eustatic sea level curves from Kominz et al. (2008) (grey) and Miller et al. (2020) (black). δ18O curves from Miller et al. (2020). Relative sea level (RSL) from the Froan Basin (Figure 9). Relative dynamic topography modified from Flament et al. (2014) with Iceland plume response from Skogseid et al. (2000). North Atlantic magmatism from Steinberger et al. (2019). Age of Vestbrona volcanics (VBV) from Hafeez et al. (2017).
The Selandian to Ypresian shelf-slope wedge in the Froan Basin represents ∼8 Myr of progradation in response to hinterland uplift. The base Paleogene unconformity below the unit documents a ∼30 Myr hiatus in the proximal part of the basin where the entire Upper Cretaceous succession is missing. The hiatus is marked by an angular unconformity, similar to what has been documented in the British Isles (Gale and Lovell, 2018) and East Greenland (Hovikoski et al., 2021). Along the Norwegian margin, this initial phase of uplift resulted in hinterland erosion and increased sediment supply during the Danian (Martinsen et al., 1999; Gjelberg et al., 2001; Sømme et al., 2019).
Although regional uplift started in the Danian, the first arrival of coarse sediment to the Froan Basin occurred in the early Thanetian (59–58 Ma), expressed by remobilized submarine channel complexes and lobes within UT2 (Figure 7A, Figure 9). This phase of initial coarse clastic input was followed by erosion of the Thanetian T2 unconformity (∼57–58 Ma). The T2 unconformity is time equivalent with the Upper Paleocene Unconformity in the Faroe-Shetland Basin (Jolley et al., 2021; Walker et al., 2022), where Jolley et al. (2021) suggested a causal link to a phase of increased volcanism.
Rapid uplift and transition from normal to forced regression occurred just before the PETM. Although this phase coincides with a period of eustatic sea-level fall of ∼40 m (Figure 13), the observed relative sea-level fall of at least ∼300 m in the Froan Basin is an order of magnitude larger, suggesting a tectonic control. Continued uplift culminated in the formation of subaerial unconformities (Y1 and Y3) in the Froan Basin between 55.5–55 Ma. These are coeval with the “R” and the “Bressay” landscapes observed along the ESB (Stucky de Quay et al., 2017; Conway-Jones and White, 2022), and the Flett unconformity in the FSB (Hartley et al., 2011b; Jolley et al., 2021; Walker et al., 2022), suggesting a common mechanism for their formation across the North Atlantic region.
Another similarity between the Froan Basin and FSB is the stratigraphic position of the PETM within the prograding shelf-slope wedge. Jolley et al. (2021) demonstrated that the PETM predated subaerial exposure and the formation of the Flett unconformity in the FSB in the same way as the PETM predates the Y1 subaerial unconformity in the Froan Basin. Since the PETM is considered a regional datum (Denison, 2021), this comparison shows that there was no delayed transient uplift in the Froan Basin compared to the FSB. Within the resolution of biostratigraphic data, it appears that maximum uplift and subaerial exposure was broadly time equivalent across the region.
The Y2 flooding event (between UY1 and UY2) formed between 55.5–55 Ma at the time of peak transient uplift in the Froan Basin. A similarly aged flooding above the Forties sandstone member is also present in the Moray Firth area (Thomas and Hartley, 2014). If dynamic topography resulted in vertical motion of several hundred meters between 55.5 and 55 Ma, how can an ∼85 m relative sea-level rise between maximum regression of UY1 and UY2 be explained? One possibility is a combination of eustasy, compaction, and tectonic- and load-induced subsidence. Isostatic considerations suggest that the total load-induced subsidence of the UT3-UY1 wedge amounts to ∼200 m (which equals to an average rate of 0.1 mm/yr for the ∼2 Myr unit). Such a subsidence rate superimposed on a ∼40 m eustatic sea level rise between 56 and 55 Ma (Figure 13) might be sufficient to explain the rapid transgression and flooding observed between the two units during long-lived regional uplift. Increasing load-induced subsidence in combination with post Cretaceous tectonic subsidence could also explain the gradual shift from overall forced regression during UY1 towards higher accommodation during UY2, to aggradation and final backstepping at the end of UY3.
Flooding of UY1 and higher accommodation during deposition of UY2 demonstrates that regional subsidence commenced between 55.5 and 54.5 Ma. This subsidence coincides with transgression and backstepping of Ypresian shorelines in the FSB, which commenced at 54.8 Ma (Hardman et al., 2018), suggesting that increasing accommodation likely was related to regional subsidence.
After deposition of UY2, accommodation increased significantly on the shelf, preventing large volumes of sediment reaching the toe-of-slope. The data show three phases of regression within the Dracodinium simile zone (between 54.5 Ma and prior to final flooding at 51 Ma), suggesting that UY3 is largely time equivalent with the Halibut Delta in the Moray Firth area (Zimmer et al., 2019). The eustatic curve shows only one sea-level fall during this period (between 53–52 Ma) but Conway-Jones and White (2022) also recognize two phases of uplift in the ESB (“S” and “T” landscapes), suggesting a possible common control across this area.
Mudge et al. (2014) showed that the Ypresian transgression occurred at ∼54 Ma along the East Shetland Basin, which coincides with abandonment and condensation in the distal part of the system in the Gimsan and Froan Basin (Figure 13). In the more proximal area represented by well 66407/12-2, however, sedimentation continued until ∼51 Ma, when the last sand was deposited, and the shoreline finally stepped back (onlap of Y7) (Figure 3). Final flooding in the proximal part of the Froan basin at ∼51 Ma correlates with transgression of the Halibut Delta, which drowned around 50.4 Ma (Zimmer et al., 2019), suggesting that flooding of shelf-slope wedges occurred concurrently across larger areas of the North Atlantic.
Comparison between surfaces and events along the North Atlantic margin suggests a common forcing for several of the stratigraphic events. Yet, the areas also show significant discrepancies in the age of unconformities, stratigraphic stacking patterns and phases of sand delivery to the shelf margins. Lovell (2010) and Conway-Jones and White (2022) suggested that repeated uplift and subsidence along the ESB reflect fluctuation in mantle plume activity causing regressions and transgressions on the scale of hundreds of meters. Although several transgressive-regressive phases of similar age are present in the Froan Basin, the presence of local flooding surfaces indicates that the preservation of tectonic signals like the 2–3 Myrs fluctuations suggested here may be modulated by local controls. These discrepancies could reflect variable distance to the area of dynamic uplift or basin configuration (Friedrich et al., 2018), but could also reflect sampling and data bias, or local controls such as variations in subsidence and sediment supply. Thus, even if the margins were exposed to the same tectonic forcing, a non-unique stratigraphic response may have resulted across the region (Burgess and Prince, 2015).
Stratigraphic expression of the PETM in the Froan Basin
The short-lived PETM climate event lasting 100–200 kyr is known to have been associated with significant global warming (Sluijs et al., 2007), changes in the hydrological cycle and increasing sediment supply to North Atlantic basins (e.g., Dypvik et al., 2011; Kender et al., 2012; Pogge von Strandmann et al., 2021; Rush et al., 2021; Stokke et al., 2021; Jin et al., 2022).
In the Froan Basin the PETM is constrained by the presence of A. augustum in a ∼54 m thick succession in 6407/12–2 (Figure 3), a ∼20 m thick succession in 6407/11-1 (Figure 6), decreasing to 10–20 m in more distal wells (Figure 6). The lithology of the PETM succession in the Froan Basin is typically non-calcareous, grey, green to brown claystone, locally grading to siltstone with streaks of sandstone (Supplementary Table S1). In log data, the PETM is expressed by an abrupt increase in GR values followed by a gradual decline (Figure 6), similar to what has been described elsewhere in the North Sea (Vieira and Jolley, 2020).
Figure 14 shows that the ∼20 m thick PETM section in 6407/11–1 correlates with the two low-sinuous channel complexes at the lower part of UY1, NW and SE of the well location. The FDC map demonstrates that these channel complexes are connected to the basin-floor fan in the Gimsan Basin and that they can be traced landward across the toe-of-slope aprons towards the shelf break where they terminate. The map thus documents the shallow to deep-marine depositional expression of the PETM in the Froan Basin.
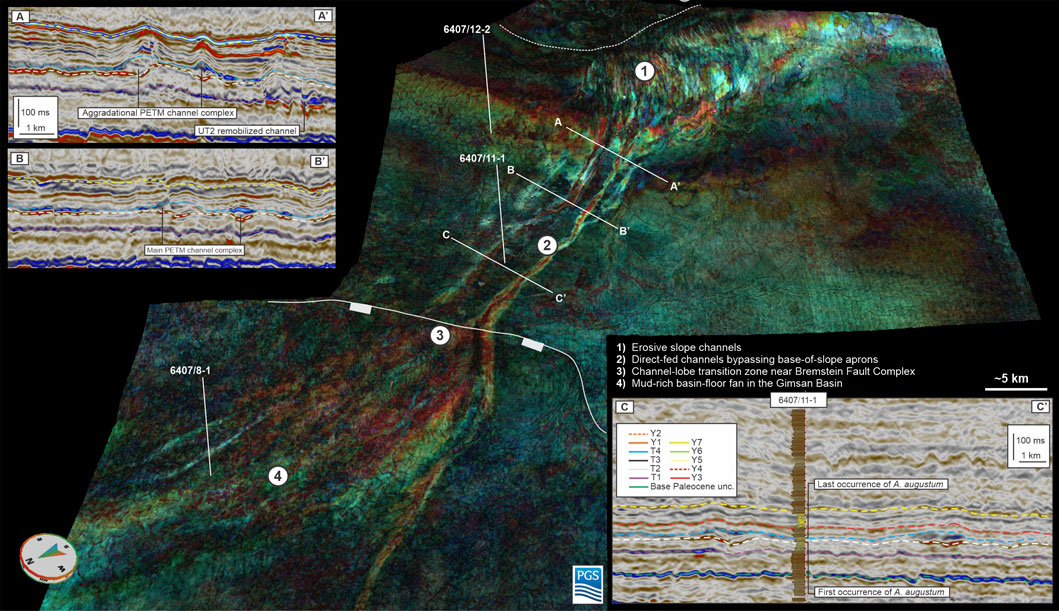
FIGURE 14. Oblique view of the PETM shelf, slope, and basin-floor fan system in the Froan and Gimsan Basin. Line (A–A′) show proximal channel complexes basinward of toe-of-slope aprons. Differential compaction and aggradational internal geometries suggest that they are sand-rich in the proximal position. Channel complex aspect ratio increases rapidly down dip Line (B–B′), and near well 6407/11-1 only local internal channel geometries can be observed Line (C–C′). The tie to 6407/11-1 show that the channel complexes are linked to the PETM as they coincide with the occurrence of A. augustum in the well. The channel-lobe transition is located near the Bremstein Fault Complex. In the Gimsan Basin, the basin floor fan is characterized by distributary channels which terminates towards the north. Well 6407/8-1 (Figure 6) show that the fan is mud-dominated.
Although the PETM often is linked to a period of eustatic sea-level rise (Sluijs et al., 2008; Harding et al., 2011), the climate event coincides with a period of forced regression in the Froan Basin and the only indication of base-level rise is at the top of the shallow-marine PETM succession (Figure 7C, section B). One possible explanation for this apparent discrepancy from other global PETM locations is that the amplitude of eustatic sea-level rise was too low to be expressed by onlap in seismic data (i.e., below seismic resolution). Another, partly complementary explanation, is that the rate of dynamic uplift balanced the rate of eustatic sea-level rise during the main phase of the PETM. We prefer a model where rapid dynamic uplift combined with high sediment supply outpaced eustatic sea-level rise during the main phase of the PETM, resulting in net forced regression. However, it is possible that the indication of base-level rise observed in Figure 7C, section B marks the waning phase of the PETM when the sediment supply rate decreased. Interestingly, a maximum flooding surface has also been interpreted above a sand-rich PETM succession in the deep-marine part of the North Sea (Vieira and Jolley, 2020; Jolley et al., 2022).
The seismic data show that the shoreline was at the shelf break and that the fluvial system delivered sediment directly to the upper slope during the PETM. The sediments delivered to the shelf-edge delta were primarily transported down-slope in up to 400 m wide and erosive channel complexes (Figure 7D, section A). When reaching the toe-of-slope, the erosive PETM channel complexes started to deposit sediment locally, but parts of the sediment load bypassed the toe-of-slope and continued toward the Gimsan Basin in two depositional channel complexes. The development of such wide and long channel complexes is in stark contrast to the pre- and post-PETM situation when the slope was dominated by narrow (up to 100 m wide) channels terminating near the toe-of-slope.
Cross-sections through these channel complexes show that they change morphology basinward. As they exit the toe-of-slope aprons (Figure 14, section A) they are typically 0.7 km wide, up to 80 m thick and show only minor erosion at the base. They have no pronounced levees and show considerable differential compaction, suggesting that they are sand-prone (Jennette et al., 2000; Bryn and Ackers, 2014; Edwards et al., 2018). Internal reflectivity and lack of deep incision at the bases show that they are overall aggradational. Farther basinward (Figure 14, section B), the channel complexes are wider (up to 1 km) and thinner (up to ∼50 m). They show less internal geometries and less differential compaction compared to the more proximal location, indicating that they are less sand prone. Toward the Bremsein Fault Complex (Figure 14, section C), the channel complexes are up to ∼1.8 km wide, ∼30 m thick and have no internal seismic character. They show subtle differential compaction, but significantly less than in the more landward parts, indicating lower sand content. The basin gradient decreases basinward of the Bremstein Fault Complex and this transition marks the channel-lobe transition zone where the channel complexes become distributary as they deliver sediment to the basin-floor fan in the Gimsan Basin. The basin floor fan is expressed by a single seismic reflection and has no measurable thickness and show no indications of differential compaction. Wells penetrating the distal part of the basin-floor fan (e.g., 6407/8-1, Figure 6) show that the PETM succession typically is <20 m thick and dominated by claystone and minor siltstone (Supplementary Table S1).
Based on these observations it seems that most of the coarse material supplied to the deep-water during the PETM was deposited in the toe-of-slope aprons and in the proximal part of channel complexes landward of the Bremstein Fault Complex. Only the fine-grained fraction was transported >50 km into the Gimsan Basin. However, there was not sufficient time and/or volume of sediment to develop thick levees along the channel complexes, pointing to an abrupt and short-lived pulse of sediment delivery to the distal basin during the PETM.
A transition from narrow (<100 m wide) channels terminating at the toe-of-slope before the PETM, to wide and erosive slope channel complexes feeding sediment more than 50 km into the basin during the PETM support a significant change in flow properties during the climate excursion. With time, deep-water channels tend to develop towards a state of equilibrium characterized by sinuous channel morphology and deceasing width and depth down-stream (Kneller, 2003; Pirmez and Imran, 2003; Shumaker et al., 2018). Wider channel complexes during the PETM suggest that gravity flows were larger and more erosive (Konsoer et al., 2013; Ferguson et al., 2020), and it is likely that they were denser and had more mud entrained in the flow in order to travel longer distances (Baas et al., 2004; Traer et al., 2018; Pope et al., 2022). A fundamental shift in depositional style to larger channels and lobes, combined with increased transport distance of clastic material observed in the Froan and Gimsan basins, is thus in line with recent work from other locations in the North Atlantic where the PETM was associated with higher onshore weathering rates, increased erosion and delivery of sand and clay to the marine realm (Pogge von Strandmann et al., 2021; Rush et al., 2021; Jin et al., 2022). As the fluvial system delivered sediment directly to the shelf edge during the PETM, more seasonal variations in discharge (Eldrett et al., 2014; Jolley et al., 2022) could have resulted in rapid deposition and slope failure on the upper slope together with larger and more frequent hyperpycnal flows (Petter and Steel, 2006; Henriksen et al., 2011), triggering the inferred change in gravity-flow size and composition inferred during the PETM. However, in contrast to Jin et al. (2022) who demonstrated increased sand delivery to the deep-water North Sea basin, the Froan example documents increased mud-delivery to the distal deep-water Gimsan basin during the PETM. A similar transition toward more mud-rich deposits during the PETM has also been described from deep-water settings in the Pyrenees (Pujalte et al., 2015) and Gulf of Mexico (Sharman et al., 2022).
Jin et al. (2022) also documented an order of magnitude increase in sedimentation rates during the PETM in the North Sea from well data. When calculating sedimentation rates for wells 6407/12-2 and 6407/11-1 (Supplementary Table S2), both wells similarly show an increase in sedimentation rate from 8–75 m/Myr before the PETM, to 270–350 m/Myr during the PETM, and back to <140 m/Myr after the event. This variability supports the idea that the climate excursion was associated with an order-of-magnitude increase in sedimentation rates when measured in one-dimensional well data. However, when comparing volumetrics from seismic units it becomes clear that the change in sediment supply across the PETM was less dramatic (Supplementary Table S3). When we use the PETM thickness maps in Figure 5 and assume a PETM thickness of 10–20 m in the distal basin (where the interval is below seismic resolution), and a duration of 100–200 kyr, we can calculate high and low sediment supply scenarios before, during and after the PETM (Supplementary Table S3). The results show that the transition from UT3 to the PETM was associated with up to an order of magnitude increase in sediment supply, from 46 km3/Myr during deposition of UT3 to 185–470 km3/Myr during the PETM. After the PETM, sediment supply decreased to 111 and 153 km3/Myr during UY1 and UY2, respectively. There are significant uncertainties associated with these numbers since the units have internal unconformities and as parts of the sediment budget may not be accounted for, but the overall trend is that although the transition into the PETM was associated with up to an order of magnitude increase in sediment supply, the sediment supply immediately after the hyperthermal was only deduced by 50%–75%. One possibility is that the order-of-magnitude increase in sedimentation rate observed in well data might be biased towards local areas of active deposition and/or a result from averaging over short time intervals (Schumer and Jerolmack, 2009). Another key factor is that the PETM in the Froan Basin occurred during forced regression, when shelf accommodation was lower compared to the preceding UT3 unit. This transition from normal to forced regression shifted the depocenter basinward and the full volumetric extent of the unit is thus better preserved in the rock record. We suspect that the real increase in sediment delivery to the Froan Basin during the PETM was more moderate (2–4 times the pre- and post PETM supply), and that the order-of-magnitude values identified in individual wells may not be indicative of changes in sediment supply for an entire source-to-sink system during such rapid climate events.
From the discussion above it is clear the PETM response in well data is highly dependent on the sample location along the sediment routing system and the local interplay between accommodation and sediment supply. In the North Atlantic, PETM eustatic sea-level rise appears to have been balanced by rapid dynamic uplift in many locations, resulting in overall regression and deposition of a sand-rich unit in areas that were already dominated by basin-floor fan deposition (Vieira and Jolley, 2020; Jin et al., 2022). The expression of the PETM climate signal is further dependent on the sampling location along the routing system. The sand-dominated PETM succession sampled by Jin et al. (2022) was in a medial to distal position of an older sand-rich basin floor fan system and it is possible that a well in a more distal position will capture a more mud-rich PETM signal as observed in well 6407/8-1 in the Froan Basin (Figure 14). Similarly, a more proximal sampling location along the channel complexes and toe-of-slope deposits in the Froan Basin would likely have recorded a thicker and more sand-rich PETM succession. The proximal, but off-axis position of well 6407/12-2 captures a relatively thick, silty, and mud-rich PETM succession. The integration of seismic geomorphology is therefore key to understand the system-wide context of one-dimensional well data and the response of an entire source-to-sink system to rapid climate change.
Sediment partitioning—External controls
Sediment partitioning, stratigraphic architecture and the spatial-temporal link between shallow and deep-water deposits reflect the interplay between external controls on accommodation and sediment supply, autogenic processes, and local environmental processes (Gawthorpe et al., 1994; Madof et al., 2016; Straub, 2019; Paumard et al., 2020). In supply-dominated settings, sediment dispersal to the basin floor can occur throughout the sea-level cycle (e.g., Carvajal and Steel, 2006), especially in greenhouse systems where shelves may have been relatively narrow compared to icehouse systems (Burgess et al., 2022).
Our data analysis from the Froan Basin demonstrate that long-term transient uplift and subsidence drove the large-scale partitioning of sediments along the margin, whereas short-lived eustatic fluctuations, isostasy and environmental processes controlled spatial changes in sedimentation. During the initial phase of normal regression (Figure 4), sediments were largely trapped locally in topsets and proximal foresets (Figure 15), expressed by high proximal sedimentation rates (up to 350 m/Myr) and rapid basinward thinning of foresets during UT3. Sediment partitioning changed at the onset of forced regression when the shelf-break trajectory fell and when there was no accommodation landward of the advancing shoreline (UY1). Lack of accommodation resulted in thick foresets and bottomsets, aggradation and progradation of toe-of-slope aprons across a larger area and with high sedimentation rates (up to 200 m/Myr). The observed shift in sediment partitioning is similar to previous studies (Porębski and Steel, 2003; Johannessen and Steel, 2005), showing that basin floor fans (or toe-of-slope aprons) can develop in front of supply-dominated shelves even with rising shelf-break trajectories (Helland-Hansen and Martinsen, 1995), but that those fans tend to be thinner and have shorter run-out lengths compared to the ones developed when the trajectory is flat or falling (Carvajal and Steel, 2006; Koo et al., 2016). As accommodation increased during UY2 and UY3, sediments were trapped on the shelf. UY3 covers around 3–4 Myrs of deposition and the resulting sedimentation rates on the shelf are thus low (up to 50 m/Myr), suggesting that sediment accumulated landward of the shelf, possibly combined by an overall lower sediment supply.
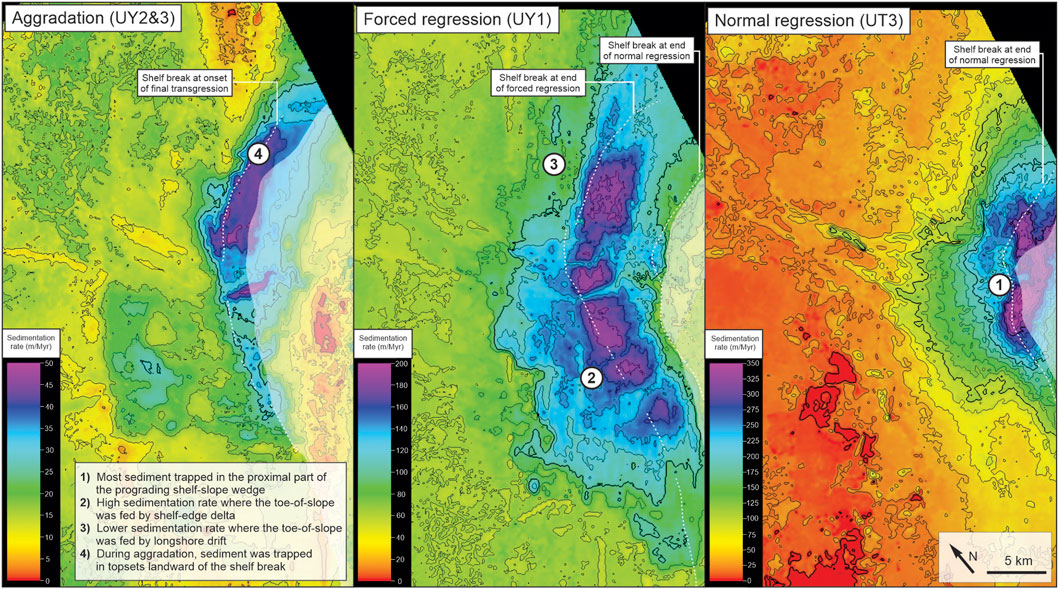
FIGURE 15. Sediment partitioning during normal regression, forced regression and aggradation. During normal regression (UT3), sedimentation rates were high in the proximal part as material was trapped in topsets and foresets with little bypass beyond the toe-of-slope. During forced regression (UY1), the shelf prograded ∼7 km basinward and sedimentation rates were high in foresets and in toe-of-slope aprons. Sedimentation rates were highest in front of the active shelf-edge deltas, decreasing nothward where the shelf was supplied by longshore drift. During aggradation (UY2&3), most sediment was trapped on the shelf and the overall sedimentation rate was low. Note the difference in scale.
Sediment partitioning—Environmental controls vs. autogenic processes
Within such a framework of tectonically controlled sediment partitioning during normal regression, forced regression and aggradation, local autogenic processes also controlled sediment distribution along the margin. Figure 7I, section A shows that each successive phase of clinothem progradation stopped near the shelf break established during maximum regression of UY1. The concept of autoretreat suggests that increasing space in front of the advancing delta eventually will cause backstepping (Muto and Steel, 2002), but the seismic geomorphology also shows that the process regime changed as the delta of UY2 approached the shelf break. Northward sediment transport by littoral currents removed parts of the sediment from the advancing shoreline, preventing further progradation. The littoral drift became stronger as the delta approached the shelf break (Dixon et al., 2012), evident from the change in clinothem progradation direction near the shelf break (Figures 7E,F). Although the point of autoretreat can be determined by a suite of intrinsic variables (Burgess et al., 2008), we suggest the process of sediment removal by longshore drift may have been just as important as increasing accommodation in partitioning sediment across and along the shelf during each phase of clinothem progradation.
Sediment partitioning—Processes regime
Figure 12 shows how the slope gradient changes along strike at the top of UY2 from 1 to 3 degrees in the area of direct fluvial supply in the south to as much as 7 degrees northward where the margin was wave-dominated and where sediment was supplied by longshore drift. Here the slope and toe-of-slope is dominated by mass wasting and local development of small lobes in front of canyons fed by longshore drift (Figure 7D). The toe-of-slope in the northernmost part of the study area shows few signs of gravity deposits (Figure 7G), indicating that most of the sediment transported by longshore drift was captured by canyons and gullies before reaching the northernmost part of the shelf. As documented in several other areas, the change in process regime along strike shows that the fluvial-dominated shelf-edge environment in Froan was more efficient in bypassing sediment to the toe-of-slope than the wave dominated part of the systems (Dixon et al., 2012; Cosgrove et al., 2018; Paumard et al., 2020). This along-strike change in gradient and mechanism of sediment delivery from the shelf to the deep-water is similar to the two modes of shelf margin development described in Fisher et al. (2021): out-of-grade margins are typically associated with sediment delivery through shelf-incised canyons resulting in slope onlap and basin floor aggradation, whereas direct-fed margins often show more unconfined sediment delivery to the slope and basin floor causing progradation along the entire shelf-slope system (Hadler-Jacobsen et al., 2005). In the Froan Basin these two modes of system development occurred along strike within the same system. This along-strike variability was facilitated by a change in process regime in which longshore transport drove shelf progradation northward, resulting in steepening of the slope and initiation of canyon and gully incision capturing parts of the littoral drift and supplying it down-slope. In the case of the Froan Basin, along-strike variation in slope gradient is thus an intrinsic control and not related to large-scale basin or margin configuration.
Canyons as sediment conveyers during highstand and lowstand
Submarine canyons fed by littoral drift in modern systems show that they tend to be most active during sea-level rise or highstand, when vigorous longshore currents develop, and that they often are disconnected from sediment supply during lowstands (Covault et al., 2007; Bernhardt and Schwanghart, 2021). Supply to canyon heads during transgression and highstand conditions may also have occurred in the Froan Basin, but in addition, the change in clinoform progradation during deposition of UY1 and UY2 shows that longshore transport must have been prominent also during forced regression. Such an interpretation is backed by a simple mass balance comparison showing that the volume of sediment stored in the lobe in front of the northern incision in Figure 11 is ∼3.8 km3, whereas the volume missing within the incision is only 0.008 km3 (Figure 11F). This calculation shows that the dendritic incision itself cannot have supplied the material to the lobe and that longshore drift must have been the main source of sediment for the toe-of-slope lobe deposits.
The preferred model is one where sediment supplied from longshore currents was trapped and conveyed down slope during forced regression when dendritic incisions and incipient valleys formed along the shelf (Figure 11). Since canyons did not extend far across the shelf, the amount of sediment delivered by longshore drift during transgression was likely relatively low. The key mechanism for highstand feeding of canyons in modern systems is the presence of deep, shelf-indented canyons that can bypass sediment from the highstand shoreline. In the Froan Basin UY1 canyons were largely backfilled during transgression and UY2 canyons did not extend far across the shelf, suggesting that these were not important sediment conveyers during highstands.
Conclusion
Integration of well and chronostratigraphic data together with high-resolution seismic geomorphology have allowed us to investigate the interaction between long-term tectonic uplift, short-lived PETM climate change, and more intrinsic environmental processes in six Selandian-Ypresian seismic units in the Froan Basin in the Norwegian Sea.
Transient uplift resulted in a relative sea-level fall of at least 300 m, accompanied by forced regression, valley incision and the formation of rapidly prograding shelf-edge deltas and toe-of-slope aprons. Despite subaerial exposure and valley incision ∼0.5 Myr after the PETM, deep-water toe-of-slope aprons were deposited within 15 km from the shelf break at maximum regression and deep-water systems did not reach the distal Gimsan Basin. In contrast, the PETM climate event was associated with wide bypass channels on the slope, aggradational sandy channel complexes on the proximal basin floor, and the deposition of a mud-rich basin floor fan in the distal part of the basin >50 km from the shelf break. This fundamental shift in depositional style indicates that the hyperthermal event was associated with larger and more mud-rich gravity flows at the shelf edge, probably triggered by higher and more seasonal variable runoff in the fluvial system. This shows that short-lived climate changes can have greater impact on the architecture (width, thickness and run-out distance of channels and lobes) of deep-water sedimentary systems than basinward shift of accommodation during periods of sea-level lowstands. In contrast to many other locations around the world where the PETM occurred during transgression, there was no flooded shelf to buffer the climate signal in the Froan Basin. The climate signal was therefore efficiently transferred from the fluvial to the deep-marine part of the system.
Our analysis further shows that the morphology of incised valleys formed at the time of maximum regression between ∼55.5 and 55 Ma reflects the proximity to the sediment source. Where sediment was fed directly to shelf-edge deltas, the slope gradient was lower and no valleys, canyons or gullies formed. Progradation of the northern part of the shelf was driven by longshore sediment transport. Here the slope was steeper, resulting in the formation of erosional networks and incised valleys which funneled longshore-fed sediment down-slope, suggesting that incised valleys and canyons were not the main conveyor of sediment between the terrestrial and deep-marine part of the system.
The studied shelf-slope succession in the Froan Basin is the only example of a Paleogene wedge with well-preserved shorelines and shelf-edge geometries along the Norwegian continental shelf. Timing of subaerial exposure and phases of shoreline advance share many similarities with the East Shetland Basin and Faroe-Shetland Basin, pointing to a regional common driver for key stratigraphic events in these basins. The Froan Basin is thus a key datapoint for understanding the regional stratigraphic response to tectonic uplift in the North Atlantic region.
Data availability statement
The data analyzed in this study is subject to the following licenses/restrictions: The datasets used in this study (PGS18M05 and PGS17M05) is not publicly available and is proprietary to PGS. Requests to access these datasets should be directed to https://www.pgs.com/.
Author contributions
TS designed the study, conducted the main analysis and wrote the bulk of the manuscript. PS, SH, and JS were involved in data interpretation, discussion and manuscript writing. OM and LV were involved in discussion and manuscript writing.
Funding
The study was funded by Equinor ASA.
Acknowledgments
We thank Equinor for the permission to share this study and PGS for permission to publish the seismic data. We thank Stefanie Tofelde and Valerio Acocella for editorial processing together with Glenn R. Sharman and James Kennedy for providing useful comments to our manuscript. We also thank Linn Margareth Johansen, Eric Blanc, Michal Warchol, Michal Janocko and Halvor Bunkholt for discussions.
Conflict of interest
Authors TS, SH, QM, PS, JS, were employed by the company Equinor ASA.
The remaining author declares that the research was conducted in the absence of any commercial or financial relationships that could be construed as a potential conflict of interest.
Publisher’s note
All claims expressed in this article are solely those of the authors and do not necessarily represent those of their affiliated organizations, or those of the publisher, the editors and the reviewers. Any product that may be evaluated in this article, or claim that may be made by its manufacturer, is not guaranteed or endorsed by the publisher.
Supplementary material
The Supplementary Material for this article can be found online at: https://www.frontiersin.org/articles/10.3389/feart.2023.1082203/full#supplementary-material
References
Aali, M., Richards, B., Nedimović, M. R., Maselli, V., and Gibling, M. R. (2021). Geometrical Breakdown Approach to interpretation of depositional sequences. Geosphere 17, 1454–1471. doi:10.1130/ges02371.1
Armitage, J. J., Duller, R. A., Whittaker, A. C., and Allen, P. A. (2011). Transformation of tectonic and climatic signals from source to sedimentary archive. Nat. Geosci. 4, 231–235. doi:10.1038/ngeo1087
Baas, J. H., Van Kesteren, W., and Postma, G. (2004). Deposits of depletive high-density turbidity currents: A flume analogue of bed geometry, structure and texture. Sedimentology 51, 1053–1088. doi:10.1111/j.1365-3091.2004.00660.x
Beelen, D., Jackson, C. A. L., Patruno, S., Hodgson, D. M., and Trabucho Alexandre, J. P. (2019). The effects of differential compaction on clinothem geometries and shelf-edge trajectories. Geology 47, 1011–1014. doi:10.1130/g46693.1
Beerling, D., and Jolley, D. (1998). Fossil plants record an atmospheric 12CO2 and temperature spike across the Palaeocene-Eocene transition in NW Europe. J. Geol. Soc. 155, 591–594. doi:10.1144/gsjgs.155.4.0591
Bernhardt, A., and Schwanghart, W. (2021). Where and why do submarine canyons remain connected to the shore during sea-level rise? Insights from global topographic analysis and bayesian regression. Geophys. Res. Lett. 48, e2020GL092234. doi:10.1029/2020gl092234
Berton, F., Vesely, F. F., Guedes, C. F. C., Souza, M. C., and Angulo, R. J. (2021). Subsurface geomorphology of wave-dominated nearshore deposits: Contrasting styles of reservoir heterogeneity in response to shoreline trajectory. Mar. Petroleum Geol. 124, 104821. doi:10.1016/j.marpetgeo.2020.104821
Blum, M., Martin, J., Milliken, K., and Garvin, M. (2013). Paleovalley systems: Insights from Quaternary analogs and experiments. Earth-Science Rev. 116, 128–169. doi:10.1016/j.earscirev.2012.09.003
Blum, M., Rogers, K., Gleason, J., Najman, Y., Cruz, J., and Fox, L. (2018). Allogenic and autogenic signals in the stratigraphic record of the deep-sea bengal fan. Sci. Rep. 8, 7973. doi:10.1038/s41598-018-25819-5
Blystad, A. H., Brekke, H., Færseth, R. B., Larsen, B. T., Skogseid, J., and Tørubakken, H. (1995). Structural elements of the Norwegian continental shelf, Part II. The Norwegian Sea region. Nor. Pet. Dir. Bull. 8, 45.
Brunstad, H., Gradstein, F., Lie, J. E., Hammer, Ø., Munsterman, D., Ogg, G., et al. (2013). Stratigraphic guide to the rogaland group, Norwegian North Sea. Newsletters Stratigr. 46, 137–286. doi:10.1127/0078-0421/2013/0032
Bryn, B. K. L., and Ackers, M. A. (2014). Unravelling the nature of deep-marine sandstones through the linkage of seismic geomorphologies to sedimentary facies; the Hermod Fan, Norwegian North Sea. Depositional Syst. Sediment. Successions Nor. Cont. Margin, 647–676. doi:10.1002/9781118920435.ch22
Bujak, J., and Mudge, D. (1994). A high-resolution North Sea Eocene dinocyst zonation. J. Geol. Soc. 151, 449–462. doi:10.1144/gsjgs.151.3.0449
Bullimore, S., Henriksen, S., Liestøl, F. M., and Helland-Hansen, W. (2005). Clinoform stacking patterns, shelf-edge trajectories and facies associations in Tertiary coastal deltas, offshore Norway: Implications for the prediction of lithology in prograding systems. Nor. J. Geology/Norsk Geol. Forening 85.
Bunkholt, H. S. S., Oftedal, B. T., Hansen, J. A., Løseth, H., and Kløvjan, O. S. (2021). Trøndelag Platform and halten–dønna terraces composite tectono-sedimentary element, 57. London, UK: Norwegian Rifted Margin.
Burgess, P. M., and Prince, G. D. (2015). Non-unique stratal geometries: Implications for sequence stratigraphic interpretations. Basin Res. 27, 351–365. doi:10.1111/bre.12082
Burgess, P. M., Steel, R. J., Granjeon, D., Hampson, G., and Dalrymple, R. (2008). Stratigraphic forward modeling of basin-margin clinoform systems: Implications for controls on topset and shelf width and timing of formation of shelf-edge deltas. Recent Adv. models siliciclastic shallow-marine Stratigr. 90, 35–45.
Burgess, P. M., Zhang, J., and Steel, R. (2022). Narrow is normal: Exploring the extent and significance of flooded marine shelves in icehouse, transitional, and greenhouse climate settings. Geology 50, 496–499. doi:10.1130/g49468.1
Catuneanu, O. (2002). Sequence stratigraphy of clastic systems: Concepts, merits, and pitfalls. J. Afr. Earth Sci. 35, 1–43. doi:10.1016/s0899-5362(02)00004-0
Carmichael, M. J., Inglis, G. N., Badger, M. P., Naafs, B. D. A., Behrooz, L., Remmelzwaal, S., et al. (2017). Hydrological and associated biogeochemical consequences of rapid global warming during the Paleocene-Eocene Thermal Maximum. Glob. Planet. Change 157, 114–138. doi:10.1016/j.gloplacha.2017.07.014
Carvajal, C. R., and Steel, R. J. (2006). Thick turbidite successions from supply-dominated shelves during sea-level highstand. Geology 34, 665–668. doi:10.1130/g22505.1
Champion, M. S., White, N., Jones, S., and Lovell, J. (2008). Quantifying transient mantle convective uplift: An example from the Faroe-Shetland basin. Tectonics 27. doi:10.1029/2007tc002106
Conway-Jones, B. W., and White, N. (2022). Paleogene buried landscapes and climatic aberrations triggered by mantle plume activity. Earth Planet. Sci. Lett. 593, 117644. doi:10.1016/j.epsl.2022.117644
Cosgrove, G. I., Hodgson, D. M., Poyatos-Moré, M., Mountney, N. P., and Mccaffrey, W. D. (2018). Filter or conveyor? Establishing relationships between clinoform rollover trajectory, sedimentary process regime, and grain character within intrashelf clinothems, offshore New Jersey, USA. J. Sediment. Res. 88, 917–941. doi:10.2110/jsr.2018.44
Covault, J. A., Normark, W. R., Romans, B. W., and Graham, S. A. (2007). Highstand fans in the California borderland: The overlooked deep-water depositional systems. Geology 35, 783–786. doi:10.1130/g23800a.1
Cullen, T. M., Collier, R. E. L., Hodgson, D. M., Gawthorpe, R. L., Kouli, K., Maffione, M., et al. (2021). Deep-water syn-rift stratigraphy as archives of early-mid Pleistocene palaeoenvironmental signals and controls on sediment delivery. Front. Earth Sci. 9. doi:10.3389/feart.2021.715304
Cullis, S., Patacci, M., Colombera, L., Bührig, L., and Mccaffrey, W. D. (2019). A database solution for the quantitative characterisation and comparison of deep-marine siliciclastic depositional systems. Mar. Petroleum Geol. 102, 321–339. doi:10.1016/j.marpetgeo.2018.12.023
Dalrymple, R. W., Zaitlin, B. A., and Boyd, R. (1992). Estuarine facies models - conceptual basis and stratigraphic implications. J. Sediment. Petrology 62, 1130–1146. doi:10.1306/d4267a69-2b26-11d7-8648000102c1865d
Dam, G., Larsen, M., and Sønderholm, M. (1998). Sedimentary response to mantle plumes: Implications from Paleocene onshore successions, West and East Greenland. Geology 26, 207–210. doi:10.1130/0091-7613(1998)026<0207:srtmpi>2.3.co;2
Denison, C. N. (2021). Stratigraphic and sedimentological aspects of the worldwide distribution of Apectodinium in Paleocene/Eocene Thermal Maximum deposits. Geol. Soc. Lond. Spec. Publ. 511, 269–308. doi:10.1144/sp511-2020-46
Dixon, J., Steel, R., and Olariu, C. (2012). Shelf-edge delta regime as a predictor of deep-water deposition. J. Sediment. Res. 82, 681–687. doi:10.2110/jsr.2012.59
Dixon, R., Schofield, K., Anderton, R., Reynolds, A., Alexander, R., Williams, M., et al. (1995). Sandstone diapirism and clastic intrusion in the Tertiary submarine fans of the Bruce-Beryl Embayment, Quadrant 9, UKCS, 94. London: Geological Society, London, Special Publications, 77–94.
Dmitrieva, E., Jackson, C. A. L., Huuse, M., and Kane, I. A. (2017). Regional distribution and controls on the development of post-rift turbidite systems: Insights from the Paleocene of the eastern north viking graben, offshore Norway. Geol. Soc. Lond. Pet. Geol. Conf. Ser. 8, 147–170. doi:10.1144/pgc8.31
Dore, A. G., Lundin, E. R., Jensen, L. N., Birkeland, O., Eliassen, P. E., and Fischler, C. (1999). “Principal tectonic events in the evolution of the Northwest European Atlantic margin,” in Petroleum geology of Northwest Europe: proceedings of the 5th conference. Editors A. J. Fleet, and S. A. R. Boldy (London: Geological Society), 41–46.
Ducassou, E., Migeon, S., Mulder, T., Murat, A., Capotondi, L., Bernasconi, S. M., et al. (2009). Evolution of the nile deep-sea turbidite system during the late quaternary: Influence of climate change on fan sedimentation. Sedimentology 56, 2061–2090. doi:10.1111/j.1365-3091.2009.01070.x
Dypvik, H., Riber, L., Burca, F., Rüther, D., Jargvoll, D., Nagy, J., et al. (2011). The paleocene–eocene thermal maximum (PETM) in svalbard — Clay mineral and geochemical signals. Palaeogeogr. Palaeoclimatol. Palaeoecol. 302, 156–169. doi:10.1016/j.palaeo.2010.12.025
Edwards, C., Mcquaid, S., Easton, S., Scott, D., Couch, A., Evans, R., et al. (2018). Geological society, London, petroleum geology conference series. London: Geological Society of London, 413–428.
Eldholm, O., and Taylor, E. (1989). “Evolution of the Vøring volcanic margin,” in Proceedings of the ocean drilling program. Scientific results. Editors O. ELDHOLM, J. THIEDE, and E. TAYLOR (College Station. TX, USA: Ocean Drilling Program).
Eldrett, J., Greenwood, D., Polling, M., Brinkhuis, H., and Sluijs, A. (2014). A seasonality trigger for carbon injection at the Paleocene–Eocene Thermal Maximum. Clim. Past 10, 759–769. doi:10.5194/cp-10-759-2014
Færseth, R. B., and Lien, T. (2002). Cretaceous evolution in the Norwegian Sea - a period characterized by tectonic quiescence. Mar. Petroleum Geol. 19, 1005–1027. doi:10.1016/s0264-8172(02)00112-5
Ferguson, R. A., Kane, I. A., Eggenhuisen, J. T., Pohl, F., Tilston, M., Spychala, Y. T., et al. (2020). Entangled external and internal controls on submarine fan evolution: An experimental perspective. Depositional Rec. 6, 605–624. doi:10.1002/dep2.109
Fisher, W. L., Galloway, W. E., Steel, R. J., Olariu, C., Kerans, C., and Mohrig, D. (2021). Deep-water depositional systems supplied by shelf-incising submarine canyons: Recognition and significance in the geologic record. Earth-Science Rev. 214, 103531. doi:10.1016/j.earscirev.2021.103531
Flament, N., Gurnis, M., Williams, S., Seton, M., Skogseid, J., Heine, C., et al. (2014). Topographic asymmetry of the South Atlantic from global models of mantle flow and lithospheric stretching. Earth Planet. Sci. Lett. 387, 107–119. doi:10.1016/j.epsl.2013.11.017
Friedrich, A. M., Bunge, H.-P., Rieger, S. M., Colli, L., Ghelichkhan, S., and Nerlich, R. (2018). Stratigraphic framework for the plume mode of mantle convection and the analysis of interregional unconformities on geological maps. Gondwana Res. 53, 159–188. doi:10.1016/j.gr.2017.06.003
Gale, A. S., and Lovell, B. (2018). The Cretaceous–Paleogene unconformity in England: uplift and erosion related to the Iceland mantle plume. Proc. Geol. Assoc. 129, 421–435. doi:10.1016/j.pgeola.2017.04.002
Gawthorpe, R. L., Fraser, A. J., and Collier, R. E. L. (1994). Sequence stratigraphy in active extensional basins: Implications for the interpretation of ancient basin-fills. Mar. petroleum Geol. 11, 642–658. doi:10.1016/0264-8172(94)90021-3
Gernigon, L., Zastrozhnov, D., Planke, S., Manton, B., Abdelmalak, M. M., Olesen, O., et al. (2021). A digital compilation of structural and magmatic elements of the Mid-Norwegian continental margin (version 1.0). Nor. J. Geology/Norsk Geol. Forening 101. doi:10.17850/njg101-3-2
Gjelberg, J. G., Enoksen, T., Kjærnes, P., Mangerud, G., Martinsen, O. J., Roe, E., et al. (2001). “The maastrichtian and danian depositional setting, along the eastern margin of the Møre Basin (mid-Norwegian shelf): Implications for reservoir development of the ormen lange field,” in Sedimentary environments offshore Norway - paleozoic to recent. Editors O. J. MARTINSEN, and T. DREYER (Amsterdam: Norwegian Petroleum Society Special Publication).
Gong, C., Blum, M. D., Wang, Y., Lin, C., and Xu, Q. (2018). Can climatic signals be discerned in a deep-water sink? An answer from the Pearl River source-to-sink sediment-routing system. GSA Bull. 130, 661–677. doi:10.1130/b31578.1
Goodbred, S. L. (2003). Response of the ganges dispersal system to climate change: A source-to-sink view since the last interstade. Sediment. Geol. 162, 83–104. doi:10.1016/s0037-0738(03)00217-3
Guarnieri, P. (2015). Pre-break-up palaeostress state along the East Greenland margin. J. Geol. Soc. 172, 727–739. doi:10.1144/jgs2015-053
Hadler-Jacobsen, F., Johannessen, E., Ashton, N., Henriksen, S., Johnson, S., and Kristensen, J. (2005). Geological society, London, petroleum geology conference series. London: Geological Society of London, 1121–1145.
Hajek, E. A., and Straub, K. M. (2017). Autogenic sedimentation in clastic stratigraphy. Annu. Rev. Earth Planet. Sci. 45, 681–709. doi:10.1146/annurev-earth-063016-015935
Harding, I. C., Charles, A. J., Marshall, J. E., Pälike, H., Roberts, A. P., Wilson, P. A., et al. (2011). sea-level and salinity fluctuations during the paleocene–eocene thermal maximum in arctic spitsbergen. Earth Planet. Sci. Lett. 303, 97–107. doi:10.1016/j.epsl.2010.12.043
Hardman, J. P. A., Schofield, N., Jolley, D. W., Holford, S. P., Hartley, A. J., Morse, S., et al. (2018). Prolonged dynamic support from the Icelandic plume of the NE Atlantic margin. J. Geol. Soc. 175, 396–410. doi:10.1144/jgs2017-088
Harris, A. D., Covault, J. A., Baumgardner, S., Sun, T., and Granjeon, D. (2020). Numerical modeling of icehouse and greenhouse sea-level changes on a continental margin: Sea-level modulation of deltaic avulsion processes. Mar. Petroleum Geol. 111, 807–814. doi:10.1016/j.marpetgeo.2019.08.055
Hartley, R. A., Roberts, G. G., White, N., and Richardson, C. (2011). Transient convective uplift of an ancient buried landscape. Nat. Geosci. 4, 562–565. doi:10.1038/ngeo1191
Hartog Jager, D. D., Giles, M., and Griffiths, G. (1993). Evolution of Paleogene submarine fans of the North sea in space and time. Geological society, London, petroleum geology conference series. London: The Geological Society of London, 59–71.
Helland-Hansen, W., and Martinsen, O. J. (1996). Shoreline trajectories and sequences: Description of variable depositional-dip scenarios. J. Sediment. Res. 66, 670–688.
Henriksen, S., Fischler, C., Grønlie, A., Henningsen, T., Laursen, I., Løseth, H., et al. (2005). “The norwegain sea during the cenozoic,” in Onshore-offshore relationships on the North atlantic margin: Norwegian petroleum society special publication. Editors B. T. G. Wandås, J. P. Nystuen, E. A. Eide, and F. Gradstein (Amsterdam: Elsevier), 111–113.
Henriksen, S., Pontén, A., Janbu, N., and Paasch, B. (2011). “The importance of sediment supply and sequence-stacking pattern in creating hyperpycnal flows,” in Sediment transfer from shelf to deep water—Revisiting the delivery system: AAPG Studies in Geology. Editors R. M. Slatt, and C. Zavala (Tulsa, OK: American Association of Petroleum Geologists), Vol. 61, 129–152.
Hovikoski, J., Fyhn, M. B. W., Nøhr-Hansen, H., Hopper, J. R., Andrews, S., Barham, M., et al. (2021). Paleocene-Eocene volcanic segmentation of the Norwegian-Greenland seaway reorganized high-latitude ocean circulation. Commun. Earth Environ. 2, 172. doi:10.1038/s43247-021-00249-w
Jennette, D. C., Garfield, T. R., Mohrig, D. C., and Cayley, G. T. (2000). The interaction of shelf accommodation, sediment supply and sea level in controlling the facies, architecture and sequence stacking patterns of the Tay and Forties/Sele basin-floor fans. Central North Sea.
Jerolmack, D. J., and Paola, C. (2010). Shredding of environmental signals by sediment transport. Geophys. Res. Lett. 37, n/a. doi:10.1029/2010gl044638
Jin, S., Kemp, D. B., Jolley, D. W., Vieira, M., Zachos, J. C., Huang, C., et al. (2022). Large-scale, astronomically paced sediment input to the North Sea basin during the Paleocene Eocene thermal maximum. Earth Planet. Sci. Lett. 579, 117340. doi:10.1016/j.epsl.2021.117340
Johannessen, E. P., and Steel, R. J. (2005). Shelf-margin clinoforms and prediction of deepwater sands. Basin Res. 17, 521–550. doi:10.1111/j.1365-2117.2005.00278.x
Jolley, D., Vieira, M., Jin, S., and Kemp, D. B. (2022). Palynofloras, palaeoenvironmental change and the inception of the Paleocene Eocene thermal maximum; the record of the Forties fan, sele formation, North Sea basin. J. Geol. Soc. 180, jgs2021–131. doi:10.1144/jgs2021-131
Jolley, D. W., Millett, J. M., Schofield, N., Broadley, L., and Hole, M. J. (2021). Stratigraphy of volcanic rock successions of the North atlantic rifted margin: The offshore record of the faroe–shetland and rockall basins. Earth Environ. Sci. Trans. R. Soc. Edinb. 112, 61–88. doi:10.1017/s1755691021000037
Jolley, D. W., and Whitham, A. G. (2004). A stratigraphical and palaeoenvironmental analysis of the sub-basaltic Palaeogene sediments of East Greenland. Pet. Geosci. 10, 53–60. doi:10.1144/1354-079302-511
Keller, P., Fawad, M., Sandvik, J., Baig, I., and Gyllenhammar, C. F. (2022). Machine learning for property extraction from seismic megamerges, northern North Sea. First Break 40, 71–75. doi:10.3997/1365-2397.fb2022077
Kender, S., Stephenson, M. H., Riding, J. B., Leng, M. J., Knox, R. W. B., Peck, V. L., et al. (2012). Marine and terrestrial environmental changes in NW Europe preceding carbon release at the Paleocene–Eocene transition. Earth Planet. Sci. Lett. 353, 108–120. doi:10.1016/j.epsl.2012.08.011
Kjoberg, S., Schmiedel, T., Planke, S., Svensen, H. H., Millett, J. M., Jerram, D. A., et al. (2017). 3D structure and formation of hydrothermal vent complexes at the Paleocene-Eocene transition, the Møre Basin, mid-Norwegian margin. Interpretation 5, SK65–SK81. doi:10.1190/int-2016-0159.1
Kneller, B. (2003). The influence of flow parameters on turbidite slope channel architecture. Mar. Petroleum Geol. 20, 901–910. doi:10.1016/j.marpetgeo.2003.03.001
Kominz, M. A., Browning, J., Miller, K., Sugarman, P., Mizintseva, S., and Scotese, C. (2008). Late Cretaceous to Miocene sea-level estimates from the New Jersey and Delaware coastal plain coreholes: An error analysis. Basin Res. 20, 211–226. doi:10.1111/j.1365-2117.2008.00354.x
Konsoer, K., Zinger, J., and Parker, G. (2013). Bankfull hydraulic geometry of submarine channels created by turbidity currents: Relations between bankfull channel characteristics and formative flow discharge. J. Geophys. Res. Earth Surf. 118, 216–228. doi:10.1029/2012jf002422
Koo, W. M., Olariu, C., Steel, R. J., Olariu, M. I., Carvajal, C. R., and Kim, W. (2016). Coupling between shelf-edge architecture and submarine-fan growth style in A supply-dominated margin. J. Sediment. Res. 86, 613–628. doi:10.2110/jsr.2016.42
Lebrec, U., Riera, R., Paumard, V., O'Leary, M. J., and Lang, S. C. (2022). Morphology and distribution of submerged palaeoshorelines: Insights from the north west shelf of Australia. Earth-Science Rev. 224, 103864. doi:10.1016/j.earscirev.2021.103864
Li, M., Bralower, T. J., Kump, L. R., Self-Trail, J. M., Zachos, J. C., Rush, W. D., et al. (2022). Astrochronology of the paleocene-eocene thermal maximum on the atlantic coastal plain. Nat. Commun. 13, 1–13. doi:10.1038/s41467-022-33390-x
Lien, T. (2005). From rifting to drifting: Effects on the development of deep-marine hydrocarbon reservoirs in a passive margin setting, Norwegian sea. Nor. J. Geol. 85, 319–332.
Liu, X., and Galloway, W. E. (1997). Quantitative determination of tertiary sediment supply to the North Sea basin. AAPG Bull. 81, 1482–1509.
Lovell, B. (2010). A pulse in the planet: Regional control of high-frequency changes in relative sea level by mantle convection. J. Geol. Soc. 167, 637–648. doi:10.1144/0016-76492009-127
Mackay, L. M., Turner, J., Jones, S. M., and White, N. J. (2005). Cenozoic vertical motions in the Moray Firth basin associated with initiation of the Iceland plume. Tectonics 24, . doi:10.1029/2004tc001683
Madof, A. S., Harris, A. D., and Connell, S. D. (2016). Nearshore along-strike variability: Is the concept of the systems tract unhinged? Geology 44, 315–318. doi:10.1130/g37613.1
Maier, K. L., Fildani, A., Paull, C. K., Mchargue, T. R., Graham, S. A., and Caress, D. W. (2013). Deep-sea channel evolution and stratigraphic architecture from inception to abandonment from high-resolution autonomous underwater vehicle surveys offshore central California. Sedimentology 60, 935–960. doi:10.1111/j.1365-3091.2012.01371.x
Martinsen, O. J. (2005). Deep-water sedimentary systems of Arctic and North Atlantic margins: An introduction. Nor. J. Geol. 85, 261–266.
Martinsen, O. J., Boen, F., Charnock, M. A., Mangerud, G., and Nottvedt, A. (1999). “Cenozoic development of the Norwegian margin 60-64 degrees N; sequences and sedimentary response to variable basin physiography and tectonic setting,” in Petroleum geology of northwest Europe: Proceedings of the 5th conference. Editors A. J. FLEET, S. A. R. BOLDY, and S. D. BURLEY (London, UK: Geological Society).
Micallef, A., Ribó, M., Canals, M., Puig, P., Lastras, G., and Tubau, X. (2014). Space-for-time substitution and the evolution of a submarine canyon–channel system in a passive progradational margin. Geomorphology 221, 34–50. doi:10.1016/j.geomorph.2014.06.008
Miller, K. G., Browning, J. V., Schmelz, W. J., Kopp, R. E., Mountain, G. S., and Wright, J. D. (2020). Cenozoic sea-level and cryospheric evolution from deep-sea geochemical and continental margin records. Sci. Adv. 6, eaaz1346. eaaz1346. doi:10.1126/sciadv.aaz1346
Mitchum, R., Vail, P. R., and Thompson, S. (1977). Seismic stratigraphy and global changes of sea level: Part 2. The depositional sequence as a basic unit for stratigraphic analysis: Section 2. Application of seismic reflection configuration to stratigraphic interpretation.
Mudge, D. C., and Jones, S. M. (2004). Palaeocene uplift and subsidence events in the Scotland–Shetland and North Sea region and their relationship to the Iceland Plume. J. Geol. Soc. 161, 381–386. doi:10.1144/0016-764903-038
Mudge, D. C. (2014). Regional controls on lower tertiary sandstone distribution in the North Sea and NE atlantic margin basins. Geol. Soc. Lond. Spec. Publ. 403, 17–42. doi:10.1144/sp403.5
Muto, T., and Steel, R. J. (2002). Role of autoretreat and A/S changes in the understanding of deltaic shoreline trajectory: A semi-quantitative approach. Basin Res. 14, 303–318. doi:10.1046/j.1365-2117.2002.00179.x
Muto, T., Steel, R. J., and Swenson, J. B. (2007). Autostratigraphy: A framework norm for genetic stratigraphy. J. Sediment. Res. 77, 2–12. doi:10.2110/jsr.2007.005
Nadin, P., and Kusznir, N. (1995). Palaeocene uplift and Eocene subsidence in the northern North Sea Basin from 2D forward and reverse stratigraphic modelling. J. Geol. Soc. 152, 833–848. doi:10.1144/gsjgs.152.5.0833
Nienhuis, J. H., Ashton, A. D., and Giosan, L. (2015). What makes a delta wave-dominated? Geology 43, 511–514. doi:10.1130/g36518.1
Nordfjord, S., Goff, J., Austin, J., and Gulick, S. (2006). Seismic facies of incised-valley fills, New Jersey continental shelf: Implications for erosion and preservation processes acting during latest pleistocene–holocene transgression. J. Sediment. Res. 76, 1284–1303. doi:10.2110/jsr.2006.108
Osmundsen, P. T., Péron-Pinvidic, G., Ebbing, J., Erratt, D., Fjellanger, E., Bergslien, D., et al. (2017). Extension, hyperextension and mantle exhumation offshore Norway: A discussion based on 6 crustal transects. Nor. J. Geol. doi:10.17850/njg96-4-05
Parker, J. (1975). “Lower tertiary sand development in the Central North Sea,” in Petroleum geology and the continental shelf of North West Europe. Editors A. W. Woodland (Barking: Applied Science), 447–453.
Patruno, S., and Helland-Hansen, W. (2018). Clinoforms and clinoform systems: Review and dynamic classification scheme for shorelines, subaqueous deltas, shelf edges and continental margins. Earth-Science Rev. 185, 202–233. doi:10.1016/j.earscirev.2018.05.016
Paumard, V., Bourget, J., Payenberg, T., George, A. D., Ainsworth, R. B., Lang, S., et al. (2020). Controls on deep-water sand delivery beyond the shelf edge: Accommodation, sediment supply, and deltaic process regime. J. Sediment. Res. 90, 104–130. doi:10.2110/jsr.2020.2
Petersen, T. G. (2019). Seismic stratigraphy of the post-breakup succession offshore Northeast Greenland: Links to margin uplift. Mar. Petroleum Geol. 103, 422–437. doi:10.1016/j.marpetgeo.2019.03.007
Petter, A. L., and Steel, R. J. (2006). Hyperpycnal flow variability and slope organization on an Eocene shelf margin, Central Basin, Spitsbergen. AAPG Bull. 90, 1451–1472. doi:10.1306/04240605144
Pirmez, C., and Imran, J. (2003). Reconstruction of turbidity currents in amazon channel. Mar. petroleum Geol. 20, 823–849. doi:10.1016/j.marpetgeo.2003.03.005
Pogge Von Strandmann, P. A., Jones, M. T., West, A. J., Murphy, M. J., Stokke, E. W., Tarbuck, G., et al. (2021). Lithium isotope evidence for enhanced weathering and erosion during the Paleocene-Eocene Thermal Maximum. Sci. Adv. 7, eabh4224. doi:10.1126/sciadv.abh4224
Pope, E. L., Cartigny, M. J., Clare, M. A., Talling, P. J., Lintern, D. G., Vellinga, A., et al. (2022). First source-to-sink monitoring shows dense head controls sediment flux and runout in turbidity currents. Sci. Adv. 8, eabj3220. doi:10.1126/sciadv.abj3220
Porębski, S. J., and Steel, R. J. (2003). Shelf-margin deltas: Their stratigraphic significance and relation to deepwater sands. Earth-Science Rev. 62, 283–326. doi:10.1016/s0012-8252(02)00161-7
Posamentier, H. (2005). Geological society, London, petroleum geology conference series. London: Geological Society of London, 1565–1576.
Posamentier, H. W., Allen, G. P., James, D. P., and Tesson, M. (1992). Forced regressions in a sequence stratigraphic framework: Concepts, examples, and exploration significance. AAPG Bull. 76, 1687–1709.
Posamentier, H. W., and Kolla, V. (2003). Seismic geomorphology and stratigraphy of depositional elements in deep-water settings. J. Sediment. Res. 73, 367–388. doi:10.1306/111302730367
Posamentier, H. W., and Morris, W. R. (2000). Aspects of the stratal architecture of forced regressive deposits. Geol. Soc. Lond. Spec. Publ. 172, 19–46. doi:10.1144/gsl.sp.2000.172.01.02
Posamentier, H. W., Paumard, V., and Lang, S. C. (2022). Principles of seismic stratigraphy and seismic geomorphology I: Extracting geologic insights from seismic data. Earth-Science Rev. 228, 103963.
Prélat, A., Pankhania, S. S., Jackson, C. A.-L., and Hodgson, D. M. (2015). Slope gradient and lithology as controls on the initiation of submarine slope gullies; Insights from the North Carnarvon Basin, Offshore NW Australia. Sediment. Geol. 329, 12–17. doi:10.1016/j.sedgeo.2015.08.009
Pujalte, V., Baceta, J., and Schmitz, B. (2015). A massive input of coarse-grained siliciclastics in the pyrenean Basin during the PETM: The missing ingredient in a coeval abrupt change in hydrological regime. Clim. Past 11, 1653–1672. doi:10.5194/cp-11-1653-2015
Rush, W. D., Kiehl, J. T., Shields, C. A., and Zachos, J. C. (2021). Increased frequency of extreme precipitation events in the North Atlantic during the PETM: Observations and theory. Palaeogeogr. Palaeoclimatol. Palaeoecol. 568, 110289. doi:10.1016/j.palaeo.2021.110289
Ryan, M., Helland-Hansen, W., Johannessen, E., and Steel, R. J. (2009). Erosional vs. accretionary shelf margins: The influence of margin type on deepwater sedimentation: An example from the porcupine basin, offshore Western Ireland. Basin Res. 21, 676–703. doi:10.1111/j.1365-2117.2009.00424.x
Samanta, A., Bera, M. K., and Sarkar, A. (2016). Climate-modulated sequence development in a tropical rift basin during the Late Palaeocene to Early Eocene super greenhouse Earth. Sedimentology 63, 917–939. doi:10.1111/sed.12243
Schumer, R., and Jerolmack, D. J. (2009). Real and apparent changes in sediment deposition rates through time. J. Geophys. Research-Earth Surf. 114, F00A06. doi:10.1029/2009jf001266
Sharman, G. R., Szymanski, E., Hackworth, R. A., Kahn, A. C. M., Febo, L. A., Oefinger, J., et al. (2022). Carbon-isotope chemostratigraphy, geochemistry, and biostratigraphy of the Paleocene-Eocene Thermal Maximum, deep-water Wilcox Group, Gulf of Mexico (U.S.A.). Clim. Past. Discuss., 1–42.
Shumaker, L. E., Jobe, Z. R., Johnstone, S. A., Pettinga, L. A., Cai, D., and Moody, J. D. (2018). Controls on submarine channel-modifying processes identified through morphometric scaling relationships. Geosphere 14, 2171–2187. doi:10.1130/ges01674.1
Skogseid, J., Planke, S., Faleide, J. I., Pedersen, T., Eldholm, O., and Neverdal, F. (2000). NE Atlantic continental rifting and volcanic margin formation. Geol. Soc. Lond. Spec. Publ. 167, 295–326. doi:10.1144/gsl.sp.2000.167.01.12
Sluijs, A., Brinkhuis, H., Crouch, E. M., John, C. M., Handley, L., Munsterman, D., et al. (2008). Eustatic variations during the Paleocene-Eocene greenhouse world. Paleoceanography 23. doi:10.1029/2008pa001615
Sluijs, A., Brinkhuis, H., Schouten, S., Bohaty, S. M., John, C. M., Zachos, J. C., et al. (2007a). Environmental precursors to rapid light carbon injection at the Palaeocene/Eocene boundary. Nature 450, 1218–1221. doi:10.1038/nature06400
Sluijs, A., Brinkhuis, H., Schouten, S., Bohaty, S. M., John, C. M., Zachos, J. C., et al. (2007b). Environmental precursors to rapid light carbon injection at the Palaeocene/Eocene boundary. Nature 450, 1218–1221. doi:10.1038/nature06400
Sømme, T. O., Helland-Hansen, W., and Granjeon, D. (2009a). Impact of eustatic amplitude variations on shelf morphology, sediment dispersal, and sequence stratigraphic interpretation: Icehouse versus greenhouse systems. Geology 37, 587–590. doi:10.1130/g25511a.1
Sømme, T. O., Martinsen, O. J., and Lunt, I. (2013). Linking offshore stratigraphy to onshore paleotopography: The Late Jurassic–Paleocene evolution of the south Norwegian margin. Geol. Soc. Am. Bull. 125, 1164–1186. doi:10.1130/b30747.1
Sømme, T. O., Martinsen, O. J., and Thurmond, J. B. (2009b). Reconstructing morphological and depositional characteristics in subsurface sedimentary systems: An example from the Maastrichtian-Danian Ormen Lange system, More Basin, Norwegian Sea. AAPG Bull. 93, 1347–1377. doi:10.1306/06010909038
Sømme, T. O., Skogseid, J., Embry, P., and Løseth, H. (2019). Manifestation of Tectonic and Climatic Perturbations in Deep-Time Stratigraphy – An Example From the Paleocene Succession Offshore Western Norway. Front. Earth Sci. 7. doi:10.3389/feart.2019.00303
Soutter, E. L., Kane, I. A., and Huuse, M. (2018). Giant submarine landslide triggered by Paleocene mantle plume activity in the North Atlantic. Geology 46, 511–514. doi:10.1130/g40308.1
Speijer, R., Pälike, H., Hollis, C., Hooker, J., and Ogg, J. (2020). “The Paleogene period,” in Geologic time scale 2020. Editors F. Gradstein, F. Ogg, M. Schmitz, and G. Ogg (Amsterdam: Elsevier), 1087–1140.
Steinberger, B., Bredow, E., Lebedev, S., Schaeffer, A., and Torsvik, T. H. (2019). Widespread volcanism in the Greenland–North Atlantic region explained by the Iceland plume. Nature Geosci. 12, 61–68. doi:10.1038/s41561-018-0251-0
Stoker, M. S., Holford, S. P., and Hillis, R. R. (2017). A rift-to-drift record of vertical crustal motions in the Faroe–Shetland Basin, NW European margin: establishing constraints on NE Atlantic evolution. J. Geol. Soc. 175, 263–274. doi:10.1144/jgs2017-076
Stokke, E. W., Jones, M. T., Riber, L., Haflidason, H., Midtkandal, I., Schultz, B. P., et al. (2021). Rapid and sustained environmental responses to global warming: the Paleocene–Eocene Thermal Maximum in the eastern North Sea. Clim. Past 17, 1989–2013. doi:10.5194/cp-17-1989-2021
Straub, K. M. (2019). Morphodynamics and Stratigraphic Architecture of Shelf-Edge Deltas Subject to Constant vs. Dynamic Environmental Forcings: A Laboratory Study. Front. Earth Sci. 7. doi:10.3389/feart.2019.00121
Stucky De Quay, G., Roberts, G. G., Watson, J. S., and Jackson, C. A. L. (2017). Incipient mantle plume evolution: Constraints from ancient landscapes buried beneath the North Sea. Geochem. Geophys. Geosystems 18, 973–993. doi:10.1002/2016gc006769
Svensen, H., Planke, S., Malthe-Sørenssen, A., Jamtveit, B., Myklebust, R., Eidem, T. R., et al. (2004). Release of methane from a volcanic basin as a mechanism for initial Eocene global warming. Nature 429, 542–545. doi:10.1038/nature02566
Thomas, R., and Hartley, A. J. (2014). Seismic geomorphology and sequence stratigraphy as tools for the prediction of reservoir facies distribution: An example from the Paleocene and earliest Eocene of the south buchan graben, outer Moray Firth basin, UKCS, 403.London, UK: Geological Society, London, Special Publications, 99–132.
Tofelde, S., Bernhardt, A., Guerit, L., and Romans, B. W. (2021). Times associated with source-to-sink propagation of environmental signals during landscape transience. Front. Earth Sci. 9, 227. doi:10.3389/feart.2021.628315
Traer, M., Fildani, A., Fringer, O., Mchargue, T., and Hilley, G. (2018). Turbidity current dynamics: 2. Simulating flow evolution toward equilibrium in idealized channels. J. Geophys. Res. Earth Surf. 123, 520–534. doi:10.1002/2017jf004202
Underhill, J. R. (2001). Controls on the Genesis and prospectivity of Paleogene palaeogeomorphic traps, East Shetland Platform, UK North Sea. Mar. Petroleum Geol. 18, 259–281. doi:10.1016/s0264-8172(00)00067-2
Vieira, M., and Jolley, D. (2020). Stratigraphic and spatial distribution of palynomorphs in deep-water turbidites: A meta-data study from the UK central North Sea Paleogene. Mar. Petroleum Geol. 122, 104638. doi:10.1016/j.marpetgeo.2020.104638
Vieira, M., Mahdi, S., and Holmes, N. (2020). High resolution biostratigraphic zonation for the UK central North Sea Paleocene. Mar. Petroleum Geol. 117, 104400. doi:10.1016/j.marpetgeo.2020.104400
Walker, F., Schofield, N., Millett, J., Jolley, D., Planke, S., and Holford, S. (2022). Paleogene drainage system evolution in the NE Faroe-Shetland Basin. J. Geol. Soc. 179. doi:10.1144/jgs2021-121
Wang, R., Colombera, L., and Mountney, N. P. (2020). Quantitative analysis of the stratigraphic architecture of incised-valley fills: a global comparison of Quaternary systems. Earth-Science Rev. 200, 102988. doi:10.1016/j.earscirev.2019.102988
White, N., and Lovell, B. (1997). Measuring the pulse of a plume with the sedimentary record. Nature 387, 888–891. doi:10.1038/43151
Zastrozhnov, D., Gernigon, L., Gogin, I., Planke, S., Abdelmalak, M. M., Polteau, S., et al. (2020). Regional structure and polyphased Cretaceous-Paleocene rift and basin development of the mid-Norwegian volcanic passive margin. Mar. Petroleum Geol. 115, 104269. doi:10.1016/j.marpetgeo.2020.104269
Zimmer, E. H., Howell, J. A., and Fielding, C. (2020). Predicting river mouth location from delta front dip and clinoform dip in modern and ancient wave-dominated deltas. Sedimentology 68, 713–736. doi:10.1111/sed.12800
Keywords: climate signal, PETM, sediment routing, shallow and deep-marine clastics, seismic geomorphology
Citation: Sømme TO, Huwe SI, Martinsen OJ, Sandbakken PT, Skogseid J and Valore LA (2023) Stratigraphic expression of the Paleocene-Eocene Thermal Maximum climate event during long-lived transient uplift—An example from a shallow to deep-marine clastic system in the Norwegian Sea. Front. Earth Sci. 11:1082203. doi: 10.3389/feart.2023.1082203
Received: 27 October 2022; Accepted: 20 January 2023;
Published: 20 February 2023.
Edited by:
Stefanie Tofelde, University of Potsdam, GermanyReviewed by:
Glenn Sharman, University of Arkansas, United StatesJames Kennedy, University of Liverpool, United Kingdom
Copyright © 2023 Sømme, Huwe, Martinsen, Sandbakken, Skogseid and Valore. This is an open-access article distributed under the terms of the Creative Commons Attribution License (CC BY). The use, distribution or reproduction in other forums is permitted, provided the original author(s) and the copyright owner(s) are credited and that the original publication in this journal is cited, in accordance with accepted academic practice. No use, distribution or reproduction is permitted which does not comply with these terms.
*Correspondence: Tor O. Sømme, dG9vc29AZXF1aW5vci5jb20=