 Xi He
Xi He Lian-Feng Zhao
 Xiao-Bi Xie3
- 1Key Laboratory of Earth and Planetary Physics, Institute of Geology and Geophysics, Chinese Academy of Sciences, Beijing, China
- 2Heilongjiang Mohe Observatory of Geophysics, Institute of Geology and Geophysics, Chinese Academy of Sciences, Beijing, China
- 3Institute of Geophysics and Planetary Physics, University of California, Santa Cruz, Santa Cruz, CA, United States
- 4School of Earth and Space Sciences, Peking University, Beijing, China
The eastward expansion of the Tibetan Plateau has resulted in extensive seismic activities in the eastern Tibetan Plateau, along with various types of faulting processes across this region. However, the crustal stress status related to these phenomena remains unclear. On 21 May 2021, the Ms 6.4 Yangbi and Ms 7.4 Maduo earthquakes with diverse focal mechanisms occurred consecutively in the Chuandian and Bayan Har blocks in the southern and northern parts of the eastern Tibetan Plateau, providing a distinct opportunity to directly compare the stresses in both flanks of the laterally expanding plateau. In this study, we estimate the stress drops of the Yangbi and Maduo earthquake sequences for all
1 Introduction
The geological evolution of the Tibetan Plateau during the Cenozoic is accompanied by well-developed fault systems and seismic activities (Figure 1); therefore, explorations into present-day seismicity and source parameters can shed light on structures and properties of the seismogenic layers, advancing our understanding of the growing process of the plateau (Molnar and Lyoncaen, 1989). In the southern and northern Tibetan Plateau, significant thrusting indicates the uplift of the Tibetan Plateau in response to the continued north-south convergence between the Indian and Eurasian plates (Yin and Harrison, 2000). Since the middle Miocene, north–south-trending normal faulting began to develop in the central Tibetan Plateau, signifying the east-west expansion of the high-rising plateau crust (e.g., Yin and Harrison, 2000; Blisniuk et al., 2001). The resulting eastward movements of crustal blocks, including the Bayan Har and Chuandian, led to reverse faulting on the Longmanshan faults that mark the eastern boundary of the Tibetan Plateau (e.g., Zheng et al., 2017) and devastating earthquakes, including the Wenchuan earthquake in 2008 and the Lushan earthquake in 2013 (Wang et al., 2015). In addition, significant strike-slip motions were also produced on the boundaries of the extruding blocks. In particular, on 21 May 2021, within ∼4.3 h, the Yangbi Ms 6.4 earthquake occurred in the Chuandian block, and the Maduo Ms 7.4 earthquake occurred in the Bayan Har block, both with primarily strike-slip faulting. However, the faulting behaviors vary across the southern boundaries of the Chuandian block and the northern boundaries of the Bayan Har block. Right-lateral strike-slip plus normal faulting and left-lateral strike-slip plus reverse faulting were obtained for the mechanism solutions of the Yangbi and Maduo earthquakes, respectively (Long et al., 2021; Zhang J. Y. et al., 2022). The various focal mechanisms may reflect intricate fault morphology and probably a complicated regional stress setting, yet the stress distributions within the fault system and related tectonic attributions remain unclear. Exploring the stress release of these earthquakes can shed light on the localized stress variability within seismogenic faults and improve our understanding of the nature of plateau expansion (Holt et al., 1991; Zhang et al., 2010; Sun et al., 2018).
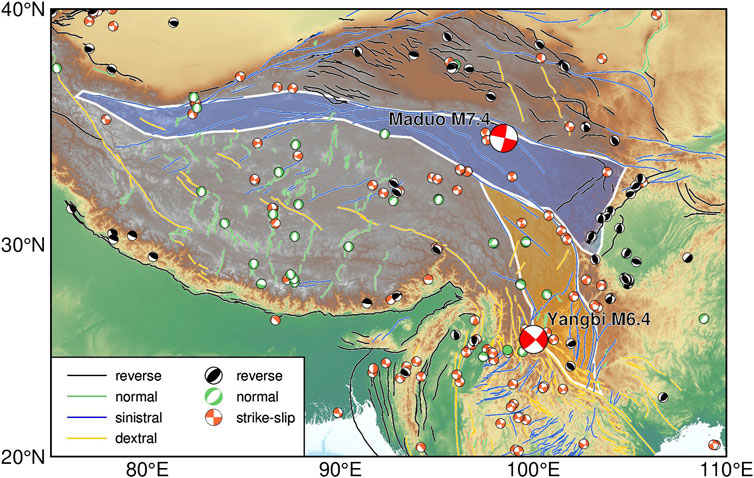
FIGURE 1. Map showing active faults (lines) and moderate to large earthquakes (beach balls) on the Tibetan Plateau, with their kinematic types coded by colors. Geological blocks filled with blue and yellow are the Bayan Har and Chuandian blocks, respectively. Locations and focal mechanisms of the 2021 May Yangbi and Maduo earthquakes are indicated by red beach balls.
The stress drop is defined as the difference between the average stresses on a fault before and after an earthquake (e.g., Shearer et al., 2006). It is one of the fundamental source-scaling parameters, providing information on the rupture processes and underlying tectonics controlling them (e.g., Allmann and Shearer, 2009; Abercrombie, 2014). The stress drop of earthquakes can be an indicator of the localized stress variability of the seismogenic fault (e.g., Allmann and Shearer, 2007; Yamada et al., 2010), whereas it is not equivalent to the overall stress levels of faults. Rupture simulations demonstrated that keeping the same stress drop at different stress levels can produce identical synthetic waveforms, even in near field (Weng and Yang, 2018; Yao and Yang, 2020). Since both Yangbi and Maduo earthquake sequences were primarily strike-slip faulting, it is not necessary to attribute the difference in stress drop to focal mechanisms and we can explore the localized stress variability in the eastern Tibetan Plateau by straightforward comparison of the stress drops between the two earthquake sequences. However, the stress drop is calculated based on reliable restoration of the earthquake source spectrum, which can be easily distorted by seismic attenuation and shallow structures beneath stations. Several methods have been developed to solve this, including the empirical Green’s function method (Shearer et al., 2006) and the generalized joint inversion method to solve for both the source and path attenuation (Oth et al., 2011). However, the rapid development in attenuation tomography over recent years has inspired us with a novel approach to directly remove the attenuation and site effects from the observed spectra based on the established attenuation model (He et al., 2020). Zhao et al. (2010) developed a broadband Lg-wave attenuation tomography scheme that utilized both source-station amplitudes and interstation amplitude ratios to obtain the high-resolution broadband Lg-wave Q model. This method was then improved to incorporate the interevent amplitude ratios thus the site response for each station could also be inverted (Zhao and Xie, 2016). By using the this method, a high-resolution broadband Lg-wave Q model was obtained for China, which is consistent with geological features (Zhao et al., 2010; 2013b; Zhao et al., 2013a; He X. et al., 2021). The site responses were also obtained for relevant stations. Taking advantage of attenuation and site response dataset, the accurate of the stress drop estimates for the 21 May 2021 Yangbi and Maduo earthquake sequences can be achieved.
In this study, we retrieve Lg-wave source spectra for earthquakes with magnitudes
2 Data and method
2.1 Regional dataset
In this study, 105 earthquakes were selected from the catalog of the China Earthquake Network Center (CENC), including the 21 May 2021 Yangbi mainshock, with 11 foreshocks after 13 May and 39 aftershocks before 1 June, and the Maduo mainshock, with 53 aftershocks before 1 June. These earthquakes were selected according to magnitudes
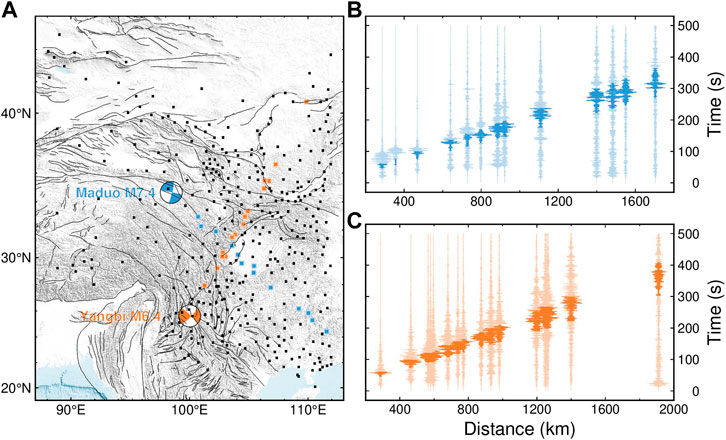
FIGURE 2. Map of the distribution of stations used in this study (A) and illustrations of seismograms (B,C). (A) Stations are represented by filled squares. Locations and focal mechanisms of the 2021 May Yangbi and Maduo earthquakes are indicated by orange and blue beach balls, respectively. Orange and blue squares represent stations selected to show their recordings for the Yangbi and Maduo mainshocks, respectively. (B,C) Waveforms are filtered between 0.5 and 1.0 Hz to improve the Lg demonstrations and are aligned with a reduced velocity of 8.4 km/s. Typical group velocities of the Lg phase, 3.6–3.0 km/s, are highlighted. The Lg-wave group velocity window can be slightly adjusted for each trace to capture the maximum energy arrival.
2.2 Lg-wave preprocessing
The seismic Lg-wave, developed from a reverberated S-wave in the continental crust, is one of the prominent seismic phases in regional seismograms and often used in amplitude analysis (Furumura and Kennett, 1997; Fisk, 2006; Pasyanos et al., 2009). To analyze the arrival times and frequency contents of different regional phases, illustrated in Figure 3A is a regional waveform, and in Figure 3B is the corresponding spectrogram. The spectrogram was obtained using the short-time Fourier transform, where the window was determined to be consistent with the regular Lg-extraction length, according to the velocity window with a length of 0.6 km/s. Due to the changing length of the window, we regularized the spectrogram at 58 frequencies within 0.05–10.0 Hz, and then normalized the spectrogram at each frequency. The first arrival in the spectrogram was Pn at ∼2–5 Hz, followed by Pg over ∼0.3–4 Hz. The Sn was very weak compared with other regional phases. Lg could be recognized as a prominent patch with a longer duration and dominating energy within ∼0.2–2.0 Hz. Based on the spectrogram, the velocity window is 3.6–3.0 km/s. We followed the procedure of Zhao et al. (2010) to process the Lg amplitudes. First, instrument responses were removed, and Lg waveforms were cut using the velocity window of 3.6–3.0 km/s (Figure 3B). The window can be slightly adjusted to capture the maximum Lg energy. The waveforms immediately before the first p arrivals were defined as noise (Figure 3B). Then, the spectra of Lg and corresponding noise were calculated by applying a cosine taper and fast Fourier transformation and were sampled at 58 frequency points between 0.05 and 10.0 Hz to obtain the spectral amplitudes
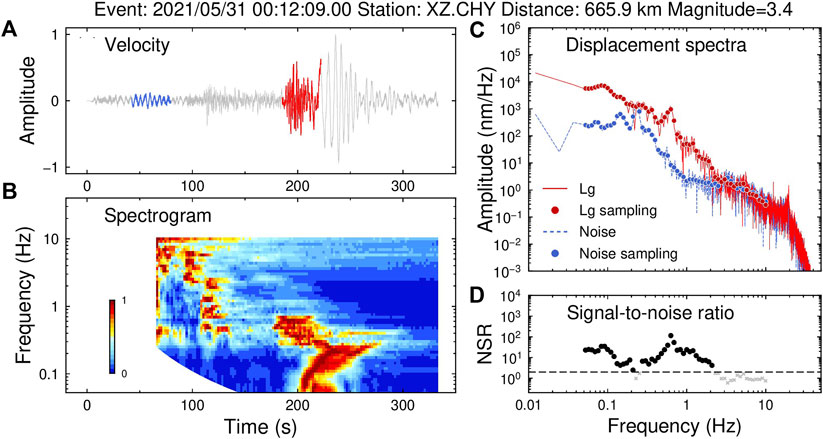
FIGURE 3. (A) Sample seismogram of the Yangbi aftershock recorded at station XZ. CHY. The Lg waveform and pre-event noise are highlighted in red and blue, respectively. (B) Time-frequency spectrogram of the sample seismograms. (C) Spectra of Lg and pre-event noise. (D) Signal-to-noise ratio. The SNR threshold of 2.0 is adopted and illustrated by a dashed line. Data points with SNRs lower than 2.0 are discarded and represented by gray crosses.
2.3 Lg spectra modeling and source spectra retrieval
According to Aki (1967), we modeled the Lg spectral amplitude
where
where the symbol ∫ denotes the integral along the source-station ray path and Q can be obtained from the established high-resolution broadband Lg-wave Q models (Zhao et al., 2013a; Zhao et al., 2013b; He X. et al., 2021). To compute the attenuation term, we mapped the ray path onto the Q model and split it into
where
With known geometrical spreading, attenuation, and site response, we linearized Eq. 1 to relate source perturbations with the residuals between the observed and predicted Lg spectra (Zhao et al. (2010). The least squares QR (LSQR) factorization algorithm (Paige and Saunders, 1982) was used to obtain the source perturbations by minimizing the L2 norm of the residual. The source terms, starting with the unit source function, were iteratively updated until convergence. Based on the attenuation, site response and restored source terms, the synthetic Lg spectral amplitudes fit well to the observations. For example, the mean absolute error between synthetic and observed Lg amplitudes at 1 Hz decreased from 1.78 to 0.81 and the deviation from 1.27 to 0.84 (red and blue histograms in Figure 4). We also tested a constant Q to restore the source terms (yellow and green histograms in Figure 4), and found that Lg spectra can also be fitted to a certain degree, but not as good as that based on both laterally-varying Q model and site response.
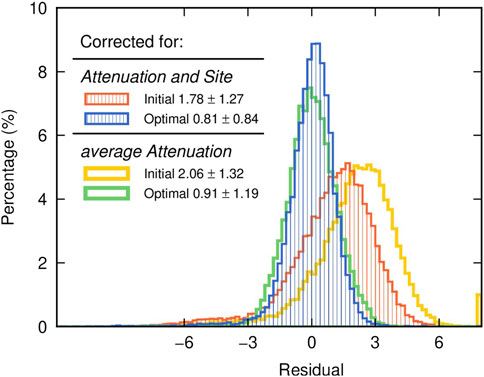
FIGURE 4. Histogram comparing the amplitude residuals. Red and blue histograms represent the distributions of residuals between the observed and predicted Lg spectra before and after inversion based on both attenuation and site corrections. Yellow and green histograms represent the distributions of residuals between the observed and predicted Lg spectra before and after inversion based on constant attenuation. The initial and final rms residual and deviation are labeled for both inversion schemes.
2.4 Source parameter estimation
After retrieving the source spectra
where
The ideal scenario is that the source spectrum has a flat low-frequency asymptote and a high-frequency descending portion, permitting to accurately estimate
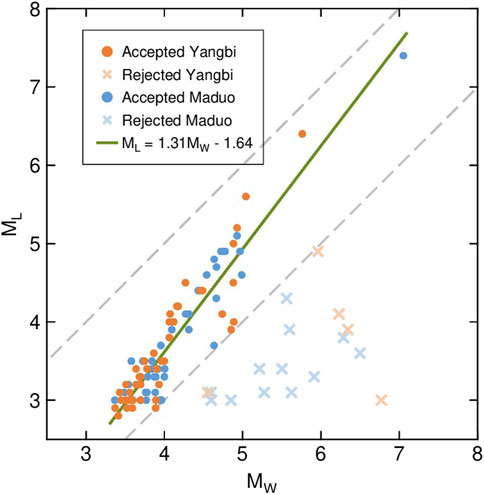
FIGURE 5. Comparison between the retrieved moment magnitude and catalog magnitude. Two gray dashed lines represent
Based on a circular fault model (Eshelby, 1957), the stress drop can be calculated using
where the constant
2.5 Earthquake relocation
To refine the spatial distribution of the stress drop, we relocated the 2021 Yangbi and Maduo earthquake sequences for all earthquakes with local magnitudes greater than 3.0 using the HypoDD program, which allows for simultaneous accurate relocation of clusters of earthquakes based on double-difference travel times (Waldhauser and Ellsworth, 2000). Earthquake relocation and stress drop calculation based on consistent catalog avoid possible errors of assigning the calculated stress drops to incorrect events. We first visually inspected first P-wave arrivals automatically picked by the deep-learning-based PickNet program (Left panels in Figure 6) (Wang et al., 2019). This program can offer better picks at regional distances and was previously trained by the travel-time dataset from earthquakes in the Myanmar region (Wang et al., 2019). Then, we further processed the picked arrival times to calculate the double-difference first-P travel times of earthquake pairs at their common stations and only those pairs observed by more than eight stations were used. For the Yangbi earthquake sequence, a total of 1,493 first arrival P-wave travel times with epicentral distances less than 5° generated 20,124 P-phase pairs. The earthquake pairs had a separation of less than 10 km. For the Maduo earthquake sequence, a total of 2,594 first arrival P-wave travel times at 214 stations were used to generate 3,872 P-phase pairs. When processing the Maduo earthquake sequence, the performance of PickNet significantly reduced the amount of available data, and therefore, we allowed larger observation distances of 10°. Due to its ∼150-km-long aftershock zone, we also allowed a larger spatial separation of 20 km within each earthquake pair so to include as many earthquakes as possible into the relocation clusters. The station distributions have relatively good azimuthal coverage for both earthquake sequences (Supplementary Figure S5). Proper parameters were chosen through several trials to control the initial conditions, clustering of earthquakes and data weighting in the HypoDD program. During relocation, local 1D crustal structures for the source regions of Yangbi and Maduo sequences were extracted from the USTClitho1.0 model (Right panels in Figure 6) (Xin et al., 2018). The relocation results were obtained using the LSQR factorization algorithm (LSQR, Paige and Saunders, 1982) with eight iterations. For convergence purpose, in each iteration, the data outside of 3 times the standard deviation of the RMS residual were treated as outliers and dropped. The iterations updated epicenter locations. Meanwhile, the rms travel time residuals were reduced from 0.49 s to 0.28 s and from 0.67 s to 0.25 s for Yangbi and Maduo sequences, respectively (Supplementary Figure S6). To assess relocation errors, we relocated the events for 100 times, in each time, with only 80% randomly-selected double-different travel times being used. For the Yangbi sequence, the mean errors were 245, 200 and 558 m in the east-west, north-south and vertical directions, respectively (Supplementary Figure S7). For the Maduo sequence, the mean errors were 812, 667 and 1,053 m in the east-west, north-south and vertical directions, respectively (Supplementary Figure S8). The errors were comparable to those of previous studies (Long et al., 2021; Xu et al., 2021; Zhang J. Y. et al., 2022; Zhu et al., 2022). The accuracy and reliability of earthquake relocation could be further improved by incorporating the cross-correlation double-different travel times, which is, however, out of the scope of this study.
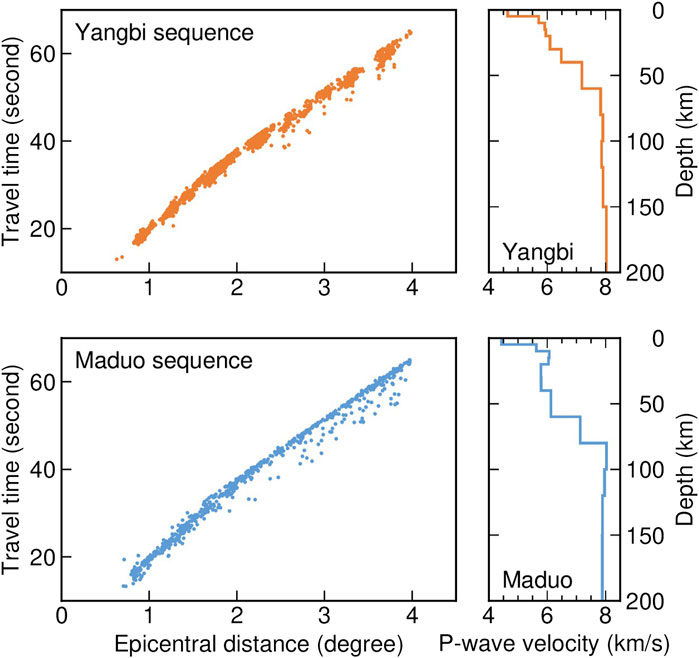
FIGURE 6. Left, travel times picked using the PickNet, and right, the USTClitho1.0 1D velocity models used in relocation calculations. The upper and lower panels are for Yangbi and Maduo sequences, respectively.
3 Results
In this study, we retrieved the source spectra for earthquakes with local magnitudes greater than 3.0 for both the Yangbi and Maduo earthquake sequences and estimated the seismic moment, corner frequency and high-frequency falloff rate for the 81 earthquakes with reliable Lg-wave source spectra (Figure 7; Supplementary Table S1). The obtained seismic moment ranged from
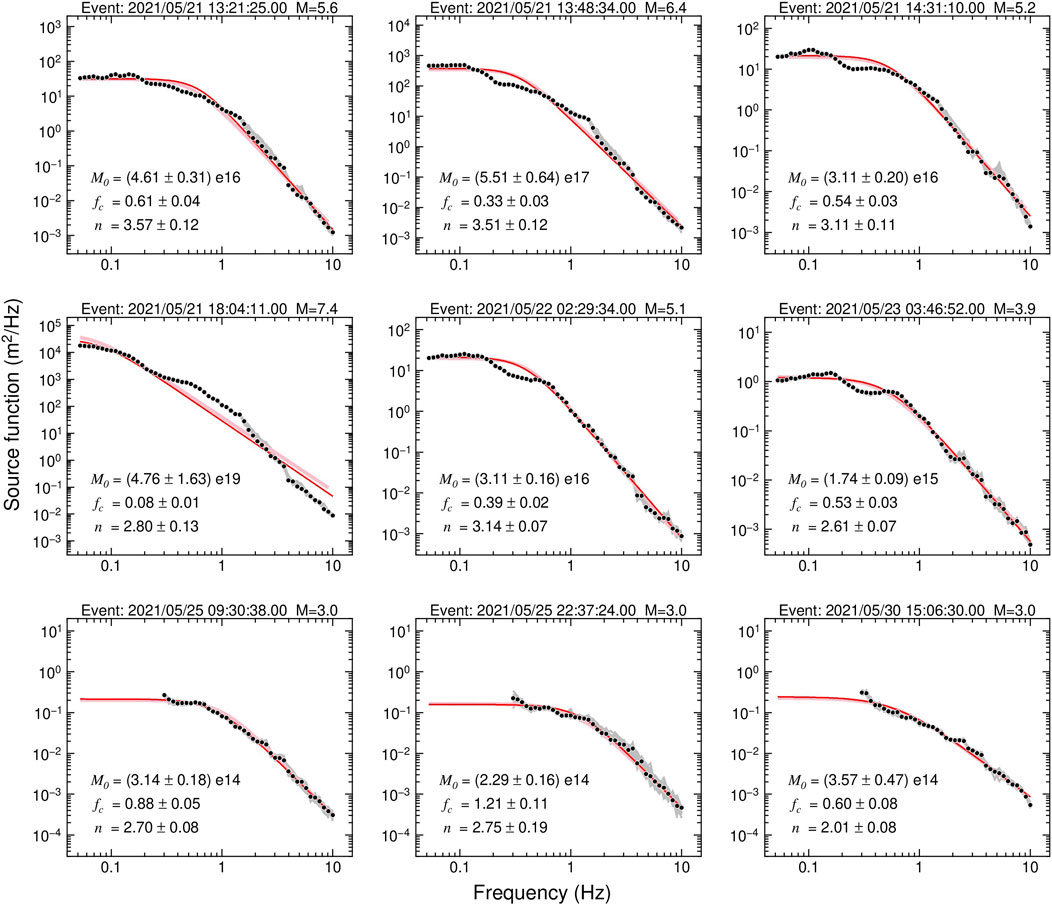
FIGURE 7. Illustrations of retrieved source spectra (black circles) and estimated source models (red lines). For earthquakes with magnitudes less than 3.5, the source models fit only the spectra above 0.3 Hz. Gray and pink lines represent the source spectra obtained using 80% randomly sampled data and corresponding source models, respectively. In each panel, the earthquake information, scalar seismic moment, corner frequency, and high-frequency falloff rate are labeled.
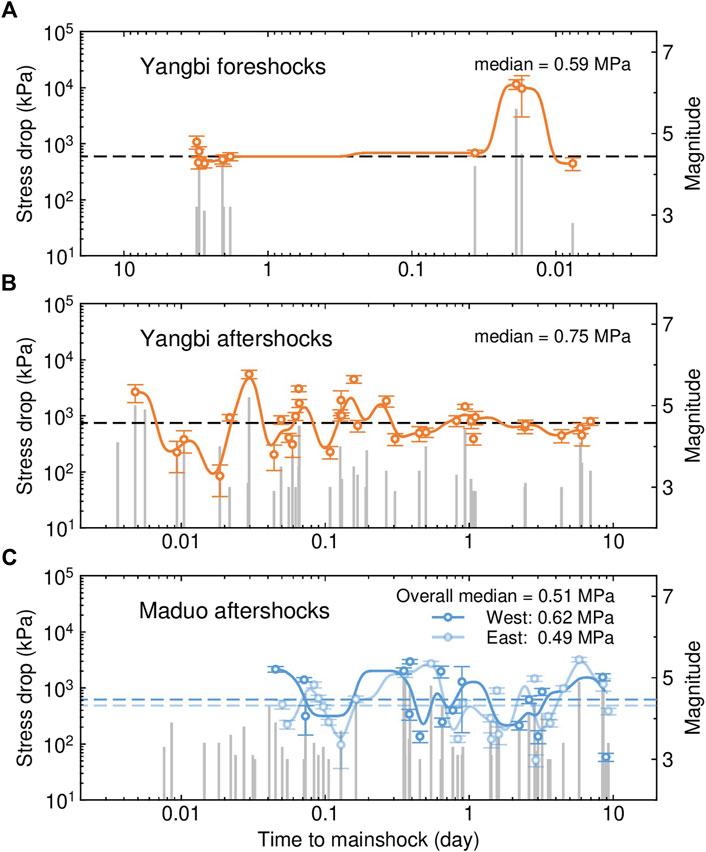
FIGURE 8. Temporal variations in the stress drop for the (A) Yangbi foreshock sequence, (B) Yangbi aftershock sequence and (C) Maduo aftershock sequence. The stress drop estimates are represented by open circles. Solid trendlines are obtained by applying a low-pass Gaussian filter. The seismicity of earthquakes with magnitudes greater than 3.0 is shown by vertical gray lines, with their heights corresponding to magnitudes. Error bars indicate the standard deviations of stress drops measurements, with their stress drop values indicated by dashed lines. Aftershocks in Maduo sequence are grouped according to their locations east (light blue) or west (blue) to the mainshock.
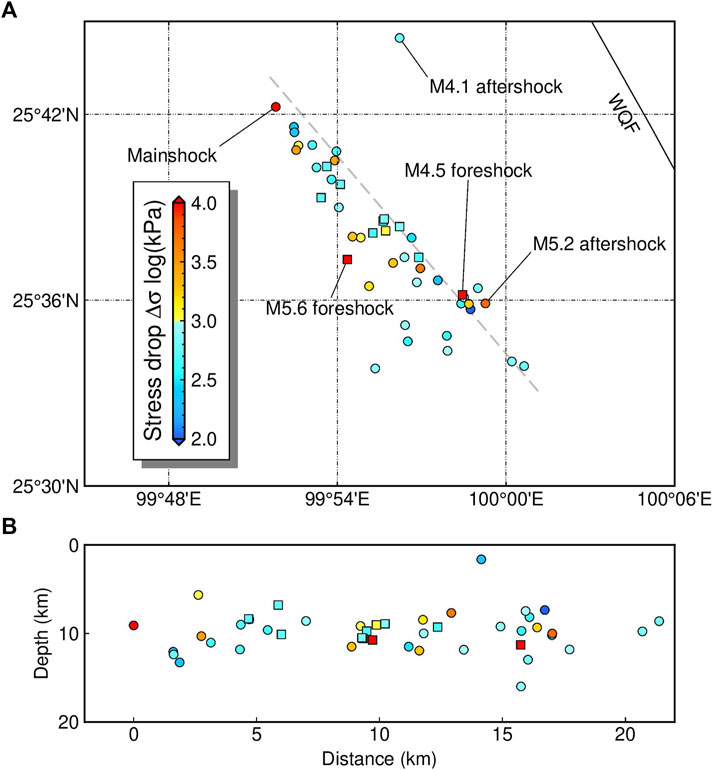
FIGURE 9. (A) Map view and (B) depth cross-section of stress drops for the 21 May 2021 Yangbi earthquake sequence. The filled symbols illustrate the relocated sources, with their stress drops coded by colors. The squares represent the foreshocks, and the circles represent the mainshock and aftershocks. The Weixi–Qiaohou fault (WQF) is represented by a black lines. The mainshock is located at distance=0 in the depth cross-section. Gray dashed line shows the location of the cross-section.
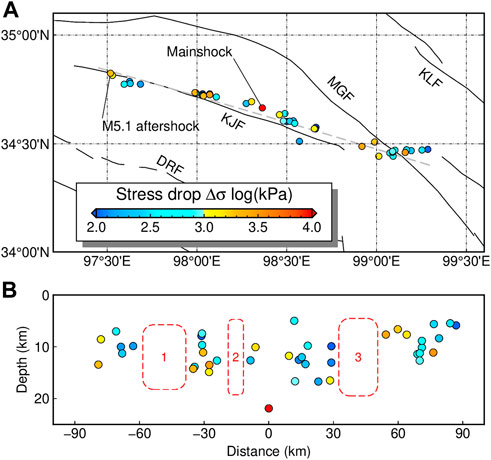
FIGURE 10. (A) Map view and (B) depth cross-section of the stress drops for the 21 May 2021 Maduo earthquake sequence. The filled circles illustrate the relocated epicenters, with their stress drops coded by colors. The active faults are indicated by black lines, with their names labeled in abbreviations: DRF, Dari fault; KJF, Kunlunshankou–Jiangcuo fault; MGF, Maduo–Gande fault; and KLF, Eastern Kunlun fault. The mainshock is located at distance=0 in the depth cross-section. Gray dashed line shows the location of the cross-section. Three aftershock gaps are marked in the depth profile with red dashed rectangles.
3.1 Stress drops for the Yangbi and Maduo earthquake sequences
The stress drop of the Yangbi mainshock is 22.59 ± 4.85 MPa. For the foreshocks, the stress drops range from 0.44 to 11.56 MPa, with a median value of 0.59 MPa, and for aftershocks ranged from 0.08 to 5.55 MPa, with a median value of 0.75 MPa (Figures 8A,B). The foreshocks emerged on 18 May, with their stress drops exhibiting a general decrease from the initial value, until foreshocks became active again on 19 May. After that, a gradual increase in stress drop was visible, followed by two earthquakes, including the largest Ms 5.6 one, characterized by a significantly higher stress drops of ∼10 MPa occurring ∼25–27 min before the mainshock. In the aftershock sequence, the stress drops were relatively fluctuated and decreased gradually along with the decrease of seismicity. The minimum stress drop appeared ∼26 min after the mainshock, indicating of a great amount of stress was released by the mainshock. The stress drop was again increased along with several strong aftershocks, including the largest Ms 5.2 aftershock occurring ∼43 min after the mainshock, with the highest stress drop among all aftershocks. After strong fluctuation lasting for approximately 1 day, the stress drop values remained around the median value, which could indicate the stress adjustment following the mainshock.
For the Maduo earthquake sequence, the stress drop of the mainshock is 28.31 ± 3.92 MPa, and the stress drops of aftershocks range from 0.05 to 3.21 MPa, with a median value of 0.51 MPa (Figure 8C). The values of the stress drop for the Maduo aftershock sequence are generally lower than those for the Yangbi sequence in terms of their maximum, minimum and median values, suggesting a possibly lower stress level on the Maduo seismogenic fault after the mainshock. The Maduo aftershock sequence is characterized by more scattered stress drop values undulated for ∼9 days after the mainshock. For example, several large aftershocks occurred ∼8 h and ∼8 days after the mainshock, with their stress drops greater than 1.5 MPa. Compared with the Yangbi sequence, the prolonged undulation in the stress drop and late occurrence of the minimum value nearly 3 days after the mainshock probably indicate a relatively long stress repartition process, which could be related to the longer seismogenic fault involved in the Maduo sequence.
3.2 Relocations of the Yangbi and Maduo earthquake sequences with stress drop estimated
Based on the first P arrivals picked by the PickNet program, we used the double-difference earthquake relocation program HypoDD to refine the locations of the calculated stress drop. The results were generally consistent to previous studies (e.g., Long et al., 2021; Xu et al., 2021; Zhang et al., 2021; Zhang J. Y. et al., 2022). For the May 2021 Yangbi earthquake sequence, we relocated 51 epicenters (Figure 9; Supplementary Table S1). The Yangbi earthquake sequence was generally distributed along a northwest‒southeast trend and extended for approximately 21 km. Although roughly parallel to regional tectonics, e.g., the northwest‒southeast-trending Red River fault and Jinshajiang fault, the distribution of the Yangbi earthquake sequence appeared not directly linked to any known faults, including the Weishan–Qiaohou fault ∼10 km to the northeast. The foreshock activities migrated back and forth within the epicentral area, including the largest M5.6 foreshock near the center and the M4.5 foreshock near the southeastern end occurring ∼2 min later. The Yangbi mainshock was located at
By relocation, we obtained the fine distribution of the stress drop. The highest stress drop in the foreshock sequence was observed for a M5.6 event located near the center of the foreshock zone, where foreshock activities had been initiated since 18 May. Another significantly high stress drop was linked to the M4.5 foreshock, occurred at the southeast end of the foreshock area. The mainshock and the largest aftershock were located at the northwestern and southeastern ends of the epicentral zone, respectively, both with notably high stress drops.
We relocated 54 earthquakes in the Maduo sequence (Figure 10; Supplementary Table S1). The results demonstrate that the mainshock was located at
4 Discussion
4.1 Earthquake stress drop and stress distributions on faults
The earthquake stress drop can be related to the localized stress variability on a seismogenic fault. Larger stress drop variations could result from fault plane heterogeneities (Kirkpatrick et al., 2020), e.g., a rougher fault plane may cause higher stress drops due to its additional resistance to slip (Fang and Dunham, 2013). Allmann and Shearer (2009) observed higher overall stress drops for strike-slip earthquakes at a global scale, which is consistent with previous findings of increased apparent stress for strike-slip events. However, at local scales, the dependence on the focal mechanism is less significant, and stress drops appear more dominated by the local tectonics (Shearer et al., 2006; Goebel et al., 2015; Boyd et al., 2017). Therefore, investigating stress drops in the Yangbi and Maduo earthquake sequences may reveal stress variations in the related seismogenic zones.
In the Yangbi sequence, the stress drops of foreshocks may suggest the accumulation of stress and hint the stress variation that led to the nucleation of the mainshock. The pre-slip mechanism is one of the popular explanations for how an earthquake initiates, in which concentrated and repeated seismicity is expected (Zhu et al., 2022). However, the relocated foreshock sequence revealed a back-and-forth migration pattern. In addition, high-stress-drop foreshocks, including the first and the largest ones, have their stress drops significantly higher than the median value of the entire sequence, implying the potential to trigger earthquake. By modeling the cumulative static stress change from large foreshocks, Zhu et al. (2022) found that the local shear stress at the Yangbi mainshock epicenter was increased by major foreshocks. Therefore, our results of foreshock relocation and stress drops were consistent with the cascade triggering process during the nucleation of the Yangbi mainshock (Long et al., 2021; Zhang et al., 2021; Zhu et al., 2022). For the aftershock sequence, fluctuations of stress drops including many significantly high and low stress drop events may be related to the stress adjustment and continually release of the local stress field disturbed by the mainshock. Similar stress development pattern were also suggested by the observed b-values, which demonstrated long-term low values before 20 May 2021, showed abrupt reductions before the Ms 5.6 foreshock and the Ms 6.4 mainshock, then demonstrated large fluctuations around their mean value after the mainshock (Duan et al., 2021; Jiang et al., 2021). The b-value measures the distribution of earthquakes with different sizes in the recurrence relation of Gutenberg and Richter (1941) and is found to be reversely related to the differential stress within the crust (Schorlemmer et al., 2005). A low b-value and high stress were also observed preceding the M6.4 and M7.1 Ridgecrest, California earthquakes in 2019 (Nanjo, 2020).
In the Maduo sequence, the aftershocks were distributed on both the northwest and southeast sides of the mainshock along the Kunlunshankou–Jiangcuo fault. For aftershocks to the east and west of the mainshock, our results showed their median stress drops were 0.49 MPa and 0.62 MPa, respectively. The difference probably suggested differentiated rupture processes between the east- and west-sections. Previous studies have suggested that the eastward rupture of the Maduo mainshock propagated at a speed exceeding 3.5 km/s S-wave velocity, i.e., supershear rupture (Zhang X. et al., 2022; Li et al., 2022; Lyu et al., 2022; Yue et al., 2022). The back-projection imaging technique is commonly used to obtain large earthquake rupture kinematics. With this method, the Maduo mainshock was found ruptured toward the east and west, with velocities of 3–5 km/s and 2–3 km/s, respectively (Zhang X. et al., 2022; Li et al., 2022; Yue et al., 2022). Zhang X. et al. (2022) further confirmed the eastward supershear rupture by recognizing far-field Love Mach waves. Joint analysis using Global Positioning System, Interferometric Synthetic Aperture Radar, and teleseismic data determined the westward and eastward rupture velocities to be 2.0 and 4.6 km/s, respectively (Yue et al., 2022). Near-field Global Navigation Satellite Systems recordings demonstrated significant sensitivity to determine rupture velocities and confirmed sub- and supershear ruptures on the west and east sections of the mainshock fracture, respectively (Lyu et al., 2022). We suggest that the lower aftershock stress drops on the east section can be related to the larger stress release due to the supershear rupture. Yue et al. (2022) pointed out that the coseismic slip east of the mainshock was concentrated in seismogenic layers, in which rate-weakening friction law might support instability failure to facilitate the supershear rupture. Since a large amount of energy was consumed to feed the supershear rupture, the remaining stress was low, resulting in low stress drops for the aftershocks to the east of the mainshock. The relatively high aftershock stress drops observed on the west section of the mainshock fracture suggest there were more strain stored within this part of the crust. This energy can be further released by later aftershocks or interseismic creeping.
4.2 Earthquake stress drop and fault complexity
In this study, stress drops from the relocated earthquake sequences demonstrated that high stress drops were often related to fault junctions or earthquake gaps, suggesting stress concentrations at these locations.
The relocated sources of the Yangbi sequence suggested a complicated fault system with a northwest‒southeast-trending major fault, which may split into multiple branches in the southeast section. This is consistent with previous earthquake relocations; however, a detailed fault structure can be suggested by relocation for a larger number of small earthquakes. Long et al. (2021) relocated more than 1,000 Yangbi events with local magnitudes greater than 1.0 based on the seismic phase bulletin, suggesting a northwest‒southeast-trending primary fault, with northeast‒southwest-trending conjugate faults in its northwestern segment, and multiple secondary faults along the primary fault and gradual turning toward the south in the southeast. The multiscale en echelon structures were further revealed by high-resolution catalogs built using a deep-learning phase picker (Su et al., 2021; Liu et al., 2022). Combining the fault structures with our relocation results, high-stress-drop events in the Yangbi sequence were generally related to fault junctions and tips. For example, the M4.5 and M5.6 foreshocks with significantly high stress drops were located around the middle of the epicentral zone, where the south-trending en echelon faults intersect with the primary fault; several aftershocks with high stress drops could be found near fault junctions and tips, including the M5.2 and M4.1 aftershocks. Simulations suggested significantly increased stress localized at the junctions of branching faults (e.g., Ando et al., 2018). Therefore, the high stress drops in the Yangbi sequence may result from the stress concentrations near the fault junctions and tips and may in turn indicate the precise locations of sophisticated fault branches.
In the Maduo sequence, the stress drops demonstrated a more fluctuating pattern than in the Yangbi sequence. The prolonged stress drop variations could be related to the fault properties. The cross-section view reveals that the clusters of earthquakes with significantly high-stress-drop values were generally associated with the earthquake gaps along the fault. These gaps should be robust features despite a magnitude threshold 3.0 was used for earthquake relocation in this study. In previous studies that relocated more than 1,300 earthquakes with magnitudes greater than 0, reduced seismicity was still pronounced at these locations, and in particular, few aftershocks occurred ∼50 km northwest and ∼30 km southeast of the mainshock (Wang W. L. et al., 2021; Xu et al., 2021) (corresponding to the gaps 1 and 3 in Figure 10B). The correspondence between high stress drops and aftershock gaps probably indicated redistributed stress following the mainshock. Geodetic observations revealed coseismic slip on the seismogenic fault following the mainshock. They varied significantly along the fault strike and concentrated at several localized segments with maximum slips of ∼3–4 m (He K. et al., 2021). These high-slip patches may represent the asperities where stresses were released by significant rupture during the mainshock, resulting in localized reduced or lack of aftershock activities. Since the asperities are generally related to variations in strength or friction properties due to the changes of fault geometry, and result in stress concentration (Mildon et al., 2019), we propose that the stress remaining on the fault was redistributed and concentrated near the edges of fault asperities, thus leading to the occurrence of larger aftershocks with high stress drops. A similar complementary correspondence between the stress drop and mainshock slip was also suggested for the 1992 Landers earthquake in southern California (Shearer et al., 2006).
4.3 Implications for the eastward expansion of the Tibetan plateau
The stress drops of the Yangbi, Yunnan and Maduo, Qinghai earthquake sequences in May 2021 demonstrated different temporal and spatial patterns, which reflected varying localized crustal stress variability and deformations across the eastern Tibetan Plateau. A deformation field recently constructed from GPS data revealed predominantly continuous strains inside the eastern Tibetan Plateau, with significant shear associated with large strike-slip faults to accommodate the eastward extrusion of geological blocks (Wang and Shen, 2020). On the southern flank of the extrusion, the Chuandian block represents the majority of the escaping crustal material from the interior plateau. Wang and Shen (2020) found that the translation of the Chuandian block was accompanied by notable clockwise rotation at a rate of ∼2.9°/Myr around the Eastern Himalayan syntax and widespread dilatation at 10–20 nanostrain/yr. The dilatation should be responsible for the normal component obtained in the focal mechanism solutions of the Yangbi earthquake sequence. The complicated combination of southeastward translation, clockwise rotation and interior deformations requires a large number of active faults to accommodate, possibly resulting in the multiscale en echelon faults and conjugate faults that inherited motions of the associated large strike-slip faults. Therefore, these small faults could also generate large earthquakes, including the 2021 Yangbi Ms 6.4 earthquake, with the repartitioned stress concentration subject to the geometric complexity of the fault systems, for example, the fault junctions and tips, giving rise to several high stress drops in the Yangbi earthquake sequence. The local stress field inverted from focal mechanisms suggested a change in the orientation of the horizontal maximum principal stress from near north–south to nearly east‒west in the southernmost epicentral zone, coincident with the regional stress and possibly reflecting the tectonic rotation of the Chuandian block (Wang Y. et al., 2021).
In contrast, the focal mechanism of the Maduo earthquake sequence demonstrated a consistent northwest‒southeast orientation of maximum principal stress, corresponding to the movement of the Bayan Har block (Xu et al., 2021). The Bayan Har block is bounded in the north by the Kunlun fault, with significant left-lateral strike-slip, to accommodate the northeastward expansion of the eastern Tibetan Plateau. The slip rate on the Kunlun fault shows a west–east decrease from ∼12.5 mm/yr to less than 3 mm/yr, which was suggested to be decomposed to slips on several secondary faults subparallel to and south of the Kunlun fault (Kirby et al., 2007), including the Kunlunshankou–Jiangcuo fault, which was the seismogenic fault of the 2021 Maduo earthquake sequence. The slip around the middle segment of the Kunlun fault, which is faster than that near the northern segment of the Red River fault, is more likely to result in a concentration of shear strain (Zheng et al., 2017; Wang and Shen, 2020). Localized variations in crustal strength could occur due to shear heating and increased crustal temperature (Leloup et al., 1999; Bao et al., 2012). As a consequence, large earthquakes would rupture the high-strength asperities, and the perturbed stresses were likely to be repartitioned around the asperities and lead to larger variability in the stress drops of aftershocks. Therefore, the stress drops of the Yangbi and Maduo earthquake sequences were controlled by the eastward expansion of the Tibetan Plateau, and the differences in their patterns showed varying impacts on the seismogenic environment.
Conclusion
In this study, the temporal and spatial variations in stress drop were investigated for Yangbi and Maduo earthquake sequences in May 2021, including all foreshocks, mainshocks and aftershocks with magnitudes greater than 3.0. The results reveal that the stress drop for Yangbi mainshock was relatively low than Maduo mainshock. Comparing with the Yangbi sequence, the Maduo sequence was characterized by stress drops of relatively low median value and rather scattered values for individual events. For stress drops in both sequences, no apparent depth dependency was found. The temporal-spatial pattern in stress drop for Yangbi sequence can be related to geometric complexity of the fault systems, which were resulted from the tectonic movement of the Chuandian block incorporating translation, rotation, and interior deformation. The Bayan Har block is regarded as another component in the eastward expansion of the Tibetan Plateau. Fast slip and high shear strain rate around its northern boundary may cause localized variations in fault strength, which controls the temporal-spatial pattern in the stress drop of Maduo sequence.
Data availability statement
Publicly available datasets were analyzed in this study. This data can be found here: https://data.earthquake.cn/yhsj/info/2016/5596.html.
Author contributions
XH: Conceptualization, formal analysis, writing—original draft, writing—review and editing, funding acquisition. L-FZ: Conceptualization, methodology, formal analysis, writing—review and editing, funding acquisition. LZ: Formal analysis. X-BX: Writing—review and editing. Z-XY: Funding acquisition, supervision.
Funding
This research was supported by the National Natural Science Foundation of China (U2139206, 42104055, 41974054, and 41974061) and the Special Fund of China Seismic Experimental Site (2019CSES0103).
Acknowledgments
The waveforms used in this study were collected from the National Earthquake Data Center (NEDC) at https://data.earthquake.cn/yhsj/info/2016/5596.html (in Chinese, last accessed August 2022) and the Incorporated Research Institutions for Seismology Data Management Center (IRIS-DMC) at https://ds.iris.edu/wilber3/find_event (last accessed August 2022). Researchers can register for an account to apply for the NEDC data. Some figures were generated using Generic Mapping Tools (GMT; https://www.generic-mapping-tools.org/).
Conflict of interest
The authors declare that the research was conducted in the absence of any commercial or financial relationships that could be construed as a potential conflict of interest.
Publisher’s note
All claims expressed in this article are solely those of the authors and do not necessarily represent those of their affiliated organizations, or those of the publisher, the editors and the reviewers. Any product that may be evaluated in this article, or claim that may be made by its manufacturer, is not guaranteed or endorsed by the publisher.
Supplementary material
The Supplementary Material for this article can be found online at: https://www.frontiersin.org/articles/10.3389/feart.2023.1081605/full#supplementary-material
References
Abercrombie, R. E. (1995). Earthquake source scaling relationships from −1 to 5MLusing seismograms recorded at 2.5-km depth. J. Geophys Res. 100 (B12), 24015–24036. doi:10.1029/95JB02397
Abercrombie, R. E. (2014). Stress drops of repeating earthquakes on the san andreas fault at parkfield. Geophys Res. Lett. 41, 8784–8791. doi:10.1002/2014GL062079
Aki, K. (1967). Scaling law of seismic spectrum. J. Geophys Res. 72 (4), 1217–1231. doi:10.1029/JZ072i004p01217
Allmann, B. P., and Shearer, P. M. (2009). Global variations of stress drop for moderate to large earthquakes. J. Geophys Res. 114 (B1). doi:10.1029/2008jb005821
Allmann, B. P., and Shearer, P. M. (2007). Spatial and temporal stress drop variations in small earthquakes near Parkfield, California. J. Geophys Res. 112 (B4). doi:10.1029/2006JB004395
Bao, X. Y., Sandvol, E., Chen, Y. S. J., Ni, J., Hearn, T., and Shen, Y. (2012). Azimuthal anisotropy of Lg attenuation in eastern Tibetan Plateau. J. Geophys Res. 117 (B10). doi:10.1029/2012jb009255
Bethmann, F., Deichmann, N., and Mai, P. M. (2011). Scaling relations of local magnitude versus moment magnitude for sequences of similar earthquakes in Switzerland. Bull. Seismol. Soc. Am. 101 (2), 515–534. doi:10.1785/0120100179
Blisniuk, P. M., Hacker, B. R., Glodny, J., Ratschbacher, L., Bi, S. W., Wu, Z. H., et al. (2001). Normal faulting in central Tibet since at least 13.5 Myr ago. Nature 412 (6847), 628–632. doi:10.1038/35088045
Boatwright, J. (1980). A spectral theory for circular seismic sources; simple estimates of source dimension, dynamic stress drop, and radiated seismic energy. Bull. Seismol. Soc. Am. 70 (1), 1.
Boyd, O. S., McNamara, D. E., Hartzell, S., and Choy, G. (2017). Influence of lithostatic stress on earthquake stress drops in North America. Bull. Seismol. Soc. Am. 107 (2), 856–868. doi:10.1785/0120160219
Brune, J. N. (1970). Tectonic stress and the spectra of seismic shear waves from earthquakes. J. Geophys Res. 75 (26), 4997–5009. doi:10.1029/JB075i026p04997
Duan, M., Zhao, C., Zhou, L., Zhao, C., and Zuo, K. (2021). Seismogenic structure of the 21 May 2021 M(s)6. 4 Yunnan Yangbi earthquake sequence. Chin. J. Geophys (in Chin. 64 (9), 3101–3115. doi:10.6038/cjg2021P0423
Efron, B. (1983). Estimating the error rate of a prediction rule: Improvement on cross-validation. J. Am. Stat. Assoc. 78 (382), 316–331. doi:10.1080/01621459.1983.10477973
Eshelby, J. D. (1957). The determination of the elastic field of an ellipsoidal inclusion, and related problems. Proc. R. Soc. Lon Ser-A 241 (1226), 376–396. doi:10.1098/rspa.1957.0133
Fang, Z., and Dunham, E. M. (2013). Additional shear resistance from fault roughness and stress levels on geometrically complex faults. J. Geophys Res. 118, 3642–3654. doi:10.1002/jgrb.50262
Fisk, M. D. (2006). Source spectral modeling of regional P/S discriminants at nuclear test sites in China and the former Soviet Union. Bull. Seismol. Soc. Am. 96 (6), 2348–2367. doi:10.1785/0120060023
Furumura, T., and Kennett, B. L. N. (1997). On the nature of regional seismic phases-II. On the influence of structural barriers. Geophys J. Int. 129 (2), 221–234. doi:10.1111/j.1365-246X.1997.tb01577.x
Goebel, T. H. W., Hauksson, E., Shearer, P. M., and Ampuero, J. P. (2015). Stress-drop heterogeneity within tectonically complex regions: A case study of san gorgonio pass, southern California. Geophys J. Int. 202 (1), 514–528. doi:10.1093/gji/ggv160
Goertz-Allmann, B. P., Edwards, B., Bethmann, F., Deichmann, N., Clinton, J., Fäh, D., et al. (2011). A new empirical magnitude scaling relation for Switzerland. Bull. Seismol. Soc. Am. 101 (6), 3088–3095. doi:10.1785/0120100291
Gutenberg, B., and Richter, C. F. (1941). Seismicity of the Earth seismicity of the Earth. Geol. Soc. Am. 34
He, K., Wen, Y., Xu, C., and Zhao, Y. (2021a). fault geometry and slip distribution of the 2021 Mw 7.4 Maduo, China, earthquake inferred from InSAR measurements and relocated aftershocks. Seismol. Res. Lett. 93, 8–20. doi:10.1785/0220210204
He, X., Zhao, L.-F., Xie, X.-B., Shen, L., Wang, W.-M., and Yao, Z.-X. (2020). Stress drop assessment of the August 8, 2017, Jiuzhaigou earthquake sequence and its tectonic implications. Earthq. Sci. 33 (4), 161–176. doi:10.29382/eqs-2020-0161-01
He, X., Zhao, L.-F., Xie, X.-B., Tian, X., and Yao, Z.-X. (2021b). Weak crust in southeast Tibetan Plateau revealed by Lg-wave attenuation tomography: Implications for crustal material escape. J. Geophys Res. 126, e2020JB020748. doi:10.1029/2020JB020748
Holt, W. E., Ni, J. F., Wallace, T. C., and Haines, A. J. (1991). The active tectonics of the eastern Himalayan syntaxis and surrounding regions. J. Geophys Res. 96 (B9), 14595–14632. doi:10.1029/91JB01021
Jiang, C., Jiang, C. S., Yin, F. L., Zhang, Y. B., Bi, J. M., Long, F., et al. (2021). A new method for calculating b-value of time sequence based on data-driven (TbDD): A case study of the 2021 Yangbi M(s)6. 4 earthquake sequence in yunnan. Chin. J. Geophys (in Chin. 64 (9), 3116–3124. doi:10.6038/cjg2021P0385
Kirby, E., Harkins, N., Wang, E., Shi, X., Fan, C., and Burbank, D. (2007). Slip rate gradients along the eastern Kunlun fault. Tectonics 26. No.2). doi:10.1029/2006tc002033
Kirkpatrick, J. D., Edwards, J. H., Verdecchia, A., Kluesner, J. W., Harrington, R. M., and Silver, E. A. (2020). Subduction megathrust heterogeneity characterized from 3D seismic data. Nat. Geosci. 13 (5), 369–374. doi:10.1038/s41561-020-0562-9
Kirkpatrick, S., Gelatt, C. D., and Vecchi, M. P. (1983). Optimization by simulated annealing. Science 220 (4598), 671–680. doi:10.1126/science.220.4598.671
Leloup, P. H., Ricard, Y., Battaglia, J., and Lacassin, R. (1999). Shear heating in continental strike-slip shear zones: Model and field examples. Geophys J. Int., 136(1), 19–40. doi:10.1046/j.1365-246X.1999.00683.x
Li, Q., Wan, Y., Li, C., Tang, H., Tan, K., and Wang, D. (2022). Source process featuring asymmetric rupture velocities of the 2021 Mw 7.4 Maduo, China, earthquake from teleseismic and geodetic data. Seismol. Res. Lett. 93 (3), 1429–1439. doi:10.1785/0220210300
Liu, M., Li, H., Li, L., Zhang, M., and Wang, W. (2022). Multistage nucleation of the 2021 Yangbi MS 6.4 earthquake, Yunnan, China and its foreshocks. J. Geophys Res. 127 (5), e2022JB024091. doi:10.1029/2022JB024091
Long, F., Qi, Y., Yi, G., Wu, W., Wang, G., Zhao, X., et al. (2021). Relocation of the MS6.4 Yangbi earthquake sequence on May 21,2021 in Yunnan Province and its seismogenic structure analysis. Chin. J. Geophys. 64 (8), 2631–2646.
Lyu, M., Chen, K., Xue, C., Zang, N., Zhang, W., and Wei, G. (2022). Overall subshear but locally supershear rupture of the 2021 Mw 7.4 Maduo earthquake from high-rate GNSS waveforms and three-dimensional InSAR deformation. Tectonophysics 839, 229542. doi:10.1016/j.tecto.2022.229542
Madariaga, R. (1976). Dynamics of an expanding circular fault. Bull. Seismol. Soc. Am. 66 (3), 639–666. doi:10.1785/bssa0660030639
Mildon, Z. K., Roberts, G. P., Walker, J. P. F., and Toda, S. (2019). Coulomb pre-stress and fault bends are ignored yet vital factors for earthquake triggering and hazard. Nat. Commun. 10, 2744. doi:10.1038/s41467-019-10520-6
Molnar, P., and Lyoncaen, H. (1989). Fault plane solutions of earthquakes and active tectonics of the Tibetan Plateau and its margins. Geophys J. Int. 99 (1), 123–154. doi:10.1111/j.1365-246X.1989.tb02020.x
Nanjo, K. Z. (2020). Were changes in stress state responsible for the 2019 Ridgecrest, California, earthquakes? Nat. Commun. 11 (1), 3082. doi:10.1038/s41467-020-16867-5
Oth, A., Bindi, D., Parolai, S., and Di Giacomo, D. (2011). Spectral analysis of K-NET and KiK-net data in Japan, Part II: On attenuation characteristics, source spectra, and site response of borehole and surface stations. Bull. Seismol. Soc. Am. 101, 667–687. doi:10.1785/0120100135
Paige, C. C., and Saunders, M. A. (1982). Lsqr: An algorithm for sparse linear equations and sparse least squares. ACM Trans. Math. Softw. 8 (1), 43–71. doi:10.1145/355984.355989
Pasyanos, M. E., Matzel, E. M., Walter, W. R., and Rodgers, A. J. (2009). Broad-band Lg attenuation modelling in the Middle East. Geophys J. Int. 177 (3), 1166–1176. doi:10.1111/j.1365-246X.2009.04128.x
Sato, T., and Hirasawa, T. (1973). Body wave spectra from propagating shear cracks. J. Phys. Earth 21 (4), 415–431. doi:10.4294/jpe1952.21.415
Schorlemmer, D., Wiemer, S., and Wyss, M. (2005). Variations in earthquake-size distribution across different stress regimes. Nature 437 (7058), 539–542. doi:10.1038/nature04094
Shearer, P. M., Prieto, G. A., and Hauksson, E. (2006). Comprehensive analysis of earthquake source spectra in southern California. J. Geophys Res. 111 (B6). doi:10.1029/2005jb003979
Street, R. L., Herrmann, R. B., and Nuttli, O. W. (1975). Spectral characteristics of the Lg wave generated by central United States earthquakes. Geophys J. Int. 41 (1), 51–63. doi:10.1111/j.1365-246X.1975.tb05484.x
Su, J. B., Liu, M., Zhang, Y. P., Wang, W. T., Li, H. Y., Yang, J., et al. (2021). High resolution earthquake catalog building for the 21 May 2021 Yangbi, Yunnan, M-S 6. 4 earthquake sequence using deep-learning phase picker. Chin. J. Geophys (in Chin. 64 (8), 2647–2656. doi:10.6038/cjg2021O0530
Sun, J., Yue, H., Shen, Z.-K., Fang, L., Zhan, Y., and Sun, X. (2018). The 2017 jiuzhaigou earthquake: A complicated event occurred in a young fault system. Geophys Res. Lett. 45, 2230–2240. doi:10.1002/2017gl076421
Trugman, D. T. (2020). Stress drop and source scaling of the 2019 Ridgecrest, California, earthquake sequence. Bull. Seismol. Soc. Am. 110 (4), 1859–1871. doi:10.1785/0120200009
Waldhauser, F., and Ellsworth, W. L. (2000). A double-difference earthquake location algorithm: Method and application to the northern Hayward fault, California. Bull. Seismol. Soc. Am., 90(6), 1353–1368. doi:10.1785/0120000006
Wang, J., Xiao, Z., Liu, C., Zhao, D., and Yao, Z. (2019). Deep learning for picking seismic arrival times. J. Geophys Res. 124 (7), 6612–6624. doi:10.1029/2019JB017536
Wang, M., and Shen, Z.-K. (2020). Present-day crustal deformation of continental China derived from GPS and its tectonic implications. J. Geophys Res. 125 (2), e2019JB018774. doi:10.1029/2019JB018774
Wang, W. L., Fang, L. H., Wu, J. P., Tu, H. W., Chen, L. Y., Lai, G. J., et al. (2021a). Aftershock sequence relocation of the 2021 M(S)7.4 Maduo earthquake, Qinghai, China. Sci. China-Earth Sci. 64 (8), 1371–1380. doi:10.1007/s11430-021-9803-3
Wang, Y., Hu, S., He, X., Guo, K., Xie, M., Deng, S., et al. (2021b). Relocation and focal mechanism solutions of the 21 May 2021 MS6.4 Yunnan Yangbi earthquake sequence. Chin. J. Geophys. Chin. 64 (12), 4501–4525. doi:10.6038/cjg2021P0401
Wang, Z., Su, J., Liu, C., and Cai, X. (2015). New insights into the generation of the 2013 lushan earthquake (Ms7.0), China. J. Geophys Res. 120 (5), 3507–3526. doi:10.1002/2014jb011692
Weng, H., and Yang, H. (2018). Constraining frictional properties on fault by dynamic rupture simulations and near-field observations. J. Geophys Res. 123 (8), 6658–6670. doi:10.1029/2017JB015414
Xin, H., Zhang, H., Kang, M., He, R., Gao, L., and Gao, J. (2018). High-resolution lithospheric velocity structure of continental China by double-difference seismic travel-time tomography. Seismol. Res. Lett. 90 (1), 229–241. doi:10.1785/0220180209
Xu, Z., Liang, S., Zhang, G., Liang, J., Zou, L., Li, X., et al. (2021). Analysis of seismogenic structure of Madoi, Qinghai M(s)7. 4 earthquake on May 22, 2021. Chin. J. Geophys (in Chin. 64 (8), 2657–2670. doi:10.6038/cjg2021P0390
Yamada, T., Okubo, P. G., and Wolfe, C. J. (2010). Kiholo Bay, Hawai'i, earthquake sequence of 2006: Relationship of the main shock slip with locations and source parameters of aftershocks. J. Geophys Res. 115, B08304. doi:10.1029/2009jb006657
Yao, S., and Yang, H. (2020). Rupture dynamics of the 2012 nicoya Mw 7.6 earthquake: Evidence for low strength on the megathrust. Geophys Res. Lett. 47 (13), e2020GL087508. doi:10.1029/2020GL087508
Yin, A., and Harrison, T. M. (2000). Geologic evolution of the Himalayan-Tibetan orogen. Annu. Rev. Earth Planet Sci. 28, 211–280. doi:10.1146/annurev.earth.28.1.211
Yue, H., Shen, Z.-K., Zhao, Z., Wang, T., Cao, B., Li, Z., et al. (2022). Rupture process of the 2021 M7.4 Maduo earthquake and implication for deformation mode of the Songpan-Ganzi terrane in Tibetan Plateau. Proc. Natl. Acad. Sci., 119(23), e2116445119. doi:10.1073/pnas.2116445119
Zhang, J. Y., Wang, X., Chen, L., and Liu, J. (2022a). Seismotectonics and fault geometries of the Qinghai Madoi M(s)7. 4 earthquake sequence: Insight from aftershock relocations and focal mechanism solutions. Chin. J. Geophys (in Chin. 65 (2), 552–562. doi:10.6038/cjg2022P0516
Zhang, P. Z., Wen, X. Z., Shen, Z. K., and Chen, J. H. (2010). “Oblique, high-angle, listric-reverse faulting and associated development of strain: The Wenchnan earthquake of May 12, 2008, Sichuan, China,” in Annu. Rev. Earth Planet. Sci. Editors R. Jeanloz, and K. H. Freeman (Palo Alto: Annual Reviews), 3838, 353.
Zhang, X., Feng, W., Du, H., Samsonov, S., and Yi, L. (2022b). Supershear rupture during the 2021 MW 7.4 Maduo, China, earthquake. Geophys Res. Lett. 49 (6), e2022GL097984. doi:10.1029/2022GL097984
Zhang, Y., An, Y., Long, F., Zhu, G., Qin, M., Zhong, Y., et al. (2021). Short-term foreshock and aftershock patterns of the 2021 Ms 6.4 Yangbi earthquake sequence. Seismol. Res. Lett. 93, 21–32. doi:10.1785/0220210154
Zhao, L. F., Xie, X. B., He, J. K., Tian, X. B., and Yao, Z. X. (2013a). Crustal flow pattern beneath the Tibetan Plateau constrained by regional Lg-wave Q tomography. Earth Planet Sci. Lett. 383, 113–122. doi:10.1016/j.epsl.2013.09.038
Zhao, L. F., and Xie, X. B. (2016). Strong Lg-wave attenuation in the Middle East continental collision orogenic belt. Tectonophysics 674, 135–146. doi:10.1016/j.tecto.2016.02.025
Zhao, L. F., Xie, X. B., Wang, W. M., Zhang, J. H., and Yao, Z. X. (2013b). Crustal Lg attenuation within the north China craton and its surrounding regions. Geophys J. Int. 195 (1), 513–531. doi:10.1093/gji/ggt235
Zhao, L. F., Xie, X. B., Wang, W. M., Zhang, J. H., and Yao, Z. X. (2010). Seismic lg-wave Q tomography in and around northeast China. J. Geophys Res. 115 (B08), B08307. doi:10.1029/2009jb007157
Zheng, G., Wang, H., Wright, T. J., Lou, Y., Zhang, R., Zhang, W., et al. (2017). Crustal deformation in the India-Eurasia collision zone from 25 years of GPS measurements. J. Geophys Res. 122 (11), 9290–9312. doi:10.1002/2017jb014465
Keywords: stress drop, Lg source spectra, Yangbi earthquake sequence, Maduo earthquake sequence, eastern Tibetan plateau
Citation: He X, Zhao L-F, Xie X-B, Zhang L and Yao Z-X (2023) Eastward expansion of the Tibetan plateau: Insights from stress drops of the 2021 Ms 6.4 Yangbi, Yunnan and Ms 7.4 Maduo, Qinghai earthquake sequences in China. Front. Earth Sci. 11:1081605. doi: 10.3389/feart.2023.1081605
Received: 27 October 2022; Accepted: 11 January 2023;
Published: 25 January 2023.
Edited by:
Hongfeng Yang, The Chinese University of Hong Kong, ChinaReviewed by:
Gaohua Zhu, Institute of Oceanology (CAS), ChinaFatih Bulut, Boğaziçi University, Türkiye
Copyright © 2023 He, Zhao, Xie, Zhang and Yao. This is an open-access article distributed under the terms of the Creative Commons Attribution License (CC BY). The use, distribution or reproduction in other forums is permitted, provided the original author(s) and the copyright owner(s) are credited and that the original publication in this journal is cited, in accordance with accepted academic practice. No use, distribution or reproduction is permitted which does not comply with these terms.
*Correspondence: Lian-Feng Zhao, emhhb2xmQG1haWwuaWdnY2FzLmFjLmNu