
95% of researchers rate our articles as excellent or good
Learn more about the work of our research integrity team to safeguard the quality of each article we publish.
Find out more
METHODS article
Front. Earth Sci. , 27 March 2023
Sec. Solid Earth Geophysics
Volume 11 - 2023 | https://doi.org/10.3389/feart.2023.1073684
This article is part of the Research Topic Advances and Applications of Passive Seismic Source Characterization View all 12 articles
 G. M. Adinolfi1*
 G. De Landro2
 M. Picozzi2
 F. Carotenuto2A. Caruso3
 S. Nazeri2
 S. Colombelli2
 S. Tarantino4T. Muzellec2A. Emolo2
 A. Zollo2A. Orefice5B. Ulivieri5D. Calcagni6
 M. Piantanida7
A modern digital seismic network, with many stations optimally distributed on the earthquake causative seismic zone, enables detection of very low magnitude earthquakes and determination of their source parameters. It is essential to associate to such kind of networks procedures to analyze the huge amount of continuously recorded data for monitoring the space-time-magnitude evolution of natural and/or induced seismicity. Hence, the demand for near-real-time, automated data collection and analysis procedures for assisting seismic network operators in carrying out microearthquake monitoring is growing. In response to this need, we designed a computational software platform, TREMOR, for fast and reliable detection and characterization of seismicity recorded by a dense local seismic network. TREMOR integrates different open-source seismological algorithms for earthquake signal detection, location, and source characterizations in a fully automatic workflow. We applied the platform in play-back mode to the continuous waveform data recorded during 1 month at the Japanese Hi-net seismic network in the Nagano region (Japan) and compared the resulting catalog with the Japan Meteorological Agency bulletin in terms of number of detections, location pattern and magnitudes. The results show that the completeness magnitude of the new seismic catalog decreased by 0.35 units of the local magnitude scale and consequently the number of events increased by about 60% with respect to the available catalog. Moreover, the fault plane solutions resulted coherent with the stress regime of the region, and the Vp/Vs ratio well delineated the main structural features of the area. According to our results, TREMOR has shown to be a valid tool for investigating and studying earthquakes, especially to identify and monitor natural or induced micro-seismicity.
Automatic detection, location, and source characterization of small magnitude events are challenging tasks for seismic monitoring, both in active fault zones and in areas of underground resources exploitation. A reliable and fast characterization of natural and/or induced seismicity is indeed crucial for seismic hazard analyses, and an a priori condition for correctly managing field operations in exploitation areas (Oye and Roth, 2003; Tomic et al., 2009; Goertz-Allmann et al., 2011; Yukutake et al., 2011; Zollo et al., 2014; Grigoli et al., 2017; Li et al., 2019; Lomax and Savvaidis, 2019; Verdon et al., 2019). Given recent technological developments, the availability of real-time and continuous data from local, dense networks has significantly increased, allowing detection of ultra and micro earthquakes (M ≤ 0) and building of complete seismic catalogs with magnitude down to very low, even negative, values (Poiata et al., 2016; De Landro et al., 2019). The comprehensive study of micro-seismicity can provide a valuable description of the geological medium properties and earthquake related processes in the investigated crustal volumes, such as for instance the identification and geometrical characterization of active fault structures (Shearer, 2002; Hauksson and Shearer, 2005; Lin et al., 2007; De Landro et al., 2015; Adinolfi et al., 2019; Battimelli et al., 2019; Adinolfi et al., 2022), the study of the regional stress field (De Matteis et al., 2012; Terakawa, 2017; Maeda et al., 2020; De Matteis et al., 2021), the small-scale variability of faulting style, stress and strength (Prieto et al., 2004; Hardebeck, 2006; Syracuse et al., 2010; Adinolfi et al., 2015; Stabile et al., 2012; Festa et al., 2021), and the assessment of seismic hazard (Schorlemmer and Wiemer, 2005; Bernard et al., 2006; Emolo et al., 2011). Such achievements have led to an increasing demand for managing and analyzing large amounts of seismic data, mostly consisting of small-magnitude seismic events with signals comparable to or even below the noise level, for which analysts’ manual operations are unfeasible (Yoon et al., 2015; Perol et al., 2018; Mousavi et al., 2019; Scafidi et al., 2019; Scala et al., 2022). Seismic monitoring is moving towards the development of fully automated and robust processing approaches, able to exploit the nowadays available huge amount of continuous data and to speed up seismic analyses, which are important for seismic risk assessment and reduction practices (Spallarossa et al., 2021a).
In this work, we present a novel AuTomatic, iteRativE, Modular computational platform for mOnitoring micRo-seismicity (i.e., TREMOR1), and its application to the Nagano microseismicity. TREMOR integrates different open-source seismological algorithms for detecting, locating and characterizing very small earthquakes in a fully automatic way (Figure 1). Innovatively, TREMOR provides, together with the standard estimates of earthquake locations, the local, moment, and energy magnitudes, fault plane solutions and the VP/VS ratio at each recording station, as a function of space and time with the aim of monitoring the medium properties.
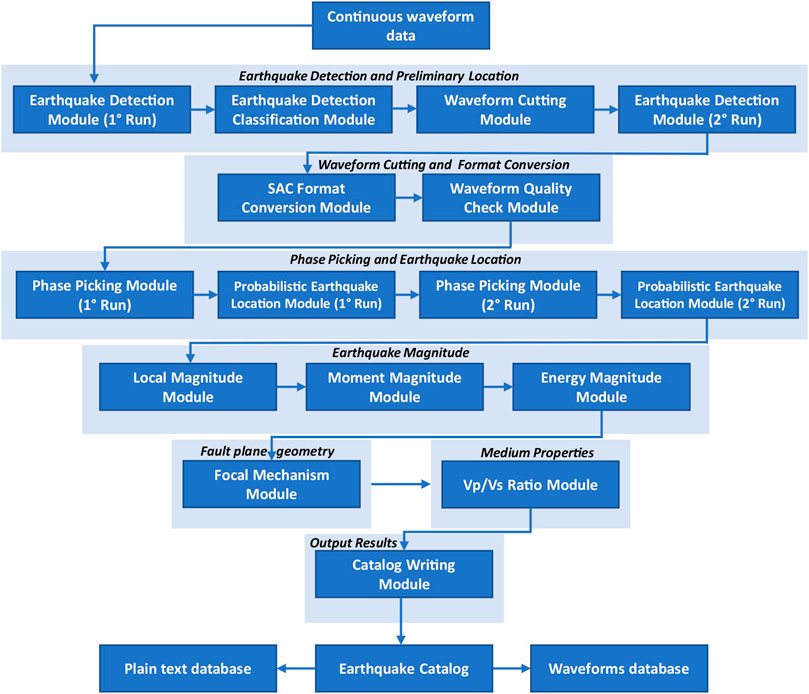
FIGURE 1. Workflow of the processing scheme implemented in the computational earthquake monitoring platform. Computational modules inside the program are shown.
We applied the platform to the continuous waveforms recorded during May 2011 at 25 stations of the Japanese Hi-net seismic network (https://doi.org/10.17598/NIED.0003) (Obara et al., 2005) located in an area of about 70 km × 75 km in the Nagano region. This area was selected considering: 1) the high station density, with mean station spacing of about 10 km; 2) the high rate of micro-seismicity (more than 100 events per month); and 3) the high quality of waveform recording (since most stations are in boreholes). The platform performance is evaluated by comparing its results with respect to the Japan Meteorological Agency (JMA, https://www.jma.go.jp/jma/indexe.html) catalog obtained with the same network.
The computational platform TREMOR is designed using a Python modular architecture (version 3.6.9), in which each step of the data processing is performed by a specific module. The software block diagram is shown in Figure 1. The main outputs of the analysis are: 1) an earthquake catalog, which contains the time, location, and magnitudes of earthquakes, together with auxiliary information such as phase readings, fault plane solutions and strong motion parameters; and 2) a catalog of earthquake waveforms which contains the seismic traces, windowed around the origin time, of the seismic events plus other information including the seismic station coordinates and the earthquake time, location, magnitude, and phase readings.
The innovations of TREMOR are represented by the estimation of: 1) the earthquake source parameters, 2) the ground motion and 3) the medium properties. In fact, unlike other software used for seismic monitoring, TREMOR calculates energy and moment magnitudes and focal mechanism automatically. The estimation of these parameters for micro-seismicity represents a significant advance towards a complete characterization of the seismic source. Moreover, TREMOR provides ground motion estimates in terms of peak ground velocity (PGV) and acceleration (PGA) with the aim to give more accurate metrics relevant in earthquake engineering and seismic hazard studies. Finally, TREMOR calculates the Vp/Vs ratios to gather information on the physical properties of the medium, which are very useful for studying the influence of fluids in generating earthquakes.
In the following we present a brief description of the methods used in the different platform modules, especially the innovative ones of TREMOR. More details on the platform architecture and moduli interactions can be found in the Supplementary Material.
Earthquake detection is carried out following the coherence-based approach proposed by Adinolfi et al. (2020). The detection module performs a time-shifting and stacking of characteristic functions computed on seismic traces recorded at different stations, aiming to identify and preliminarily locate earthquakes inside a pre-defined spatial grid of potential source locations. In this module, only the S-wave arrivals are used for the detection. Then, the module classifies detected seismic events as real or false based on the presence of a minimum number of triggered stations, their distances from the epicenter, and the coherence of their arrival times (see Heimann et al., 2017; Adinolfi et al., 2019).
The picking of P- and S-wave arrival times is based on the algorithm of Ross and Ben-Zion (2014) using the triggered stations from the Earthquake Detection Module. Specifically, the P-pick is performed by requiring the exceedance of a threshold of the STA/LTA characteristic function around the theoretical P-wave arrival time. The S-pick is performed by searching the maximum point of the kurtosis derivative function.
This module implements the procedure proposed by Zollo et al. (2021) for event locations following a probabilistic approach based on the P- and S-phase picks and the travel-time grids generated by the NLLoc software (Lomax et al., 2000; http://alomax.free.fr/nlloc). The module gives as output the earthquake location and a map of the PDF distribution with the maximum likelihood hypocenter. The location errors are defined by considering the 31% and 68% significance levels of the probability density function (PDF), which corresponds to ±1σ.
This module exploits an approach proposed by Picozzi et al. (2017) for earthquake early warning purposes and extended to monitoring applications by Picozzi et al. (2018, 2019), and Spallarossa et al. (2021b). For each record, it obtains an estimate of the apparent energy by integrating the S-transform instantaneous spectrum, after correcting it for the geometrical spreading. Then, the event radiated energy is computed as the average among single station estimates. The corrective factor for geometrical spreading is set in the configuration file. In addition, this module measures peak ground velocity (PGV) and acceleration (PGA) for the three component recordings.
With the aim of determining the seismic moment (M0) and the moment magnitude (Mw) of an earthquake, this module exploits the time evolution of the P-wave amplitude as proposed by Colombelli et al. (2014, 2015), and Nazeri et al. (2019). The logarithm of the P-wave peak (acceleration and velocity) amplitude is measured on the vertical component of recorded waveforms, in expanding time windows after the P-wave arrival, and after correction of the amplitude for the geometrical spreading. Corrective factors are set in a configuration file.
This module inverts the observed, absolute initial P-wave peak amplitudes, corrected for the geometrical attenuation effect, and the P- polarities to estimate focal mechanisms in a Bayesian framework (Tarantino et al., 2019). Data for the focal mechanism estimation are selected using an SNR threshold, which is set in the configuration file along with the minimum number of readings to perform the estimation.
This module evaluates the average VP/VS ratio along the ray paths to each seismic station from observations of the difference between P- and S- arrival times divided by the P-wave travel time from the source to the station (Wadati and Oki, 1933; Kisslinger and Engdahl, 1973; Lucente et al., 2010; Chiarabba et al., 2009). The temporal evolution of the VP/VS ratio for a set of stations can enable identification of both spatial and temporal changes in the medium properties (Amoroso et al., 2018; De Landro et al., 2022).
We validated the TREMOR platform by applying it to a dataset of continuous waveforms from the Northern Nagano region (Japan) that was recorded by the Japanese High Sensitivity Seismograph Network (Hi-net, https://www.hinet.bosai.go.jp/), operated by the National Research Institute for Earth Science and Disaster Prevention (National Research Institute for Earth Science and Disaster Resilience, 2019). We selected the Nagano area in Honshu, Japan, for two reasons: 1) its high seismogenic potential and seismicity due to the presence of the Itoigawa–Shizuoka Tectonic Line (ISTL), which cuts the Island of Honshu and extends for ∼150 km from Itoigawa City on the Sea of Japan to Shizuoka City on the Pacific Ocean (Figure 2A); and 2) the high station density in this area, with an average inter-station distance of about 10 km over a maximum aperture of 70 km.
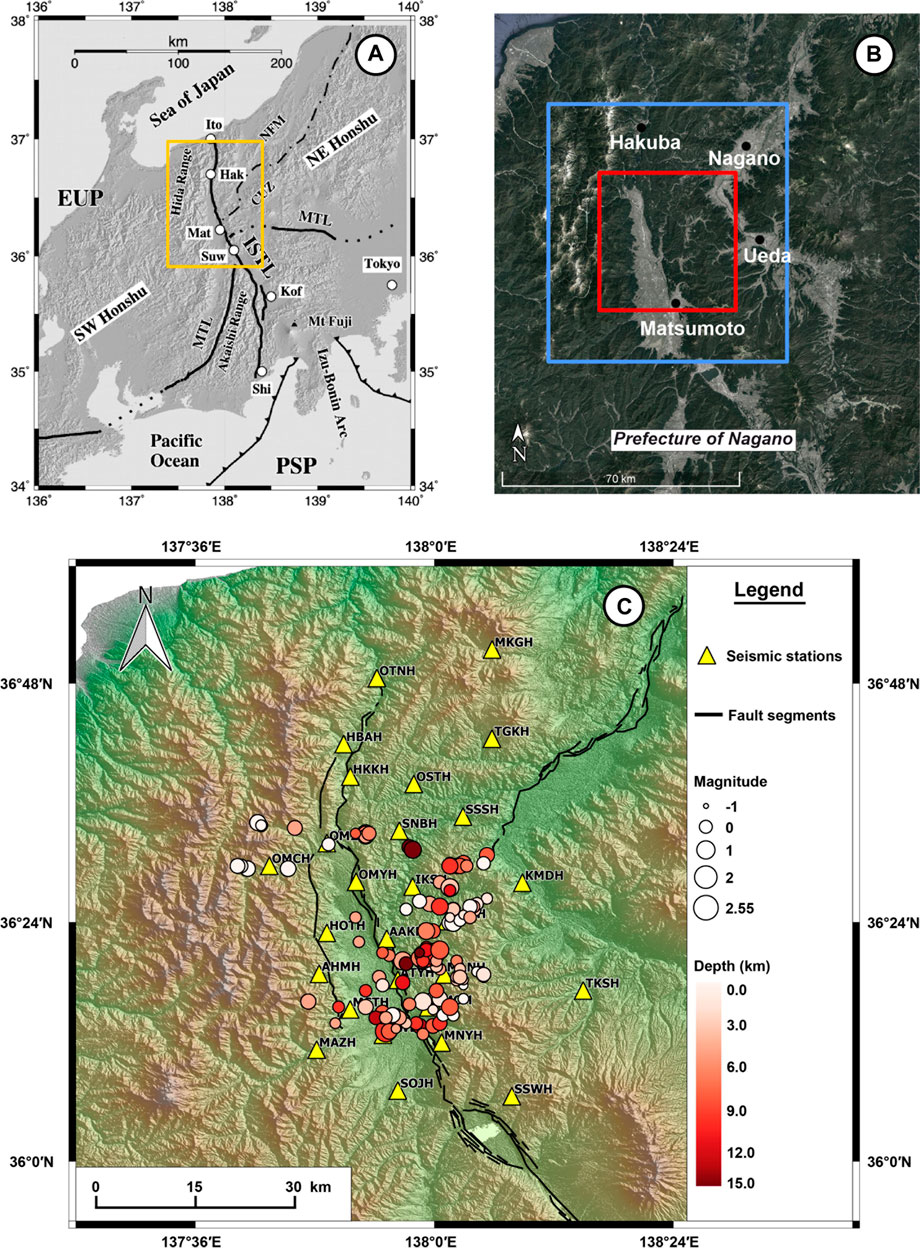
FIGURE 2. Location map of the study area (A, B) and epicentral map of the JMA earthquakes used as reference catalog in this study (C). (A) Location of the area of interest, Nagano prefecture, along the ISTL line. The yellow contoured area is the location of the area plotted in the (B) and (C) panels (modified after Panayotopoulos et al., 2016). (B) The blue rectangle (70 km × 75 km) shows the location of the volumetric grid of potential hypocenters investigated in this work, the red rectangle delineates the target area (40 km × 40 km) used for the final selection of events. (C) Circles depict micro-seismicity recorded by the Japanese seismographic network Hi-net (yellow triangles) during May 2011 occurred within the target area [red square in (B)]. This area is the region best covered by the selected seismic network stations. The earthquake locations are from the JMA catalog. The sizes and colors of the circles are coded according to the magnitude and depth of the earthquakes, respectively.
The ISTL strikes NNE–SSW to NNW–SSE and is one of the most active faults in Japan, since it forms one arm of the triple junction of the Eurasian, North American, and Philippine Sea plates. The northernmost segment of the ISTL, the Kamishiro fault, has been shown to be an active thrust fault (Sato et al., 2004; Takeda et al., 2004). On the other hand, the Otari–Nakayama fault, which runs parallel to the Kamishiro and East Matsumoto Basin faults, shows no geomorphological evidence of late Quaternary activity (Matsuta et al., 2004; Ueki, 2008).
We selected a study area of about 40 km × 40 km (blue rectangle in Figure 2B) internal to the larger area covered by the network and collected continuous three-component velocity recordings from 25 borehole stations of Hi-net network in and near this area, (yellow triangles in Figure 2C) with a sampling rate of 100 Hz. Continuous waveform data were downloaded from NIED Hi-net website (https://www.hinet.bosai.go.jp/). We considered the period from the 1st to the 31st of May 2011, for which the Japan Meteorological Agency (JMA) reported 101 earthquakes with magnitudes ranging between −0.6 and 2.6 and depths up to 15 km (Figure 2C, circles). The JMA catalog magnitude of completeness estimated for this time period is 0.2.
Before running the code, we formatted the data in mseed format, organized it in files of one-hour length, and wrote input files with all necessary information (e.g., seismic network, velocity model). Moreover, we modified each control file for TREMOR modules with a set of parameters properly tuned for the characteristics of Nagano seismicity to be analyzed (for more details see Supplementary Tables S1–S6).
For the earthquake detection, we defined a 3D grid of potential source locations with a size of 70 km × 75 km × 20 km, with spacing equal to 1.5 km and centered on the barycenter of the seismic network used (blue rectangle in Figure 2B). For the parameter tuning, a specific analysis on a 10-day training dataset was carried out by modifying the parameters and optimizing them based on the number of real and false detections. After a visual inspection of the waveforms, we compared the preliminary results of this analysis with seismicity data from the JMA catalog. The chosen detection parameters are: coherence greater than 700, a signal-to-noise ratio greater than or equal to 3, which is used for the definition of triggered stations (with 10 s of signal, 3 s of noise), and three triggered stations among the 10 closest stations to the epicenter. Figure 3 shows an example of the detection module application for an MV 2.5 earthquake (velocity magnitude as calculated by JMA), which occurred on 16/05/2011 at 13:25:04 (JST) in the study area. Waveforms (Figure 3A) and characteristic functions (Figure 3B, normalized amplitudes) are calculated for each station to evaluate the vertical stack of the coherence map for the search region (Figure 3C) and global image functions corresponding to the best fit source time (Figure 3D).
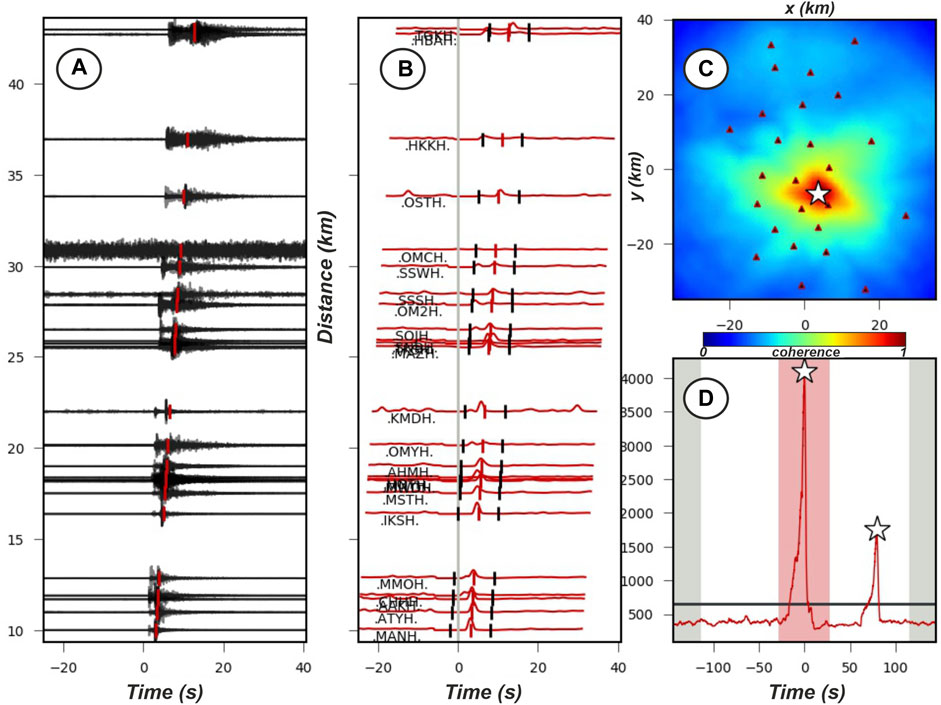
FIGURE 3. Example of arrival-time coherence detection for an MV 2.5 earthquake on 16/05/2011 at 13:25:04 (JST). (A) Waveforms used for detections sorted by epicentral distance. (B) Characteristic functions (normalized amplitude) calculated for each station. They are corrected according to the S-wave velocity (red lines) for the travel time and stacked to obtain the final global image function in (D). The markers indicate the best fit arrival times for the P- and S- phases. The black markers indicate the time window over which the characteristic function amplitude is considered for the definition of triggered or not-triggered stations. (C) Stack of the coherence map for the search region with available seismic stations (black triangles) and the event detected (white star at 0 s). The color bar shows coherence values. (D) Global image functions corresponding to the best fit of the source position along a processing time window centered on the origin time of the detected earthquake. The white star indicates the detected event above a fixed threshold value (black line). The white star on the right, at 75 s, is a second event, which was subsequently detected.
Despite this positive performance, it is worth noting that the TREMOR event detection algorithm missed 5 earthquakes which are in the JMA catalog, with Mv < 0, while other six events that were external to the seismic network and target area which were mislocated at the border of the location grid. These cases can occur when very small magnitude events (Mv < 0) are not detected or are detected with low SNR, resulting in mis-location inside the target area or at the border of the grid due to too few and/or incorrect phase readings.
To properly set the parameters that guide the picking procedure, we performed an optimization analysis based on comparisons between manual and automatic P-wave arrival time identifications on a sub-set of Nagano events. We explored a wide range of possible parameters and selected as the “best” configuration the one that minimizes the average differences between manual and automatic picks, for all source-station pairs and for both the vertical and horizontal components (average on the order of 0.05 s). In the optimization procedure, we also tried to minimize the number of missed picks (less than 15% for the “best” parameters). The picking parameters that we selected are listed in the Supplementary Table S4.
For the earthquake locations, we used the same 1D velocity models that JMA uses for locating Japanese seismicity (Ueno, 2002). We parameterized the crustal structure using a 3D grid with spacing 0.5 km and size of 70 km × 75 km × 20 km. The theoretical travel times from the grid nodes to the seismic stations were calculated using the Eikonal finite-difference scheme of (Podvin and Lecomte, 1991), as implemented by the Non LinLoc software (Lomax et al., 2000) for absolute earthquake locations in 3D velocity media. We used the same 3D grid for both location steps during the analysis. We located earthquakes with at least 2 P- and 2 S-phase picks, after discarding arrival times with residuals for P- and S-waves higher than 0.5 s and 1 s, respectively. Although it is common practice to use a higher minimum number of phases, we have chosen to use only four phases to maximize the number of micro-earthquake locations.
Figure 4 shows an example of the picking module application for an MV 2.5 earthquake which occurred on 16/05/2011 at 13:25:04 (JST) in the study area. The characteristic functions (Figure 4A) and the phase picking on the vertical (Figure 4B) and horizontal (Figure 4C) velocity records are shown.
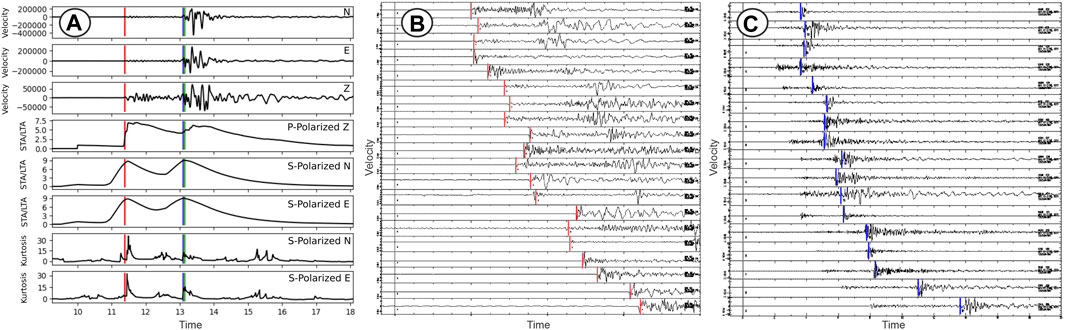
FIGURE 4. Example of P- and S- phase-picking for the MV 2.5 earthquake on 16/05/2011 at 13:25:04 (JST) in the Nagano region. (A) (From the top): 1) the 3-C velocity waveforms, 2) the STA/LTA characteristic functions for the P- (vertical) and S- waves (horizontal) polarized components, and 3) the kurtosis characteristic function calculated for the S-polarized horizontal components. The red and blue vertical lines show the P- and S-wave picks, respectively. (B) Seismic sections for vertical and (C) horizontal components of the stations for which a P-pick (red vertical line) and S-pick are available.
Figure 5 shows the probabilistic location for the same event. After the first run of data processing with the defined spatial grid, 406 earthquakes were detected by the platform of which 339 were effectively located. Based on their location, pick number, and location quality, 157 earthquakes were identified as located within the smaller target grid (red rectangle in Figure 2B). Of the 157 events, 96 are also in the JMA catalog. Five events in the JMA catalog (with M ≤ 0) were missed by TREMOR, while it provided 61 new detections. After visual inspection, we confirmed that all of the new detected events are real earthquakes, with no false detections.
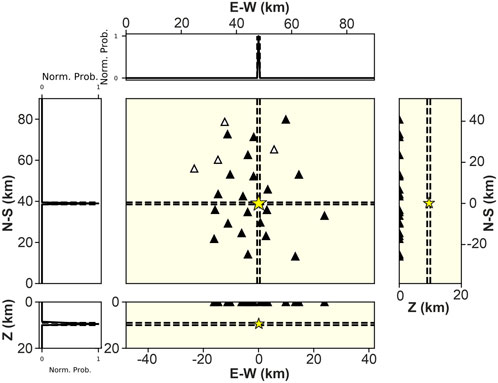
FIGURE 5. Example of probabilistic earthquake location for the Mv 2.5 earthquake which occurred on 16/05/2011 at 13:25:04 (JST) in the Nagano region. The earthquake location in the horizontal and vertical planes, with uncertainties (dotted lines), is marked by a yellow star. The normalized probability density function is shown along N-S and E-W directions and along a vertical section.
For the 157 detected and located events in the study area, TREMOR provided 1286 P-wave picks and 1216 S-wave picks in the two steps of phase picking. To evaluate the quality and robustness of the automatic picking, we manually picked a subset of 100 events among the final catalog, selected in order to be representative in terms of location and magnitude of the entire seismicity, and we compared the automatic and manual P and S picks (see Supplementary Material). The mean values of the time differences between manual and automatic P- and S-wave onsets are equal to −0.06 and 0.08 s, respectively, with standard deviations of 0.29 and 0.31 (Supplementary Figure S1). These mean values, along with the histograms in Supplementary Figure S1, indicate that the automatic arrival time picks tend to be slightly later than the manual picks.
In the first step of the locations, the events were located with mean errors of 1.2, 2.0, and 2.0 km for the NS, EW and vertical directions, respectively, with an average root-mean-square (RMS) of 0.5 s and a mean of 5 P- and 5 S- phases. The final earthquake locations, shown in Figure 6, have mean location errors equal to 1.1, 1.9, 2.0 km along the NS, and EW horizontal and vertical directions, respectively, a mean RMS (weighted) of 0.2 s, and a mean of 8 P- and 8 S-phases per event (Figure 6A).
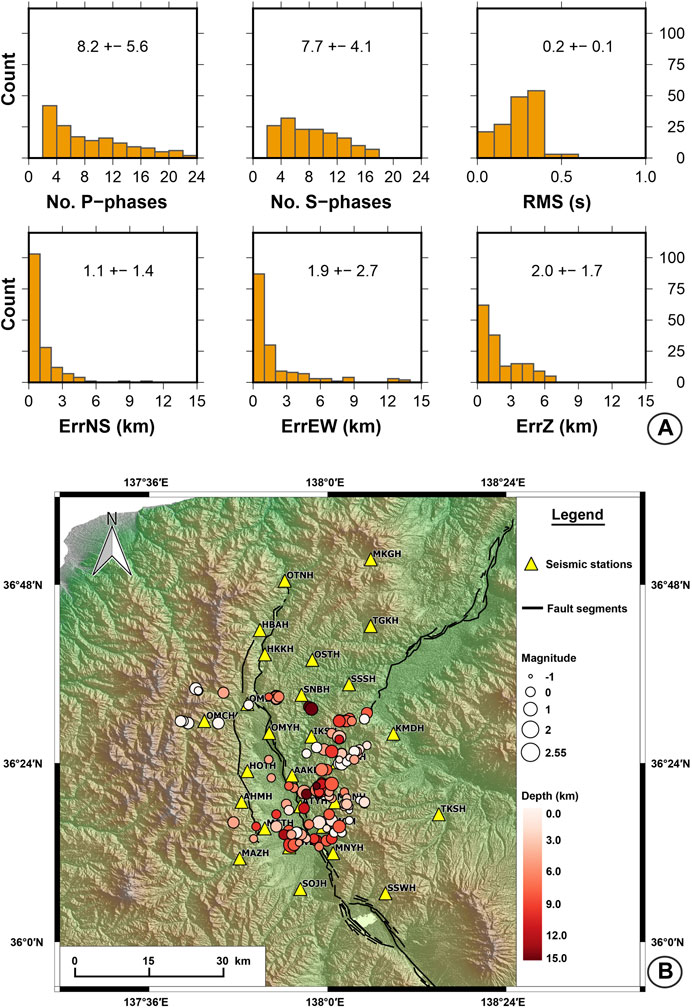
FIGURE 6. Results of TREMOR application to Nagano seismicity occurred during May 2011, in terms of location quality (A) and earthquake spatial distribution (B). (A) Histograms for numbers of P- and S- readings, RMS of travel time residuals, and horizontal and vertical errors for the earthquake locations. For each histogram, the mean and standard deviation values are reported. (B) Earthquake epicenters located by the platform inside the target area (red square in Figure 2B) for the Nagano region during the time period analyzed. Symbols and colors are the same as in Figure 2C.
The seismicity pattern delineated by the 157 located events correlates well with the main seismicity features of the area (Figure 6B; Supplementary Figure S2). The seismicity appears mainly aligned along the two segments of the ISTL, the Kamishiro and the Otari–Nakayama faults, down to a depth of 15 km, under the currently dominant east–west compressional stress field (Ando et al., 2017; Panayotopoulos et al., 2014; Panayotopoulos et al., 2016). The hypocenters of the 157 events show the same features of the earthquakes clustered mainly along Otari–Nakayama fault and its NE branch fault, in the southern and eastern part of Matsumoto basin, defining in depth an E-dipping plane (Supplementary Figure S2).
The JMA assigns earthquakes a velocity magnitude (MJMA), determined from the maximum amplitudes of velocity seismograms (Funasaki and Earthquake Prediction Information Division, 2004). Unfortunately, we could not use the Mv relation directly because the distance and depth corrections are not accessible from JMA web service. So, to better compare our results with those of the JMA catalog, we calculated a velocity magnitude (Mv) based on a linear regression between the maximum horizontal velocities at selected seismic stations and JMA catalog magnitudes. Looking at Figure 7, a good agreement exists between the magnitude estimates of TREMOR and the JMA magnitude values. Approximately linear scaling relations with MJMA are evident for Mv, Me and Mw, with mean differences of 0.09, −0.34, −0.55 and standard deviations of 0.17, 0.17, 0.39, respectively.
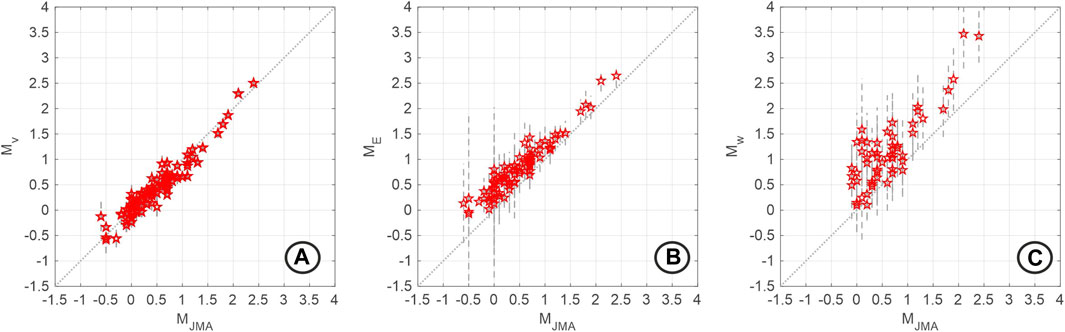
FIGURE 7. Magnitude estimates for the earthquakes identified by TREMOR in the Nagano region. From left to right, calculated Mv (A), ME (B) and Mw (C) are plotted versus MJMA. MJMA stands for velocity magnitude calculated by JMA.
Fault plane solutions range from reverse to strike-slip (Figures 8, 9A), in accordance with the complex stress regime of this region. We found 57 focal mechanism solutions with an average RMS equal to 0.18 and a mean mismatch on polarity equal to 0.21 (see Supplementary Material). Matsumoto basin is characterized by the interaction of the Kamishiro fault with dip 30°–45° SE and the Otari-Nakayama fault that dips more steeply, at 50°–65° SE. According to Panayotopoulos et al. (2016), focal mechanism solutions for aftershocks of the 2014, M 6.7 Northern Nagano earthquake exhibit both reverse and left-lateral components, with a large strike-slip component distributed along a branch fault with a steep dip-angle (i.e., Otari-Nakayama), consistent with the fault plane solutions estimated by TREMOR.
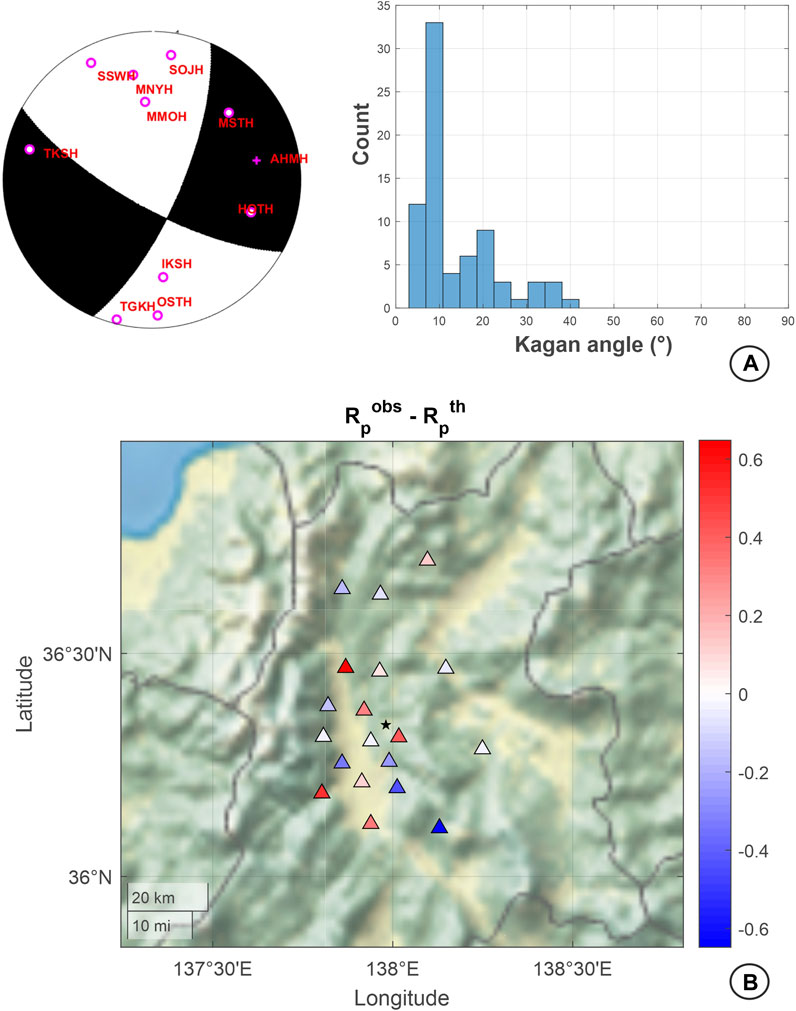
FIGURE 8. Example of fault plane solution computed for the MV 2.5 earthquake on 16/05/2011 at 13:25:04 (JST) in the Nagano region. (A) On the left: focal mechanism solution with the largest probability. The open circles correspond to automatic negative polarities; the crosses are for automatic positive polarities. Station names are labeled in red. On the right: Kagan angle distribution between the best solution and all solutions up to 95% of the maximum of the probability. (B) Map of epicenter location and seismic stations used for focal mechanism calculus. The color-bar refers to the residual between the observed and predicted P-wave amplitude at the available stations.
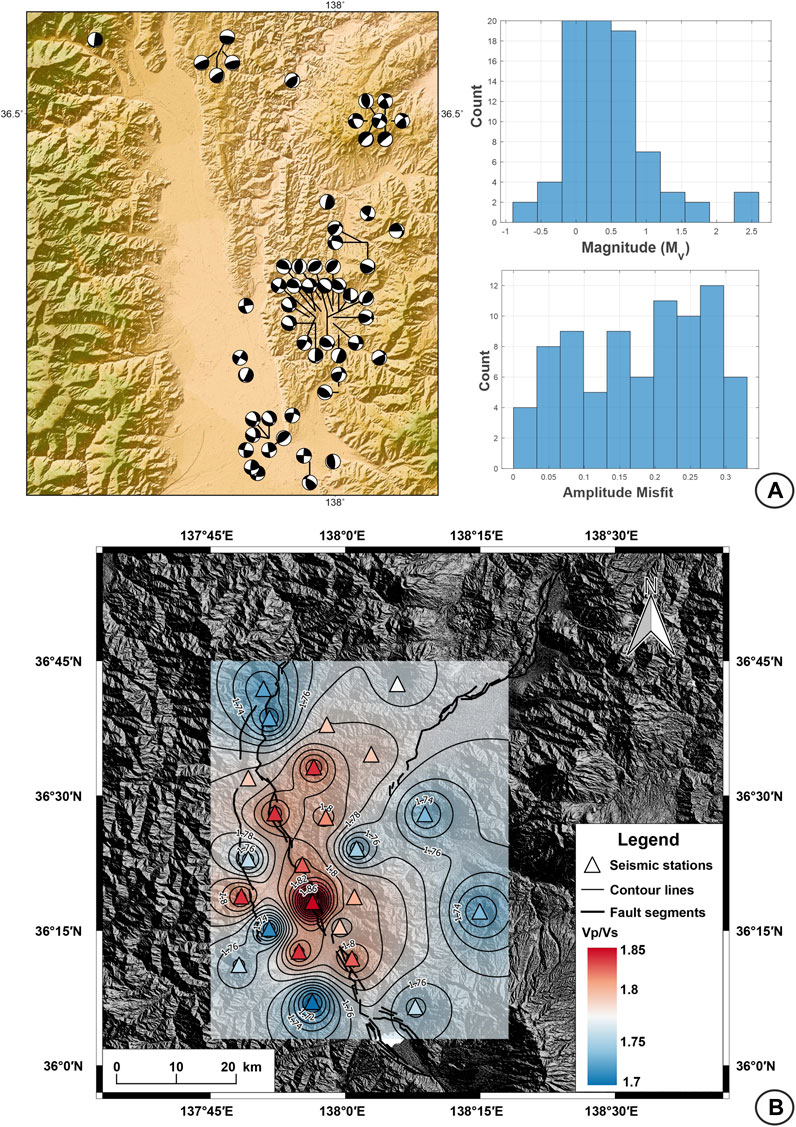
FIGURE 9. (A) On the left: plot of our focal mechanism solutions for the Nagano region with at least six P-wave readings. On the right: histograms of the magnitude distribution and of the P-wave amplitude misfits for the computed fault plane solutions. (B) Spatial distribution of the VP/VS ratio in the Nagano region. The ratios, computed at each seismic station (triangles) and interpolated, are indicated by the contour lines and colors.
In order to validate the VP/VS values obtained by the automatic module application, we compared our results with the tomographic results from the work of Panayotopoulos et al. (2014) (Figures 6C, 8). First, we calculated a VP/VS ratio value for each station by averaging the values obtained for the entire month (Supplementary Figure S3). Then, we interpolated the VP/VS ratios at the stations to obtain a map that can be compared to the tomographic image. The VP/VS map shown in Figure 9B agrees with the results by Panayotopoulos et al. (2014)). Indeed, they found a range of VP/VS ratio between 1.5 and 1.9, high VP/VS anomalies along the ISTL fault and a mean VP/VS value of about 1.73 for the other areas.
Figure 10 compares the frequency-magnitude distributions (Gutenberg and Richter, 1942; Aki, 1965; Wiemer, 2001) for the TREMOR and JMA catalogs for the same area and time period. We observe that the TREMOR catalog has more small-magnitude events than the JMA catalog and a lower magnitude of completeness, Mc, of Mv −0.12. In comparison, the JMA catalogue is complete for Mv 0.20 and larger.

FIGURE 10. Gutenberg-Richter cumulative frequency-magnitude plots for (A) the JMA catalog and (B) the catalog retrieved in this study by the computational platform. Data are for the seismicity in the Nagano region (target area) during May 2011. The magnitudes are velocity magnitude, Mv. The completeness magnitude Mc for both catalogs is indicated with dashed lines.
We have presented a software platform for microearthquake monitoring, TREMOR, which combines a series of open-software and newly developed algorithms useful for monitoring and studying of natural or induced seismicity. Through TREMOR, a complete and detailed analysis of seismicity can be performed. After an appropriate tuning of a set of input parameters, the continuous seismic waveforms are automatically analyzed to obtain a high-resolution catalog of seismicity which occurred within a target area in a defined time period.
As a consequence of the rapid development of dense seismic networks and the need for reliable catalogs for monitoring purposes, in recent years the research in this field has gradually shifted from the traditional standard processing workflow where each event is identified and characterized by analysts to advanced automatic processing and interpretation techniques. TREMOR includes algorithms for detecting weak seismic signals and characterizing each event in terms of local magnitude, moment magnitude, seismic energy, and focal mechanism, with the goal of producing an informative seismic catalog that is potentially complete to very small magnitudes. TREMOR provides a detailed analysis of earthquake source by computing Me and Mw, offering a clearer picture of the seismicity and the physics of the rupture process. Although representing a challenge for small earthquakes, one of the most innovative tasks of TREMOR is the focal mechanism computation. This information has become a routine analysis by seismological agencies only for earthquakes of M ≥ 4. As evidenced by the Nagano application, TREMOR can reliably calculate fault plane solutions even for small magnitude earthquakes, when recorded by a dense seismic network. The information on the geometry of the rupture provided by the focal mechanisms is essential for identifying the fracture patterns or activated fault segments for seismotectonic studies or for monitoring the space-time evolution of seismicity during the underground industrial operations. Moreover, peak ground motion parameters computed by TREMOR for small magnitude events represent a novelty, very useful to have a robust metric of the ground shaking or to compute detailed maps of temporal/spatial variability of ground-motions. In addition to the seismic source characterization, a module for the near-real-time monitoring of the VP/VS ratio is also included. Although the limitation of the calculated VP/VS ratio, as the assumption that this is constant along the ray-path, the obtained values can be used as first order estimates. The latter quantity is directly correlated with the presence of fluids within the crust (Thurber et al., 1995; De Landro et al., 2020) and the analysis of its spatio-temporal variations allows for the 4D imaging of large-scale medium properties (Amoroso et al., 2018; De Landro et al., 2022).
The main advantages of the computation platform can be summarized as follows.
1. Full-automatic processing. After the parameter tuning and the setting of control files, continuous waveform data are analyzed from earthquake detection to source parameter determination without any manual effort by an operator. Furthermore, by selecting near-real-time processing (batch-mode), the data analysis could be programmed in time according to raw-data timeslot. Once configured, the platform automatically: 1) searches the waveform data availability recursively, makes the conversion of the data into the necessary format (mseed), runs the processing for the time slots of raw data, and deletes the data already processed to save disk space.
2. Complete and detailed seismic analysis. TREMOR enables study of seismicity starting with the identification of events from continuous waveform data to their characterization in terms of the magnitudes ML, Mw and Me, peak ground motion parameters, and fault plane solutions. In addition, through the analysis of VP/VS ratios, the platform provides information about the medium properties of an area. This analysis represents the main innovation brought by TREMOR which, unlike the common softwares used for seismic monitoring, offers an in-depth characterization of the seismic source, even in the case of micro-seismicity, in terms of momentum and energy magnitude and fault kinematics.
3. Iterative, refining earthquake location. TREMOR is designed to perform two-step of processing for phase picking and earthquake location in order to: 1) reduce location errors by refining the phase picks, guided by predicted arrival times for a preliminary location; 2) obtain more robust solutions by adding more arrival time picks; and 3) reduce the number of false detections that can occur if a settable minimum number of spurious or unrelated phase readings is identified on the seismic recordings.
4. Modular architecture. The platform involves separating the data processing into independent building blocks or modules, each containing all of the parts needed to execute a single step of the analysis. Moreover, in post-earthquake processing, each module can be activated or dis-activated to run modules separately. This functionality can be very useful for focusing on specific seismological analyses, repeating analyses when necessary, or parameter tuning of the platform module. Moreover, the modularity allows users to quickly update the platform with new modules that carry out new processing functions or analyses, or to quickly modify those already present.
As demonstrated for our test case in the Nagano region, TREMOR can very successfully monitor micro-seismicity recorded by local dense seismic networks and can be a valid tool for investigating and studying natural or induced earthquakes by seismological agencies or laboratories at local scales. Future tests of TREMOR will focus on seismic sequences of moderate magnitude (M > 5) earthquakes and multiple earthquakes repeated over time as in the case of a swarm or seismic sequence. Furthermore, we want to expand the use of TREMOR to seismic networks at regional scales (>100 km). Such large-scale applications with large numbers of seismic stations requires optimization of PC memory demand and reduction of computational times.
Publicly available datasets were analyzed in this study. This data can be found here: https://www.hinet.bosai.go.jp/.
AZ, MP, GA, and GL contributed to the conceptualization of the paper. GA and FC developed the computational platform and assembled the modules. All authors participated in developing computational modules. GA and GL carried out the analysis, wrote the paper and prepared the figures. GA, GL, MP, and AZ reviewed and edited the paper. All authors approved the final version.
This work has been supported by: 1) ENI-UNINA project, Framework Agreement ENI Spa—UNINA No. 4400007890, Application Contract No. 2500033423 and 2) PRIN-FLUIDS project, Detection and tracking of crustal fluid by multi-parametric methodologies and technologies, PRIN-MIUR programme, Grant No. 20174X3P29.
We sincerely thank the Editor in Chief Valerio Acocella and Handling Editor Eleftheria Papadimitriou, and two reviewers for their constructive suggestions, which contributed to the improvement of our paper.
AC was employed by Rete Ferroviaria Italiana S.p.A. and AO, BU, DC, and MP were employed by Eni S.p.A.
The remaining authors declare that the research was conducted in the absence of any commercial or financial relationships that could be construed as a potential conflict of interest.
The authors declare that this study received funding from Eni-Spa. The funder had the following involvement in the study: decision to publish and approval of the final version of the manuscript.
All claims expressed in this article are solely those of the authors and do not necessarily represent those of their affiliated organizations, or those of the publisher, the editors and the reviewers. Any product that may be evaluated in this article, or claim that may be made by its manufacturer, is not guaranteed or endorsed by the publisher.
The Supplementary Material for this article can be found online at: https://www.frontiersin.org/articles/10.3389/feart.2023.1073684/full#supplementary-material
1TREMOR is the advanced version of AMEDASC, the Automatic Micro-Earthquake Detection And Source Characterization software platform, developed as part of a research project funded by ENI-UNINA (Copyright © 2019-2021 ENI-UNINA). The modules of focal mechanism and Vp/Vs ratio computation are not provided in AMEDASC.
Adinolfi, G. M., Cesca, S., Picozzi, M., Heimann, S., and Zollo, A. (2019). Detection of weak seismic sequences based on arrival time coherence and empiric network detectability: An application at a near fault observatory. Geophys. J. Int. 218 (3), 2054–2065. doi:10.1093/gji/ggz248
Adinolfi, G. M., De Matteis, R., Orefice, A., Festa, G., Zollo, A., de Nardis, R., et al. (2015). The September 27, 2012, ML 4.1, Benevento earthquake: A case of strike-slip faulting in Southern Apennines (Italy). Tectonophysics 660, 35–46.
Adinolfi, G. M., Picozzi, M., Cesca, S., Heimann, S., and Zollo, A. (2020). An application of coherence-based method for earthquake detection and microseismic monitoring (Irpinia fault system, Southern Italy). J. Seismol. 24, 979–989. doi:10.1007/s10950-020-09914-7
Adinolfi, G. M., De Matteis, R., De Nardis, R., and Zollo, A. (2022). A functional tool to explore the reliability of micro-earthquake focal mechanism solutions for seismotectonic purposes. Solid Earth. 13 (1), 65–83. doi:10.5194/se-13-65-2022
Aki, K. (1965). Maximum likelihood estimate of b in the formula log N= a-bM and its confidence limits. Bull. Earthq. Res. Inst. Tokyo Univ. 43, 237–239.
Amoroso, O., Festa, G., Bruno, P. P., D'Auria, L., De Landro, G., Di Fiore, V., et al. (2018). Integrated tomographic methods for seismic imaging and monitoring of volcanic caldera structures and geothermal areas. J. Appl. Geophys. 156, 16–30. doi:10.1016/j.jappgeo.2017.11.012
Ando, R., Imanishi, K., Panayotopoulos, Y., and Kobayashi, T. (2017). Dynamic rupture propagation on geometrically complex fault with along-strike variation of fault maturity: Insights from the 2014 northern Nagano earthquake. Earth, Planets Space 69 (1), 130–213. doi:10.1186/s40623-017-0715-2
Battimelli, E., Adinolfi, G. M., Amoroso, O., and Capuano, P. (2019). Seismic activity in the central adriatic offshore of Italy: A review of the 1987 ML 5 Porto San Giorgio Earthquake. Seismol. Res. Lett. 90 (5), 1889–1901. doi:10.1785/0220190048
Bernard, P., Lyon-Caen, H., Briole, P., Deschamps, A., Boudin, F., Makropoulos, K., et al. (2006). Seismicity, deformation and seismic hazard in the Western rift of Corinth: New insights from the Corinth Rift Laboratory (CRL). Tectonophysics 426 (1-2), 7–30. doi:10.1016/j.tecto.2006.02.012
Chiarabba, C., De Gori, P., and Boschi, E. (2009). Pore-pressure migration along a normal-fault system resolved by time-repeated seismic tomography. Geology 37 (1), 67–70. doi:10.1130/G25220A.1
Colombelli, S., Zollo, A., Festa, G., and Picozzi, M. (2014). Evidence for a difference in rupture initiation between small and large earthquakes. Nat. Commun. 5 (1), 3958–3965. doi:10.1038/ncomms4958
Colombelli, S., Caruso, A., Zollo, A., Festa, G., and Kanamori, H. (2015). A P wave-based, on-site method for earthquake early warning. Geophys. Res. Lett. 42 (5), 1390–1398. doi:10.1002/2014gl063002
De Landro, G., Amoroso, O., Stabile, T. A., Matrullo, E., Lomax, A., and Zollo, A. (2015). High-precision differential earthquake location in 3-D models: Evidence for a rheological barrier controlling the microseismicity at the Irpinia fault zone in southern Apennines. Geophys. Suppl. Mon. Notices R. Astron. Soc. 203 (3), 1821–1831. doi:10.1093/gji/ggv397
De Landro, G., Picozzi, M., Russo, G., Adinolfi, G. M., and Zollo, A. (2019). Seismic networks layout optimization for a high-resolution monitoring of induced micro-seismicity. J. Seismol. 24, 953–966. doi:10.1007/s10950-019-09880-9
De Landro, G., Amoroso, O., Russo, G., and Zollo, A. (2020). 4d travel-time tomography as a tool for tracking fluid-driven medium changes in offshore oil–gas exploitation areas. Energies 13 (22), 5878. doi:10.3390/en13225878
De Landro, G., Amoroso, O., Russo, G., D’Agostino, N., Esposito, R., Emolo, A., et al. (2022). Decade-long monitoring of seismic velocity changes at the Irpinia fault system (southern Italy) reveals pore pressure pulsations. Sci. Rep. 12 (1), 1247–1249. doi:10.1038/s41598-022-05365-x
De Matteis, R., Convertito, V., Napolitano, F., Amoroso, O., Terakawa, T., and Capuano, P. (2021). Pore fluid pressure imaging of the Mt. Pollino region (southern Italy) from earthquake focal mechanisms. Geophys. Res. Lett. 48 (22), e2021GL094552. doi:10.1029/2021GL094552
De Matteis, R., Matrullo, E., Rivera, L., Stabile, T. A., Pasquale, G., and Zollo, A. (2012). Fault delineation and regional stress direction from the analysis of background microseismicity in the southern Apennines, Italy. Bull. Seismol. Soc. Am. 102 (4), 1899–1907. doi:10.1785/0120110225
Emolo, A., Convertito, V., and Cantore, L. (2011). Ground-motion predictive equations for low-magnitude earthquakes in the Campania–Lucania area, Southern Italy. J. Geophys. Eng. 8 (1), 46–60. doi:10.1088/1742-2132/8/1/007
Festa, G., Adinolfi, G. M., Caruso, A., Colombelli, S., De Landro, G., Elia, L., et al. (2021). Insights into mechanical properties of the 1980 Irpinia Fault System from the analysis of a seismic sequence. Geosciences 11 (1), 28. doi:10.3390/geosciences11010028
Funasaki, J.Earthquake Prediction Information Division (2004)). Revision of the JMA velocity magnitude (in Japanese). Quart. J. Seis. 67, 11–20.
Goertz-Allmann, B. P., Goertz, A., and Wiemer, S. (2011). Stress drop variations of induced earthquakes at the Basel geothermal site. Geophys. Res. Lett. 38 (9). doi:10.1029/2011GL047498
Grigoli, F., Cesca, S., Priolo, E., Rinaldi, A. P., Clinton, J. F., Stabile, T. A., et al. (2017). Current challenges in monitoring, discrimination, and management of induced seismicity related to underground industrial activities: A European perspective. Rev. Geophys. 55 (2), 310–340. doi:10.1002/2016rg000542
Gutenberg, B., and Richter, C. F. (1942). Earthquake magnitude, intensity, energy, and acceleration. Bull. Seismol. Soc. Am. 32 (3), 163–191. doi:10.1785/bssa0320030163
Hardebeck, J. L. (2006). Homogeneity of small-scale earthquake faulting, stress, and fault strength. Bull. Seismol. Soc. Am. 96 (5), 1675–1688. doi:10.1785/0120050257
Hauksson, E., and Shearer, P. (2005). Southern California hypocenter relocation with waveform cross-correlation, part 1: Results using the double-difference method. Bull. Seismol. Soc. Am. 95 (3), 896–903. doi:10.1785/0120040167
Heimann, S., Kriegerowski, M., Isken, M., Cesca, S., Daout, S., Grigoli, F., et al. (2017). Pyrocko - an open-source seismology toolbox and library. Potsdam: GFZ Data Services. doi:10.5880/GFZ.2.1.2017.001
Kisslinger, C., and Engdahl, E. R. (1973). The interpretation of the Wadati diagram with relaxed assumptions. Bull. Seismol. Soc. Am. 63 (5), 1723–1736.
Li, L., Tan, J., Wood, D. A., Zhao, Z., Becker, D., Lyu, Q., et al. (2019). A review of the current status of induced seismicity monitoring for hydraulic fracturing in unconventional tight oil and gas reservoirs. Fuel 242, 195–210. doi:10.1016/j.fuel.2019.01.026
Lin, G., Shearer, P. M., and Hauksson, E. (2007). Applying a three-dimensional velocity model, waveform cross correlation, and cluster analysis to locate southern California seismicity from 1981 to 2005. J. Geophys. Res. Solid Earth 112 (B12), B12309. doi:10.1029/2007jb004986
Lomax, A., and Savvaidis, A. (2019). Improving absolute earthquake location in west Texas using probabilistic, proxy ground-truth station corrections. J. Geophys. Res. Solid Earth 124 (11), 11447–11465. doi:10.1029/2019jb017727
Lomax, A., Virieux, J., Volant, P., and Berge-Thierry, C. (2000). “Probabilistic earthquake location in 3D and layered models: Introduction of a metropolis-gibbs method and comparison with linear locations,” in Advances in seismic event location. Editors C. H. Thurber, and N. Rabinowitz (Amsterdam: Kluwer), 101–134.
Lucente, F. P., De Gori, P., Margheriti, L., Piccinini, D., Di Bona, M., Chiarabba, C., et al. (2010). Temporal variation of seismic velocity and anisotropy before the 2009 MW6.3 L'Aquila earthquake, Italy. Italy. Geol. 38 (11), 1015–1018. doi:10.1130/g31463.1
Maeda, S., Matsuzawa, T., Okada, T., Katao, H., Yoshida, T., Kosuga, M., et al. (2020). Spatiotemporal variations in the stress field in the northeasternmost part of the NE Japan arc: Constraints from microearthquakes. Earth, Planets Space 72 (1), 117–7. doi:10.1186/s40623-020-01245-8
Matsuta, N., Ikeda, Y., and Sato, H. (2004). The slip-rate along the northern Itoigawa-Shizuoka tectonic line active fault system, central Japan. Earth, Planets Space 56 (12), 1323–1330. doi:10.1186/bf03353357
Mousavi, S. M., Zhu, W., Sheng, Y., and Beroza, G. C. (2019). CRED: A deep residual network of convolutional and recurrent units for earthquake signal detection. Sci. Rep. 9 (1), 10267–10314. doi:10.1038/s41598-019-45748-1
National Research Institute for Earth Science and Disaster Resilience (2019). NIED hinet, national research institute for earth science and disaster resilience. Tsukuba-shi, Japan: NIED. doi:10.17598/Q17NIED.0003
Nazeri, S., Colombelli, S., and Zollo, A. (2019). Fast and accurate determination of earthquake moment, rupture length and stress release for the 2016–2017 Central Italy seismic sequence. Geophys. J. Int. 217 (2), 1425–1432. doi:10.1093/gji/ggz097
Obara, K., Kasahara, K., Hori, S., and Okada, Y. (2005). A densely distributed high-sensitivity seismograph network in Japan: Hi-net by national research institute for Earth science and disaster prevention. Rev. Sci. Instrum. 76 (2), 021301. doi:10.1063/1.1854197
Oye, V., and Roth, M. (2003). Automated seismic event location for hydrocarbon reservoirs. Comput. Geosci. 29 (7), 851–863. doi:10.1016/s0098-3004(03)00088-8
Panayotopoulos, Y., Hirata, N., Sato, H., Kato, A., Imanishi, K., Kuwahara, Y., et al. (2014). Investigating the role of the Itoigawa-Shizuoka tectonic line towards the evolution of the Northern Fossa Magna rift basin. Tectonophysics 615, 12–26. doi:10.1016/j.tecto.2013.12.014
Panayotopoulos, Y., Hirata, N., Hashima, A., Iwasaki, T., Sakai, S. I., and Sato, H. (2016). Seismological evidence of an active footwall shortcut thrust in the Northern Itoigawa–Shizuoka tectonic line derived by the aftershock sequence of the 2014 M 6.7 northern Nagano earthquake. Tectonophysics 679, 15–28. doi:10.1016/j.tecto.2016.04.019
Perol, T., Gharbi, M., and Denolle, M. (2018). Convolutional neural network for earthquake detection and location. Sci. Adv. 4 (2), e1700578. doi:10.1126/sciadv.1700578
Picozzi, M., Bindi, D., Brondi, P., Di Giacomo, D., Parolai, S., and Zollo, A. (2017). Rapid determination of P wave-based energy magnitude: Insights on source parameter scaling of the 2016 Central Italy earthquake sequence. Geophys. Res. Lett. 44 (9), 4036–4045. doi:10.1002/2017gl073228
Picozzi, M., Bindi, D., Spallarossa, D., Di Giacomo, D., and Zollo, A. (2018). A rapid response magnitude scale for timely assessment of the high frequency seismic radiation. Sci. Rep. 8 (1), 8562–8610. doi:10.1038/s41598-018-26938-9
Picozzi, M., Bindi, D., Zollo, A., Festa, G., and Spallarossa, D. (2019). Detecting long-lasting transients of earthquake activity on a fault system by monitoring apparent stress, ground motion and clustering. Sci. Rep. 9 (1), 16268–16311. doi:10.1038/s41598-019-52756-8
Podvin, P., and Lecomte, I. (1991). Finite difference computation of traveltimes in very contrasted velocity models: A massively parallel approach and its associated tools. Geophys. J. Int. 105 (1), 271–284. doi:10.1111/j.1365-246x.1991.tb03461.x
Poiata, N., Satriano, C., Vilotte, J. P., Bernard, P., and Obara, K. (2016). Multiband array detection and location of seismic sources recorded by dense seismic networks. Geophys. J. Int. 205 (3), 1548–1573. doi:10.1093/gji/ggw071
Prieto, G. A., Shearer, P. M., Vernon, F. L., and Kilb, D. (2004). Earthquake source scaling and self-similarity estimation from stacking P and S spectra. J. Geophys. Res. Solid Earth 109 (B8). doi:10.1029/2004jb003084
Ross, Z. E., and Ben-Zion, Y. (2014). Automatic picking of direct P, S seismic phases and fault zone head waves. Geophys. J. Int. 199 (1), 368–381. doi:10.1093/gji/ggu267
Sato, H., Iwasaki, T., Kawasaki, S., Ikeda, Y., Matsuta, N., Takeda, T., et al. (2004). Formation and shortening deformation of a back-arc rift basin revealed by deep seismic profiling, central Japan. Tectonophysics 388 (1-4), 47–58. doi:10.1016/j.tecto.2004.07.004
Scafidi, D., Spallarossa, D., Ferretti, G., Barani, S., Castello, B., and Margheriti, L. (2019). A complete automatic procedure to compile reliable seismic catalogs and travel-time and strong-motion parameters datasets. Seismol. Res. Lett. 90 (3), 1308–1317. doi:10.1785/0220180257
Scala, A., Adinolfi, G. M., Picozzi, M., Scotto di Uccio, F., Festa, G., De Landro, G., et al. (2022). Monitoring the microseismicity through a dense seismic array and a similarity search detection technique: application to the seismic monitoring of Collalto Gas-Storage, North Italy. Energies 15 (10), 3504. doi:10.3390/en15103504
Schorlemmer, D., and Wiemer, S. (2005). Microseismicity data forecast rupture area. Nature 434 (7037), 1086. doi:10.1038/4341086a
Shearer, P. M. (2002). Parallel fault strands at 9-km depth resolved on the Imperial fault, southern California. Geophys. Res. Lett. 29 (14), 19-1–19-4. doi:10.1029/2002gl015302
Spallarossa, D., Cattaneo, M., Scafidi, D., Michele, M., Chiaraluce, L., Segou, M., et al. (2021). An automatically generated high-resolution earthquake catalogue for the 2016–2017 Central Italy seismic sequence, including P and S phase arrival times. Geophys. J. Int. 225, 555–571. doi:10.1093/gji/ggaa604
Spallarossa, D., Picozzi, M., Scafidi, D., Morasca, P., Turino, C., and Bindi, D. (2021). The RAMONES service for rapid assessment of seismic moment and radiated energy in central Italy: Concepts, Capabilities, and future perspectives. Seismol. Res. Lett. 92, 1759–1772. doi:10.1785/0220200348
Stabile, T. A., Satriano, C., Orefice, A., Festa, G., and Zollo, A. (2012). Anatomy of a microearthquake sequence on an active normal fault. Sci. Rep. 2 (1), 410–417. doi:10.1038/srep00410
Syracuse, E. M., Thurber, C. H., Wolfe, C. J., Okubo, P. G., Foster, J. H., and Brooks, B. A. (2010). High-resolution locations of triggered earthquakes and tomographic imaging of Kilauea Volcano's south flank. J. Geophys. Res. Solid Earth 115 (B10), B10310. doi:10.1029/2010JB007554
Takeda, T., Sato, H., Iwasaki, T., Matsuta, N., Sakai, S. I., Iidaka, T., et al. (2004). Crustal structure in the northern Fossa Magna region, central Japan, modeled from refraction/wide-angle reflection data. Earth, Planets Space 56 (12), 1293–1299. doi:10.1186/bf03353353
Tarantino, S., Colombelli, S., Emolo, A., and Zollo, A. (2019). Quick determination of the earthquake focal mechanism from the azimuthal variation of the initial P-wave amplitude. Seismol. Res. Lett. 90 (4), 1642–1649. doi:10.1785/0220180290
Terakawa, T. (2017). Overpressurized fluids drive microseismic swarm activity around Mt. Ontake volcano, Japan. Earth, Planets Space 69 (1), 87–10. doi:10.1186/s40623-017-0671-x
Thurber, C. H., Atre, S. R., and Eberhart-Phillips, D. (1995). Three-dimensional Vp and Vp/Vs structure at Loma Prieta, California, from local earthquake tomography. Geophys. Res. Lett. 22 (22), 3079–3082. doi:10.1029/95gl03077
Tomic, J., Abercrombie, R. E., and Do Nascimento, A. F. (2009). Source parameters and rupture velocity of small M≤ 2.1 reservoir induced earthquakes. Geophys. J. Int. 179 (2), 1013–1023. doi:10.1111/j.1365-246X.2009.04233.x
Ueki, T. (2008). Plio-pleistocene behavior of the itoigawa–shizuoka tectonic line in northern Nagano prefecture, central Japan: Paleomagnetism of the omine-SK tephra. Bull. Earthq. Res. Inst. Univ. Tokyo 83, 163–173.
Ueno, S. (2002). Improvement of hypocenter determination method by Japan Meteorological Agency. Kenshinjiho 65, 123–134.
Verdon, J. P., Baptie, B. J., and Bommer, J. J. (2019). An improved framework for discriminating seismicity induced by industrial activities from natural earthquakes. Seismol. Res. Lett. 90 (4), 1592–1611. doi:10.1785/0220190030
Wadati, K., and Oki, S. (1933). On the travel time of earthquake waves. (Part II). J. Meteorol. Soc. Jpn. Ser. II 11 (1), 14–28. doi:10.2151/jmsj1923.11.1_14
Wiemer, S. (2001). A software package to analyze seismicity: ZMAP. Seismol. Res. Lett. 72 (3), 373–382. doi:10.1785/gssrl.72.3.373
Yoon, C. E., O’Reilly, O., Bergen, K. J., and Beroza, G. C. (2015). Earthquake detection through computationally efficient similarity search. Sci. Adv. 1 (11), e1501057. doi:10.1126/sciadv.1501057
Yukutake, Y., Ito, H., Honda, R., Harada, M., Tanada, T., and Yoshida, A. (2011). Fluid-induced swarm earthquake sequence revealed by precisely determined hypocenters and focal mechanisms in the 2009 activity at Hakone volcano, Japan. J. Geophys. Res. Solid Earth 116 (B4), B04308. doi:10.1029/2010JB008036
Zollo, A., Orefice, A., and Convertito, V. (2014). Source parameter scaling and radiation efficiency of microearthquakes along the Irpinia fault zone in southern Apennines, Italy. J. Geophys. Res. Solid Earth 119 (4), 3256–3275. doi:10.1002/2013JB010116
Keywords: seismic monitoring, micro-seismicity, earthquake detection and location, source parameter, seismic network, computational platform, Nagano, Japan
Citation: Adinolfi GM, De Landro G, Picozzi M, Carotenuto F, Caruso A, Nazeri S, Colombelli S, Tarantino S, Muzellec T, Emolo A, Zollo A, Orefice A, Ulivieri B, Calcagni D and Piantanida M (2023) Comprehensive study of micro-seismicity by using an automatic monitoring platform. Front. Earth Sci. 11:1073684. doi: 10.3389/feart.2023.1073684
Received: 18 October 2022; Accepted: 13 March 2023;
Published: 27 March 2023.
Edited by:
Eleftheria Papadimitriou, Aristotle University of Thessaloniki, GreeceReviewed by:
Mircea Radulian, National Institute for Earth Physics, RomaniaCopyright © 2023 Adinolfi, De Landro, Picozzi, Carotenuto, Caruso, Nazeri, Colombelli, Tarantino, Muzellec, Emolo, Zollo, Orefice, Ulivieri, Calcagni and Piantanida. This is an open-access article distributed under the terms of the Creative Commons Attribution License (CC BY). The use, distribution or reproduction in other forums is permitted, provided the original author(s) and the copyright owner(s) are credited and that the original publication in this journal is cited, in accordance with accepted academic practice. No use, distribution or reproduction is permitted which does not comply with these terms.
*Correspondence: G. M. Adinolfi, Z3VpZG9tYXJpYS5hZGlub2xmaUB1bml0by5pdA==
Disclaimer: All claims expressed in this article are solely those of the authors and do not necessarily represent those of their affiliated organizations, or those of the publisher, the editors and the reviewers. Any product that may be evaluated in this article or claim that may be made by its manufacturer is not guaranteed or endorsed by the publisher.
Research integrity at Frontiers
Learn more about the work of our research integrity team to safeguard the quality of each article we publish.