 Yongxiang Shi1,2
 Marco Ballesio2
 Kasper Johansen2Daniel Trentman2
 Yunsong Huang2
 Matthew F. McCabe2
 Ronald Bruhn3Gerard Schuster2,3*
- 1School of Earth and Space Science, Peking University, Beijing, China
- 2King Abdullah University of Science and Technology, Thuwal, Makkah, Saudi Arabia
- 3Geology and Geophysics Department, University of Utah, Salt LakeCity, UT, United States
Introduction: Cracks are a key feature that determines the structural integrity of rocks, and their angular distribution can be used to determine the local or regional stress patterns. The temporal growth of cracks can be monitored in order to predict impending failures of materials or structures such as a weakened dam. Thus, cracks and their spatial-temporal distributions should be automatically monitored for assessing their structural integrity, the associated stress patterns and their potential for failure.
Method: We show that the U-Net convolutional neural network, semantic segmentation and transfer learning can be used to accurately detect cracks in drone photos of sedimentary massifs. In this case, the crack distributions are used to assess the safest areas for tunnel excavation. Compared to the coarse performance of ridge detection, the U-Net accuracy in identifying cracks in images can be as high as 98% when evaluated against human identification, which is sufficient for assessing the general crack properties of the rock faces for the engineering project.
Result: Based on approximately 100 h of manual cracks labeling in 127 drone photos and 20 h of network training, the U-Net was able to successfully detect cracks in 23,845 high-resolution photographs in less than 22 h using two Nvidia V100 GPUs. Meanwhile, the network was able to detect more than 80% of the observable cracks of a volcanic outcrop in Idaho without additional training. With a modest amount of extra labeling on photos of the volcanic outcrop and transfer training, we found that the accuracy significantly improved. The surprising outcome of this research is that the U-Net crack detector laboriously trained on photos of sedimentary rocks can also be effectively applied to photos of volcanic rock faces. This can be important for real-time assessment of geological hazards and lithology information for dam inspection and planetary exploration by autonomous vehicles. For another application, we accurately detected fractures and faults with a scale of tens of kilometers from Martian photographs.
Conclusions: In summary, our methodology of using CNN with transfer training suggests that it can be used as a semi-universal detector of cracks in across a range of diverse geological settings.
1 Introduction
1.1 Crack detection and deep learning
All solids weaken over time and develop a reduction in their mechanical strength. A sign of this weakness is the development of cracks, a quasi-linear physical separation of material on the surface and in the interior of a solid. For siting buildings on a rock foundation (Wyllie, 1999), assessing dam hazards (Herbert, 2011), avoiding drilling hazards or for mining excavation (Dyskin and Germanovich, 1993), it is critical to assess the density and distribution of fractures in the rock mass. To aid in this task, thousands of aerial photos of a rock area can easily be obtained by cameras mounted on Unmanned Aerial Vehicles (UAVs). As introduced in (Bemis et al., 2014) and (Vasuki et al., 2014), UAVs can be programmed to photograph an area of interest to a centimeter accuracy, no matter how large the rock mass. Then, methods from photogrammetry can create a mosaic of these images and merge them with real topograhy (Mikhail et al., 2001).
In tradition, surface cracks were labeled by experts and their distribution was cataloged (Sanderson et al., 2019) to give engineers an estimate of the integrity and stability of the rock mass (Aydan et al., 2014). However, if there are thousands of images then the manual interpretation of cracks is both time consuming and error prone because of variable lighting, shadows, non-crack erosional features, rock spall, and complex rock surfaces. In addition, the accuracy of manual crack interpretation depends on the expertise of the interpreter, and the interpretation criteria (Hillier et al., 2015); (Sander et al., 1997). Therefore, there is a growing demand to develop tools that can automatically detect and catalogue cracks in a more efficient and accurate way.
Because the shape of cracks is long and narrow, many crack detection methods are based on edge-detection algorithms. For example (Pereira and Pereira, 2015), successfully applied edge-detection algorithms to UAV photographs to detect cracks in building structures. Their algorithm applied Sobel operator (Sobel, 1990) and particle filters (Thrun, 2002) for detecting cracks in building facades. For fractured outcrop images, Prabhakaran et al. (2019) used the complex shearlet transform to automatically extract fracture ridge realizations from images. After getting the features of ridges, post-processing image analysis algorithms were then used to vectorize the fracture traces in an automated manner. The resulting fracture detection maps are generally consistent with the human-labeled fractures in photos taken over a geological outcrop in Parmelan, France.
One problem with an image processing approach is that it cannot easily distinguish abrupt changes in a photo’s intensity caused by, for example, a skyline in a photo (Mohan and Poobal, 2018). This type of noise is easily distinguished by an interpreter, but manual detection is labor intensive when thousands of photos must be analyzed. To incorporate humans into the automated decision process, convolutional neural network (CNN) architectures were introduced to detect cracks. In the earliest applications, a variety of CNN networks including AlexNet (Dorafshan et al., 2018) and VGG16 (WilsonLeal da Silva and de Lucena, 2018) were used to detect cracks in concrete structures (Kim and Cho, 2018); (Cao and Anh, 2019). Their limitation is that they are inefficient for high-resolution semantic segmentation, which is the task of classifying all pixels in the input image. Such CNN methods cannot localize cracks at the pixel level. In the work of (Cha et al., 2017), a method based on CNN can only locate cracks in a box which has the same size as the CNN’s input samples. Sufficiently large samples are required by this CNN to ensure its accuracy, which limits its resolution.
Developed from previous CNN architectures, the standard U-Net CNN (Ronneberger et al., 2015) mitigates the main flaw by classifying each pixel in the input image with a very high precision. As a convolutional neural network, U-Net can provide a high accuracy and excellent resolution for semantic segmentation. This is because the U-Net is a deep network with short-connections between the encoder and decoder structure to enable an accurate semantic segmentation: the short connections ease information propagation in training and compensate details for high level semantic features (Zhang et al., 2018). This high-level accuracy makes the U-Net architecture favored by medical personnel for analyzing MRI, CT, and ultrasound scans (Zhou et al., 2018); (Han and Ye, 2018); (Yang et al., 2019a); (Yap et al., 2017); (Behboodi and Hassan, 2019) and signal denoising (Sun et al., 2020); (Xiong et al., 2022). In addition, the high resolution of U-Net has been successfully used for crack detection in concrete structures (Cheng et al., 2018); (Liu et al., 2019); (Li et al., 2020). For scenes with a complex background, U-Net has been used to detect prominent features such as roads in images taken by satellites and performs better than traditional CNN methods (Constantin et al., 2018), (Yang et al., 2019b). The convolutional blocks in U-Net can be replaced with high-performing blocks with residual branches (Yang et al., 2019b) and short-connections can be modified by including several convolutional layers (Zou et al., 2021) to improve detection accuracy and resolution in complex backgrounds. In geophysics, U-Net architectures are used to identify faults in seismic images and delineate their 3D patterns (Wu et al., 2019), (Guitton, 2018). U-Net usually requires the support from powerful hardware because of the millions of parameters, so that it is limited in clusters rather than directly implemented on embedded devices.
1.2 Project background
Sandstones in the Middle East study area are cut by a NW-trending, roughly vertical set of long cracks that dissect the rocks, forming blocky massifs and elongated rock fins that are several tens to hundreds of meters wide, up to a kilometer or more in length and several tens of meters in height. NE-trending vertical cracks form a second but less prominent set of vertical cracks in the study area. Cliff faces or facades are marked by traces of both vertical and sub-horizontal cracks, with the latter aligned parallel to bedding. Discontinuous vertical cracks located within the rocks terminate at or near bedding surfaces suggesting that mechanical changes across bedding locally inhibited crack growth (Pollard and Aydin, 1988). Bedding-parallel cracks are relatively short, discontinuous features caused mostly by failure along bedding surfaces exposed in vertical facades. Consequently, failure along bedding surfaces should be anticipated in the design of underground excavations. This type of failure is common in crack (joint) bounded rock fins, where failure and collapse along bedding surfaces leads to the development of natural arches.
Large cracks, especially those longer than 1 m, pose a problem for engineers who must drill into portions of the sandstones. Prior to drilling, a strict safety assessment must be carried out to access the rock integrity. Mechanical integrity is related to the density and distribution of large cracks, where drilling into the massif with a high density of cracks must be avoided or extra precautions should be taken.
To quantitatively estimate the crack density, more than 23,000 drone photos were taken of the study area. Based on the success of the U-Net architecture, we now use it to detect cracks in photographs of rock faces. In our work, we add special convolutional modules which include residual shortcuts and two additional branches to better match crack orientations. More than 100 h were used to manually label large cracks in 127 high-resolution training images, which were then used to train the architecture. Applying the trained U-Net to new input images achieved an accuracy of 98%, which is sufficient to assess rock integrity prior to drilling into the massif. In addition we used transfer training to generalize the U-Net crack detector so it is applicable to different rock types.
We describe our results in four sections. Following the introduction, we present the methodology of our CNN procedure for crack detection. The workflow for training and testing of the U-Net is shown in Figure 1. After this, we describe the training of the network and present results from the validation set. The next section presents the numerical results of applying the trained U-Net to more than 23,000 unlabeled drone images of our survey area. To test the generalizability of the trained U-Net, we use it to detect cracks in photos of volcanic rocks near the Teton dam site in Idaho and do transfer learning and fine-tuning (Shin et al., 2016) to improve accuracy. Finally we test the trained U-Net model on lineaments in photos of Mars taken by a Mars orbiter. We draw conclusions in the last section.
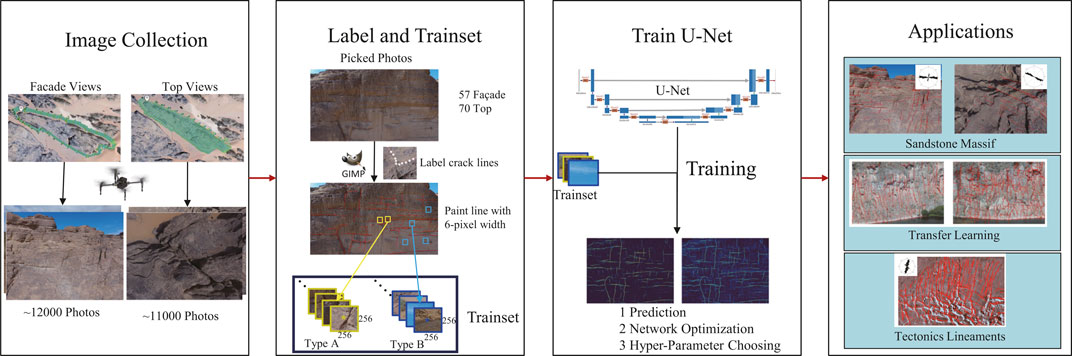
FIGURE 1. Workflow of the procedure for training and labeling of cracks in drone photos.
2 Network and loss function choosing
2.1 U-net architecture
To better match the reqiurements of crack detection, our U-Net is designed and different from standard U-Net. The U-Net architecture is diagrammed in Figure 2. It consists of a series of contracting encoders followed by expanding decoders weighted with features from the contraction path. In addition to the cross-connected paths, each convolution block implements an internal encoder/decoder with three convolution branches to enhance the detection of specific orientations of cracks. The convolution block forms the residual function to which an identity operation is added (He et al., 2016). The dimensions of the final U-Net output are the same as the input images but there is only one output channel of binary values to represent the probability of a pixel to be crack.
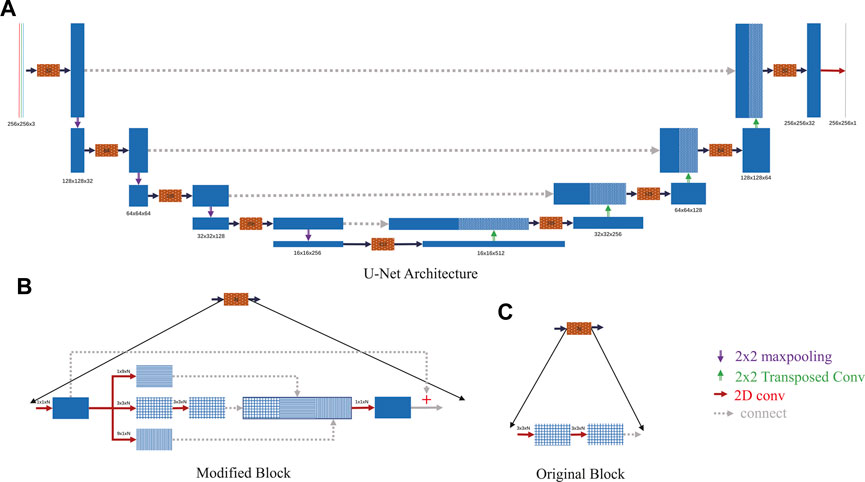
FIGURE 2. U-Net architecture used for detecting cracks in drone images. In (A) and (B) each arrowed tier represents a layer; the blue boxes represent features after the calculations from that layer. The input is a 256×256 RGB image. After five convolutional blocks (brown dotted block in a) and down-sampling (violet downside arrow), the feature map has the size 16×16. This is followed by up-sampling of features with transposed layers (green upside arrow), concatenation (gray dotted arrow) with the former output of the same size, and a final convolution. The final output size matches the 256×256 input to allow individual pixel classification of the input. Each convolutional block contains 6 separate convolutional layers (red dash arrow) with a final input identity operation (+) summed with the residual function block to form the desired output. (C) is the block of the original U-Net in (Ronneberger et al., 2015) in comparison with (B).
The U-Net design was chosen for the following reasons.
• Additional convolution branches: This idea comes from the Inception Network (Szegedy et al., 2016) because most of the cracks in our drone images are approximately horizontal or vertical. The two additional convolution branches with filter sizes 1×9 and 9×1 enable the efficient extraction of crack features by focusing on a specified dimension without the need for a square filter. A square filter with many parameters can detect a wide variation of crack orientations, but it is computationally inefficient if the cracks are confined to just a few orientations. This is a data specific enhancement.
• Residual function connection: In deep learning models, the convergence rate and accuracy can become degraded with an increase in the number of layers (He and Sun, 2015). Including a residual operation to each convolution block helps to improve accuracy in deep CNN models (He et al., 2016), (Zhang et al., 2018).
Our U-Net has 9 convolutional blocks, including 54 convolution layers, 4 maxpooling layers, and 4 transposed layers. For each convolution layer, we include batch normalization (Ioffe and Szegedy, 2015) and ReLU activation (Eckle and Schmidt-Hieber, 2019). Each convolution block is followed by a dropout layer with a rate of 0.5 (a random choice, half are dropped) for additional regularization. The final layer uses a sigmoid function to constrain the output of U-Net between 0 and 1.
The labeling targets are cracks that tend to form less than 1% of the entire set of images. Therefore, there is an imbalanced set of equations due to most labels having a label value of 0 (background). This typically leads to poor convergence and large errors in inference labeling. To overcome the imbalance problem, we test the performance of two weighted loss functions.
1. Weighted cross entropy (WCE) (Sousa Aurelio et al., 2019):
where y(i) is our assigned label for the ith example, p(i) is the U-Net prediction, and λ is a scalar chosen to improve performance.
2. Focal loss (FL) (Lin et al., 2017):
where we use the constant γ = 2.
WCE is a typical loss function used in classification problems where λ provides for a rebalancing of the possibly underrepresented positive pixels in the loss calculation. FL is used to address class imbalance by down-weighting the contribution of correctly identified pixels to focus on the loss due to misidentified pixels. We used a fixed value of γ = 2, varying only λ for all comparisons of each loss function. The FL formula reduces to the WCE formula when γ = 0. Our U-Net architecture is implemented using Keras 2.2.3 and Tensorflow-GPU 1.14.
2.2 Labeling, training and validation
Although the facade and top images have different crack features of the massifs, we only describe U-Net training of the facade images because the workflow is the same for the top images.
2.2.1 Labeling and picking of sub-samples
We select 57 photos from the facade view to be manually labeled for training and validation, which contain typical cracks examples. 54 photos are used for training and 3 are used for validation. The public-domain editing software GIMP (GNU Image Manipulation Program) is used to label the crack lines. We use the pen tool in GIMP to mark crack lines with many anchor points. Anchor points are required to locate the center of the crack along the normal direction to ensure the accuracy of labels. To convert labeled lines to pixels, we paint the line with a width of 6-pixels to closely match the crack size of interest. Image labeling is a time intensive task that is necessary for the training of the CNN. Labeling requires approximately 30–60 minutes per photo for a human, depending on the number of cracks. The size of each image is 4,000 × 3,000 or 4,000 × 2000 so that more than 100 hours (including labeling the 70 top images) are needed to manually label the photos for training and validation.
The biggest problem in labeling is defining what constitutes a crack of interest. In the drone photos, there is a large variation in the size of cracks and not all cracks are of interest. For these data, geologists and building-site engineers are only interested in identifying cracks longer than 1 m, which are long enough to indicate possible instability in the building. Soil and small-rock sections covering parts of cracks are not labeled, resulting in discontinuous crack labels. Another problem is the mixture of horizontal cracks and some special bedding contacts. Some bedding contacts are strongly eroded so that there are some troughs along bedding surfaces. It is challenging to discriminate them from cracks. So we could include some troughs into the “horizontal cracks” label.
There are two types of subimages selected from the labeled photos: subimages of type A contain labeled cracks (Figure 3A); type B subimages contain the background rock, sky, sand, and/or bare rocks, which are devoid of labeled cracks (Figure 3B). Some samples in type B includes items which complicate network training, including line-like shapes of rain traces, shadow edges, and trees. Although the U-Net output is a binary classification, identifying types for inclusion in training allows for selecting a good balance of cracks and non-cracks.
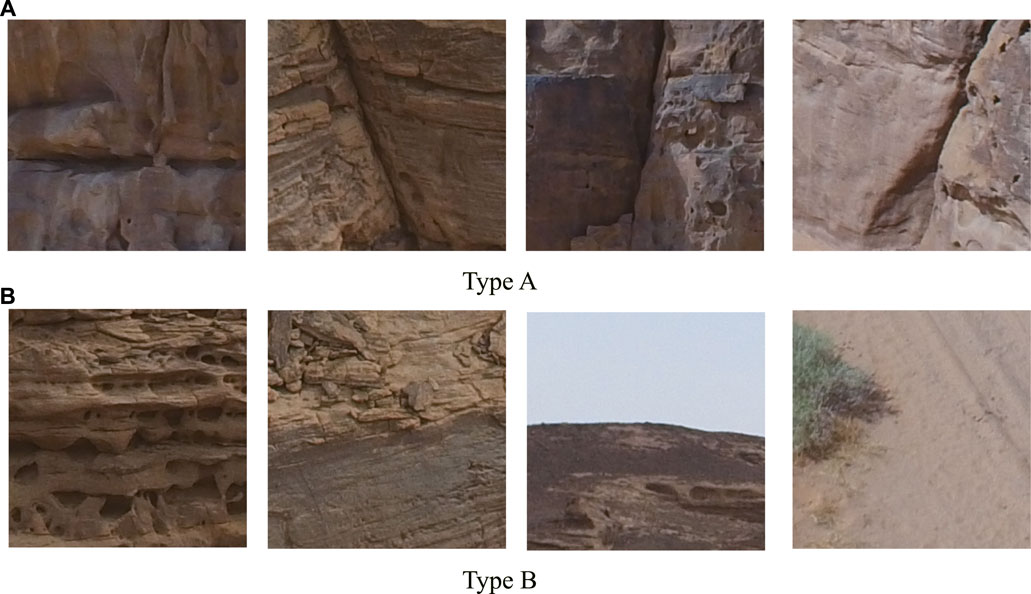
FIGURE 3. Different dataset samples. We use the two types of subimages to balance cracks in the dataset. (A) type A sub-samples that contain cracks; (B) type B sub-samples that only contain the background and some have confusing and crack-like features. The size of each sample image is 256 × 256.
For samples of type A, labels are indexed with small random shifts in the choice of index positions along the cracks to avoid cracks are always in the center of training samples. Type B subimages are randomly sampled. To reduce the bias of samples being too close to each other, a minimal spacing distance was set for center points of types A and B as 70 and 150 pixels, respectively. We select a count of 100 A types and 200 B types in each photo for balanced training.
2.2.2 Network training
Subsampling the 57 photos resulted in a training dataset consisting of 16,200 subimages and a validation dataset consisting of 900 subimages. The networks are trained using two Nvidia v100 GPU cards with a batch size of 20 and an initial learning rate of 0.001. The data are augmented in each batch of processed training samples by adding copies with horizontal, vertical, or 0°–45° rotation using a reflected sample to fill in the boundary space created by rotation. The data augmentation is performed within Keras.
The maximum number of epochs is set to 100 and training is stopped when either the maximum is reached or when loss in the validation set does not decrease for 30 epochs (Figure 4). Loss values in both the training and validation sets do not decrease after around epoch number 50, so training is terminated at epoch 80. Our modified U-Net provides lower loss values for both the training and validation sets, compared to the standard U-Net architecture in Figure 2C.
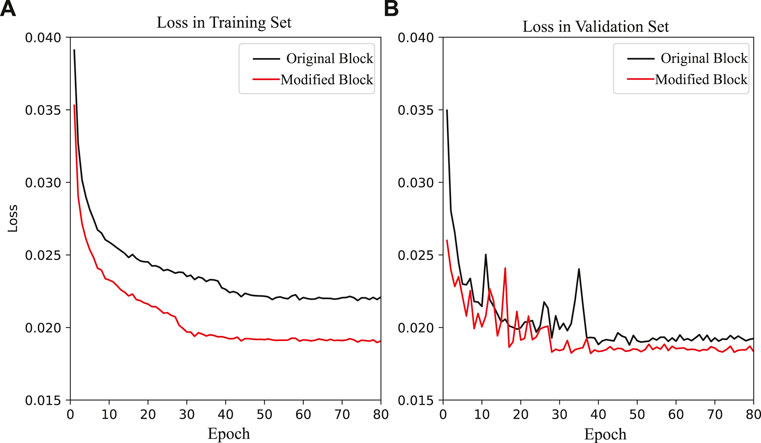
FIGURE 4. Learning curves for the training data. (A,B) show the loss values in training set and validation set. The loss function uses WCE and λ = 0.85. Displayed two lines show results of U-Net with original and modified blocks in Figure 2.
2.2.3 Validation and confusion matries after skeletonization
We used two loss functions and a range of λ values to train the U-Net. After trial-and-error tests, an output value threshold of 0.5 is used for all pixels in the U-Net for classification as either a crack or background. Cracks in the output are marked as red in the figures. For comparison with the U-Net, the automatic fracture detection (AFD) code in (Prabhakaran et al., 2019) is used as a ridge-detection method for the validation images. We used typical 108 shearlet systems with a threshold of 0.52 for AFD.
The confusion matrix is necessary to evaluate the performance of the U-Net for different parameter values. To normalize the crack widths, we skeletonize the labeled and predicted cracks to be a same width of one pixel (Zhang and Suen, 1984), (van der Walt et al., 2014). After skeletonization, the labeled crack is only 1 pixel wide. Table 1 compares the ground-truth labels with the predicted ones using TP, FP and FN values. The identification accuracy is 98% but the P and R parameters usually are the most important ones for comparison purposes.
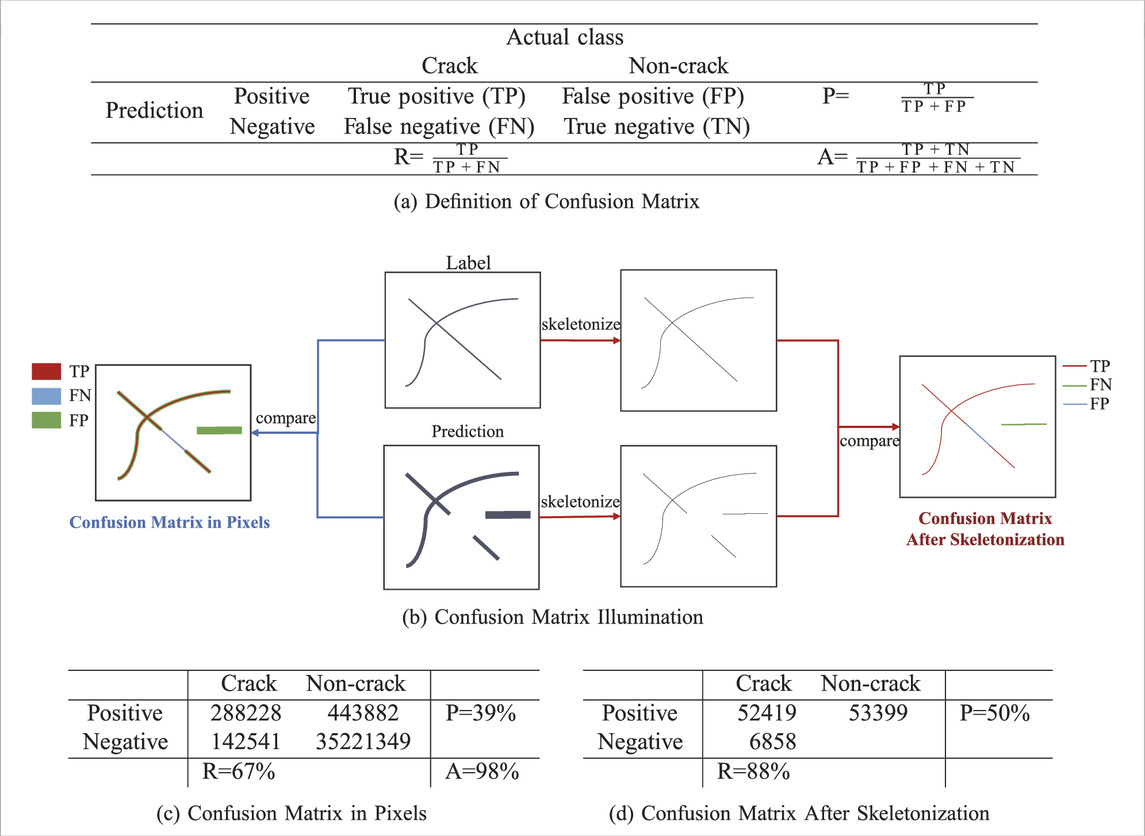
TABLE 1. Confusion matrix definition and results for the validation images. a) is the definition of the confusion matrix and related values: recall (R), precision (P) and accuracy (A). b) is the workflow to get the matrix both in pixels and after skeletonization. The values in c) and d) are examples from results of validation photos in which U-Net uses WCE and λ = 0.85.
As shown in Figures 5, 6, λ is the key parameter which controls the performance of the U-Net. With an increase in the value of λ, the U-Net tends to be more aggressive in labelling more pixels as cracks, which increases the average width and recall values while the precision values goes down. Therefore, the choice of λ is important for balancing the precision and recall values. The underestimation of crack density can lead to safety problems, so that high FP counts are more acceptable than missing cracks of interest. We select λ = 0.85 to reduce the high number of FP counts associated with large values of λ.
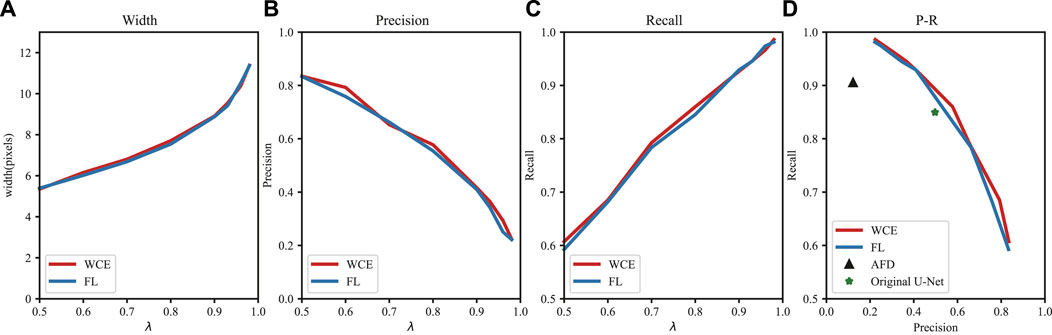
FIGURE 5. Perfomance metrics of the modified U-Net plotted against epoch number for the training data. We set eight λ from 0.5 to 0.98 in the loss functions and display the average width, precision, recall of predictions in (A–C). The P and R values are calculated by the confusion matrix after skeletonization. In (D), the relationship between P and R is for both the standard and modified U-Net architectures, and we add the performances of AFD method as comparison.
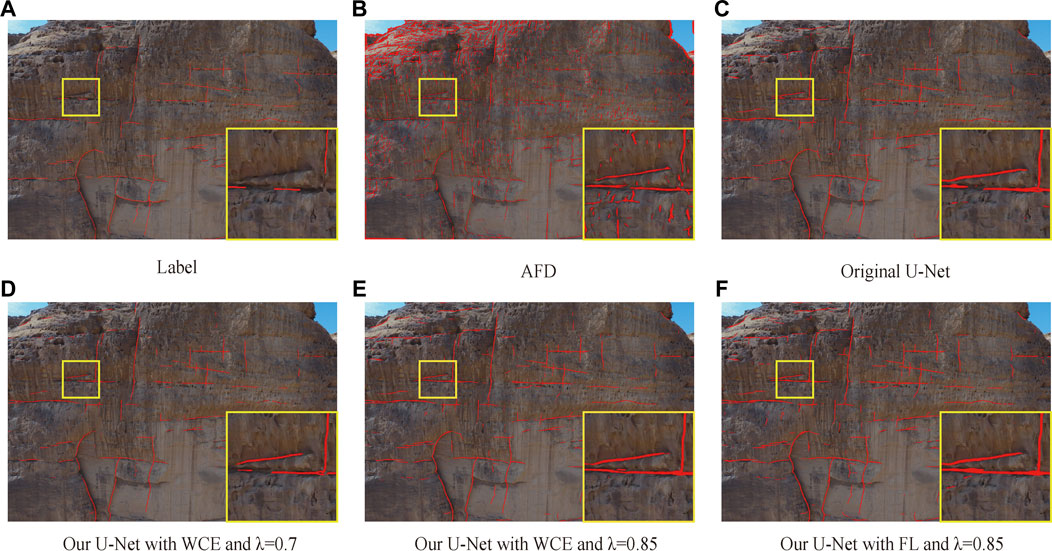
FIGURE 6. Results of different algorithms applied to two validation images. Photos are 4,000×3,000 pixels each. Cracks marked in red color overlie on raw photos. Human labeled images are shown in (A) and we only label those that we are quite confident about; (B) is calculated by automatic fracture detection (AFD) in (Prabhakaran et al., 2019); (C–E) are trained with weighted cross entropy (WCE) using different values of λ; (F) focal loss (FL) shows output from one value of λ.
Figure 6B displays the result from the AFD code. The result of AFD shows many false positives caused by sharp changes in intensity associated with non-crack features and it omitted some labeled cracks. Also, the P-R result in Figure 6D shows a quite low precision value and a modest recall compared to the U-Net. The result of the original U-Net is shown in Figure 6E. It correlates well with the human labelled result. However, the P-R values of the original U-Net are less than these of the modified U-Net, which indicates the superiority of the modified U-Net.
The results with using the U-Net with WCE and FL are shown in Figures 6E, F. However, the P-R line of FL is always below that of WCE in Figure 5D. Figure 7 shows that the output of WCE more clearly highlights large cracks of interest compared to FL. Given the limited values used for comparison, WCE is a better choice for our work.
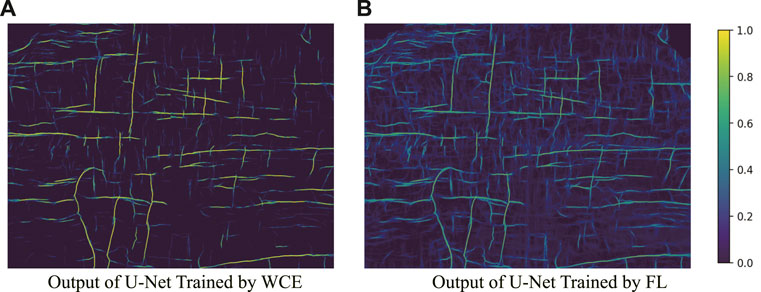
FIGURE 7. U-Net predictions of the image in Figure8. Here, (A) is the raw output from the U-Net with WCE as the loss function and (B) is the raw output from the U-Net with FL as the loss function. The two kinds of loss functions share the same λ =0.85 value. We use the sigmoid as the activation function in the last layer so when a value of the U-Net output is closer to 1, it is more likely to be a crack.
3 U-net crack detection in three geological bodies
The trained U-Net is now used to label cracks in the study area with the large sandstone massifs. Over 23,000 unlabeled photos of the sandstone massif are taken by a drone with a high-resolution camera. In addition, the trained U-Net is used to label cracks in photos of volcanic rocks in Idaho as well as those in Martian orbiter pictures. These last two examples were used to show that the U-Net trained on photos of sandstone cracks can also be used to label the cracks in photos of rocks with a different geological genesis. We also show that the accuracy of the U-Net crack detection can be improved by transfer learning.
3.1 Labeling of cracks in photos of sandstone massifs
A drone was flown over the sandstone massifs and recorded 23,845 photos of the tops and facades (sides) of the target rock masses. The paths of drone flights are optimized for achieving a uniform image resolution, where variations in camera-to-target distances created pixels approximately 0.8–10 cm wide. However, most have a spatial resolution of several centimeters, which ensures that the U-Net is not troubled by varying crack widths due to the drone being at significantly different distances from the rock face. The pixel dimensions of the photos range from are 4,000 × 2000 to 4,000 × 3,000 pixels with about 80% overlap of areas.
Our U-Net does not have any fully connected layers so its input size can be variable. We were limited by the amount of GPU memory, so we partitioned each photo into 4 small sub-photos, each with half the width and height of the original. Partitioning is shown by the green lines in Figure 1. The U-Net labeling of each photo takes about 3 s per GPU card.
Then the U-Net model trained was applied to the unlabeled facade images. As shown in Figures 8A, B, the U-Net results for unlabeled images are judged to be of acceptable accuracy. The orientation distribution in Figure 8C shows that most cracks in this photo are horizontal but there are some along 70°. We then applied the same method and trained a new U-Net for the top images, where we labeled 70 images which created a dataset with 16,800 subimages. Figures 8D, E shows a processed top image, showing results as accurate as those produced for the facade images. Figure 8F shows all cracks have the same orientation angle of about 150°, which is consistent with the cracks seen in Figure 8D. The U-Net labeling of the all images (facade and top) required approximately 22 GPU hours to finish. The labeled images were then used to assess the crack densities and orientations in the areas of engineering interest.
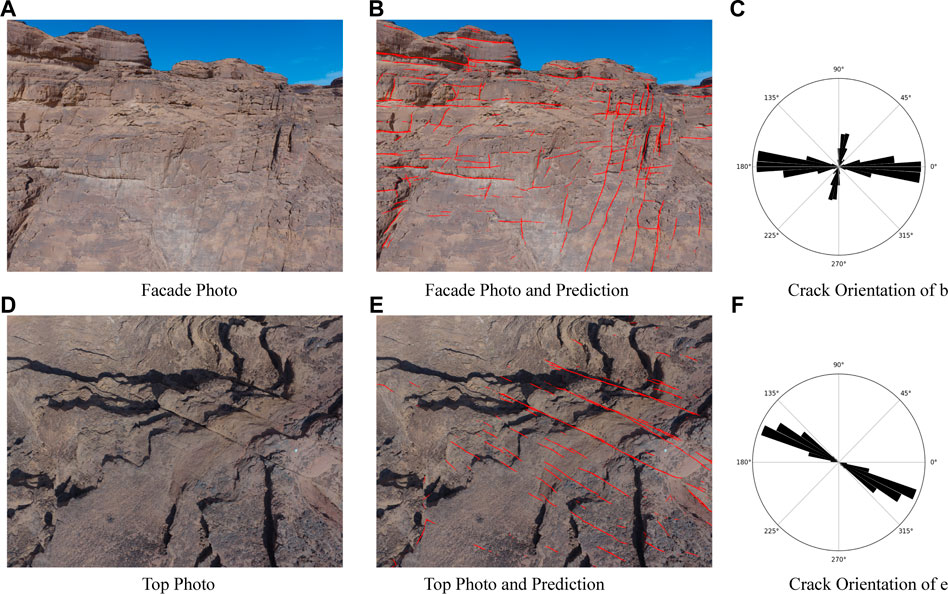
FIGURE 8. Photos labeled by U-Net from unlabeled photos. We picked two example images from the out-of-the training set. (A,B) depict a facade view; (D,E) are a top view. (C,F) are their distributions of crack orientations and densities.
3.2 Labeling of cracks in photos of volcanic rocks and transfer learning
After achieving accurate detection of cracks in the sandstone photos, we apply the sandstone U-Net1 to photos of volcanic rock faces at the Dam site in Idaho, United States. The Teton Dam in eastern Idaho failed catastrophically on the morning of 5 June 1976, causing a large flood. The dam is built on silica-rich volcanics (welded tuff) that were derived by the eruption of the Yellowstone super-volcano. Investigations suggest the failure of the dam was related to movement of water through large fractures (cracks) in the bedrock foundation.
Figure 9A depicts a 4,000 × 2000 picture from http://gigapan.com/gigapans/163482, which is the cliffs at the Teton Dam site. Mapping the cracks in the Teton Dam photo tests the ability of the sandstone U-Net to accurately delineate cracks in photos of volcanic rocks. The nearly vertical cracks are cooling joints in welded volcanic tuff. The nearly vertical cracks mapped by our sandstone U-Net are labeled by the red lines in Figure 9B, where many cracks are correctly labeled. However, some cracks are not labeled even though they are visible to the eye and there are some false positives. This demonstrates that the sandstone U-Net algorithm is capable of mapping the trends in crack orientations of rocks that are different from those from which it was trained.
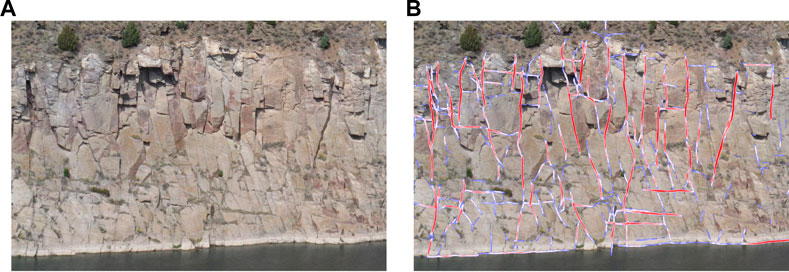
FIGURE 9. Crack detection of volcanic rocks at the Teton Dam Site, Idaho. (A): near-vertical cooling cracks in volcanic rocks just downstream from the dam site; (B): cracks labeled in red by U-Net. The red markings correspond to a probability between 0.7 and 1.0 in the softmax output, while the white-bluish markings correspond to a probability between 0.3 and slightly less than 0.7.
We can improve the accuracy of the sandstone U-Net model by using transfer learning. This method has been applied on pavement distress detection in (Gopalakrishnan et al., 2017), which uses a pre-trained VGG-16 to construct their CNN. In our work, transfer learning combines the weights learned from the sandstone images as well as those learned from a small number of labeled cracks from the Teton dam photos. It only requires a small number of labeled images from the photos of volcanic rock faces because it reuses common crack patterns from the sandstone U-Net. This can result in significantly less labeling and computation time compared to standard CNN training. For relabeling, we used another 4,000 × 2000 photo of the Gigapan image, manually labeled the cracks and broke it up into 120 256×256 sub-photos. The transfer learning required less than 60 min compared to an estimate of more than 20 h to train a new U-Net model.
For the transfer learning, we freeze the weights in blocks from 3 to 7 and allow four symmetric blocks (block 1,2 and 8,9 in Figure 2) to be trained on the newly labeled photos, which is called as in fine-tune (Shao et al., 2018). This decreases the trainable parameters from 20,000,000 to 730,000. An Adam optimizer is used and we set the learning rate to be 10–4 in order to fine-tune the trainable layers. The batch size is 5 and the total number of 256 × 256 sub-photos is 120. The transfer training is halted at epoch 30 which takes no more than 20 minutes of computation time on a Nvidia v100 GPU. We denote this U-Net as the hybrid U-Net model because the original weights were trained on images of sandstones and adjusted to those for volcanic rocks.
After transfer learning, the sandstone U-Net and hybrid U-Net were applied to the raw 4,000 × 2000 images in Figure 10A to give the labeled cracks in Figures 10B, C, respectively. Figure 10C show a much denser and more accurate collection of labeled cracks than the ones in Figure 10B. The important accomplishment is that it required no more than an hour of manual labeling to achieve this goal.
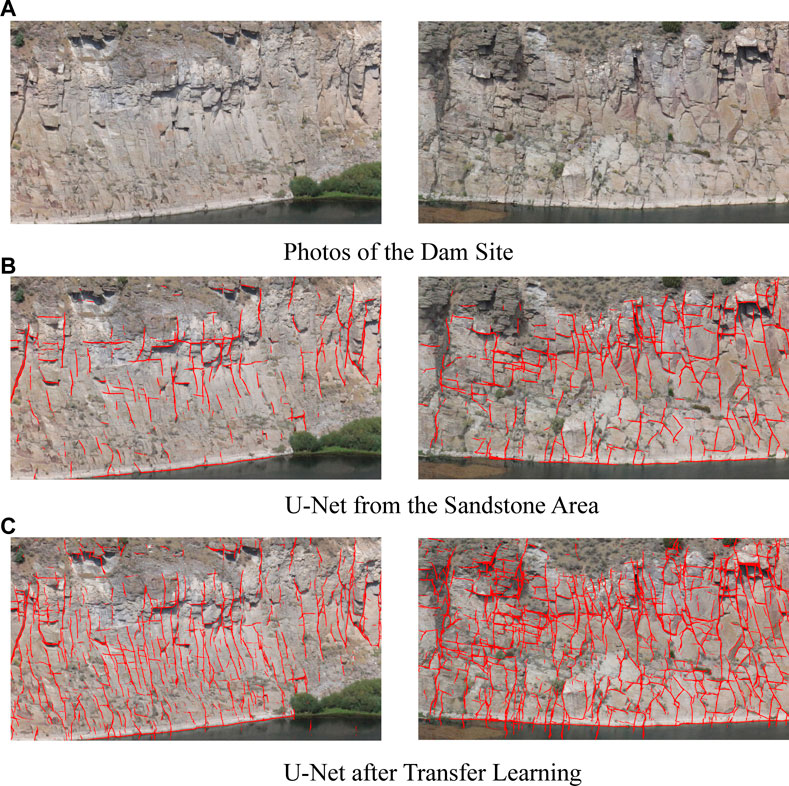
FIGURE 10. (A) Raw photos from the Teton dam site, and crack labels computed by the (B) sandstone U-Net and the (C) hybrid U-Net models. Red labels have a sigmoid probability between 0.5 and 1.0.
3.3 Labeling of photos of martian Nocti Labyrinthus
We notice that the U-Net detector is effective at detecting lineaments in photos, where such lineaments might be associated with large-scale tectonics. Therefore we apply the U-Net crack detector to photos of the surface of Mars taken by the Viking orbiter. Figure 11A depicts the region known as Nocti Labyrinthus, an area of rift basins and grabens (Daniel and Cook, 2003).
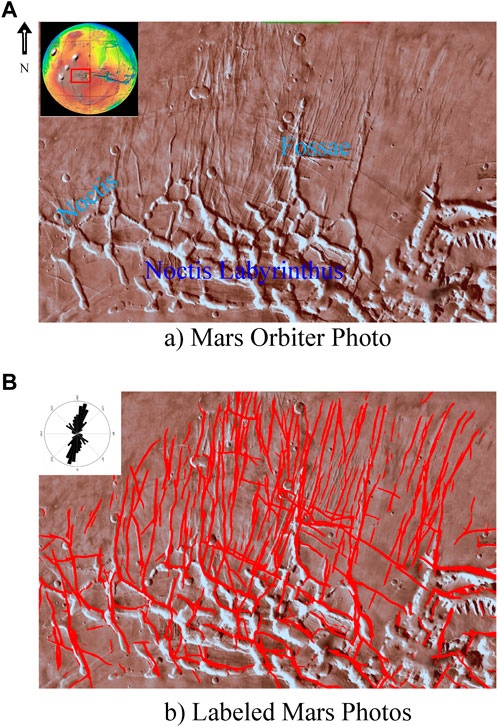
FIGURE 11. (A) Photo taken by a martian orbitor and (B) the labeled photo. The crack distribution is depicted in the inset Rose diagram of (B), and the labels are computed by the sandstone U-Net. In this example, a crack is defined as a sharp linear change in the photo’s intensity value.
Figure 11A depicts the original photo and Figure 11B shows the photo after labeling by the trained U-Net. Many of the lineaments seen in Figure 11A are clearly labeled in Figure 11B. Some of the subtle lineaments not easily detected in 13a are now delineated in the labeled image. Many of these lineaments are interpreted as grabens and fossae (Daniel and Cook, 2003). The Rose diagram here reveals the trends in their orientations, where the graben distribution is related to the ambient extensional stress field associated with local volcanic rifting.
4 Discussion
The sandstone U-Net Keras code and the trained weights will be available to the public by the public-domain site cited in the data availability statement. Part of this code will have the capability for transfer learning. We expect a number of practical applications for this crack detection code.
1. Semi-universal Cracks Detector for Cracks in Rock Faces. The U-Net trained on photos of a sandstone massif shows a precise detection of sandstone cracks and acceptable results for volcanic rocks. With a modest amount of extra labeling and transfer training we believe this U-Net can be a semi-universal detector of cracks in many types of rock faces. It can also be used to automatically detect large-scale lineaments in photos taken by planetary orbiters as a reconnaissance of a planet’s or Moon’s tectonics.
2. Real-Time Monitoring of Crack Development. The U-Net crack detector can be used as a real-time monitor of growing cracks if the photos are periodically taken and quickly analyzed for crack growth. One application with satellite photos of polar regions is to automatically detect the growth of crevasses and cracks in the ice, which would be a real-time monitor of climate changes. Other applications of real-time monitoring of crack growth include hazard assessment of failing dams, imminent landslides, and erupting volcanoes, which has some similarities with surface displacements monitoring by frequent InSAR recordings in (Sun et al., 2020).
There are some notable areas where our workflow can be improved. Foremost is to increase the efficiency of labeling. The pre-trained U-Net produces some FP and FN crack labels, which should be removed by manual labeling. Another complication is that close-up photos of the rock degrades the U-Net model in distinguishing erosional features from small cracks. The consequence is that it produces false positives. We believe this problem can be mitigated by also introducing distance information into the input of the U-Net. This distance information can be included with the use of lidar or radar instruments in the drone.
5 Conclusion
This work presents a successful use of an U-Net CNN to label cracks in rock faces. We compare U-Net with a ridge-detection method (AFD) and find that the U-Net trained with just a few images provides a more accurate detection of cracks. Our results shows that the U-Net approach provides a viable alternative to the conventional AFD method for detecting cracks in rock massifs. Besides, we find that the U-Net with residual shortcuts and additional convolutional branches shows a better accuracy than the original U-Net. And the performance of the U-Net is largely controlled by the value of the λ weight in the loss function. We think the reason is that rock cracks often have a narrow linear shape containing only a limited number of pixels, which has to be balanced by weighted loss. Considering the location of cracks is the key feature for engineers, an improvement may be to identify the location of cracks by anchor points, which represents important future work of ours.
One disadvantage of U-Net is that it has millions of parameters and requires a large amount of manual labeling to train the network. However, U-Net has transferability capabilities so that a well-trained U-Net with transfer training can be used to detect cracks on other kinds of rocks without an extensive effort in relabeling. We proved this to be true by using transfer training to significantly improve the accuracy of labeling cracks in the Teton Dam photos. Less than 60 minutes were required for manual labeling of cracks in fewer Teton Dam photos. Moreover, the sandstone U-Net could delineate some line-like geology features in Mars photos.
In summary, our results suggest that our trained U-Net with transfer training is a semi-universal detector of cracks in images of almost any type of geological outcrop. The scale of cracks can range from centimeters to kilometers which depends on the resolution characteristics of the photographs. Practical applications of this method include the use of crack detection for real-time monitoring of crack growth, such as needed for safety assessment of dams, landslides, volcanoes and man-made structures.
Data availability statement
Our Python code, well-trained weights and all labelled images are be made available on Colab (colab.research.google.com/drive/1n7K1esyM_FmWb-6ZwT8eGWxylOk4xoOp) to the public to be used as a crack or lineament detector for images of many geological outcrops.
Author contributions
YS: propose, build, and train the networks, check result and improve accuracy, label data MB: train the networks, check result and improve accuracy KJ: collect and offer drone data, check result and improve accuracy, offer standard of cracks DT: label data, offer standard of cracks YH: label data, offer suggestions to the paper MM: offer drone data, offer suggestions to the paper RB: offer suggestions to cracks, offer cracks photos of volanic rocks GS: check result and improve accuracy, main proposer of the project.
Funding
The research reported in this publication was supported by the King Abdullah University of Science and Technology (KAUST) in Thuwal, Saudi Arabia. For computer time, this research used the resources of the Supercomputing Laboratory at KAUST and the IT Research Computing Group. We thank them for providing the computational resources required for carrying out this work.
Acknowledgments
We thank the great help in reviews from Prof. Ning Jieyuan in Peking University and valuable suggestions from reviewers.
Conflict of interest
The authors declare that the research was conducted in the absence of any commercial or financial relationships that could be construed as a potential conflict of interest.
Publisher’s note
All claims expressed in this article are solely those of the authors and do not necessarily represent those of their affiliated organizations, or those of the publisher, the editors and the reviewers. Any product that may be evaluated in this article, or claim that may be made by its manufacturer, is not guaranteed or endorsed by the publisher.
Footnotes
1The sandstone U-Net model is exclusively trained from the sandstone pictures on facade.
References
Aydan, Ö., Ulusay, R., and Tokashiki, N. (2014). A new rock mass quality rating system: Rock mass quality rating (RMQR) and its application to the estimation of geomechanical characteristics of rock masses. Rock Mech. rock Eng. 47 (4), 1255–1276. doi:10.1007/s00603-013-0462-z
Behboodi, B., and Hassan, R. (2019). “Ultrasound segmentation using U-net: Learning from simulated data and testing on real data,” in 2019 41st Annual International Conference of the IEEE Engineering in Medicine and Biology Society (EMBC) (IEEE), 6628–6631.
Bemis, S P., Micklethwaite, S., Turner, D., James, M R., Akciz, S., Thiele, S T., et al. (2014). Ground-based and uav-based photogrammetry: A multi-scale, high-resolution mapping tool for structural geology and paleoseismology. J. Struct. Geol. 69, 163–178. doi:10.1016/j.jsg.2014.10.007
Cao, V D., and Anh, L. D. (2019). Autonomous concrete crack detection using deep fully convolutional neural network. Automation Constr. 99, 52–58. doi:10.1016/j.autcon.2018.11.028
Cha, Y-J., Choi, W., and Büyüköztürk, O. (2017). Deep learning-based crack damage detection using convolutional neural networks. Computer-Aided Civ. Infrastructure Eng. 32 (5), 361–378. doi:10.1111/mice.12263
Cheng, J., Xiong, W., Chen, W., Gu, Y., and Li, Y. (2018). “Pixel-level crack detection using U-Net,” in TENCON 2018-2018 IEEE Region 10 Conference (IEEE), 0462–0466.
Constantin, A., Ding, J-J., and Lee, Y-C. (2018). “Accurate road detection from satellite images using modified U-net,” in IEEE Asia Pacific Conference on Circuits and Systems (APCCAS), 423–426.
Daniel, M., and Cook, A C. (2003). Erwan garel, yves lagabrielle, and marie-hélène cormier. Volcanic rifting at martian grabens. J. Geophys. Res. Planets 108 (E5).
Dorafshan, S., Thomas, R J., and Maguire, M. (2018). Comparison of deep convolutional neural networks and edge detectors for image-based crack detection in concrete. Constr. Build. Mater. 186, 1031–1045. doi:10.1016/j.conbuildmat.2018.08.011
Dyskin, A. V., and Germanovich, L. N. (1993). Model of rockburst caused by cracks growing near free surface. Rockbursts seismicity mines 93, 169–175.
Eckle, K., and Schmidt-Hieber, J. (2019). A comparison of deep networks with relu activation function and linear spline-type methods. Neural Netw. 110, 232–242. doi:10.1016/j.neunet.2018.11.005
Gopalakrishnan, K., Khaitan, S K., Choudhary, A., and Agrawal, A. (2017). Deep convolutional neural networks with transfer learning for computer vision-based data-driven pavement distress detection. Constr. Build. Mater. 157, 322–330. doi:10.1016/j.conbuildmat.2017.09.110
Guitton, A. (2018). 3d convolutional neural networks for fault interpretation. 80th EAGE Conference and Exhibition. Houten, Netherlands: European Association of Geoscientists and Engineers, 1–5.
Han, Y., and Ye, J. C. (2018). Framing U-Net via deep convolutional framelets: Application to sparse-view ct. IEEE Trans. Med. Imaging 37 (6), 1418–1429. doi:10.1109/tmi.2018.2823768
He, K., and Sun, J. (2015). “Convolutional neural networks at constrained time cost,” in Proceedings of the IEEE conference on computer vision and pattern recognition, 5353–5360.
He, K., Zhang, X., Ren, S., and Sun, J. (2016). “Deep residual learning for image recognition,” in The IEEE Conference on Computer Vision and Pattern Recognition (New York: CVPR).
Herbert, L. (2011). Hazard potential of zones of weakness in gravity dams under impact loading conditions. Front. Archit. Civ. Eng. China 5 (1), 90–97. doi:10.1007/s11709-010-0008-3
Hillier, J. K., Smith, M. J., Armugam, R., Barr, I., Boston, C. M., Clark, C. D., et al. (2015). Manual mapping of drumlins in synthetic landscapes to assess operator effectiveness. J. Maps 11 (5), 719–729. doi:10.1080/17445647.2014.957251
Ioffe, S., and Szegedy, C. (2015). Batch normalization: Accelerating deep network training by reducing internal covariate shift. arXiv preprint arXiv:1502.03167.
Kim, B., and Cho, S. (2018). Automated vision-based detection of cracks on concrete surfaces using a deep learning technique. Sensors 18 (10), 3452. doi:10.3390/s18103452
Li, G., Ma, B., He, S., Ren, X., and Liu, Q. (2020). Automatic tunnel crack detection based on U-Net and a convolutional neural network with alternately updated clique. Sensors 20 (3), 717. doi:10.3390/s20030717
Lin, T-Y, Goyal, P., Girshick, R., He, K., and Dollár, P. (2017). “Focal loss for dense object detection,” in Proceedings of the IEEE international conference on computer vision, 2980–2988.
Liu, Z., Cao, Y., Wang, Y., and Wang, W. (2019). Computer vision-based concrete crack detection using U-net fully convolutional networks. Automation Constr. 104, 129–139. doi:10.1016/j.autcon.2019.04.005
Mikhail, E M., JamesBethel, S., and McGlone, J. C. (2001). Introduction to modern photogrammetry, 19. New York.
Mohan, A., and Poobal, S. (2018). Crack detection using image processing: A critical review and analysis. Alexandria Eng. J. 57 (2), 787–798. doi:10.1016/j.aej.2017.01.020
Pereira, F C., and Pereira, C E. (2015). “Embedded image processing systems for automatic recognition of cracks using uavs,” in 2nd IFAC Conference on Embedded Systems, Computer Intelligence and Telematics CESCIT 2015, IFAC-PapersOnLine. 48. 10. 16–21. doi:10.1016/j.ifacol.2015.08.101
Pollard, D D., and Aydin, A. (1988). Progress in understanding jointing over the past century. GSA Bull. 100 (8), 1181–1204. doi:10.1130/0016-7606(1988)100<1181:piujot>2.3.co;2
Prabhakaran, R., Bruna, P.-O., Bertotti, G., and Smeulders, D. (2019). An automated fracture trace detection technique using the complex shearlet transform. Solid earth. 10 (6), 2137–2166. doi:10.5194/se-10-2137-2019
Ronneberger, O., Fischer, P., and Brox, T. (2015). “U-net: Convolutional networks for biomedical image segmentation,” in International Conference on Medical image computing and computer-assisted intervention (Springer), 234–241.
Sander, P., Minor, T B., and Chesley, M M. (1997). Ground-water exploration based on lineament analysis and reproducibility tests. Groundwater 35 (5), 888–894. doi:10.1111/j.1745-6584.1997.tb00157.x
Sanderson, D J., Peacock, D C. P., Nixon, C W., Rotevatn, A., and Rotevatn, A. (2019). Graph theory and the analysis of fracture networks. J. Struct. Geol. 125, 155–165. doi:10.1016/j.jsg.2018.04.011
Shao, S., McAleer, S., Yan, R., and Baldi, P. (2018). Highly accurate machine fault diagnosis using deep transfer learning. IEEE Trans. Industrial Inf. 15 (4), 2446–2455. doi:10.1109/tii.2018.2864759
Shin, H., Roth, H. R., Gao, M., Lu, L., Xu, Z., Nogues, I., et al. (2016). Deep convolutional neural networks for computer-aided detection: Cnn architectures, dataset characteristics and transfer learning. IEEE Trans. Med. Imaging 35 (5), 1285–1298. doi:10.1109/tmi.2016.2528162
Sousa Aurelio, Y., Matheus de Almeida, G., Leite de Castro, C., and Braga, A P. (2019). Learning from imbalanced data sets with weighted cross-entropy function. Neural Process. Lett. 50 (2), 1937–1949. doi:10.1007/s11063-018-09977-1
Sun, J., Wauthier, C., Stephens, K., Gervais, M., Guido, C., La Femina, P., et al. (2020). Automatic detection of volcanic surface deformation using deep learning. J. Geophys. Res. Solid Earth 125 (9), e2020JB019840. doi:10.1029/2020jb019840
Szegedy, C., Ioffe, S., and Vincent, V. (2016). Inception-v4, inception-resnet and the impact of residual connections on learning. Corr. abs/1602, 07261. doi:10.1609/aaai.v31i1.11231
van der Walt, S., Schönberger, J L., Nunez-Iglesias, J., Boulogne, F., Warner, J D., Yager, N., et al. (2014). scikit-image: image processing in Python. PeerJ 2, e453. doi:10.7717/peerj.453
Vasuki, Y., Holden, E-J., Peter, K., and Micklethwaite, S. (2014). Semi-automatic mapping of geological structures using uav-based photogrammetric data: An image analysis approach. Comput. Geosciences 69, 22–32. doi:10.1016/j.cageo.2014.04.012
WilsonLeal da Silva, R., and de Lucena, D S. (2018). Concrete cracks detection based on deep learning image classification. Multidiscip. Digit. Publ. Inst. Proc. 2, 489.
Wu, X., Liang, L., Shi, Y., and Fomel, S. (2019). Faultseg3d: Using synthetic data sets to train an end-to-end convolutional neural network for 3d seismic fault segmentation. Geophysics 84, IM35–IM45. doi:10.1190/geo2018-0646.1
Wyllie, D C. (1999). Foundations on rock: Engineering practice. Second Edition2 edition. London: CRC Press.
Xiong, F., Zhou, J., Zhao, Q., Lu, J., and Qian, Y. (2022). “MAC-Net: Model-Aided nonlocal neural network for hyperspectral image denoising,” in IEEE Transactions on Geoscience and Remote Sensing, 1–14. 60.
Yang, J., Faraji, M., and Basu, A. (2019). Robust segmentation of arterial walls in intravascular ultrasound images using dual path u-net. Ultrasonics 96, 24–33. doi:10.1016/j.ultras.2019.03.014
Yang, X., Li, X., Ye, Y., Lau, R Y. K., Zhang, X., and Huang, X. (2019). Road detection and centerline extraction via deep recurrent convolutional neural network U-NetConference name: IEEE transactions on geoscience and Remote sensing. IEEE Trans. Geoscience Remote Sens. 57 (9), 7209–7220. doi:10.1109/tgrs.2019.2912301
Yap, M H., Pons, G., Martí, J., Ganau, S., Sentís, M., Zwiggelaar, R., et al. (2017). Automated breast ultrasound lesions detection using convolutional neural networks. IEEE J. Biomed. health Inf. 22 (4), 1218–1226. doi:10.1109/jbhi.2017.2731873
Zhang, T. Y., and Suen, C Y. (1984). A fast parallel algorithm for thinning digital patterns. Commun. ACM 27 (3), 236–239. doi:10.1145/357994.358023
Zhang, Z., Liu, Q., and Wang, Y. (2018). Road extraction by deep residual U-NetConference name: IEEE geoscience and Remote sensing letters. IEEE Geoscience Remote Sens. Lett. 15 (5), 749–753. doi:10.1109/lgrs.2018.2802944
Zhou, Z., Rahman Siddiquee, M M., Tajbakhsh, N., and Liang, J. (2018). “UNet++: A nested U-net architecture for medical image segmentation,” in Deep Learning in Medical Image Analysis and Multimodal Learning for Clinical Decision Support (Cham: Springer International Publishing), 3–11.
Keywords: geo-crack detection, rock cracks, U-Net, convolutional neural network, transfer learning, machine learning
Citation: Shi Y, Ballesio M, Johansen K, Trentman D, Huang Y, McCabe MF, Bruhn R and Schuster G (2023) Semi-universal geo-crack detection by machine learning. Front. Earth Sci. 11:1073211. doi: 10.3389/feart.2023.1073211
Received: 18 October 2022; Accepted: 09 February 2023;
Published: 10 March 2023.
Edited by:
Peng Zhenming, University of Electronic Science and Technology of China, ChinaReviewed by:
Fengchao Xiong, Nanjing University of Science and Technology, ChinaPeng Zhenming, University of Electronic Science and Technology of China, China
Shu Li, Jishou University, China
Copyright © 2023 Shi, Ballesio, Johansen, Trentman, Huang, McCabe, Bruhn and Schuster. This is an open-access article distributed under the terms of the Creative Commons Attribution License (CC BY). The use, distribution or reproduction in other forums is permitted, provided the original author(s) and the copyright owner(s) are credited and that the original publication in this journal is cited, in accordance with accepted academic practice. No use, distribution or reproduction is permitted which does not comply with these terms.
*Correspondence: Gerard Schuster, ai5zY2h1c3RlckB1dGFoLmVkdQ==