 D. Skye Kushner
 Taryn M. Lopez
 Kristi L. Wallace
 David E. Damby
 Christoph Kern
 Cheryl E. Cameron
94% of researchers rate our articles as excellent or good
Learn more about the work of our research integrity team to safeguard the quality of each article we publish.
Find out more
ORIGINAL RESEARCH article
Front. Earth Sci., 27 February 2023
Sec. Geochemistry
Volume 11 - 2023 | https://doi.org/10.3389/feart.2023.1054521
This article is part of the Research TopicThe Fate of Volatiles and Metals in Magmas: Volcanic Eruptions, Plutons and Ore DepositsView all 6 articles
Ash is a potential sink of volcanically sourced atmospheric mercury (Hg), and the concentration of particle-bound Hg may provide constraints on Hg emissions during eruptions. We analyze Hg concentrations in 227 bulk ash samples from the Mount Spurr (1992), Redoubt Volcano (2009), and Augustine Volcano (2006) volcanic eruptions to investigate large-scale spatial, temporal, and volcanic-source trends. We find no significant difference in Hg concentrations in bulk ash by distance or discrete eruptive events at each volcano, suggesting that in-plume reactions converting gaseous Hg0 to adsorbed Hg2+ are happening on shorter timescales than considered in this study (minutes) and any additional in-plume controls are not discernable within intra-volcanic sample variability. However, we do find a significant difference in Hg concentration of ash among volcanic sources, which indicates that volcanoes may emit comparatively high or low quantities of Hg. We combine our Hg findings with total mass estimates of ashfall deposits to calculate minimum, first-order Hg emissions of 8.23 t Hg for Mount Spurr (1992), 1.25 t Hg for Redoubt Volcano (2009), and 0.16 t Hg for Augustine Volcano (2006). In particular, we find that Mount Spurr is a high Hg emitting volcano, and that its 1992 particulate Hg emissions likely contributed substantially to the global eruptive volcanic Hg budget for that year. Based on our findings, previous approaches that use long-term Hg/SO2 mass ratios to estimate eruptive total Hg under-account for Hg emitted in explosive events, and global volcanogenic Total Hg estimates need revisiting.
Mercury (Hg) is a volatile and toxic metal released to the environment by both natural and anthropogenic sources. Volcanoes are considered to be one of the largest primary natural sources of Hg, with previous estimates of total annual volcanic Hg emissions between ∼50 and 700 t a−1 (e.g., Nriagu and Becker, 2003; Pyle and Mather, 2003). However, large uncertainties exist in speciation, reaction pathways, total emission to the atmosphere, and the ultimate fate of volcanic Hg in the environment (see Figure 1 in Edwards et al., 2021 for a schematic of Hg chemistry in volcanic environments).
Despite these uncertainties, volcanic sources were measured to release prodigious quantities of Hg to the atmosphere as Gaseous Elemental Mercury (GEM; Hg0, Bagnato et al., 2015). Oxidation of GEM to Gaseous Oxidized Mercury (GOM; Hg2+) and subsequent uptake in the form of Particulate-Bound Mercury (PBM; generally Hg2+) is the principal pathway for atmospheric removal of volcanic Hg emissions (Driscoli et al., 2013). GEM is relatively insoluble in water and has an atmospheric lifetime of ∼3 months under standard tropospheric conditions, theoretically allowing for long-distance transport (Horowitz et al., 2017). However, modeling has suggested that conditions within volcanic plumes, including the presence of halogen species, may facilitate rapid oxidation of >80% of volcanically-sourced GEM to PBM within minutes of emission (von Glasow, 2010). These model results are supported by field observations, which found depletion of GEM emitted from volcanic features on the order of minutes (Aiuppa et al., 2007). Empirical attempts to constrain speciation of emitted volcanic Hg have also been performed up to hundreds of meters from emission sources in ash-poor plumes, and have found PBM to represent anywhere from low (1%–5%; Bagnato et al., 2007; Witt et al., 2008; Mather et al., 2012) to high (40%–90%; Zambardi et al., 2009) proportions of Total Hg (THg) emitted to the atmosphere. These observations suggest that oxidation of GEM and subsequent removal through wet or dry deposition may be more efficient, albeit variable, under certain conditions in volcanic plumes than in the background atmosphere.
The main sources of uncertainty in the speciation and total emission of volcanic Hg are rooted in a lack of measurements from volcanic eruptions, due to the logistical challenges of collecting gaseous Hg samples from actively erupting plumes. Therefore, nearly all existing studies (summarized in Bagnato et al., 2015; Edwards et al., 2021) have focused on volcanic Hg emissions from quiescent persistently degassing volcanoes. Scrubbing of emitted metals from volcanic plumes occurs through particle surface adsorption and acid aerosol formation (Ayris and Delmelle, 2012; Ilyinskaya et al., 2021), though little analytical work has been performed to constrain the extent of these processes with respect to Hg and in particular the role of the substrate on Hg adsorption (Stewart et al., 2020). One potential method to better characterize volcanic Hg speciation during eruption and to better quantify total volcanic Hg emissions is through the analysis of PBM adsorbed to the surface of volcanic ash particles, which can readily be sampled on the ground downwind of eruptions. For this approach, we presume that Hg in our samples is present on ash surfaces and that Hg in our ash deposits is synonymous with PBM, though we recognize there may be other modes of co-deposition including wet deposition through dissolution into condensed aqueous phases (Lindberg and Stratton, 1998).
Herein, we report analyses of Hg concentrations on 227 bulk ash samples to investigate how PBM concentration varies 1) with distance from the source, 2) between distinct events within the same eruption, and 3) between different volcanoes. We then apply a new approach to estimate Hg emissions from the target eruptions, whereby we integrate our Hg-ash data with previous mass estimates of total erupted ash. We consider our estimates to be minimums because they do not account for the unconstrained abundance of Hg that remains in the atmosphere down-plume, which can still be measurable over thousands of kilometers (Babu et al., 2022).
These points of investigation provide an eruption-scale understanding of Hg, from emission to in-plume reactions and removal/deposition. First, PBM concentration variation with distance is used to constrain the timing of GEM oxidation and adsorption as the plume travels downwind, which is wholly unconstrained for ash-rich plumes. Sustained oxidation-adsorption of GEM to PBM may result in increasing concentrations of PBM as the ash-rich plume travels downwind so long as GEM abundance does not become rate limiting, whereas rapid formation of PBM would favor no discernable increase of PBM with distance on the km scale investigated here. Second, PBM concentration variation between distinct events is used to investigate potential Hg variability over the eruption duration, which is also unconstrained at present. Variations in Hg concentration throughout the eruptive sequence may be a function of Hg solubility in magma. For example, if Hg readily exsolves from magma at depth, Hg may accumulate in a pre-eruptive exsolved volatile phase and therefore be preferentially released early in the eruption and subsequently absorbed on ash (Varekamp and Buseck, 1986). In contrast, if Hg is relatively soluble in magma it may degas upon surface eruption and exhibit no obvious temporal trend in concentration over the eruption duration. Finally, differences in PBM concentration in ash samples from the target volcanoes are used to investigate variability in Hg emissions across volcanoes and eruption cycles. Differences in PBM concentration between the target volcanoes may reflect different Hg concentrations in source magmas or may result from different oxidative potentials in the eruption plumes. Variance in Hg concentration within source magmas may be due to the relative mantle, slab, and crustal contribution where the mantle is recognized as Hg-poor relative to the crust and slab (Wedepohl, 1995; Canil et al., 2015).
We focus on three recent and well-characterized eruptions from Mount Spurr (1992), Redoubt Volcano (2009), and Augustine Volcano (2006), Alaska. Volcanic ash samples from these eruptions were readily available for analysis from the Alaska Volcano Observatory (AVO) and have well-characterized corresponding eruption mass estimates to address our proposed questions. Through this work we provide new constraints on the amount of PBM from these three target eruptions and discuss possible implications of our findings on global volcanic Hg budgets. Our data provide a first estimate of mercury input into the local environment for the areas impacted by our target eruptions, and can be used to refine mercury cycling in the region.
We target three volcanoes within Alaska (Figure 1A) that have undergone explosive volcanic eruptions within the past 3 decades. These volcanoes were selected on the basis of their well-characterized recent eruptions, production of significant ash clouds, and the spatially and temporally extensive sampling of volcanic ash rapidly following the eruptive events by AVO scientists. From east to west the target volcanoes (with eruption year in parentheses) are Mount Spurr (1992), Redoubt Volcano (2009), and Augustine Volcano (2006).
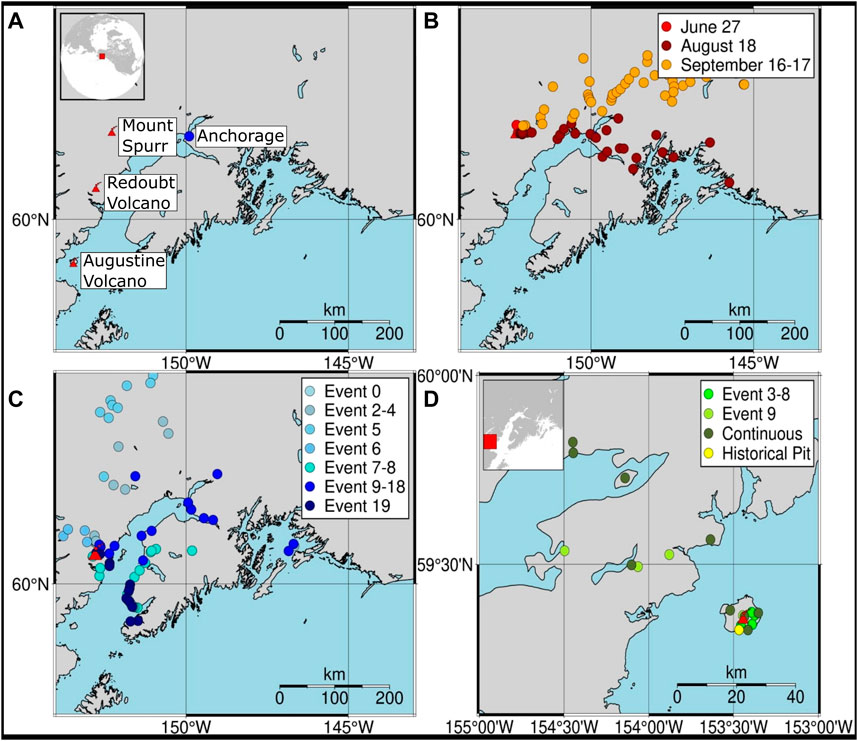
FIGURE 1. (A) Location of studied volcanoes with sample collection locations for (B) Mount Spurr (1992), (C) Redoubt Volcano (2009), and (D) Augustine Volcano (2006). Distinct eruptive events are color coded in the legends.
Mount Spurr (61.2989 N, 152.2539 W; 3374 MASL) is an andesitic to dacitic stratovolcano with recent eruptions in 1953 and 1992 (Miller et al., 1998). The 1992 eruption had a Volcanic Explosivity Index (VEI) of 3 (0.1–0.01 km3 erupted tephra; Newhall and Self, 1982) and consisted of three distinct Sub-Plinean explosive events on June 27, August 18, and September 16–17, with the largest event (August 18) producing a plume that reached 15 km above sea level (ASL; Eichelberger et al., 1995). In total, the eruption is estimated to have produced 106 × 109 kg of cumulative tephra and ∼830 kt SO2 (Eichelberger et al., 1995; McGimsey et al., 2001).
Redoubt Volcano (60.4852 N, 152.7438 W; 3108 MASL) is an andesitic stratovolcano with recent eruptions in 1966, 1967, 1989–90, and 2009 (Miller et al., 1998; Wallace et al., 2013). The 2009 VEI 3 eruption consisted of 19 distinct explosive events between March and April, followed by extrusion of lava domes. In total, the eruption is estimated to have had a maximum plume height of 19 km ASL, produced 55 × 109 kg of tephra and 1,270 kt SO2, and dispersed ash over an 80,000-km2 region (Wallace et al., 2013; Werner et al., 2013).
Augustine Volcano (59.3629 N, 153.435 W; 1260 MASL) is an andesitic to dacitic stratovolcano with recent eruptions in 1963, 1976, 1986, and 2006 (Miller et al., 1998; Wallace et al., 2010). The 2006 VEI 3 eruption consisted of 13 distinct explosive events and effusive phases between January and March (Wallace et al., 2010). In total, the eruption is estimated to have had a maximum plume height of 13.5 km ASL, produced 22 × 109 kg of tephra and 630 kt SO2, and dispersed ash up to 185 km away (McGee et al., 2010; Wallace et al., 2010).
A subset of ash samples from the target eruptions was selected based on their spatial coverage of discrete explosive events. Specifically, we targeted events that had estimates of total ash-mass and included samples that were deposited at various down-wind distances from the vent and collected no more than a week after deposition. Collection notes were used to exclude samples that may have been contaminated, such as the sample being near an industrial area or possibly containing non-representative material. We also aimed to collect samples from a minimum of three events per eruption spanning the beginning, middle, and end of the eruption. Bulk ash samples previously collected for mass per unit area analysis (full sample list, collection procedure, and processing details for each eruption are detailed in McGimsey et al., 2001; Wallace et al., 2010; Wallace et al., 2013) were queried from the Geologic Database of Information on Volcanoes in Alaska (GeoDIVA; Cameron, 2004). In total, 227 samples were selected: 84 from Mount Spurr (1992), 114 from Redoubt Volcano (2009), and 29 from Augustine Volcano (2006). Outside the immediate scope of our hypotheses but of additional interest are four historic samples collected from a pit on Augustine Volcano. All samples were bagged and stored in boxes on large shelving units in an area removed from sunlight at the Geologic Materials Center or the U.S. Geological Survey (USGS) tephra labs in Anchorage, Alaska. Grain sizes of the bulk material was not used a determinant in subsampling but samples represent a mixture of extremely fine ash to lapilli (detailed particle size distributions are presented in McGimsey et al., 2001; Wallace et al., 2010; Wallace et al., 2013). It is assumed for the purpose of this study that no Hg has been lost or gained under these storage conditions. Ash masses of 0.1–5.0 g per sample were subsampled from the repositories using sterile instruments.
Bulk volcanic ash subsamples were freeze-dried and analyzed for THg via direct combustion using Atomic Absorption Spectroscopy (AAS) on a Milestone DMA-80 instrument (Milestone Srl, Italy) following the U.S. Environmental Protection Agency (U.S. EPA) Method 7473 (U.S. EPA, 1998) in the Marine Ecotoxicology and Trophic Assessment Laboratory at the University of Alaska Fairbanks. All samples (weights 0.01–0.1 g) were heated to 800°C and analyzed at least in duplicate with a precision range of ±10%, apart from 15 limited quantity samples on which singlicate analysis was conducted. Calibration curves were prepared using an internal liquid standard to a 0.5 ng Hg limit of quantification. Accuracy checks were routinely performed after analysis of 20 samples using two internal standards (10 ppb, 100 ppb) and a National Institute of Standards and Technology Standard Reference Material (NIST SRM 1633c—Trace Elements in Coal Fly Ash; certified value: 1,005 ± 22 ng g−1). The values of these standards were determined by our AAS analyses to be 93.9 ± 3.1 ng g−1 (n = 39) for the 100 ppb liquid standard, 9.8 ± 1.0 ng g−1 (n = 52) for the 10 ppb liquid standard, and 1,017.9 ± 31.8 ng g−1 (n = 55) for NIST SRM 1633c.
Ash samples are assumed in this study to have no Hg adsorbed onto the surface at the time of fragmentation and ejection from the vent. In-plume Hg concentration at the time of all three eruptions was not measured, but assumed from GEM measurements of other volcanic systems (Bagnato et al., 2015) to be 2–3 orders of magnitude larger than the modeled ambient atmospheric concentration of ∼1.5 ng m−3 for this area (Zhang and Zhang, 2022).
In this study, we test the following three hypotheses: 1) there is a significant dependence of bulk ash Hg concentration from individual eruption events on the distance of the sampling location from the source vent; 2) there is a significant difference in bulk ash Hg concentration between eruption events; and 3) there is a significant difference in bulk ash Hg concentration between volcanoes.
Data were categorized by volcano of origin, event number within each eruption sequence, and distance from the vent. Eruption events were grouped together in cases where sample collection did not allow for discrimination to specific events (e.g., Redoubt Volcano events 7–8). Eruption chronology, definitions, groupings of eruption events, and eruption mass estimates were defined or calculated in Wallace et al. (2013) for the 2009 Redoubt Volcano eruption, Wallace et al. (2010) for the 2006 Augustine Volcano eruption, and McGimsey et al. (2001) for the 1992 Mount Spurr eruption. The distance of each ash sample from the vent was determined using the collected GPS coordinates and the eruptive vent coordinates as defined by the AVO. More details on the samples used can be found in Supplementary Material S1.
We use multivariable linear regression using the R stats package (R core team, 2013; Supplementary Material S2) to test the relationships among the three factors (sampling distance, eruption event, volcano of origin) on Hg concentration in our ash samples. This statistical test was identified as the most appropriate due to our dataset including multiple independent variables. This method assumes a normally distributed sample population, which was confirmed for our sample sets through a Kolmogorov-Smirnov Normality Test for Mount Spurr (p = 0.22), Redoubt Volcano (p = 0.07), and Augustine Volcano (p = 0.12). Testing of statistical significance was conducted in four separate linear regression model runs: the first three considered the influence of distance and eruption event on Hg concentration for each of the three volcanoes, and the fourth looked at the influence of volcano of origin on Hg concentration. For this fourth test, we combined all Hg concentration data per volcano so that it is independent of eruption event and distance. Following our calculations, we apply a p-value threshold to determine whether each of our factors influence Hg concentration, where p > 0.05 indicates that factor does not exert a statistically significant influence on our sample set. Significance is only considered for sample sets of n ≥ 5. We also calculate descriptive statistics for the measured Hg concentration per sample for each volcano and event, including mean, standard deviation, and quartiles.
The largest number of samples analyzed in this study were from Mount Spurr’s two most well-documented events (Figure 2A) on 18 August (n = 33) and 16–17 September (n = 49) 1992, with samples distributed fairly evenly over the total distance collected (5–378 km). Associated p-values (Table 1) show no significant difference in sample Hg concentration with distance or among events. The 27 June event had a small sample size (n = 2) of only proximal samples and data are plotted but not examined statistically. The mean Hg concentration for all Mount Spurr samples is 77.6 ± 48.7 ng g−1 (range: 19–338 ng g-−1), which is the highest mean Hg concentration measured for the three target volcanoes (Table 1).
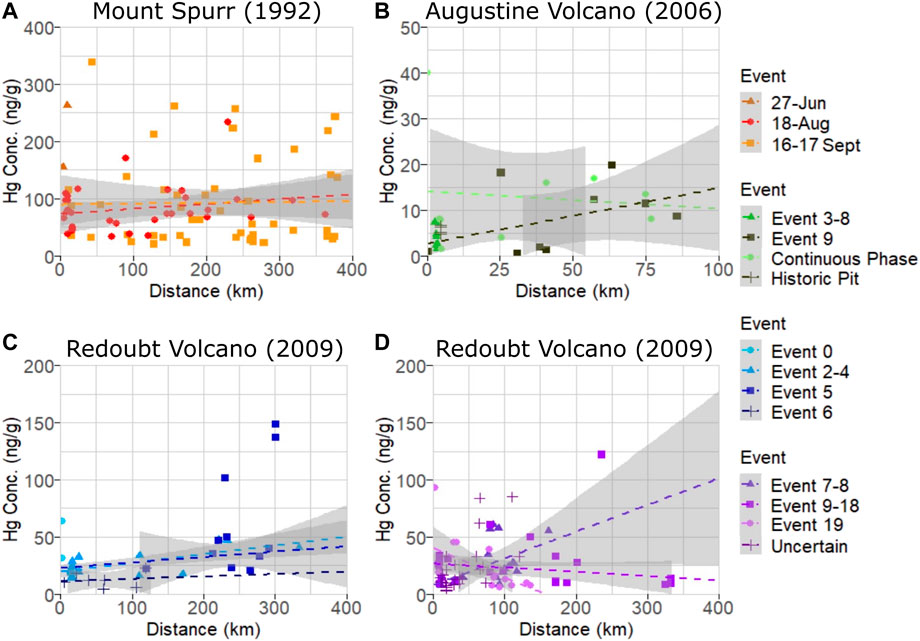
FIGURE 2. Plot of Hg concentration measured as PBM on volcanic ash versus distance for individual events within (A) Mount Spurr (B) Augustine Volcano, and (C, D) Redoubt Volcano (separated to avoid plot crowding) eruptions. Dashed lines are linear model fits used in determining significance and grey shaded areas are 95% confidence intervals. Note the high variance in measured PBM for each eruptive event and occurrence of sample Hg concentrations plotting outside 95% confidence interval regions indicating no significant relationship between Hg concentration and distance for these events.
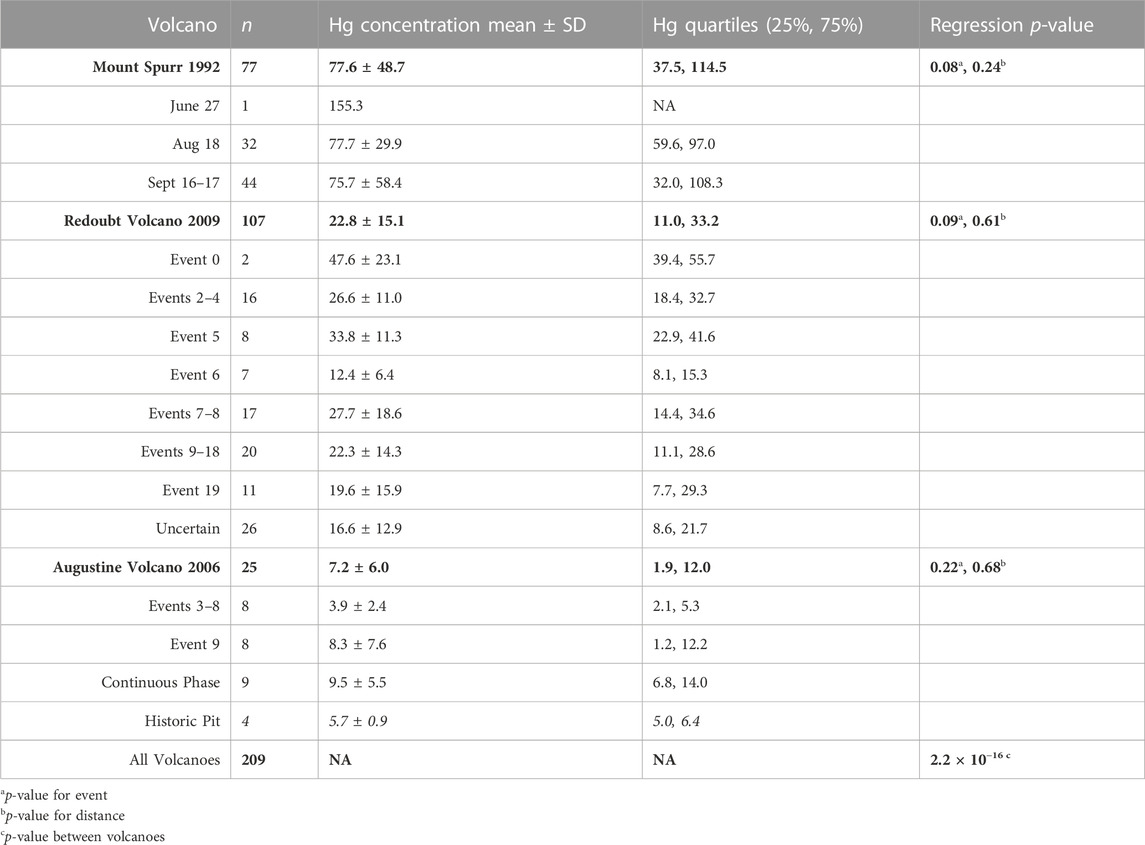
TABLE 1. Descriptive statistics of analyzed Mount Spurr, Redoubt Volcano, and Augustine Volcano ash. Descriptive statistics for the full volcanic sample set are in bold and broken into individual events beneath. Concentration data are presented as ng g−1.
The 2006 Augustine Volcano eruption had the smallest sample set analyzed (n = 25) of all three target volcanoes owing to the volcano’s location on an island, with most ashfall deposited into the ocean. Samples for this volcano were also more limited in spatial coverage than the other two, covering distances of 1–85 km from the vent, and were split between events 3–8, 9, and a continuous phase (Figure 2B). All samples for events 3–8 were collected from the island and only cover a distance gradient of 2–3 km from source, while event nine and continuous phase sample coverage include island and mainland Alaska coverage (Figure 1D). Samples from the continuous phase and event 9 show no significant difference between event groups or distance. Of additional interest are four historic samples collected from a pit on Augustine Volcano that have similarly low Hg concentrations (Table 1; Figure 3). The mean Hg concentration for all Augustine Volcano samples is 7.2 ± 6.0 ng g−1 (range: 0.5–40 ng g−1), which is the lowest mean Hg concentration measured for the three target volcanoes (Table 1).
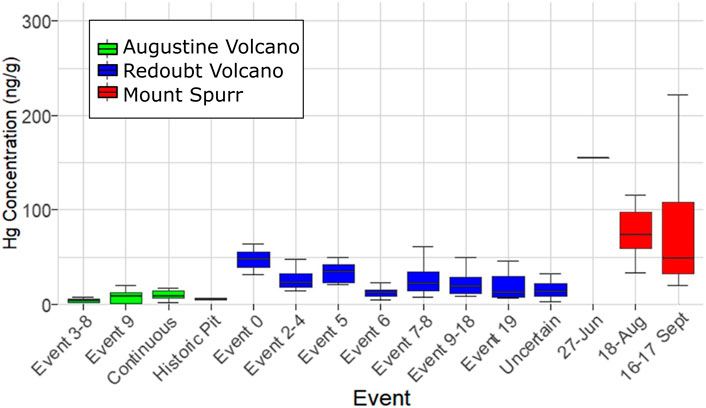
FIGURE 3. Box plot of sample Hg concentration measured as PBM on volcanic ash for individual events within Augustine Volcano (green), Redoubt Volcano (blue), and Mount Spurr (red) eruptions showing median Hg concentration (thick lines), interquartile ranges (colored boxes), and minimum/maximum values excluding outliers (horizontal caps).
The dataset for Redoubt Volcano comprises samples subdivided into three composite event groupings (events 2–4, 7–8, 9–18) and discrete events within the 2009 eruption sequence (Figures 2C, D). The full sample distribution covers 3–333 km, however some individual event groupings have limited spatial coverage (e.g., event 5 covers 120–301 km and event 6 covers 5–119 km). No statistically significant difference in Hg concentration is seen between event grouping or distance from source (Table 1; Figures 2C, D). Samples from eruption event 0 and those with uncertain event origins were excluded from variance analysis due to either the small sample size or unknown event origin. The mean Hg concentration for all Redoubt Volcano samples is 22.8 ± 15.1 ng g−1 (range: 3.6–148 ng g−1) (Table 1).
A linear regression model fit to data from all three volcanoes finds a significant difference in Hg concentration in ash among these three volcanoes (p = 2.2 × 10⁻¹⁶; Table 1). Thus, for the three volcanoes considered here, there is no statistical difference in Hg concentration by distance or eruptive event, however there is a statistical difference in Hg concentration by volcano of origin. On this basis, all samples from an individual volcano may be grouped together irrespective of distance or eruptive event (Figure 4A), simplifying methods to estimate the total PBM emission from each volcano (Figure 4B).
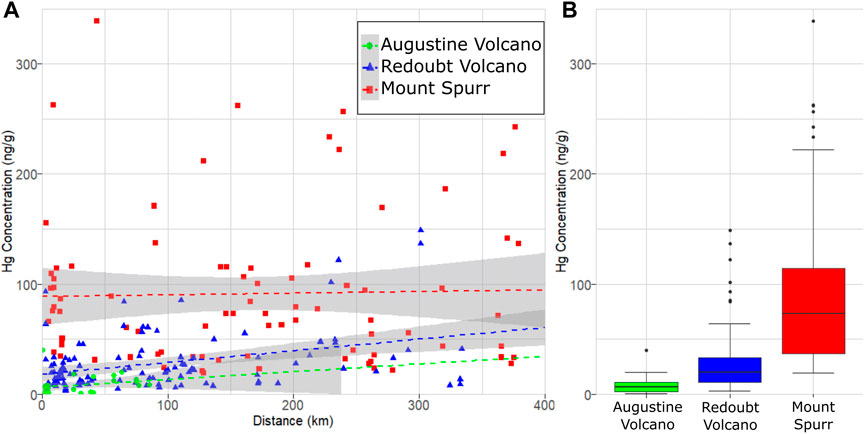
FIGURE 4. Hg concentration measured as PBM on volcanic ash from Mount Spurr (1992), Redoubt Volcano (2009) and Augustine Volcano (2006) volcanic eruptions in Alaska. (A) PBM on ash as a function of ash deposition distance from the eruption vent, with dashed lines showing linear regressions. Note the high variance in measured PBM for each eruption and occurrence of sample Hg concentrations plotting outside gray (95% confidence interval) regions indicating no significant relationship between Hg concentration and distance for these eruptions. (B) Box plot showing the observed difference in median Hg concentration (thick lines), interquartile ranges (colored boxes), minimum/maximum values (horizontal caps), and outliers (black circles).
We calculate the total PBM in the tephra deposit from each target eruption by multiplying existing total eruption ash mass estimates by the mean Hg concentration of our bulk ash samples. We infer this to provide a minimum estimate of total Hg emissions for these eruptions, as we do not account for remaining GEM or unbound Hg2+ within the volcanic plume. The resulting Hg emissions (as PBM) per volcanic eruption are shown in Table 2.
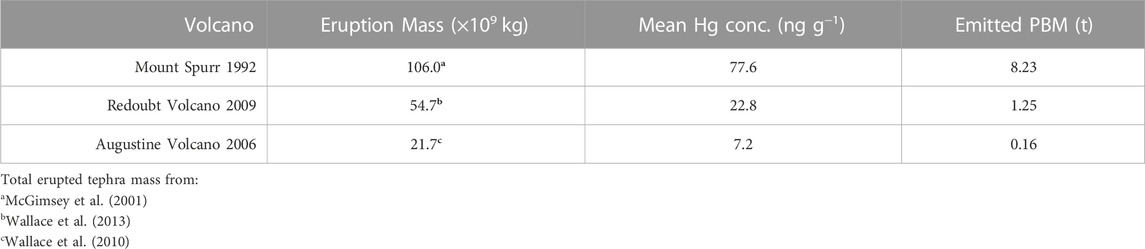
TABLE 2. Total particulate-bound Hg from each volcano.
Our results find no significant difference in Hg concentration on volcanic ash based on downwind distance, at least on the scale of 1–500 km downwind distances investigated here. Volatile trace metals (e.g., Cu, Cd, Pb) have been shown to partition strongly into non-silicate particulate matter and preferentially deposit proximally (Ilyinskaya et al., 2021). It has also been suggested that volcanic plumes may provide a medium to rapidly oxidize entrained atmospheric GEM within minutes (von Glasow, 2010) which would lead to PBM as the dominant Hg species within the nearer distances considered for this study. Alternatively, the more distal samples from both Mount Spurr and Redoubt Volcano contain higher proportions of fine ash material than proximal samples (McGimsey et al., 2001; Wallace et al., 2013), providing a correspondingly higher surface area for adsorption reactions to take place (Ermolin et al., 2018; Ermolin et al., 2021) which would favor higher bulk-sample concentrations of PBM. Despite these pathways potentially favoring a decrease or increase of PBM with distance, respectively, neither process appears to be discernible within the variability of our samples. Though there is large variability (>50%) in the PBM concentration of ash between these volcanic sources, the absence of a correlation with either downwind distance or eruptive event suggests that either substantial GEM oxidation happened before deposition at our closest sampling sites (∼1–5 km) and any further in-plume oxidation is not distinguishable within the sample variability, or that the GEM oxidation process is much slower than the timescales on which ash dispersion and sampling are occurring (minutes to hours) and thus cannot be identified in this dataset. We consider the first explanation to be the more likely one. The most proximal samples from both Redoubt Volcano and Mount Spurr were collected at ∼5 km downwind, corresponding to plume transport times exceeding 10 min, which would still allow for the rapid oxidation processes proposed by von Glasow, 2010 and be consistent with other findings of elevated PBM in proximal ash from Marumoto et al. (2017) or elevated Hg in soils and lichens from select volcanic areas (Catán et al., 2020), which are interpreted to result from very near-vent deposition and uptake. Previous studies which have attempted to constrain the speciation of Hg within volcanic plumes have all been performed on much shorter spatial scales—within hundreds of meters of the vent—such that rapid oxidation of GEM may occur, but the extent is not captured on the scale of existing studies (Witt et al., 2008; Bagnato et al., 2015). If oxidation is occurring on much slower timescales than represented in this dataset our study would represent an underestimation of erupted PBM; however, this is unlikely as we detect oxidized Hg on all of our studied ash samples, indicating that this process has taken place.
Based on our findings, we suggest that bulk samples for determining average volcanic PBM may be sourced from downwind distances ranging from 1 to 500 km, as it is likely that by those distances most GEM has either been oxidized and scrubbed by ash or aerosols or is no longer being efficiently adsorbed due to significant plume dilution with background air. However, the variation seen within each sample set suggests that accurate characterization of Hg present in the ash of a single volcano should not be based on small sample sizes. A good illustration of this is presented in our Hg concentrations for Redoubt Volcano, which are higher than previously reported for a single sample of the same Redoubt Volcano eruption (Coufalík et al., 2018; Table 3).
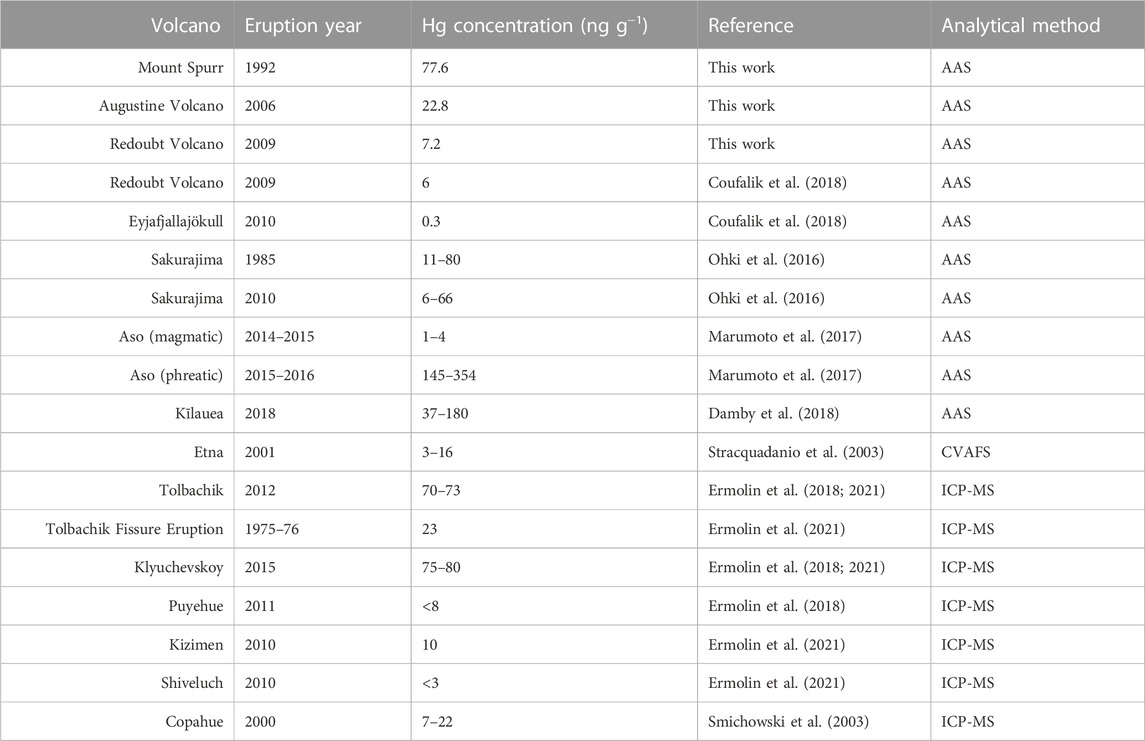
TABLE 3. Literature values of PBM in volcanic ash.
We find a significant difference in PBM concentrations on ash between eruptions from our three target volcanoes. This suggests that Hg concentration may be controlled in part by either volcanic source conditions or by conditions within the volcanic plume that promote or hinder adsorption of Hg after release from the vent.
Different initial concentrations of Hg emanating from the volcanoes, reflecting a source control, would lead to different quantities of GEM being available for oxidation and adsorption. Specifically, volcanoes with Hg-poor plumes would have less available Hg, and ash samples from these volcanoes would therefore be expected to contain less PBM. Wide arrays of measurements from passively degassing volcanic environments (summarized in Bagnato et al., 2015; Edwards et al., 2021) show orders of magnitude differences of GEM within volcanic plumes at downwind distances within ∼1 km of the vent, ranging from near ambient (4 ng m-3) at Gorely (Russia) and Poás (Costa Rica) volcanoes to orders of magnitude higher (373 ng m-3) at Nyiragongo (Democratic Republic of the Congo) volcano. A compilation of literature values for PBM on volcanic ash (Table 3) shows similar orders-of-magnitude differences between volcanic sources as we have found here. This suggests that the notable variations in Hg concentration on deposited ash seen in our study and globally may be attributable to variable (comparatively high and low) Hg emissions by source, which could result from large-scale variations in the source of Hg incorporated into magma. A significant difference in Hg concentration by source (different volcanoes and geologic settings) would mechanistically account for the variation between Hg in ash samples and GEM concentrations in volcanic plumes.
The lack of distinguishability among events at all three volcanoes in this study suggests that Hg emissions are consistent throughout an eruptive sequence and potentially across multiple eruptive episodes. Despite variability of major gas species during an eruptive sequence (Werner et al., 2013), a consistent abundance of Hg throughout each of the examined eruptions is supported by similar PBM concentration on ash. The undated ash samples collected from a historical pit at Augustine Volcano (Table 1) were also found to have similar Hg concentrations as the 2006 eruption, suggesting that Augustine Volcano’s low-Hg emissions have persisted across multiple eruption cycles. Similarly, ash samples collected and analyzed for PBM from two eruptions from Sakurajima volcano (Japan, 1985 and 2010; Ohki et al., 2016) were found to be within the same range, further supporting this idea. Conversely, two sets of proximal samples from Aso volcano (Japan, Marumoto et al., 2017) collected during phreatic and magmatic (Strombolian) eruptions were found to have PBM concentrations that differed by two orders of magnitude (Table 3). Marumoto et al. (2017) proposed that the orders-of-magnitude difference in PBM concentrations may be attributable to different eruption styles. If an eruption is sourced from low-Hg magma, it is not surprising that phreatic eruptions (i.e., eruptions that do not erupt juvenile material) would have higher quantities of emitted Hg than magmatic eruptions for the same volcano. Some crater lakes such as the one overlying Mt. Ruapehu have been measured to contain high concentrations of Hg (Deely and Sheppard, 1996) signifying there may also be potential for Hg contribution from hydrothermal systems in phreatic eruptions. Therefore, while our findings together with the literature suggest that volcanoes may be characteristically high- or low-Hg emitters, even over multiple eruption cycles, it is possible that Hg emissions can vary substantially for different eruption styles at the same volcano.
Certain physical or chemical conditions within the volcanic plume could facilitate adsorption of Hg on ash particles, which include: 1) the presence of gaseous species facilitating GEM oxidation (e.g., halogens, ozone); 2) a large quantity of aerosols which would increase the surface area for uptake; 3) the availability of sunlight at the eruption time (von Glasow, 2010; Amos et al., 2012). Rapid ozone depletion and formation of BrO have been measured in Redoubt Volcano’s plume (Kelly et al., 2013), which may indicate that conditions favorable to the oxidation of GEM were sustained for this and potentially other eruptions. Comparable measurements at Mount Spurr and Augustine Volcano are not available, but previous studies have found different BrO concentrations in volcanic plumes at other volcanoes (Bobrowski et al., 2015), and the variation in PBM from our study sites could in part be controlled by the availability of reactive species. Photolytic conditions between our studied volcanoes may be extrapolated by the timing of eruptions and resulting availability of solar radiation. Specifically, Mount Spurr erupted in a period of high solar radiation (June–September), while Augustine Volcano (January–February) and Redoubt Volcano (March–April) both erupted during periods of lower solar radiation. Events within each of the studied eruptive sequences include both day and nighttime-only events with no discernable difference in PBM noted at equivalent downwind distances, so it is unlikely that variations in solar radiation had a significant effect on our samples. As an example, the Mount Spurr eruption contains two well documented events (McGimsey et al., 2001) during daytime (August 18, ∼7:00 p.m. eruption) and nighttime (September 16–17; 1:00 a.m. eruption), but the Hg concentrations measured in downwind samples are not distinguishable from each other. It is also unlikely that the geographic location played a primary role in the observed variation in Hg concentration, as all three eruptions had similar VEIs (∼3–4), plume heights (13–19 km), and occurred at similar latitudes (∼60°N).
A geologic mechanism that could explain initial Hg concentration differences across volcanoes would be related to heterogeneous distribution of Hg within the crust or subducting slab. The mantle is measured to be Hg-poor relative to crustal material (Wedepohl, 1995; Canil et al., 2015), so magma derived primarily from the mantle (e.g., hotspot volcanoes) would be Hg-poor compared to those which have incorporated more material from a dehydrating subducted oceanic slab or crust (arc volcanoes). Similar metal-rich or metal-poor signatures have been measured between arc and non-arc volcanoes (Edmonds et al., 2018; Edwards et al., 2021), and crustal incorporation as a source of volcanic Hg has previously been proposed (Coufalík et al., 2018). Records of ascending Hg-rich fluids are preserved in regions of subduction of oceanic sediments underneath continental crust as economically significant Hg mineral deposits, which typically occur in low-temperature environments where numerous deposits may be dispersed over a wide region (Rytuba, 2003). Therefore, Hg-rich volcanoes could be explained by either the direct recycling of Hg-rich fluids sourced from subducted sediments to arc volcanoes, or by the assimilation of Hg-rich crust during magma storage and ascent. We note that the volcanoes in this study which contain higher concentrations of PBM (Mount Spurr and Redoubt Volcano) are built upon thicker sections of crust (Zhang et al., 2019), including lithologies containing high proportions of evolved granitoids and terrestrial sediments (Wilson et al., 2015).
Differing source controls on the quantity and concentration of Hg emitted from volcanic sources would also lead to environmental implications. Levels of Hg in Alaska marine mammals have been found to exhibit spatial variability which is not entirely accounted for by anthropogenic sources, suggesting in part a natural source (Ricca et al., 2008; Rea et al., 2020). Volcanoes are a likely natural source to explain variability in Hg uptake by marine mammals over both space and time, as individual eruptions will provide Hg input into the local environment. The immediate availability of any PBM deposited through ash for uptake by local flora or fauna is still not well constrained, but minimum estimates of ash masses deposited over well-defined areas presented here provide a starting point for modeling Hg cycling within the local environments downwind from our target volcanoes.
Different approaches have been used to extrapolate global volcanic Hg estimates over space and time. The two most cited estimates, both of which differentiate between eruptive and persistent degassing contributions, rely on an assumed Hg/SO2 mass ratio in the gas phase to some extent (Nriagu and Becker, 2003; Pyle and Mather, 2003). Both studies found that eruptive contributions made up approximately half to the majority of annual volcanic Hg emissions. Nriagu and Becker (2003) approximated eruptive THg contributions as 57 t a−1 Hg out of a total volcanic Hg flux of 112 t a−1 over the two-decade period of 1980–2000 based on the number of days each volcano was in an eruptive phase versus days on which they were passively degassing. For cases without Hg measurements, they assumed a constant eruptive Hg/SO2 mass ratio of 1.18 × 10⁻⁵. Similarly, Pyle and Mather (2003) approximate a time-averaged Hg flux for small explosive eruptions of ∼500 t a−1 Hg (60–2000 t a−1 Hg range) out of a total volcanic Hg flux of ∼700 t a−1 (80–4,000 t a−1 Hg range) by assuming an Hg/SO2 mass ratio range of 1 × 10⁻⁵–2 × 10⁻⁴ paired with a time-averaged global eruptive SO2 flux. In both studies, persistently degassing volcanoes are assigned a lower Hg/SO2 ratio of 3.18 × 10⁻⁸ (Nriagu and Becker, 2003) and 10−6–10–4 (Pyle and Mather, 2003) compared to eruptive degassing. While Hg/SO2 ratios for persistently degassing volcanoes have been quantified (Aiuppa et al., 2007; Bagnato et al., 2007; Bagnato et al., 2015), no such measurements exist for explosive eruptions. Instead, the higher Hg/SO2 ratio for explosive volcanism was inferred from volcanically attributed records of increased Hg concentration in peat bogs (Roos-Barraclough et al., 2002) and select eruptions in glacial cores (Schuster et al., 2002). Chronology reassessment of glacial records in Chellman et al. (2017) has questioned the assignment of large Hg depositional events in Schuster et al. (2002) as volcanically sourced, so it is possible that the assumptions underpinning a higher Hg/SO2 ratio for active explosions in these studies is not uniformly valid. No direct Hg/SO2 measurements have been collected yet for our target volcanoes in any stage of activity, however we may extrapolate a minimum Hg/SO2 ratio for our target eruptions given the measured PBM emissions and available SO2 output provided in the eruptive history section as 9.9 × 10⁻⁶ for Mount Spurr (1992), 9.8 × 10⁻⁷ for Redoubt Volcano (2009), and 2.5 × 10⁻⁷ for Augustine Volcano (2006). Though these estimates do not account for unconstrained Hg speciation, they are within the range of Hg/SO2 ratios measured from open-conduit quiescent degassing in Bagnato et al. (2015).
Our interpretation of high- and low-Hg emitting volcanoes potentially challenges previous assumptions that Hg accounting based on SO2 emissions may be uniformly applied across all volcanic sources. The global eruptive THg estimate in Nriagu and Becker (2003) is particularly useful for comparison with our study as it includes our three target volcanoes as constituents of the ∼57 t a−1 Hg average eruptive flux. The 20-year period attributes 2.67 t Hg to Augustine Volcano (600 days erupting), 4.73 t Hg to Redoubt Volcano (201 days erupting), and 0.71 t Hg to Mount Spurr (80 days erupting). The 1980–2000 period evaluated for Augustine and Redoubt volcanoes does not encompass our studied eruptions, but their analysis for the Mount Spurr eruption appears to be solely composed of the 1992 events, and therefore should be directly comparable to our results. If we compare the erupted PBM on ash from the 1992 Mount Spurr eruption, determined here as ∼8.23 t Hg, to the inferred eruptive THg estimate from Nriagu and Becker (2003) of 0.71 t Hg, our results suggest that their eruptive THg emissions are underestimated by at least one order of magnitude, and potentially by more as our study considers only PBM and not other Hg phases. The 21-day duration of the Redoubt Volcano 2009 eruption (Wallace et al., 2013) accounts for only ∼10% of the 201 total erupted days over the 20-year period analyzed by Nriagu and Becker (2003), yet our eruptive PBM estimate comprises ∼25% of their 4.73 t eruptive THg estimate, again suggesting that their eruptive THg estimates may be underestimated. For Augustine Volcano, our PBM estimate represents 17 days of explosive-phase plumes (Wallace et al., 2010), or ∼3% of the 80-day period used by Nriagu and Becker (2003), yet comprises ∼6% of Nriagu and Becker’s eruptive THg estimate despite Augustine Volcano appearing to be a low-Hg volcano. These discrepancies show that the most cited explosive global Hg estimates (57 t a−1, Nriagu and Becker, 2003) are likely too low and may not be appropriately accounting for variations in individual volcanic input. Individual-scale comparisons to other studies which consider only global SO2 emissions and a fixed Hg/SO2 ratio are difficult (Nriagu and Becker, 1989; Pyle and Mather, 2003).
Given these comparisons, dedicated analysis of globally significant eruptions would be required to confidently provide a minimum global eruptive PBM contribution for a given year. However, each of our target eruptions are cataloged by the Global Volcanic Program (2013) as among the largest eruptions for those years, so we could estimate that the total contribution of PBM to THg from explosive events is on the order of 10–100 t a−1 given a typical annual number (<10) of VEI 3 or 4 eruptions with comparable eruption mass to our studied volcanoes. This estimate for PBM is within the same order of magnitude as that of THg by Nriagu and Becker (2003), suggesting that the Nriagu and Becker (2003) is likely underestimated. Our constraints for PBM are on the lower end of the range of THg provided within Pyle and Mather (2003), suggesting that this global estimate is likely more accurate though potentially variable depending on the number of large eruptions each year and volcanic sources. We suggest that global eruptive contributions of volcanically-sourced PBM could exceed 100 t a−1 only in a year with atypically numerous eruptions from lower-Hg volcanoes or a single VEI 5+ eruption from a high-Hg volcano. Expanding on the method presented in this study to analyze ash samples from recent large eruptions with corresponding eruption mass estimates may then allow for more precision to be placed on the upper bounds of our estimate.
Analysis of Mercury (Hg) adsorbed onto volcanic ash may provide a logistically straightforward and safe collection method to gain insights into Hg emissions from explosive eruptions, including historic eruptions, where syn-eruption campaign measurements and emissions sampling within the volcanic plume is hazardous. Statistical analysis of Hg data from ash samples collected over a wide range of downwind distances and eruptive events from three different explosive volcanic eruptions shows that, despite variability in PBM concentration among samples, there is no significant difference in Hg concentration on ash either between different eruptive events from the same volcano or by distance from the vent. We find that the most determinative factor for PBM concentration is the volcano of origin, with mean PBM concentrations ranging over three orders of magnitude among our target volcanoes. This finding suggests that certain volcanoes may be comparatively high- or low-Hg emitters, potentially due to local-regional geologic source controls such as Hg-rich subducted sediments or crust.
We present a new approach for providing minimum constraints on Hg released during volcanic eruptions by integrating our PBM data with prior estimates of erupted ash deposit masses. We calculate total PBM from our target eruptions of 8.23, 1.25, and 0.156 t Hg for Mount Spurr (1992), Redoubt Volcano (2009), and Augustine Volcano (2006) volcanic eruptions, respectively. Our estimates are considered a minimum because they do not account for the unconstrained abundance of Hg that remains in the atmosphere. Still, our findings for these three volcanoes exceed previous estimates of Hg emissions for individual volcanoes, which has ramifications for estimates of global volcanic Hg emissions.
The original contributions presented in the study are included in the article/Supplementary Material; further inquiries can be directed to the corresponding author.
DK contributed to project design, sample analysis, and manuscript writing. TL supervised the project, contributed to project design, and aided in manuscript writing. KW and CC contributed towards study area selection, sample selection, and subsampling from existing repositories. DD and CK aided in interpreting the results and manuscript editing.
This work was partially funded through U.S. Geological Survey Cooperative Agreement No. G21AC10384.
The authors would like to thank all original collectors of the samples used in this study, especially Game McGimsey, for their rapid eruption responses and the staff of the Geologic Materials Center for diligently curating the samples. We are also grateful to the Marine Ecotoxicology and Trophic Assessment (METAL) lab at UAF for use of their equipment in sample analysis. Any use of trade, firm, or product names is for descriptive purposes only and does not imply endorsement by the U.S. Government.
The authors declare that the research was conducted in the absence of any commercial or financial relationships that could be construed as a potential conflict of interest.
All claims expressed in this article are solely those of the authors and do not necessarily represent those of their affiliated organizations, or those of the publisher, the editors and the reviewers. Any product that may be evaluated in this article, or claim that may be made by its manufacturer, is not guaranteed or endorsed by the publisher.
The Supplementary Material for this article can be found online at: https://www.frontiersin.org/articles/10.3389/feart.2023.1054521/full#supplementary-material
Aiuppa, A., Bagnato, E., Witt, M. L. I., Mather, T. A., Parello, F., Pyle, D. M., et al. (2007). Real-time simultaneous detection of volcanic Hg and SO2 at La fossa crater, vulcano (aeolian islands, sicily). Geophys. Res. Lett. 34 (21), L21307. doi:10.1029/2007GL030762
Amos, H. M., Jacob, D. J., Holmes, C. D., Fisher, J. A., Wang, Q., Yantosca, R. M., et al. (2012). Gas-particle partitioning of atmospheric Hg(II) and its effect on global mercury deposition. Atmos. Chem. Phys. 12 (1), 591–603. doi:10.5194/acp-12-591-2012
Ayris, P. M., and Delmelle, P. (2012). The immediate environmental effects of tephra emission. Bull. Volcanol. 74, 1905–1936. doi:10.1007/s00445-012-0654-5
Babu, S. R., Nguyen, L. S. P., Sheu, G. R., Griffith, S. M., Pani, S. K., Huang, H. Y., et al. (2022). Long-range transport of La Soufrière volcanic plume to the Western North Pacific: Influence on atmospheric mercury and aerosol properties. Atmos. Environ. 268, 118806. doi:10.1016/j.atmosenv.2021.118806
Bagnato, E., Aiuppa, A., Parello, F., Calabrese, S., D’Alessandro, W., Mather, T. A., et al. (2007). Degassing of gaseous (elemental and reactive) and particulate mercury from mount etna volcano (southern Italy). Atmos. Environ. 41 (35), 7377–7388. doi:10.1016/j.atmosenv.2007.05.060
Bagnato, E., Tamburello, G., Avard, G., Martinez-Cruz, M., Enrico, M., Fu, X., et al. (2015). Mercury fluxes from volcanic and geothermal sources: An update. Geol. Soc. Spec. Publ. 410 (1), 263–285. doi:10.1144/SP410.2
Bobrowski, N., von Glasow, R., Giuffrida, G. B., Tedesco, D., Aiuppa, A., Yalire, M., et al. (2015). Gas emission strength and evolution of the molar ratio of BrO/SO2 in the plume of Nyiragongo in comparison to etna. J. Geophys. Res. Atmos. 120 (1), 277–291. doi:10.1002/2013JD021069
Cameron, C. (2004). The geologic database of information on volcanoes in Alaska (GeoDIVA): A comprehensive and authoritative source for volcanic information. Alsk. GeoSurvey News 7, 2. doi:10.14509/14592
Canil, D., Crockford, P. W., Rossin, R., and Telmer, K. (2015). Mercury in some arc crustal rocks and mantle peridotites and relevance to the moderately volatile element budget of the Earth. Chem. Geol. 396, 134–142. doi:10.1016/j.chemgeo.2014.12.029
Catán, S. P., Bubach, D., Messuti, M. I., Arribére, M. A., and Guevara, S. R. (2020). Mercury in a geothermal and volcanic area in patagonia, southern south America. Atmos. Pollut. Res. 11 (3), 566–573. doi:10.1016/j.apr.2019.12.005
Chellman, N., McConnell, J. R., Arienzo, M., Pederson, G. T., Aarons, S. M., and Csank, A. (2017). Reassessment of the upper fremont glacier ice-core chronologies by synchronizing of ice-core-water isotopes to a nearby tree-ring chronology. Environ. Sci. Technol. 51 (8), 4230–4238. doi:10.1021/acs.est.6b06574
Coufalík, P., Krmíček, L., Zvěřina, O., Meszarosová, N., Hladil, J., and Komárek, J. (2018). Model of mercury flux associated with volcanic activity. Bull. Environ. Contam. Toxicol. 101 (5), 549–553. doi:10.1007/s00128-018-2430-5
Damby, D. E., Peek, S., Lerner, A. H., and Elias, T. (2018). Volcanic ash leachate chemistry from increased 2018 activity of Kīlauea Volcano. U.S. Geological Survey data release. Hawaii. doi:10.5066/P98A07DC
Deely, J. M., and Sheppard, D. S. (1996). Whangaehu River, New Zealand: Geochemistry of a river discharging from an active crater lake. Appl. Geochem. 11, 447–460. doi:10.1016/0883-2927(96)00023-6
Driscoli, C. T., Mason, R. P., Chan, H. M., Jacob, D. J., and Pirrone, N. (2013). Mercury as a global pollutant: Sources, pathways, and effects. Environ. Sci. Technol. 47 (10), 4967–4983. doi:10.1021/es305071v
Edmonds, M., Mather, T. A., and Liu, E. J. (2018). A distinct metal fingerprint in arc volcanic emissions. Nat. Geosci. 11 (10), 790–794. doi:10.1038/s41561-018-0214-5
Edwards, B. A., Kushner, D. S., Outridge, P. M., and Wang, F. (2021). Fifty years of volcanic mercury emission research: Knowledge gaps and future directions. Sci. Total Environ. 757, 143800. doi:10.1016/j.scitotenv.2020.143800
Eichelberger, J., Keith, T., Miller, T., and Nye, C. (1995). The 1992 eruptions of crater peak vent, mount Spurr volcano, Alaska: Chronology and summary. U.S. Geol. Surv. Bull. 220, 2139.
Ermolin, M. S., Fedotov, P. S., Malik, N. A., and Karandashev, V. K. (2018). Nanoparticles of volcanic ash as a carrier for toxic elements on the global scale. Chemosphere 200, 16–22. doi:10.1016/j.chemosphere.2018.02.089
Ermolin, M. S., Ivaneev, A. I., Fedyunina, N. N., and Fedotov, P. S. (2021). Nanospeciation of metals and metalloids in volcanic ash using single particle inductively coupled plasma mass spectrometry. Chemosphere 281, 130950. doi:10.1016/j.chemosphere.2021.130950
Global Volcanism Program (2013). “Volcanoes of the world, v. 4.11.0 (08 jun 2022),” in Global volcanism program. Editor E. Venzke (Smithsonian Institution). doi:10.5479/si.GVP.VOTW4-2013
Horowitz, H. M., Jacob, D. J., Zhang, Y., Dibble, T. S., Slemr, F., Amos, H. M., et al. (2017). A new mechanism for atmospheric mercury redox chemistry: Implications for the global mercury budget. Atmos. Chem. Phys. 17 (10), 6353–6371. doi:10.5194/acp-17-6353-2017
Ilyinskaya, E., Mason, E., Wieser, P. E., Holland, L., Liu, E. J., Mather, T. A., et al. (2021). Rapid metal pollutant deposition from the volcanic plume of Kīlauea, Hawai’i. Commun. Earth Environ. 2, 78. doi:10.1038/s43247-021-00146-2
Kelly, P. J., Kern, C., Roberts, T. J., Lopez, T. M., Werner, C., and Aiuppa, A. (2013). Rapid chemical evolution of tropospheric volcanic emissions from Redoubt volcano, Alaska, based on observations of ozone and halogen-containing gases. J. Volcanol. Geotherm. Res. 259, 317–333. doi:10.1016/j.jvolgeores.2012.04.023
Lindberg, S. E., and Stratton, W. J. (1998). Atmospheric mercury speciation: Concentrations and behavior of reactive gaseous mercury in ambient air. Environ. Sci. Technol. 1 (32), 49–57. doi:10.1021/es970546u
Marumoto, K., Sudo, Y., and Nagamatsu, Y. (2017). Collateral variations between the concentrations of mercury and other water soluble ions in volcanic ash samples and volcanic activity during the 2014-2016 eruptive episodes at Aso volcano, Japan. J. Volcanol. Geotherm. Res. 341, 149–157. doi:10.1016/j.jvolgeores.2017.05.022
Mather, T. A., Witt, M., Pyle, D. M., Quayle, B. M., Aiuppa, A., Bagnato, E. R., et al. (2012). Halogens and trace metal emissions from the ongoing 2008 summit eruption of Kīlauea volcano, Hawai`i. Geochimica Cosmochimica Acta 83, 292–323. doi:10.1016/J.GCA.2011.11.029
McGee, K. A., Doukas, M. P., McGimsey, R. G., Neal, C. A., and Wessels, R. L. (2010). “Emission of SO2, CO2, and H2S from augustine volcano, 2002 – 2008,” in The 2006 eruption of augustine volcano, Alaska. Editors J. A. Power, M. L. Coombs, and J. T. Freymueller (Volcano, Alaska: U.S. Geological Survey Professional Paper 1769), 631–644.
McGimsey, R. G., Neal, C. A., and Riley, C. M. (2001). Areal distribution, thickness, mass, volume, and grain size of tephra-fall deposits from the 1992 eruptions of crater peak vent, Mt. Spurr Volcano, Alaska. Avaliable at: http://pubs.er.usgs.gov.
Miller, T. P., McGimsey, R. G., Richter, D. H., Riehle, J. R., Nye, C. J., Yount, M. E., et al. (1998). Catalog of the historically active volcanoes of Alaska. USA: U.S. Geological Survey. doi:10.3133/ofr98582
Newhall, C. G., and Self, S. (1982). The volcanic explosivity Index (VEI) an estimate of explosive magnitude for historical volcanism. J. Geophys. Res. Oceans 87 (C2), 1231–1238. doi:10.1029/JC087iC02p01231
Nriagu, J., and Becker, C. (2003). Volcanic emissions of mercury to the atmosphere: Global and regional inventories. Sci. Total Environ. 304 (1–3), 3–12. doi:10.1016/S0048-9697(02)00552-1
Ohki, A., Nakajima, T., Hayashi, K., Taniguchi, H., Haraguchi, K., and Takanashi, H. (2016). Levels of Hg and other chemical elements in volcanic ash fall samples erupted from Mt. Sakurajima, Japan. Toxicol. Environ. Chem. 98 (7), 1–9. doi:10.1080/02772248.2016.1139117
Pyle, D. M., and Mather, T. A. (2003). The importance of volcanic emissions for the global atmospheric mercury cycle. Atmos. Environ. 37 (36), 5115–5124. doi:10.1016/j.atmosenv.2003.07.011
Rea, L. D., Castellini, J. M., Avery, J. P., Fadely, B. S., Burkanov, V. N., Rehberg, M. J., et al. (2020). Regional variations and drivers of mercury and selenium concentrations in Steller sea lions. Sci. Total Environ. 744, 140787. doi:10.1016/j.scitotenv.2020.140787
Ricca, M. A., Miles, A. K., and amd Anthony, R. G. (2008). Sources of organochlorine contaminants and mercury in seabirds from the Aleutian archipelago of Alaska: Inferences from spatial and trophic variation. Sci. Total Environ. 406, 308–323. doi:10.1016/j.scitotenv.2008.06.030
Roos-Barraclough, F., Martinez-Cortizas, A., Garcı́a-Rodeja, E., and Shotyk, W. (2002). A 14 500 Year record of the accumulation of atmospheric mercury in peat: Volcanic signals, anthropogenic influences and a correlation to bromine accumulation. Earth Planet. Sci. Lett. 202 (2), 435–451. doi:10.1016/S0012-821X(02)00805-1
Rytuba, J. J. (2003). Mercury from mineral deposits and potential environmental impact. Environ. Geol. 43 (3), 326–338. doi:10.1007/s00254-002-0629-5
Schuster, P. F., Krabbenhoft, D. P., Naftz, D. L., Cecil, L. D., Olson, M. L., Dewild, J. F., et al. (2002). Atmospheric mercury deposition during the last 270 Years: A glacial ice core record of natural and anthropogenic sources. Environ. Sci. Technol. 36 (11), 2303–2310. doi:10.1021/es0157503
Smichowski, P., Gómez, D., Rosa, S., and Polla, G. (2003). Trace elements content in size-classified volcanic ashes as determined by inductively coupled plasma-mass spectrometry. Microchem. J. 75 (2), 109–117. doi:10.1016/S0026-265X(03)00089-4
Stewart, C., Damby, D. E., Tomašek, I., Horwell, C. J., Plumlee, G. S., Armienta, M. A., et al. (2020). Assessment of leachable elements in volcanic ashfall: A review and evaluation of a standardized protocol for ash hazard characterization. J. Volcanol. Geotherm. Res. 392, 106756. doi:10.1016/j.jvolgeores.2019.106756
Stracquadanio, M., Dinelli, E., and Trombini, C. (2003). Role of volcanic dust in the atmospheric transport and deposition of polycyclic aromatic hydrocarbons and mercury. J. Environ. Monit. 5 (6), 984–988. doi:10.1039/B308587B
U.S. EPA (1998). EPA method 7473 (SW-846): Mercury in solids and solutions by thermal decomposition, amalgamation, and atomic absorption spectrophotometry. Washington D.C: EPA. Avaliable at: https://www.epa.gov/esam/epa-method-7473-sw-846-mercury-solids-and-solutions-thermal-decomposition-amalgamation-and.
Varekamp, J. C., and Buseck, P. R. (1986). Global mercury flux from volcanic and geothermal sources. Appl. Geochem. 1 (1), 65–73. doi:10.1016/0883-2927(86)90038-7
von Glasow, R. (2010). Atmospheric chemistry in volcanic plumes. Proc. Natl. Acad. Sci. 107 (15), 6594–6599. doi:10.1073/pnas.0913164107
Wallace, K. L., Neal, C. A., and McGimsey, R. G. (2010). Timing, distribution, and character of tephra fall from the 2005-2006 eruption of augustine volcano. USA: US Geological Survey Professional Paper. doi:10.3133/pp17699
Wallace, K. L., Schaefer, J. R., and Coombs, M. L. (2013). Character, mass, distribution, and origin of tephra-fall deposits from the 2009 eruption of Redoubt volcano, Alaska-highlighting the significance of particle aggregation. J. Volcanol. Geotherm. Res. 259, 145–169. doi:10.1016/j.jvolgeores.2012.09.015
Wedepohl, H. K. (1995). The composition of the continental crust. Geochimica Cosmochimica Acta 59 (7), 1217–1232. doi:10.1016/0016-7037(95)00038-2
Werner, C., Kelly, P. J., Doukas, M., Lopez, T. M., Pfeffer, M., McGimsey, R., et al. (2013). Degassing of CO2, SO2, and H2S associated with the 2009 eruption of Redoubt volcano, Alaska. J. Volcanol. Geotherm. Res. 259, 270–284. doi:10.1016/j.jvolgeores.2012.04.012
Wilson, F. H., Hults, C. P., Mull, C. G., and Karl, S. M. (2015). Geologic map of Alaska. U.S. Geol. Surv. Sci. Investig. Map 3340, 196. doi:10.3133/sim3340
Witt, M. L. I., Mather, T. A., Pyle, D. M., Aiuppa, A., Bagnato, E., and Tsanev, V. I. (2008). Mercury and halogen emissions from masaya and telica volcanoes, Nicaragua. J. Geophys. Res. Solid Earth 113 (6), B06203–B06215. doi:10.1029/2007JB005401
Zambardi, T., Sonke, J. E., Toutain, J. P., Sortino, F., and Shinohara, H. (2009). Mercury emissions and stable isotopic compositions at vulcano island (Italy). Earth Planet. Sci. Lett. 277 (1), 236–243. doi:10.1016/j.epsl.2008.10.023
Zhang, P., and Zhang, Y. (2022). Earth system modeling of mercury using CESM2 – Part 1: Atmospheric model CAM6-Chem/Hg v1.0. Geosci. Model. Dev. 15, 3587–3601. doi:10.5194/gmd-15-3587-2022
Keywords: mercury, volcano, ash, eruption, Mount Spurr, Redoubt Volcano, Augustine Volcano
Citation: Kushner DS, Lopez TM, Wallace KL, Damby DE, Kern C and Cameron CE (2023) Estimates of volcanic mercury emissions from Redoubt Volcano, Augustine Volcano, and Mount Spurr eruption ash. Front. Earth Sci. 11:1054521. doi: 10.3389/feart.2023.1054521
Received: 26 September 2022; Accepted: 01 February 2023;
Published: 27 February 2023.
Edited by:
Ying-Jui Hsu, Nanyang Technological University, SingaporeReviewed by:
Jacopo Cabassi, National Research Council (CNR), ItalyCopyright © 2023 Kushner, Lopez, Wallace, Damby, Kern and Cameron. This is an open-access article distributed under the terms of the Creative Commons Attribution License (CC BY). The use, distribution or reproduction in other forums is permitted, provided the original author(s) and the copyright owner(s) are credited and that the original publication in this journal is cited, in accordance with accepted academic practice. No use, distribution or reproduction is permitted which does not comply with these terms.
*Correspondence: D. Skye Kushner, ZHNrdXNobmVyQGFsYXNrYS5lZHU=
Disclaimer: All claims expressed in this article are solely those of the authors and do not necessarily represent those of their affiliated organizations, or those of the publisher, the editors and the reviewers. Any product that may be evaluated in this article or claim that may be made by its manufacturer is not guaranteed or endorsed by the publisher.
Research integrity at Frontiers
Learn more about the work of our research integrity team to safeguard the quality of each article we publish.