 Jinrui Gao1,2
 Yingfeng Ji
 Weiling Zhu
 Chaodi Xie
- 1State Key Laboratory of the Tibetan Plateau Earth System, Environment and Resources (TPESER), Institute of Tibetan Plateau Research, Chinese Academy of Sciences, Beijing, China
- 2Seismological Bureau of the Tibet Autonomous Region, Lasha, China
- 3University of the Chinese Academy of Sciences, Beijing, China
- 4Department of Geophysics, Yunnan University, Kunming, China
Seismic quiescence or enhanced phenomena are anomalous changes against the background of normal seismic activity. Preliminary studies have found that earthquakes with a magnitude of ML≥4 often occur at a low occurrence frequency before giant earthquakes in Tibet. This study analyzed the catalog of ML≥4 earthquakes from 2008 to 2022 and examined the anomalous occurrence of ML≥4 earthquakes preceding most ML≥6 earthquakes. When the monthly occurrence frequency of ML≥4 earthquakes was lower than 4 times over six consecutive months, the subsequent occurrence of ML≥6 earthquakes was highly likely as evidenced by observations. The anomalous characteristics of low-intensity activities were analyzed as a medium- and short-term forecasting index for large earthquakes in the Tibetan area.
1 Introduction
Statistical analysis of quiescent seismic activity anomalies constitutes one of the methods used in seismological forecasting (e.g., Mogi, 1969; Huang et al., 2001; Wyss et al., 2004; Gentili et al., 2017; Gentili et al., 2019; Shi, 2020; Liu, 2021). The seismic quiescence area reflects the accumulation of regional strain during a certain period and thus is meaningful (Sobolev et al., 2002; Zöller et al., 2002; Chen et al., 2005; Wu and Chiao, 2006; Huang, 2008; Qin et al., 2015; Wen et al., 2016). Obvious moderate earthquake quiescence before many large earthquakes has been suggested and considered a precursor of strong earthquakes with physical significance as an important basis for earthquake forecasting (e.g., Huang et al., 2001; Zhang, 2001; Di Giovambattista and Tyupkin, 2004; Wyss et al., 2004; Zhu et al., 2012; Wang et al., 2014; Gentili et al., 2017; Wang et al., 2017; Chen, 2018; Zhang et al., 2018; Gentili et al., 2019; Katsumata and Nakatani, 2021). The seismic activity in mainland China indicates the alternation of strong and weak segments and associated fluctuations (e.g., Su, 1996), and the accumulated seismic data for northern China and southwestern China (Yunnan) suggest an appropriate minimum limit of the magnitude and quiescence period for seismic forecasting using the optimal parameter combination (e.g., Han, 1998; Han et al., 2006a; 2006b).
Although the Tibetan Plateau is vast and sparsely populated, earthquakes of magnitude six and above are highly destructive and can easily result in casualties and property losses (Tillotson, 1951; Liu et al., 2014; Liu et al., 2015). The destructive earthquakes caused direct economic losses of approximately 1,280 billion Yuan from 1993 to 2016, nearly equal to 80% of China’s fiscal revenue in 2016 (e.g., Li et al., 2018). For instance, the 2020 Yutian earthquakes affected an area of approximately 128,310 km2 with 455,000 inhabitants, causing direct economic losses of 1,080 million Yuan, and 2,970,054 m2 of houses in rural residential areas were completely destroyed or seriously damaged (e.g., Ni and Hong, 2014). From the perspective of reducing earthquake disasters, it is of great significance to explore and study forecasting methods for large earthquakes. Previous studies have also suggested that before the occurrence of M>6 earthquakes in Tibet (e.g., Chen, 2007; Liu et al., 2008; Yu et al., 2013; Tian et al., 2021), the epicenter and surrounding regions of earthquakes with a magnitude of ML≥4 were characterized by a large quiescent area (Chen et al., 2014). To further explore the relationship between low-intensity activity anomalies of ML≥4 earthquakes and large earthquakes, we conducted spatiotemporal scans of ML≥4 earthquakes in the Tibet Autonomous Region and adjacent areas (hereafter referred to as Tibet), performed statistical analysis of low-intensity anomalies to predict their significance and criteria, and determined medium- and short-term predictors of ML≥6 earthquakes with satisfactory regularity and reliability.
2 Data and methods
Regarding the sparse earthquake monitoring network in Tibet and because the magnitude of completeness is the ML≥3 level, the lower limit of the magnitude in this study was selected as ML=4.0. The catalog of M<5 earthquakes used in this study was a catalog of monthly earthquake reports obtained from the Tibet Regional Seismological Network from 1987 to 2022 (Seismological Bureau of the Tibet Autonomous Region), and the catalog of earthquakes of ML≥5 was compiled by the China Earthquake Network Center (China Earthquake Administration). The magnitude completeness for the regional catalog over running time windows has been checked to be ML≥3.0 and confirmed not to influence the ML≥4 earthquake occurrence frequency change. During daily earthquake forecasting, we adopted a very convenient statistical method to track this anomaly. We defined the occurrence frequency of fewer than 24 ML≥4 earthquakes over half a year in Tibet as a low-intensity anomaly and conducted time scans for the ML≥4 earthquake low-intensity occurrence within a 6-month window and 1-month steps. In this study, we focus on the Tibetan region because a great number of multidisciplinary studies have been conducted on forecasting methods for larger earthquakes, and the Tibetan Plateau has one of the highest seismic hazards in the world, such as the 1950 Assam M8.6 earthquake (e.g., Tillotson, 1951).
The study area was selected in the Tibet Autonomous Region and adjacent areas within 50 km around the Tibet Autonomous Region, covering the majority of the Tibetan Plateau (Figure 1). Considering the occurrence frequency of ML≥4 earthquakes in Tibet and adjacent areas, there is a notable difference before and after 2008 (Figure 2). From 1987 to 2007, the average annual recurrence frequency was 19 times, but from 2008 to 2022, the average annual recurrence frequency increased to >50 times. This could be explained by the rapid construction of the seismic monitoring network in 2008, namely, the 10th Five-Year Plan project. Before 2007, there were only five seismic stations in Tibet, and the recorded ML≥4 earthquake catalog was incomplete (Gao et al., 2015). However, after 2008, the number of seismic stations in the Tibetan region significantly increased, and the monitoring capacity was greatly improved (e.g., Gao et al., 2015).
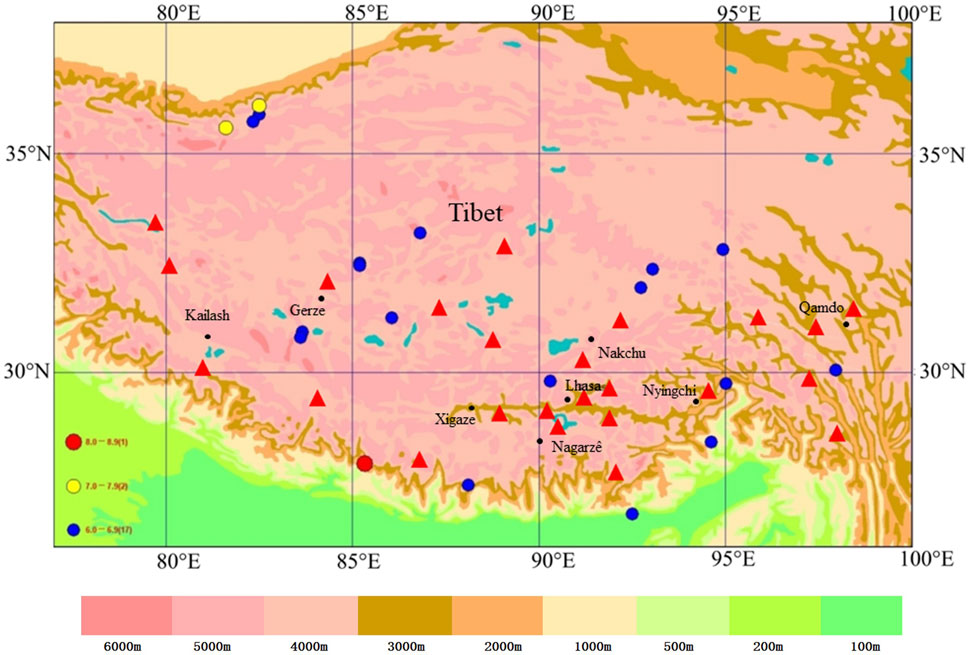
FIGURE 1. Epicenter distribution of ML≥6 earthquakes in Tibet since 2008. The background color indicates the height. The colored circles indicate the epicenters of the ML≥6 earthquakes recorded by the China Earthquake Network Center. The red triangles indicate the seismic stations in Tibet in 2018.
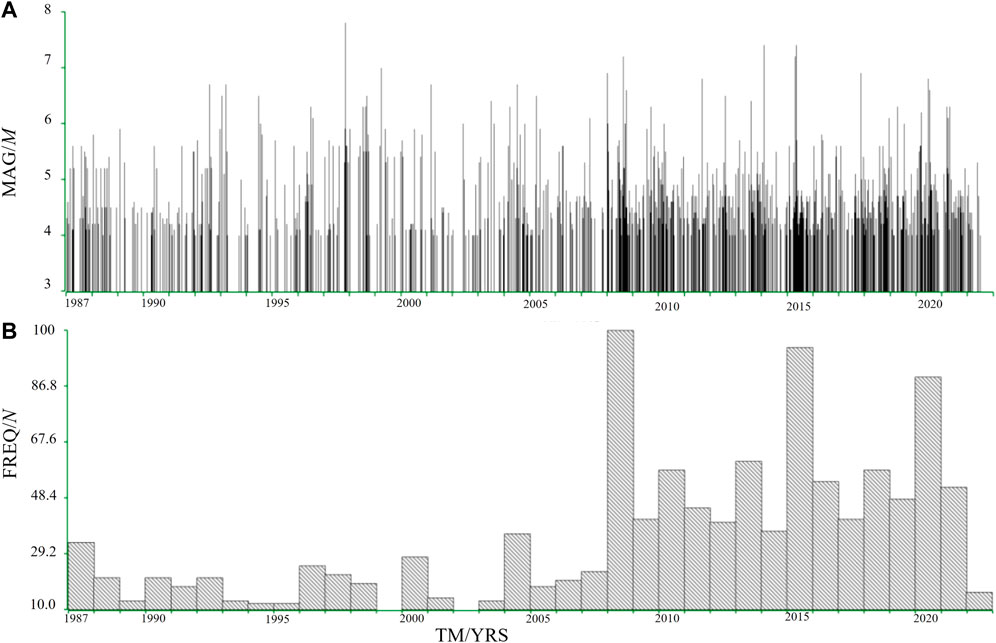
FIGURE 2. Magnitude (MAG)-time (TM) and occurrence frequency (FREQ)-time diagrams of the ML≥4 earthquake occurrences from 1987 to 2022. The unit of time is years (YRS) (A) The earthquake magnitude adopts the ML scale according to the local network (B) The occurrence frequency uses the number (N) of times per year as a unit.
The minimum magnitude of completeness (Mc) in earthquake catalogs plays an important role in studying seismicity and assessing seismic hazards (e.g., Feng et al., 2010; Jiang and Wu, 2011; Yu et al., 2020). The specific calculation methods for Mc are the maximum curvature method (MAXC; Woessner et al., 2004) and the goodness-of-fit method (GFT; Wiemer and Wyss, 2000), or the entire magnitude range method (EMR; Woessner and Wiemer, 2005). Another method for calculating Mc is based on non-G-R relationships, such as the magnitude sequence (Schorlemmer and Woessner, 2008). In this study, we use the combination of MAXC, GFT and magnitude-sequence methods based on the software package ZMAP (Stefan Wiemer, ETH) according to the G-R law and the maximum curvature of logN-M correlation analysis (Figure 3; Supplementary Table S1). The advantage of complementing the earthquake-sequence method is that it can avoid the significant reduction in seismic monitoring capability in the aftershock area or even in a larger area after a strong earthquake (Aki, 1965). The observed earthquakes were randomly sampled, and the statistics were calculated after each sampling. The standard variance of each statistic was estimated as ΔMc (Yu et al., 2020). For these reasons, this study considered the period from 2008 to 2022, during which the minimum magnitude of the Tibetan network could reach 2.5–3.5 and an average of <3.5 (Figure 3; Table 1 and Supplementary Table S1). By scanning the activity of ML≥4 earthquakes from 2008 to 2022, we found that the monthly occurrence frequency of M≥4 earthquake activity was than a certain value (e.g., 4–8 times per month), concordant with the subsequently occurring M>6 earthquakes. This type of forecasting index can hardly be applied in forecasting because the time length of each seismic quiescence period differs. For instance, the earthquake quiescence phenomena before a strong earthquake and the quiescence interval between two strong earthquakes notably differ, which must be solved before using the seismic quiescence period as an effective earthquake forecasting index (e.g., Ping et al., 2001; Zhuang et al., 2002; Console et al., 2010; Zhu et al., 2014). The identification of spontaneous and triggered earthquakes is performed statistically. We applied the method to the seismicity of Tibet, analyzed the sensitivity of the results and mapped the background seismicity in Tibetan seismic areas (Figure 2). In addition, the aftershock elimination method was not incorporated to this study because the removal of aftershocks reduces the event number and thus enhances the observed seismic quiescence, which remains within the range of low-intensity anomalies and follows our estimates.
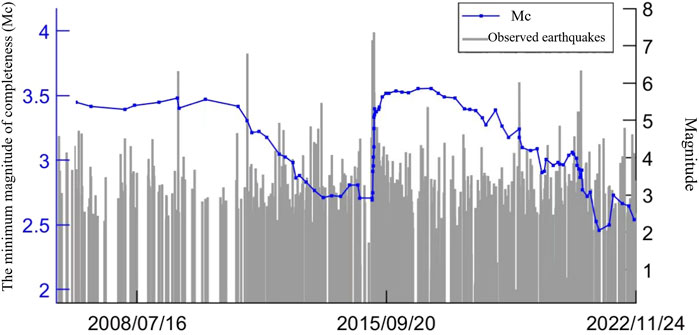
FIGURE 3. Variation in the minimum magnitude of completeness (Mc, blue curve) over 14 years in this study based on the MAXC and GFT methods using the software package of ZMAP (Stefan Wiemer, ETH).
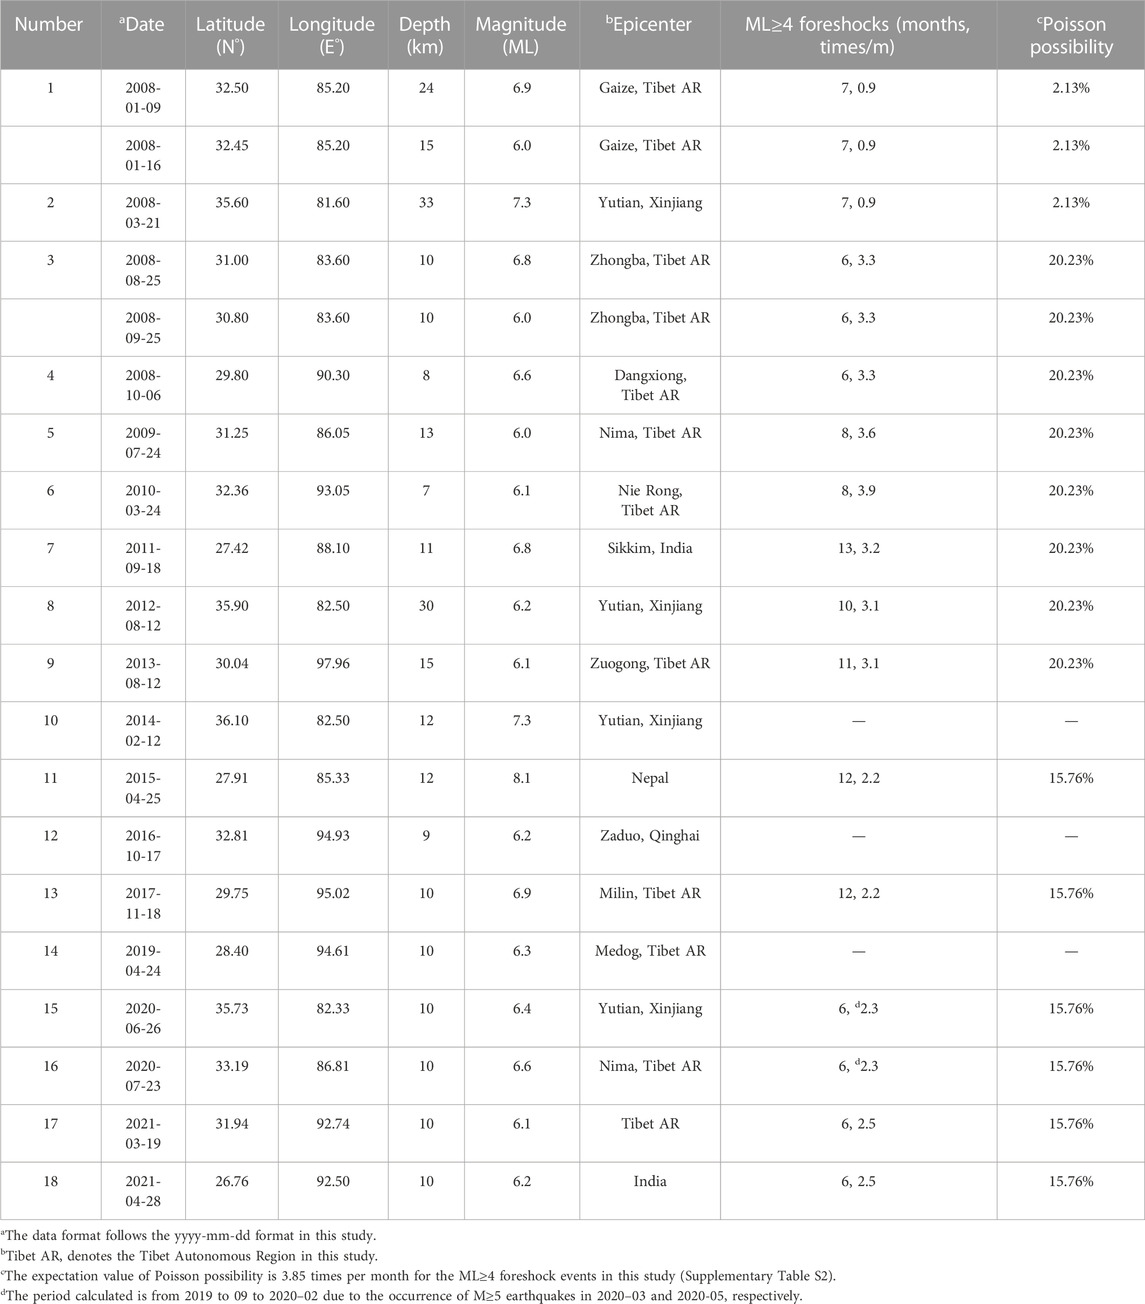
TABLE 1. Parameters of the ML≥6 earthquakes in Tibet from 2008 to 2022.
3 Results
3.1 Statistics of the low-intensity occurrence of ML≥4 earthquakes immediately before strong earthquakes
The formation of the Tibetan Plateau had a profound effect on geological and geophysical evolution (e.g., Lei and Zhao, 2016). The eastern Tibetan region is composed of several tectonic blocks and separated by several very long active faults, such as the Kunlun fault, the Longmenshan (LMS) fault, the Xianshuihe fault, the Xiaojiang fault, and the Red River fault (Lei and Zhao, 2016). Along these faults, numerous large earthquakes have occurred frequently. Tibet upper crustal faulting is currently active throughout the orogen, with exceptions along a few north-trending rifts in southern Tibet, where earthquakes may have occurred within the lower crust or upper mantle lithosphere (e.g., Taylor and Yin, 2009).
From 2008 to 2022, a total of nearly twenty earthquakes of magnitude ML≥6 occurred in the study areas (Figure 1; Table 1), of which three earthquakes exhibited magnitude ML≥7, including two earthquakes of magnitude 7.3 in Yutian and Xinjiang and one earthquake of magnitude 8.1 in Nepal (within 50 km from the border). The minimum magnitude of completeness (Mc) in the study area has been decreasing since 2008 (Figure 3), with the highest Mc close to 3.5 from 2008 to 2011 and between 3.5 and 2.8 from 2011 to 2015, and the overall decrease in Mc from 2015 to 2021, with a minimum value of roughly 2.3 (Figure 3). The decrease in Mc value with time reflects the increase in seismic monitoring capability in the study area with time (e.g., Long et al., 2009). Then, the monthly occurrence frequency characteristics of ML≥4 earthquakes before ML≥6 earthquakes and the temporal correlation between fore- and mainshocks were analyzed (e.g., Guo, 2019). We calculate the expectation values of ML≥4 events times per month preceding the ML≥6 earthquakes in the study period (Supplementary Table S2) and further analyze the variation in the Poisson possibility distribution of the ML≥4 foreshock occurrence over the entire 14 years. The ML≥4 foreshocks exhibited Poisson probability of >10% in the consecutive months preceding the ML≥6 events (Fig. S1).
During data analysis, we found that the monthly occurrence frequency of ML≥4 earthquakes was greatly affected by the aftershocks of M≥5 earthquakes. In January 2008, two consecutive earthquakes of magnitude ML≥6 occurred in Gaize, and the activity characteristics of ML≥4 earthquakes from June 2007 to January 2008 were used for analysis. Figures 4, 5 show the time series and monthly occurrence frequency of earthquakes of magnitude ML≥4 from 2008 to 2022. Among the listed groups of M≥6 earthquakes and their foreshocks, we found no anomaly before the subsequent M6.0 earthquake (the 2009 Nima earthquake), which likely contained undetected events. The remaining earthquakes corresponded well to the quiescence phenomenon of ML≥4 earthquakes with a monthly occurrence frequency of ≤4 times over six consecutive months. Before the M6.6 earthquake in Dangxiong on 6 October 2008, affected by the M6.8 earthquake in Zhongba on 25 August 2008, and the M6.0 earthquake in Zhongba on 25 September 2008, the monthly occurrence frequency of ML≥4 earthquakes was high, and this could be regarded as an anomaly corresponding to strong earthquakes. Based on the above analysis, the monthly occurrence frequency of ML≥4 earthquakes was generally low before the occurrence of ML≥6 earthquakes in Tibet, e.g., at most 4 ML≥4 earthquakes over six consecutive months. The potential correspondence between the monthly occurrence frequency of the time series of ML≥4 events and distributed ML≥6 events was visualized (Figures 4, 5).
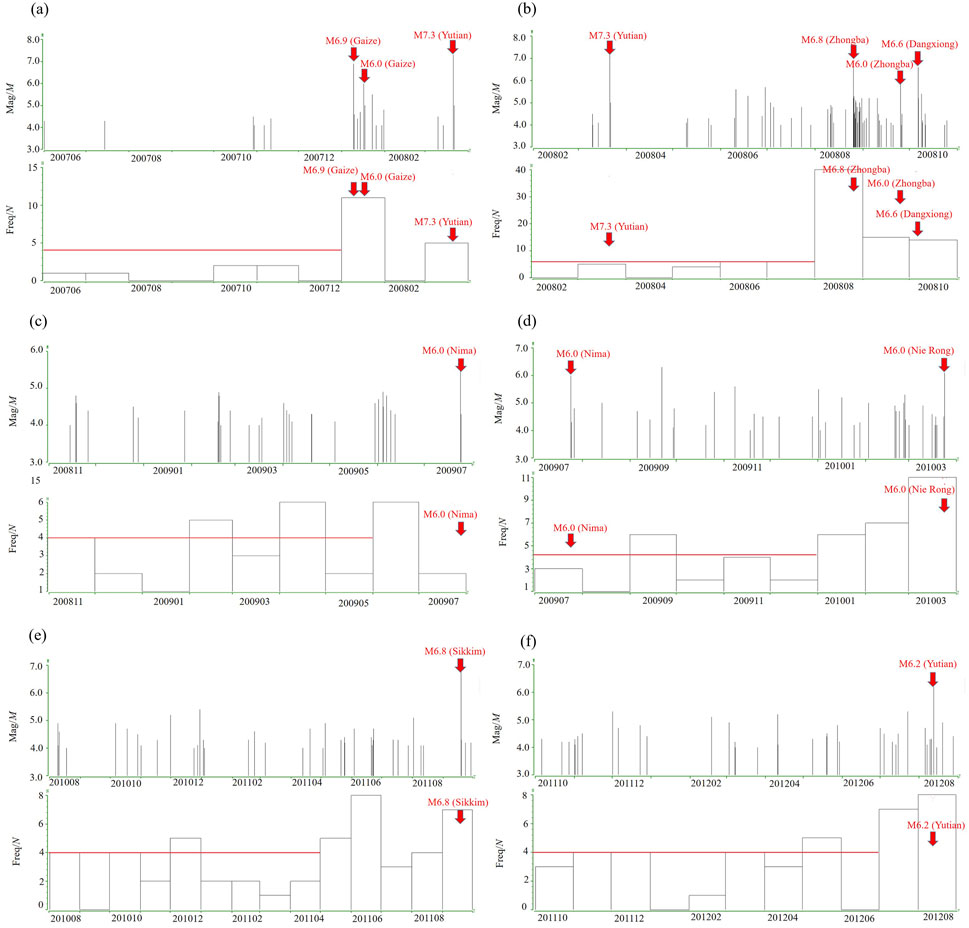
FIGURE 4. Magnitude–time and occurrence frequency–time diagrams of the ML≥4 earthquakes during the different periods (A) from June 2007 to March 2008 (B) from February 2008 to October 2008 (C) from November 2008 to July 2009 (D) from July 2009 to March 2010 (E) from August 2010 to September 2011 (F) from October 2011 to August 2012.
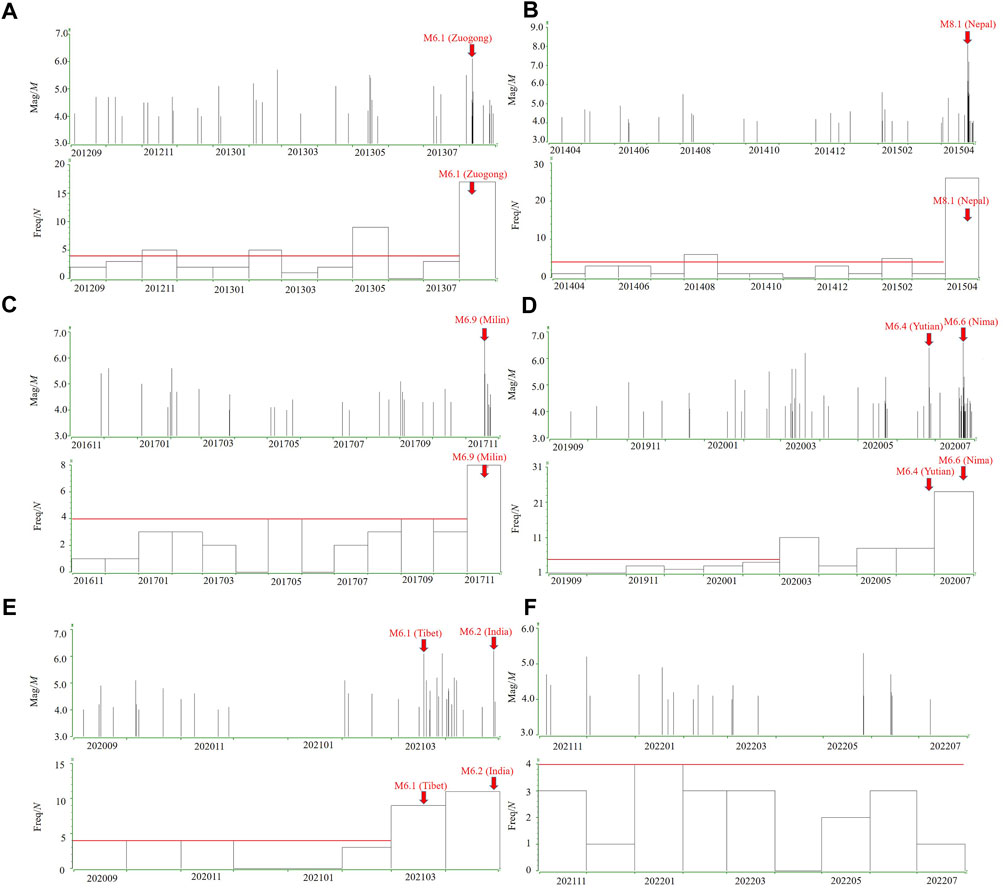
FIGURE 5. Magnitude-time and occurrence frequency-time diagrams of the ML≥4 earthquakes occurring during the different periods (A) from September 2012 to August 2013 (B) from April 2014 to April 2015 (C) from November 2016 to November 2017 (D) from September 2019 to July 2020 (E) from September 2020 to April 2021 (F) from November 2021 to June 2022.
Accordingly, in recent decades, the average monthly occurrence frequency of ML≥4 earthquakes in Tibet has remained above 4.2, and the meaningful low-intensity seismic activity for ML≥6 event forecasting indicates that the monthly occurrence frequency should decrease to <4 over >4 consecutive months (e.g., Li and Li, 1999; Ma et al., 2017). In detail, we noted that low-intensity earthquake activities corresponded to the subsequent occurrence of 15 ML≥6 events (>83% in total), as shown in the subfigures. For example, the low-intensity events between June 2007 and July 2008 exhibited a suitable agreement with the Gaize M6.9 (2008-01-09, Figure 4A), Yutian M7.3 (2008-03-21, Figure 4B), Zhongba M6.8 (2008-08-25, Figure 4B), Zhongba M6.0 (2008-09-25, Figure 4B), and Dangxiong M6.6 (2008-10-06, Figure 4B) earthquakes; the low-intensity events between November 2008 and May 2009 corresponded with the Nima M6.0 earthquake (2009-07-24) (Figures 4C, D). A similar correspondence is shown in Figures 4C–F, Figures 5A–F until 2022. However, there were still 3 ML≥6 earthquakes without the aforementioned low-intensity precursor of ML≥4 events before strong earthquakes, i.e., the Yutian M7.3 (2014-02-12), Zaduo M6.2 (2016-10-17), and Medog M6.3 (2019-04-24) earthquakes, which could be attributable to unclear mechanisms.
The statistical results revealed that 15 of the 18 ML≥6 earthquakes exhibited low-intensity activity of ML≥4 earthquakes lasting for more than 6 months before earthquake occurrence, accounting for >83% of the total number, and these strong earthquakes occurred within 4 months after the end of the low-intensity events. Among them, 8 ML≥6 earthquakes occurred during the continuous low-intensity activity period, 4 ML≥6 earthquakes occurred within 1–2 months after the low-intensity activity ended, and 3 ML≥6 earthquakes occurred within 3–4 months. Before the occurrence of large earthquakes, the monthly occurrence frequency of ML≥4 earthquakes was low on average, but the low-intensity period was not proportional to the magnitude of large earthquakes, and the low occurrence frequency did not significantly increase before large earthquakes, similar to short-term enhancement, which may be one of the characteristics of local seismicity in Tibet (Chen and Sun, 2004).
3.2 Spatial location analysis of large earthquakes
Seismic quiescence before large earthquakes has been found and demonstrated in several regions of the world, such as the 1995 M7.2 Kobe (Japan) earthquake (Huang et al., 2001), 2000 Mw 6.8 Uglegorskoe (Russia) earthquake (Wyss et al., 2004), 2016 Mw 6.0 Amatrice (Italy) earthquake (Gentili et al., 2017), 2017 Mw 7.3 Sarpol Zahab (Iran) earthquake (Gentili et al., 2019). Wyss and Habermann (1988) defined the above precursory seismicity quiescence as a statistically significant reduction in the activity rate before mainshock occurrence compared to the background rate within the same study area. Chen et al. (Chen et al., 2014) studied the moderate seismic activity in the surrounding areas of M>6.5 mainshocks in western China since 1970 and found that precursor large-scale seismicity quiescence occurred at the epicenter and surrounding areas of the mainshock. Spatially, a rate decrease occurred in the main shock source region and its vicinity. Currently, the detection of seismic quiescence before a major earthquake remains an exciting new possibility in earthquake physics (Chen et al., 2005) and represents a new and promising method to realize earthquake forecasting (Kisslinger, 1988; Wyss et al., 1997; Hainzl et al., 2000; Rundle et al., 2000; Keilis-Borok, 2002; Zöller et al., 2002; Turcotte et al., 2003; Takahashi and Kasahara, 2004).
We analyzed the spatial distribution of the abovementioned 15 ML≥6 large earthquakes corresponding to low-intensity precursory anomalies and found that most of these large earthquakes occurred in the quiescence area of ML≥4 earthquakes. Among them, 13 earthquakes (86%) occurred within the quiescence area, and two earthquakes did not occur in the quiescence area (Table 2). Here, we compare the location of the epicenters of the fore- and mainshocks (Figure 6). Since November 2021, low-intensity anomalies of ML≥4 earthquakes have again occurred, and ML≥4 earthquake quiescence areas have been formed in western, central and southeastern Tibet. These areas are high-risk areas for future ML≥6 earthquakes after July 2022.
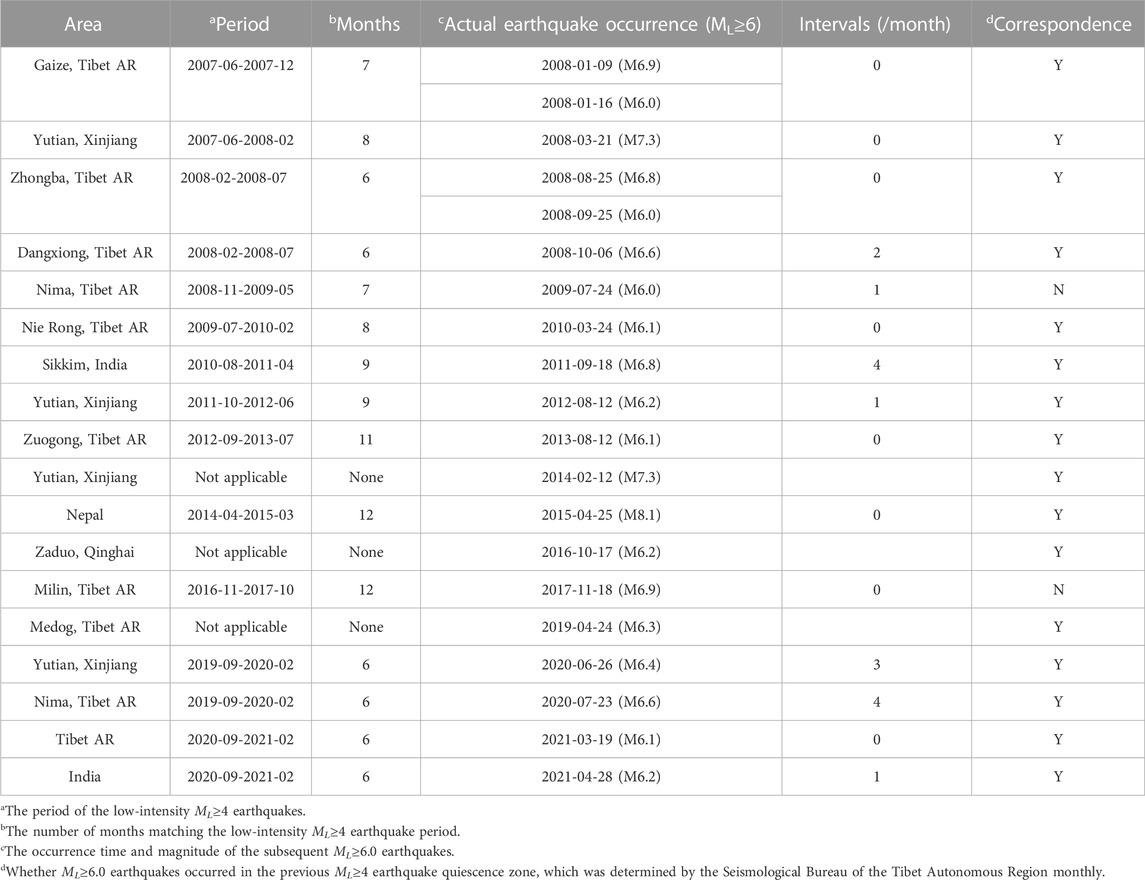
TABLE 2. Correspondence of the low-intensity ML≥4 earthquakes to the ML≥6 mainshocks.
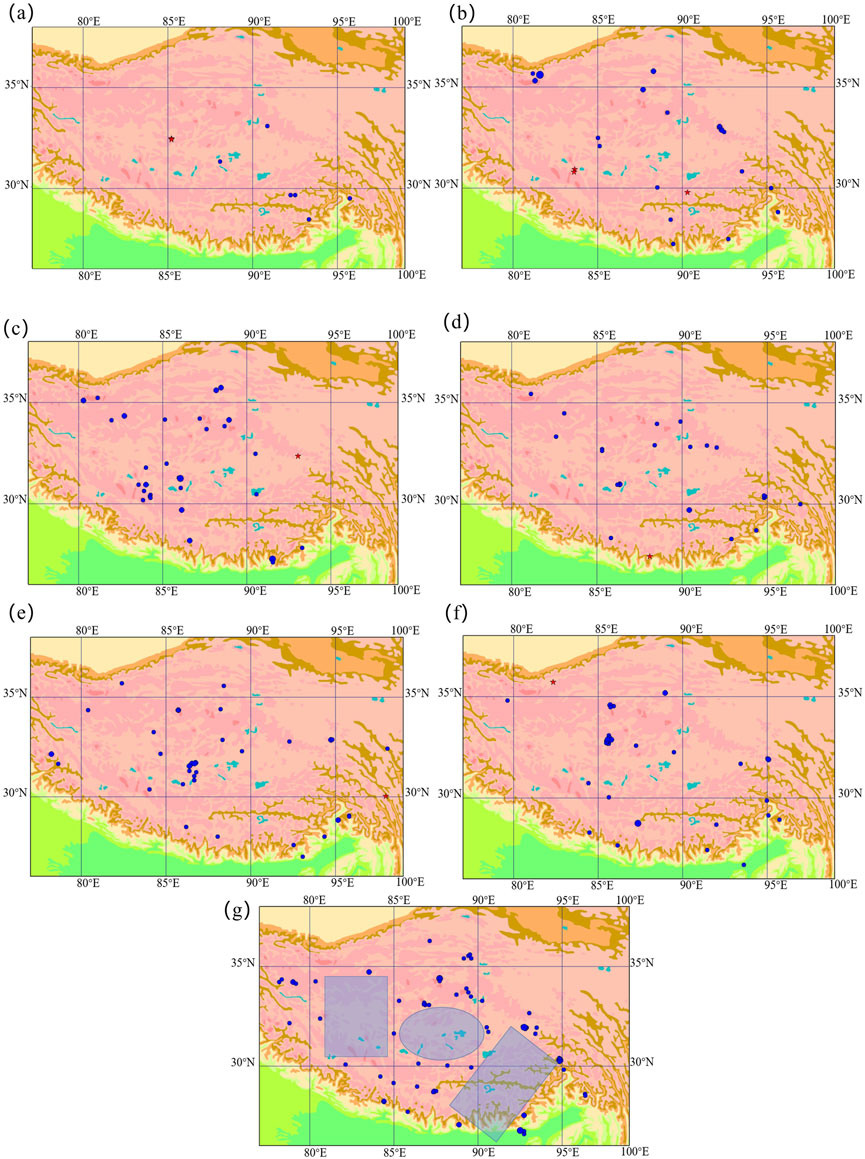
FIGURE 6. Distribution of the ML≥4 earthquakes and subsequent ML≥6 earthquakes. The blue solid circles indicate the ML≥4 foreshocks. The red stars represent the ML≥6 mainshocks (A) Gaize M6.9 (2009-01-09) and Gaize M6.0 earthquakes (2008-01-16) (B) Zhongba M6.8 (2008-08-25), Zhongba M6.0 (2008-09-25), and Dangxiong M6.6 earthquakes (2008-10-06) (C) Nie Rong M6.1 earthquake (2010-03-24) (D) Sikkim M6.8 earthquake (2011-09-18) (E) Zuogong M6.1 earthquake (2013-08-12) (F) Yutian M6.4 earthquake (2020-06-26) (G) Schematic illustration of estimating the loci of impending ML≥6 earthquakes based on ML≥4 foreshocks from November 2021 to July 2022.
4 Discussion
Earthquake quiescence or enhancement represents an anomalous change against the background of normal activity, and this anomaly could provide a certain predictive significance for the time and location of strong earthquakes (e.g., Ping et al., 2000; Ma and Chen, 2011; Chen et al., 2013). From the perspective of reducing earthquake disasters, it is important to improve the forecasting methods for M>6 earthquakes. In Tibet, there is no systematic study of the forecasting performance of the earthquake quiescence anomaly due to technical and instrumental limits, but based on a recently greatly improved seismic network, we found that the ML≥4 seismic activity in Tibet was consistently associated with a low monthly occurrence frequency and moderate intensity in this region.
Earthquake occurrence imposes a certain effect on forecasting (Zhang et al., 2019). Subsequently, it is necessary to determine the anomalous characteristics of ML≥4 seismic activities to further explore the relationship between low-intensity ML≥4 seismic activity anomalies and strong earthquakes and to determine additional short-term forecasting indicators for strong earthquakes. The period of low-intensity seismicity is related to the magnitude of earthquakes above M6. However, there exists no direct proportional relationship between the period of low-intensity seismicity and subsequent strong earthquake magnitude according to our current study (Figures 4, 5), and more comprehensive evaluation research should be performed for hazardous earthquake forecasting.
Through analysis, we found that there occurred a suitable correspondence between strong earthquakes and the low-intensity activities of ML≥4 earthquakes, lasting for more than 6 months (e.g., Yan et al., 2012). The average monthly frequency of ML≥4 earthquakes in Tibet and neighboring areas since 2007 is 4.71 times, and the monthly frequency is generally considered low when it is less than 4 (Supplementary Table S2). In this study, the cumulative semiannual frequency of ML≥4 earthquakes in Tibet and neighboring areas is defined as low-frequency anomalies when the semiannual frequency is less than 24. However, sometimes influenced by aftershocks of large earthquakes or ML4 clusters, there are individual months with more than four earthquakes of ML≥4 during the duration of low frequency. The statistics of this study find that better correspondence with earthquakes of M≥ 6 is a period of sustained weak ML ≥ 4 seismic activity, and these occasional slightly higher frequencies have less impact. We compared different time windows to assess the low-intensity activity of events and found that the time window of the month range is one of the most effective and convenient windows for analyzing the event occurrence frequency, possibly due to the triggering effect of short-period Earth tides, including semidiurnal and diurnal tides (e.g., Klein, 1976). In this study, we counted the low-intensity anomalies from January 2007 to July 2022, with a window length of 6 months, in sequence, as shown in Supplementary Table S3. Since 2007, a total of 12 low-intensity anomalies have occurred, and except for the ongoing anomalies indicating subsequent corresponding earthquakes, nine of the previous 11 anomalies corresponded to ML≥6 earthquakes, with a corresponding rate of 82%. After eight low-intensity anomalies ended, ML≥6 earthquakes occurred within 2 months, accounting for 73% of the total number (Figure 7). To scientifically and objectively evaluate the effectiveness of this method for forecasting earthquakes, this study uses the R-value calculation method proposed by Xu (1993) in the evaluation of forecast effectiveness:
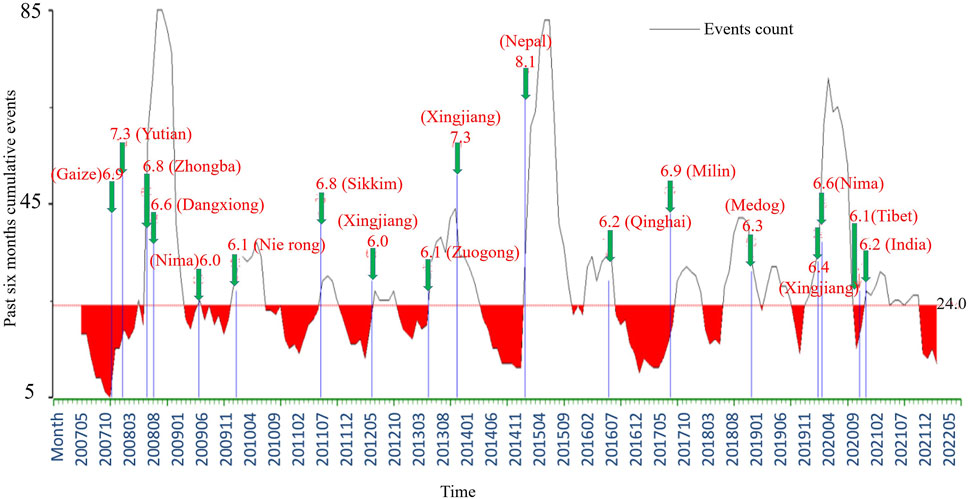
FIGURE 7. Occurrence frequency–time diagram of the ML≥4 earthquakes in Tibet from 2008 to 2022. The black curve indicates the cumulative events in the past 6 months. The red threshold line indicates the occurrence frequency of fewer than 24 ML≥4 earthquakes over half a year in Tibet, and the green arrows indicate ML≥6 earthquakes.
5 Conclusion
In this study, spatial and temporal scanning analysis of ML≥4 earthquakes and subsequent ML≥6 earthquakes in Tibet and adjacent areas was conducted via statistical test methods, and the following conclusions could be drawn: (Katsumata, 2011; Traitangwong and Pailoplee, 2017).
1) The low-intensity occurrence (≤24 times every 6 months) of ML≥4 earthquakes lasting for more than 6 months from 2008 to 2022 corresponded well to the subsequent occurrence of ML≥6 earthquakes in Tibet.
2) ML≥6 mainshocks preferentially occurred in the quiescent area of the epicenters of ML≥4 foreshocks. This anomalous feature could be used to predict the location of strong earthquakes in Tibet.
3) The period of low-intensity ML≥4 earthquakes was not proportional to the magnitude of subsequent strong earthquakes.
Data availability statement
The original contributions presented in the study are included in the article/Supplementary Material, further inquiries can be directed to the corresponding author.
Author contributions
JG performed the observation analysis and interpreted the results. YZ, YJ, and WZ elaborated the study and wrote the manuscript. RQ, JL, LX, and CX provided comments to improve the manuscript. All authors examined the results and interpretations and participated in manuscript writing. All authors have read and agreed to the published version of the manuscript.
Funding
This study benefited from financial support provided by the Chinese Academy of Sciences (CAS) Pioneer Hundred Talents Program and the Second Tibetan Plateau Scientific Expedition and Research Program (2019QZKK0708).
Acknowledgments
We are thankful to three reviewers for their constructive comments allowed to improve our manuscript. We thank China Earthquake Administration and the Seismological Bureau of the Tibet Autonomous Region for sharing the data used in this study. We are also obliged to Mengyu Xie from the China Earthquake Networks Center for sharing the software package of ZMAP (Stefan Wiemer, ETH).
Conflict of interest
The authors declare that the research was conducted in the absence of any commercial or financial relationships that could be construed as a potential conflict of interest.
Publisher’s note
All claims expressed in this article are solely those of the authors and do not necessarily represent those of their affiliated organizations, or those of the publisher, the editors and the reviewers. Any product that may be evaluated in this article, or claim that may be made by its manufacturer, is not guaranteed or endorsed by the publisher.
Supplementary material
The Supplementary Material for this article can be found online at: https://www.frontiersin.org/articles/10.3389/feart.2023.1043468/full#supplementary-material
References
Aki, K. (1965). Maximum likelihood estimate of b in the formula logN= a-bM and its confidence limits. Bull. Earthq. Res. Inst. Univ. Tokyo 43, 237–239.
Chen, C., Rundle, J., Holliday, J. R., Nanjo, K. Z., Turcotte, D. L., Li, S. C., et al. (2005). The 1999 Chi-Chi, Taiwan, earthquake as a typical example of seismic activation and quiescence. Geophys. Res. Lett. 32 (22). doi:10.1029/2005GL023991
Chen, L. (2018). Analysis of quiescence anomalies of MS4 earthquake in Keping block, Xinjiang. Inland Earthq. (in Chin. 32, 370–378. doi:10.16256/j.issn.1001-8956.2018.04.009
Chen, X. (2007). Analysis of relationship between quiescence of earthquakes with Ms≥6 and occurrence of earthquakes with Ms≥7. Prog. Earthq. Sci. (in Chinese) 1, 12–15.
Chen, Y., Yao, J., Li, G., Yu, N., Liu, W., Wang, P., et al. (2013). Analysis of earthquake group activity and foreshock sequences in the Qinghai region since 1980. Earthquake Research In China (in Chinese) 29, 489–500. doi:10.3969/j.issn.1001-4683.2013.04.009
Chen, Y., and Sun, H. (2004). Study on one of index of strong earthquakes with Ms≥6.5-middle earthquake quiescence in Western Chi-na mainland. Plateau Earthquake Research 4, 8–12. doi:10.3969/j.issn.1005-586X.2004.04.002
Chen, Y., Yao, J., and Ma, Y. (2014). Research on quiescence anomaly of ML ≥ 4 earthquakes before M6.0∼6.9 earthquakes in Qinghai-Tibet Plateau. Journal of Seismological Research (in Chinese) 37, 1–7.
Console, R., Jackson, D., and Kagan, Y. (2010). Using the ETAS model for catalog declustering and seismic background assessment. Pure and applied geophysics 167 (6), 819–830. doi:10.1007/s00024-010-0065-5
Di Giovambattista, R., and Tyupkin, Y. S. (2004). Seismicity patterns before the M= 5.8 2002, Palermo (Italy) earthquake: Seismic quiescence and accelerating seismicity. Tectonophysics 384 (1-4), 243–255. doi:10.1016/j.tecto.2004.04.001
Feng, J., Jiang, C., Han, L., and Chen, J. (2012). Analysis on the monitoring capability of seismic networks and completeness of earthquake catalogues in Gansu region. Acta Seismologica Sinica 34 (05), 646–658+727+15.
Gao, J., NimaWen, S., and Zhang, J. (2015). Characteristics of seismic damage by the Nepal M8.1 earthquake in the Tibet area of chi-na. Technology For Earthquake Disaster Prevention (in Chinese) 10, 961–968. doi:10.11899/zzfy20150414
Gentili, S., Di Giovambattista, R., and Peresan, A. (2017). Seismic quiescence preceding the 2016 central Italy earthquakes. Phys. Earth Planet. Inter. 272, 27–33. doi:10.1016/j.pepi.2017.09.004
Gentili, S., Peresan, A., Talebi, M., Zare, M., and Di Giovambattista, R. (2019). A seismic quiescence before the 2017 Mw 7.3 Sarpol Zahab (Iran) earthquake: Detection and analysis by improved RTL method. Phys. Earth Planet. Inter. 290, 10–19. doi:10.1016/j.pepi.2019.02.010
Guo, Y. (2019). Monthly occurrence frequency distribution characteristics of small earthquakes in the middle Tianshan mountains, Xinjiang. Inland Earthquake (in Chinese) 33, 296–305. doi:10.16256/j.issn.1001-8956.2019.04.002
Hainzl, S., Zöller, G., Kurths, J., and Zschau, J. (2000). Seismic quiescence as an indicator for large earthquakes in a system of self-organized criticality. Geophys. Res. Lett. 27 (5), 597–600. doi:10.1029/1999GL011000
Han, W. (1998). Overview of the concept of three kinds of seismic quiescence and its significance in earthquake forecasting. Progress in Earthquake Sciences (in Chinese) 1998, 9–13.
Han, W., Xin, H., and Jiang, G. (2006a). Researching on the seismic quiescence index and forecasting efficient in Sichuan and its three re-gions:Predicting researching of the seismic quiescence precursor with the different seismic magnitudes(Part1). Earthquake Research in Sichuan (in Chinese) 10, 1–6.
Han, W., Xin, H., and Jiang, G. (2006b). Seismic quiescence index to the regions of mainland, North China and Yunnan (part2). Earthquake Research in Sichuan 21, 1–3. (in Chinese).
Huang, Q. (2008). Seismicity changes prior to the Ms8. 0 wenchuan earthquake in sichuan, China. Geophys. Res. Lett. 35 (23)–L23308. doi:10.1029/2008GL036270
Huang, Q., Sobolev, G. A., and Nagao, T. (2001). Characteristics of the seismic quiescence and activation patterns before the M= 7.2 Kobe earthquake, January 17, 1995. Tectonophysics 337 (1-2), 99–116. doi:10.1016/S0040-1951(01)00073-7
Jiang, C., and Wu, Z. (2011). Intermediate-term medium-range accelerating moment release (AMR) priori to the 2010 yushu Ms7.1 earthquake. Chinese Journal of Geophysics 54 (6), 1501–1510+110.
Katsumata, K. (2011). A long-term seismic quiescence started 23 years before the 2011 off the Pacific coast of Tohoku Earthquake (M= 9.0). Earth, planets and space 63 (7), 709–712. doi:10.5047/eps.2011.06.033
Katsumata, K., and Nakatani, M. (2021). Testing the seismic quiescence hypothesis through retrospective trials of alarm-based earthquake forecasting in the Kurile–Japan subduction zone. Earth, Planets and Space 73 (1), 100–119. doi:10.1186/s40623-021-01418-z
Keilis-Borok, V. (2002). Earthquake forecasting: State-of-the-Art and emerging possibilities. Annu. Rev. Earth Planet. Sci. 30, 1–33. doi:10.1146/annurev.earth.30.100301.083856
Kisslinger, C. (1988). An experiment in earthquake forecasting and the 7 May 1986 Andreanof Islands earthquake. Bull. Seismol. Soc. Am. 78 (1), 218–229. doi:10.1785/BSSA0780010218
Klein, F. W. (1976). Earthquake swarms and the semidiurnal solid Earth tide. Geophysical Journal of the Royal Astronomical Society 45, 245–295. doi:10.1111/j.1365-246X.1976.tb00326.x
Lei, J., and Zhao, D. (2016). Large earthquakes and structural heterogeneity in Eastern Tibetan Plateau. Plate Boundaries and Natural Haz-ards 12, 167–191. doi:10.1002/9781119054146.ch8
Li, X., and Li, G. (1999). Monthly occurrence frequency of comprehensive precursors: Application and implication. Earthquake (in Chinese) 4, 323–330.
Li, X., Li, Z., Yang, J., Liu, Y., Fu, B., Qi, W., et al. (2018). Spatiotemporal characteristics of earthquake disaster losses in China from 1993 to 2016. Natural Hazards 94 (2), 843–865. doi:10.1007/s11069-018-3425-6
Liu, J., Guo, T., Yang, L., Su, Y., and Liu, G. (2008). Follow-up forecast study on the exceeding long quiescence of the earthquake with M>6 in China mainland during 2005-2007. Journal of Seismological Research (in Chinese) 31, 324–329.
Liu, M., Fu, B., and Dong, Y. (2015). Neotectonics of NE-striking fault zones and earthquake risk in the Yunnan-Myanmar block, south-eastern margin of the Tibetan plateau. Chinese Journal of Geophysics (in Chinese) 58, 4174–4186. doi:10.6038/cjg20151124
Liu, Y., Zhao, G., Wu, Z., Li, Y., Ma, D., and Jiang, Y. (2014). Application of spatial database technology and seismic gap method to seismic hazard analysis around south-eastern Tibetan plateau. Journal of Geomechanics (in Chinese) 20 (3).
Liu, Z. (2021). Analysis of the spatial distribution characteristics of the first strong earthquakes after the long-term quiescence of moderate earthquakes in Yunnan. Seismological and Geomagnetic Observation and Research (in Chinese) 42 (S1), 26–28. doi:10.3969/j.issn.1003-3246.2021.S1.009
Long, F., Wen, X., and Ni, S. (2009). Determination of temporal-spatial distribution of the regional minimum magnitudes of completeness:application to the longmenshan fault zone. Earthquake 29 (3), 27–36.
Ma, R., Wang, P., and Su, W. (2017). The implication of seismic quiescence on moderately strong earthquakes in northern Qinhai and adijacent areas. China Earthquake Engineering Journal (in Chinese) 39, 088–093. doi:10.3969/j.issn.1000-0844.2017.Supp.088
Ma, Y., and Chen, Y. (2011). Study on the characteristics of anomaly before the April 14,2010 Yushu Ms7.1 earthquake and its dynamic relationship. Earthquake Research in China (in Chinese) 27, 136–146. doi:10.3969/j.issn.1001-4683.2011.02.003
Mogi, K. (1969). Laboratory study of elastic shocks prior to rock failure. Eos Transactions American Geophysical Union 50, 401. doi:10.1029/EO050i005p00401-01
Ni, H., and Hong, H. (2014). The yutian earthquake of 12 february 2014. Geomatics, Natural Hazards and Risk 5 (3), 185–189. doi:10.1080/19475705.2014.937774
Ping, J., Luo, L., and Cao, S. (2000). Study on the evolutional characteristics of earthquake anomalous precursory information field and its relation with seismicity in north China. Earthquake Research in China (in Chinese) 2000 3. doi:10.3969/j.issn.1001-4683.2000.03.004
Ping, J., Zhang, Q., Cao, S., and Bian, Q. (2001). The quiescence of earthquakes with M L≥4.0 as an important precursory characteristic prior to strong shocks in North China region. Acta Seismologica Sinica 14 (4), 471–480. doi:10.1007/s11589-001-0126-z
Qin, S., Li, P., Xue, L., Wu, X., and Yang, B. (2015). A prospective forecasting of major earthquakes for the eurasian seismic belt(ii): In-traplate seismogenic zones. Progress In Geophysics 30 (4), 1625–1652. doi:10.6038/pg20150417
Rundle, J. B., Klein, W., Turcotte, D. L., and Malamud, B. D. (2000). “Precursory seismic activation and critical-point phenomena,” in Microscopic and macroscopic simulation: Towards predictive modelling of the earthquake process (Basel: Birkhäuser), 2165–2182. doi:10.1007/978-3-0348-7695-7_19
Schorlemmer, D., and Woessner, J. (2008). Probability of detecting an earthquake. Bulletin of the Seismological Society of America 98 (5), 2103–2117. doi:10.1785/0120070105
Shi, X. (2020). Study on Ms≥4.0 earthquake quiescence anomaly in Xinyuan-Korla area. Inland Earthquake (in Chinese) 34, 388–394. doi:10.16256/j.issn.1001-8956.2020.04.08
Sobolev, G., Huang, Q., and Nagao, T. (2002). Phases of earthquake's preparation and by chance test of seismic quiescence anomaly. J Geodyn 33 (4-5), 413–424. doi:10.1016/S0264-3707(02)00007-8
Su, L. (1996). The relation between the quiescence of M≥5 shocks and the M≥7 earthquakes in China continent. Northwestern Seis-mological Journal (in Chinese) 18, 36–41.
Takahashi, H., and Kasahara, M. (2004). The 2003 Tokachi-oki earthquake, off Southeastern Hokkaido, Japan: Seismic activities from the former 1952 Tokachi-oki earthquake, foreshock, mainshock, aftershocks, and triggered earthquakes. Jishin 57 (2), 115–130. doi:10.4294/zisin1948.57.2_115
Taylor, M., and Yin, A. (2009). Active structures of the Himalayan-Tibetan orogen and their relationships to earthquake distribution, contemporary strain field, and Cenozoic volcanism. Geosphere 5 (3), 199–214. doi:10.1130/GES00217.1
Tian, L., Zhang, X., Xie, M., Jiang, X., Wang, Y., Deng, G., et al. (2021). Summary of the biru MS 6.1 earthquake in Tibet on March 19, 2021. Seismological and Geomagnetic Observation and Research 42 (2). (in Chinese). doi:10.3969/j.issn.1003-3246.2021.02.005
Tillotson, E. (1951). The great Assam earthquake of August 15, 1950. Nature 167 (4239), 128–130. doi:10.1038/167128a0
Traitangwong, P., and Pailoplee, S. (2017). Precursory seismic quiescence along the Sagaing fault zone, Central Myanmar–application of the region-time-length algorithm. Geosciences Journal 21 (4), 543–552. doi:10.1007/s12303-016-0068-z
Turcotte, D. L., Newman, W. I., and Shcherbakov, R. (2003). Micro and macroscopic models of rock fracture. Geophysical Journal Interna-tional. 152 (3), 718–728. doi:10.1046/j.1365-246X.2003.01884.x
Wang, X., Wang, Y., Gong, M., Guo, L., and Wang, X. (2017). Comprehensive judgment of quiescence anomaly under the background of the quiet time of the fifth activity in North China. Seismological and Geomagnetic Observation and Research (in Chinese) 3, 21–27. doi:10.3969/j.issn.1003-3246.2017.01.004
Wang, Y., Liu, X., Wang, X., and Gong, M. (2014). The analysis of ML4 earthquake quiescence in north China. North China Earthquake Sciences (in Chinese) 32, 55–61. doi:10.3969/j.issn.1003-1375.2014.02.011
Wen, Y., Song, Z., Yu, H., and Huang, K. (2016). Current large earthquake risk on the eastern himalayan belt and compared to the seismicities before 1950 motuo M 8.6 earthquake. Progress In Geophysics 31 (1), 103–109. doi:10.6038/pg20160112
Wiemer, S., and Wyss, M. (2000). Minimum magnitude of completeness in earthquake catalogs: Examples from Alaska, the Western United States, and Japan. Bulletin of the Seismological Society of America 90 (4), 859–869. doi:10.1785/0119990114
Woessner, J., Hauksson, E., Wiemer, S., and Neukomm, S. (2004). The 1997 kagoshima (Japan) earthquake doublet: A quantitative analysis of aftershock rate changes. Geophysical research letters 31 (3)–L03605. doi:10.1029/2003gl018858
Woessner, J., and Wiemer, S. (2005). Assessing the quality of earthquake catalogues: Estimating the magnitude of completeness and its uncertainty. Bulletin of the Seismological Society of America 95 (2), 684–698. doi:10.1785/0120040007
Wu, Y. M., and Chiao, L. Y. (2006). Seismic quiescence before the 1999 chi-chi, taiwan, M W 7.6 earthquake. Bull. Seismol. Soc. Am. 96 (1), 321–327. doi:10.1785/0120050069
Wyss, M., Habermann, R., Bodin, P., Kisslinger, C., Burford, R., Klein, F., et al. (1997). Case 23 nomination of pre-cursory seismic quiescence as a significant precursor. Pure and applied geophysics 149 (1), 79–113. doi:10.1007/BF00945162
Wyss, M., and Habermann, R. E. (1988). Precursory quiescence before the August 1982 stone canyon, san andreas fault, earthquakes. Pure and Applied Geophysics 126, 333–356. doi:10.1007/BF00879002
Wyss, M., Sobolev, G., and Clippard, J. D. (2004). Seismic quiescence precursors to two M7 earthquakes on Sakhalin Island, measured by two methods. Earth, planets and space 56 (8), 725–740. doi:10.1186/BF03353081
Yan, Z., Zhang, H., Fan, X., Du, X., and Shi, Y. (2012). Comparative analysis on the characteristics of low-frequency energy released by the wenchuan earthquake and Kunlun mountains earthquake. Chinese Journal of Geophysics 55, 719–732. doi:10.1002/cjg2.1766
Yu, H., Cheng, J., Zhang, X., Zhang, L-P., Liu, J., and Zhang, Y. (2013). Multi-methods combined analysis of future earthquake potential. Pure and Applied Geophysics 170, 173–183. doi:10.1007/s00024-011-0408-x
Yu, N., Zhang, X., and Yang, X. (2020). Analysis of minimum magnitude of completeness for earthquake catalog in qinghai region. Earthquake 40 (4), 23–32.
Zhang, G., Yin, X., Wang, P., and Shao, Z. (2019). Low seismicity anomaly and its efficiency in mid-term earthquake forecasting in Chinese mainland. Earthquake (in Chinese) 39 (2). doi:10.3969/j.issn.1000-3274.2019.02.001
Zhang, S., Wang, X., Wang, Y., Gong, M., Chen, T., and Guo, L. (2018). The relationship between seismic quiescence in hebei and its adjacent areas and several great earthquakes. North China Earthquake Sciences (in Chinese) 36, 38–42. doi:10.3969/j.issn.1003-1375.2018.02.006
Zhu, H., Li, H., Wu, M., and Yue, X. (2014). Quiescence-seismic-quiescence evolution of medium-earthquakes before moderate-strong shocks in junction region of Shanxi, Hebei and Neimenggu. Progress in Geophysics (in Chinese) 29, 1114–1120. doi:10.6038/pg20140314
Zhu, H., Yue, X., Wu, M., Li, H., and Lin, X. (2012). The Abnormally Quiescence of medium-earthquakes before moderate-strong shocks in the central and northern of Fenwei seismic belt. Progress in Earthquake Sciences 42. (in Chinese).
Zhuang, J., Ogata, Y., and Vere-Jones, D. (2002). Stochastic declustering of space-time earthquake occurrences. J. Am. Stat. Ass. 97 (458), 369–380. doi:10.1198/016214502760046925
Keywords: Tibet, seismic quiescence, low-frequency, anomaly, earthquake forecasting
Citation: Gao J, Zhu Y, Ji Y, Zhu W, Qu R, Li J, Xu L and Xie C (2023) Low-intensity anomaly involving ML≥4 events preceding strong earthquakes in Tibet. Front. Earth Sci. 11:1043468. doi: 10.3389/feart.2023.1043468
Received: 13 September 2022; Accepted: 03 January 2023;
Published: 23 January 2023.
Edited by:
Giovanni Martinelli, National Institute of Geophysics and Volcanology, ItalyReviewed by:
Mikhail Rodkin, Institute of Earthquake Prediction Theory and Mathematical Geophysics (RAS), RussiaYan Xue, China Agricultural University, China
Copyright © 2023 Gao, Zhu, Ji, Zhu, Qu, Li, Xu and Xie. This is an open-access article distributed under the terms of the Creative Commons Attribution License (CC BY). The use, distribution or reproduction in other forums is permitted, provided the original author(s) and the copyright owner(s) are credited and that the original publication in this journal is cited, in accordance with accepted academic practice. No use, distribution or reproduction is permitted which does not comply with these terms.
*Correspondence: Yingfeng Ji, eWluZ2ZlbmdqaUBpdHBjYXMuYWMuY24=