 Juchao Zhao
 Jin Wang
 Zaheer Abbas
 Yao Yang1,2,3
 Yaolong Zhao
94% of researchers rate our articles as excellent or good
Learn more about the work of our research integrity team to safeguard the quality of each article we publish.
Find out more
ORIGINAL RESEARCH article
Front. Earth Sci., 09 May 2023
Sec. Hydrosphere
Volume 11 - 2023 | https://doi.org/10.3389/feart.2023.1042088
This article is part of the Research TopicUrban Flooding under a Changing EnvironmentView all 5 articles
Urban waterlogging is a major natural disaster in the process of urbanization. It is of great significance to carry out the analysis of influencing factors and susceptibility assessment of urban waterlogging for related prevention and control. However, the relationship between urban waterlogging and different influencing factors is often complicated and nonlinear. Traditional regression analysis methods have shortcomings in dealing with high-dimensional nonlinear issues. Gradient Boosting Decision Tree (GBDT) is an excellent ensemble learning algorithm that is highly flexible and efficient, capable of handling complex non-linear relationships, and has achieved significant results in many fields. This paper proposed a technical framework for quantitative analysis and susceptibility assessment on influencing factors of urban waterlogging based on the GBDT in a case study in Guangzhou city, China. Main factors and indicators affecting urban waterlogging in terrain and topography, impervious surface, vegetation coverage, drainage facilities, rivers, etc., were selected for the GBDT. The results demonstrate that: (1) GBDT performs well, with an overall accuracy of 83.5% and a Kappa coefficient of 0.669. (2) Drainage density, impervious surface, and NDVI are the most important influencing factors resulting in rainstorm waterlogging, with a total contribution of 85.34%. (3) The overall distribution of urban waterlogging susceptibility shows a characteristic of “high in the southwest and low in the northeast”, in which the high-susceptibility areas are mainly distributed in Yuexiu District (34%), followed by Liwan District (22%) and Haizhu District (20%). To mitigate the impact of frequent urban flooding disasters, future measures should focus on strengthening drainage networks, such as optimizing impervious surface spatial patterns, controlling construction activities in high-risk areas, and preventing excessive development of green spaces.
Urban waterlogging refers to a phenomenon of surface flooding disasters caused by continuous or heavy rain that exceeds the capacity of urban drainage system, leading to the collapse of urban transportation system and significant economic losses (Tang et al., 2019; Lin et al., 2021). In context of global climate change, extreme precipitation events are increasing, and urban waterlogging disasters are becoming more frequent (Wang et al., 2009; Yi et al., 2020). According to the 5th IPCC (Intergovernmental Panel on Climate Change) assessment report, the world has experienced increasing and intensified global extreme climate events over the last 50 years, and this phenomenon will become more frequent in the future (IPCC, 2014). On the other hand, rapid urbanization has significantly affected the underlying surface of cities, altering the urban hydrological cycles, reducing the water storage capacity, and increasing the risk of urban waterlogging disasters (Singh and Singh, 2011; Nowak and Greenfield, 2020; Zhang et al., 2021b). Urban waterlogging has become a frequent and devastating natural disaster due to complex urban mechanisms (Jongman et al., 2012; Jian et al., 2021). In recent years, waterlogging disasters have occurred frequently in many large cities in China, and prevention and control of urban waterlogging have become a major public concern (Wang et al., 2015; Zhao and Wei, 2020). According to the " Bulletin of Flood and Drought Disasters in China” issued by the Ministry of Water Resources in 2017, 104 cities in China suffered from waterlogging, which impacted a population of up to 2.18 million, and caused the direct loss of up to 16.56 billion yuan (China Ministry of Water Resources, 2018). Therefore, effectively mitigating the occurrence of urban waterlogging is a focal point in China’s urbanization process.
At present, scholars have carried out a plethora of research on spatiotemporal characteristics of urban waterlogging (Huang et al., 2018), influencing factors (Wang et al., 2017; Jiao et al., 2020), and susceptibility assessment (Tang et al., 2019; Tehrany et al., 2019). Among these, the study of influencing factors is a hot topic in relation to waterlogging issues, and it is important fundamental research on disaster management and prevention (Wu and Zhang, 2017). Such research primarily focuses on human-natural factors that play a vital role in urban waterlogging, such as climatic characteristics, topography, and land use (Wu and Zhang, 2017; Li and Wu, 2018; Liu et al., 2021). For example, Zhao and Wei (2020) considered that under general rainfall conditions, the higher the elevation, the lower the risk of inundation. The impact of land use on urban waterlogging is particularly significant, and most studies have focused on two land use categories, impervious surface, and urban green spaces, respectively. For example, Yu et al. (2018) took Guangzhou as an example to reveal the impact of impervious surface expansion on urban waterlogging from 1990 to 2012; Zhang et al. (2018) analyzed the relationship between impervious surface composition (buildings, roads) and waterlogging at different spatial scales. These studies demonstrated that the increasing impervious surface reduces the infiltration capacity of rainwater, leading to an increased susceptibility of urban waterlogging (Yu et al., 2018; Zhang et al., 2018; Yu et al., 2019). Simultaneously, urban green spaces play an important role in reducing the susceptibility of urban waterlogging. For example, Qian et al. (2021) simulated the layout of green spaces under different waterlogging susceptibility in Shenzhen, and pointed out that strengthening the construction of green infrastructure can reduce the susceptibility of waterlogging. Similar studies, which took Guangzhou and Shenzhen as examples, tested the effectiveness of urban green infrastructure in mitigating waterlogging, and proved that the impacts of green infrastructure on urban waterlogging largely depends on its area and biophysical parameters (Zhang et al., 2021b). Furthermore, poor drainage functioning, lagging design standards, and insufficient maintenance also contribute to urban flooding (Zhang et al., 2012; Xie, 2013). According to some studies, the drainage pipe network is closely related to surface runoff, and inadequate drainage network facilities are one of the major incentives that lead to urban waterlogging (Jiao et al., 2020). Moreover, rapid urbanization in China has dramatically reshaped the spatial landscape patterns, particularly those of water bodies (Xiao et al., 2016; Xie et al., 2019). Relevant scholars have conducted correlation research on the area of rivers and lakes and urban waterlogging. Such as, Zang et al. (2020) indicated that there is a primary coupling coordination relationship between lake areas and waterlogging in Tianjin; Liu et al. (2019a) believed that the distribution of rivers is closely related to urban waterlogging. However, methods such as Pearson correlation coefficient (Wu and Zhang, 2017; Jiao et al., 2020), Principal component analysis (Liu et al., 2022), multiple stepwise regression (Wu and Zhang, 2017; Zhang et al., 2018), and geographically weighted regression (Wang et al., 2017; Yu et al., 2018; Liu et al., 2021) are often used to analyze the influencing factors of urban waterlogging. Such methods, with the assumption of a linear relationship between driving factors and urban waterlogging, have quantified the impact of influencing factors on urban waterlogging. However, these methods often tend to ignore the complex nonlinear relationship that may exist between the dependent variable and the independent variables, and it is difficult to quantify the relative contributions of each factor to urban waterlogging.
In contrast, machine learning provides an effective method for analyzing the complicated nonlinear relationship between urban waterlogging and various factors. Exploring existing data and identifying potential structures for learning strategies, machine learning simulates humankind using computer-based learning algorithms, and analyzes and predicts based on the resulting models (Kohavi and Provost, 1998). With the advancement of machine learning technology, algorithms such as decision tree (Merz et al., 2013), artificial neural network (Li et al., 2013), support vector machine (Tehrany et al., 2019), weakly labeled support vector machine (Zhao et al., 2019) have been widely used in research on urban waterlogging. These models have significantly improved computational capacity and are effective at solving nonlinear problems. However, most studies are mainly focused on susceptibility mapping for urban waterlogging. This is primarily due to the “black box” nature of most machine learning models (Fang et al., 2019), which prevents researchers from comprehending the actual operating mechanism of these models. Furthermore, it is challenging to articulate the relationship between variables in the model and susceptibility caused by waterlogging. Ensemble learning, being a trending research field in machine learning (Liu et al., 2019b), can complete learning tasks by constructing and combining multiple weak classifiers and can outperform any single model in terms of performance. Ensemble learning is often divided into two categories, the Bagging and Boosting method. Random forest, as a representative of Bagging, has advantages such as fast training speed and simple implementation, and successful applications in urban waterlogging susceptibility assessment (Woznicki et al., 2019). However, due to the limited parallel structure of the model, random forest models are often too general and lack the ability to handle difficult samples effectively. In particular, another ensemble learning algorithm based on the idea of boosting, named Gradient Boosting Decision Tree (GBDT), combines multiple decision trees to generate robust models in a gradient boosting manner (Friedman, 2001; Shen and Yong, 2021). GBDT is highly flexible, efficient, and has good interpretability (Ge et al., 2017; Zhang et al., 2021c). With strong modeling capabilities in addressing high-dimensional nonlinear problems, it has been widely applied in water-related fields such as urban water quality monitoring (Wei et al., 2019), precipitation estimation (Shen and Yong, 2021), flood monitoring (Felix and Sasipraba, 2019), and chlorophyll inversion (Yao et al., 2021), demonstrating robustness and generalization ability. In other words, GBDT may be a better method for quantitative analysis of the influencing factors and susceptibility assessment of urban waterlogging.
One of the cities with the fastest urbanization and frequent rainstorm waterlogging disasters in China (Guangzhou City) was selected as the case city. The main objectives of this study are: 1) to test the feasibility of GBDT in urban waterlogging research, and compare it with two other widely used algorithms (Support Vector Machine and Random Forest); 2) to quantify the relative contributions of various influencing factors to urban waterlogging based on GBDT, and analyze the relationship between urban waterlogging and each factor; 3) to develop a distribution map of urban waterlogging susceptibility levels based on GBDT, in order to provide theoretical and technical support for urban waterlogging prevention and management.
Guangzhou is located in southern China, one of the core cities in the Guangdong-Hong Kong-Macao Greater Bay Area, and one of the most economically prosperous cities in mainland China. Covering the districts of Liwan, Yuexiu, Tianhe, Haizhu, Baiyun, and Huangpu, the central urban area of Guangzhou is located between 23°01′─23°25′N and 113°08′─113°36′E (Figure 1). The climate of Guangzhou is subtropical marine monsoon, with highlands in the northeast and lowlands in the southwest. The average annual precipitation is about 1720 mm (Zhang et al., 2020). There are 1,368 rivers with a width of above 5 m, 22 rivers with a catchment area of more than 100 km2, and a total length of approximately 5,597.36 km2 (Shu et al., 2021). Over the past 40 years of the “Reforms and Opening up” policy in China, Guangzhou has experienced rapid urbanization, which led to the intensification of disasters caused by urban waterlogging (Li et al., 2015). For example, on 22 May 2020, a local torrential rain caused four deaths, both ground and underground parking lots of several new residential quarters were flooded, and over 10,000 cars were flooded and scrapped (Huang et al., 2021). Therefore, the study area is representative and significant for exploring the influencing factors of urban waterlogging.
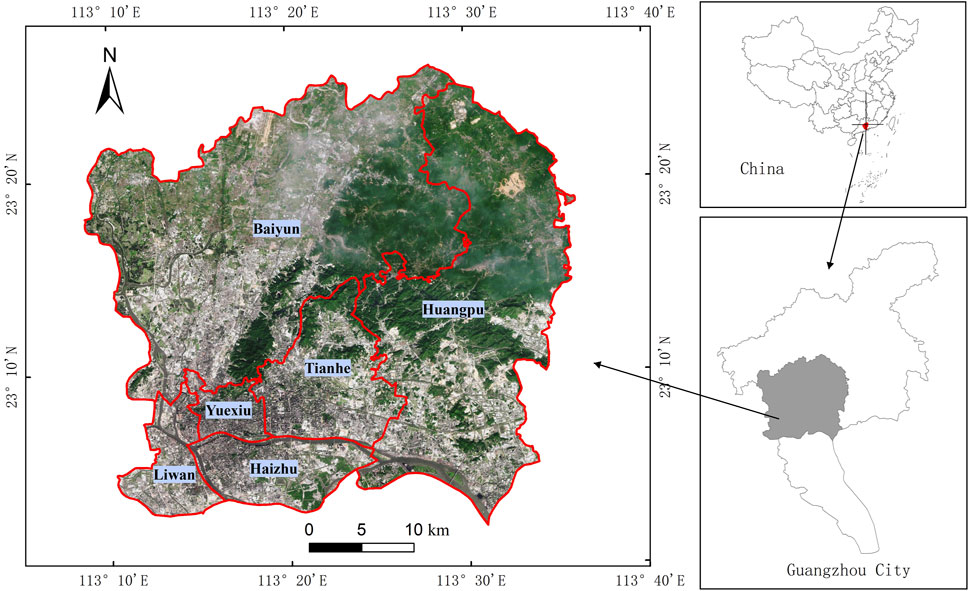
FIGURE 1. The central city of Guangzhou.
We obtained DEM from NASA with a 30 m spatial resolution, which is featured as high quality and wide coverage range (https://earthdata.nasa.gov/). Based on DEM data, the elevation (Figure 2A) and slope (Figure 2B) of the main urban area of Guangzhou were obtained.
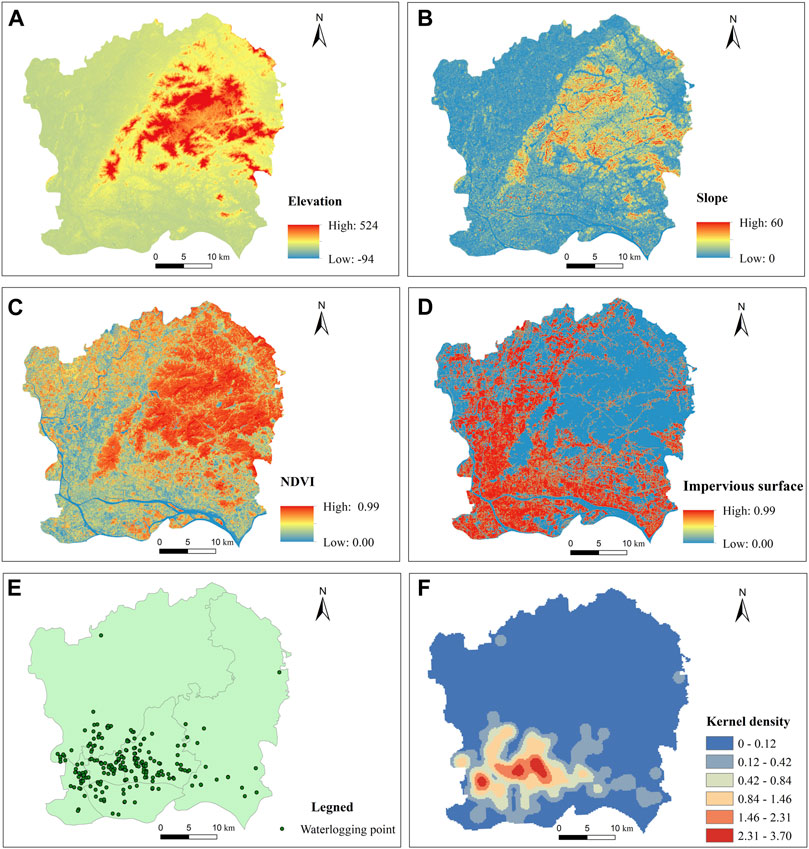
FIGURE 2. DEM (A), Slope (B), NDVI (C), Impervious surface (D), Waterlogging points (E), and Kernel density (F).
The NDVI of the study area is calculated using Sentinel-2A data (2015) with a spatial resolution of 10 m. The data was collected from Google Earth Engine cloud computing platform and obtained the images with less than 5% cloud coverage. The near-infrared and infrared bands of Sentinel-2A were used to extract the NDVI values (Figure 2C). Then, the maximum value of annual NDVI in the study area was obtained by the maximum value compositing method to reduce the influence of cloud, fog, and solar altitude (Holben, 1986). Finally, the NDVI data was resampled to 30 m spatial resolution.
The data for land use was obtained from the Institute of Aerospace Information Innovation of the Chinese Academy of Sciences in 2015, with a spatial resolution of 2 m (Aerospace Information Research Institute, Chinese Academy of Sciences, 2020). In order to verify the classification accuracy of the data in Guangzhou, we have compared the dataset with the high-resolution images of Google Earth by means of visual interpretation in this study, as results shown that the dataset with higher classification accuracy meets the accuracy requirement of this study. Based on it, we created the impervious density map by extracting the impervious surfaces and overlaying them on the 30*30 m grid to maintain the resolution consistency of the data sources of this research (Figure 2D). Additionally, the spatial distribution of drainage outlet data is provided by Guangzhou Urban Planning and Survey Design Institute, which is used to analyze the drainage capacity of different spatial units.
The data of waterlogging points in main urban area of Guangzhou is obtained from the Water Authority and mainstream media (Liu et al., 2021), the temporal range is from 2011─2018 with a total number of 230 points across the study area (Figure 2E). To ensure the scientific rationality of sampled data in this study, we randomly created equivalent sampling points for 230 non-waterlogging points in the study area and obtained a total of 460 sample point data. Additionally, the flood events are point data, which is difficult to directly analyze its spatial autocorrelation characteristics of urban waterlogging. However, kernel density estimation can provide a more intuitive representation of the spatial distribution of urban waterlogging in a continuous area and can be used to investigate its spatial clustering characteristics. Therefore, this study employs the kernel density method to generate a continuous and smooth surface, where grid values represent unit density and decrease to zero at neighborhood boundaries (Figure 2F).
According to prior studies, the influencing factors on urban waterlogging include primarily topography, impervious surface, vegetation coverage, drainage infrastructure, and rivers and lakes (Zhang et al., 2018; Jiao et al., 2020; Zang et al., 2020; Zhang et al., 2021b; Liu et al., 2021). We selected six influencing factors as explanatory variables based on previous studies (Table 1). In order to extract the influencing factors, we generated 30m×30 m grids with unique value fields using ArcGIS (Woznicki et al., 2019; Zhao and Wei, 2020), and each grid represents a spatial unit object. Based on these grids, we extracted the corresponding elevation, slope, and NDVI mean value of each spatial unit using the regional statistics function in ArcGIS. Similarly, the area ratio of impervious surface and water bodies is extracted from the land use data and the number of drainage outlets in each spatial unit is extracted based on the spatial distribution of drainage outlet points. Finally, we obtained six influencing factors, including elevation, slope, impervious surface, NDVI, drainage density, and water body (Table 1). Furthermore, since the value ranges of some factors are varied, which is not conducive to gradient descent of the model, we used the maximum-minimum normalization approach to standardize the data to the range of [0, 1] (Zhang et al., 2021b).
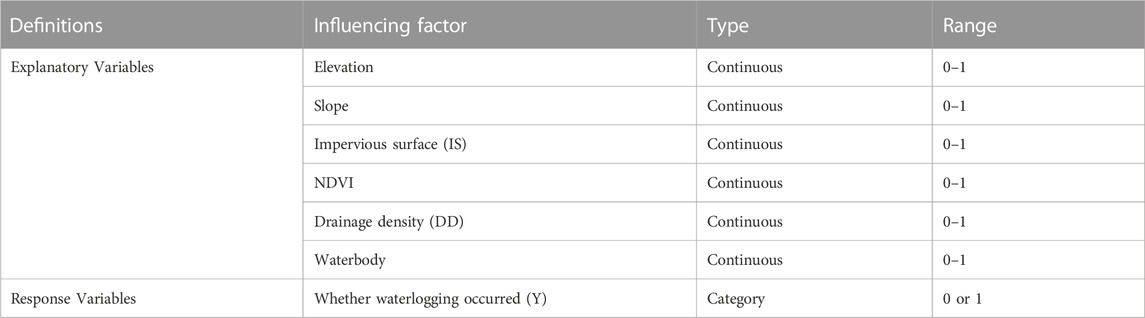
TABLE 1. Description of explanatory and response variables.
The response variables in the study follow a binomial distribution and are generated from the spatial distribution data of waterlogging points (230) and non-waterlogging points (230), where the space unit corresponding to waterlogging points is assigned a value of 1 and the non-waterlogging points are assigned a value of 0, indicating whether waterlogging occurs in each space unit (Table 1).
Spatial autocorrelation is used to describe the spatial dependency on spatial units (dispersed, random, clustered), and is divided into global and local spatial autocorrelation, and the global spatial autocorrelation is scaled by Moran’s I index (Zhu et al., 2012). Moran’s I index has a value range of [-1, 1], I > 0, I = 0 and I < 0, representing positive spatial autocorrelation, no correlation and negative spatial autocorrelation, respectively. We further used Hot Spot Getis-Ord General
Standardized
Where, xi and xj respectively are the space unit
Boosting is an integrated learning framework in machine learning which is used to build a new decision tree in the gradient direction with reduced residuals on the basis of Boosting, one of the most powerful techniques for building predictive models (Friedman, 2001; Friedman, 2002). GBDT can be interpreted as a combination of Gradient Boosting and decision tree. Each decision tree is generated by the CART (Classification and Regression Tree) algorithm. CART adopts a binary recursive partitioning technique to divide the current sample set into two subsets, so that each non-leaf node generated has two branches. In Figure 4, CART_1, CART_2, CART_3. Indicates that multiple classification decision trees are generated. Finally, by training multiple weak learners and continuously changing the probability distribution of training samples during the training process, the algorithm focuses more on the error of the previous weak learner during each training. By combining multiple such weak learners, an almost perfect strong classifier can be obtained (Lu, 2022). The GBDT model can be expressed as:
Where,
When determining the initial boosted tree model
Where,
In this study, R language compilation platform (version 4.1.1) was used to construct the model. In GBDT model, there are three important parameters, the maximum depth of each tree, shrinkage, and the number of iterations. The greater the maximum depth of each tree, the better the model fitting impact, however overfitting is conceivable. Similarly, a smaller shrinkage can almost always get better model performance, but it will increase the computational cost, including storage and CPU time. The response of Bernoulli deviance of the GBDT model to different parameters is shown in Figure 3C.
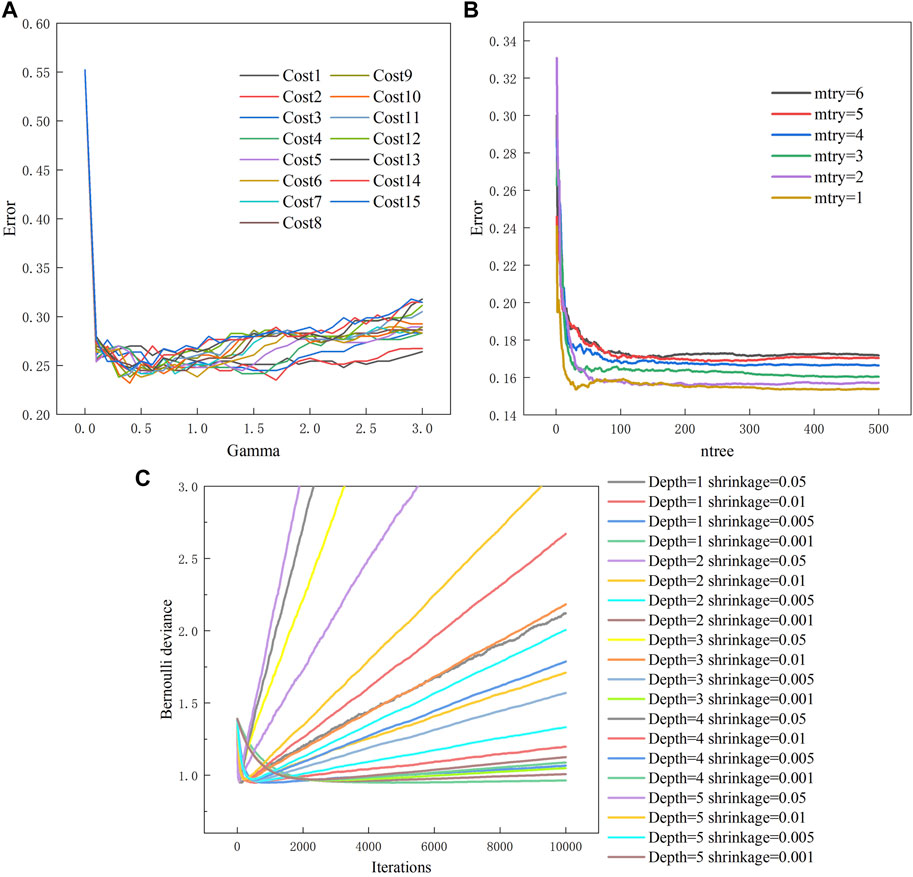
FIGURE 3. The process of parameter selection for SVM (A), RF (B), and GBDT (C).
SVM is a supervised learning technique based on the statistical learning theory. Its basic principle is to find the optimal separating hyperplane in a high-dimensional feature space, maximizing the margin between positive and negative samples in the training set (Tang et al., 2019). SVM has high accuracy and can avoid overfitting, but it is sensitive to parameters such as Kernel function, cost and gamma. The four commonly used kernel functions include Linear Kernel, Polynomial Kernel, RBF Kernel and Sigmoid Kernel, among which, Polynomial and RBF are the most common in SVM research (Marjanović et al., 2011). Based on the R language compilation platform, we used the ‘e1071′package to construct the SVM model. The response of error in the SVM model to gamma and cost parameters is shown in Figure 3A.
RF is an integrated learning algorithm designed based on the Bagging framework, with the core concept of bootstrap sampling (BREIMAN, 2001). There are two important custom parameters in RF, namely, the number of classification regression trees (ntree) and the number of random variables (mtry). In this study, the ‘randomForest’ module in R language was used for model construction, and the optimal parameters were explored through grid search method. The response of error in the RF model to parameters is shown in Figure 3B.
The model training accuracy is comprehensively measured by the four indicators of Precision (P), Recall (R), Accuracy (ACC) and Kappa coefficient. Where P represents the probability that all samples predicted to be waterlogging points are actually waterlogging points; R denotes the probability of being predicted to be a waterlogging point in a sample of actual waterlogging points; and ACC represents the percentage of correct prediction results in total samples. Kappa coefficient is calculated based on confusion matrix, Kappa coefficient values ≤0, 0–0.2, 0.2–0.4, 0.4–0.6, 0.6–0.8, and 0.8–1 represent poor, slight, fair, moderate, substantial, and almost perfect agreement between the model and the reality respectively (Koch, 1977).
Finally, this study uses the natural breaks classification method to classify the waterlogging susceptibility level. Optimized by Jenks (1967), it minimizes the variance within each level and maximize the variance between different levels (Wu et al., 2015). Without artificial interference, the natural breaks classification method is able to automatically determine the threshold for continuous values. Therefore, it has been widely used by flood risk studies to reasonably divide levels (Febrianto et al., 2016; Khosravi et al., 2016; Tang et al., 2019; Liu et al., 2021). In this study, we used the natural breaks classification method to categorize the severity of waterlogging into five levels: lowest susceptibility, low susceptibility, medium susceptibility, high susceptibility, and highest susceptibility. Figure 4 shows the entire technical flowchart of this study.
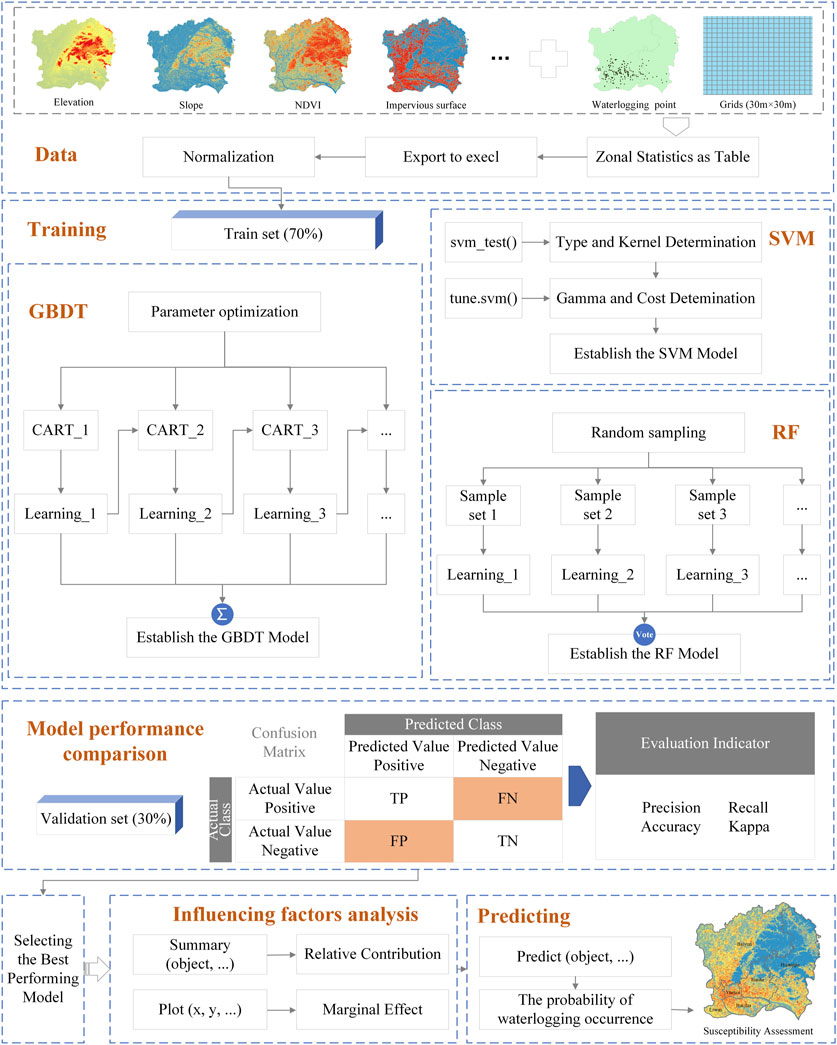
FIGURE 4. Technical flowchart.
Based on the results of kernel density calculation, we used Moran’s I index to analyze the spatial agglomeration characteristics of waterlogging. Figure 5A shows the global Moran’s I index, which is 0.983, and the Z score is much greater than 2.58, which has passed the significance test of 0.01, indicating that urban waterlogging has a significant positive spatial autocorrelation in spatial distribution with a high spatial agglomeration state.
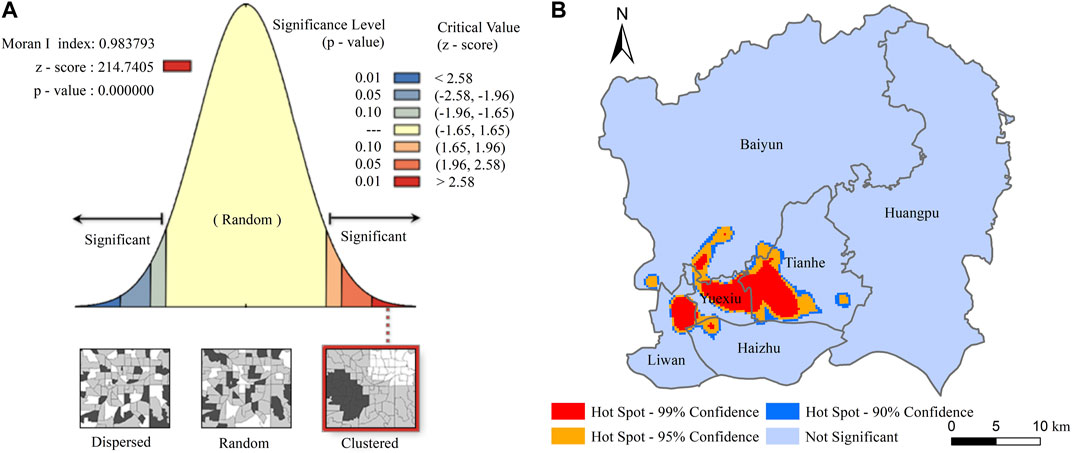
FIGURE 5. Moran’s I value (A) and hot spot analysis results (B) of urban waterlogging.
A single value is used for global spatial autocorrelation to reflect the spatial aggregation characteristics of urban waterlogging, while the hot-spot index can be used to further analyze the local spatial autocorrelation characteristics of urban waterlogging so that the local spatial aggregation pattern of urban waterlogging can be better explored. The regional differences in local spatial correlation characteristics of urban waterlogging are obvious (Figure 5B). And the hot-spot areas show obvious flaky distribution, with large agglomeration patches, strong connectivity between patches, and weak spatial heterogeneity. The hot spots of waterlogging are mainly distributed in Tianhe and Yuexiu Districts, and most of them have passed 99% confidence test. However, a few hot spots are distributed in Baiyun, Liwan, and Haizhu Districts.
We analyzed the impacts of each influencing factor on urban waterlogging using GBDT. Figure 6A shows the relative contribution rate of each factor to urban waterlogging, with drainage density, impervious surface, NDVI, elevation, slope, and water bodies contributing 37.93%, 35.91%, 11.50%, 8.66%, 5.84%, and 0.16%, respectively. This study is based on a 2/3 majority principle, which means that the number of factors set may cover more than 2/3 of the relevance of the entire factor indicator system, which can be regarded as a key factor (Liu et al., 2019b). Simultaneously, the number of key factors of urban waterlogging should not be too large; otherwise, the significance of identifying key factors would be unavailable. According to the results in Figure 6A, half of the factors cumulatively cover more than 80% of the contribution rate for the entire urban waterlogging influencing factors. Therefore, the key factors set in our study are drainage density, impervious surface, and NDVI.
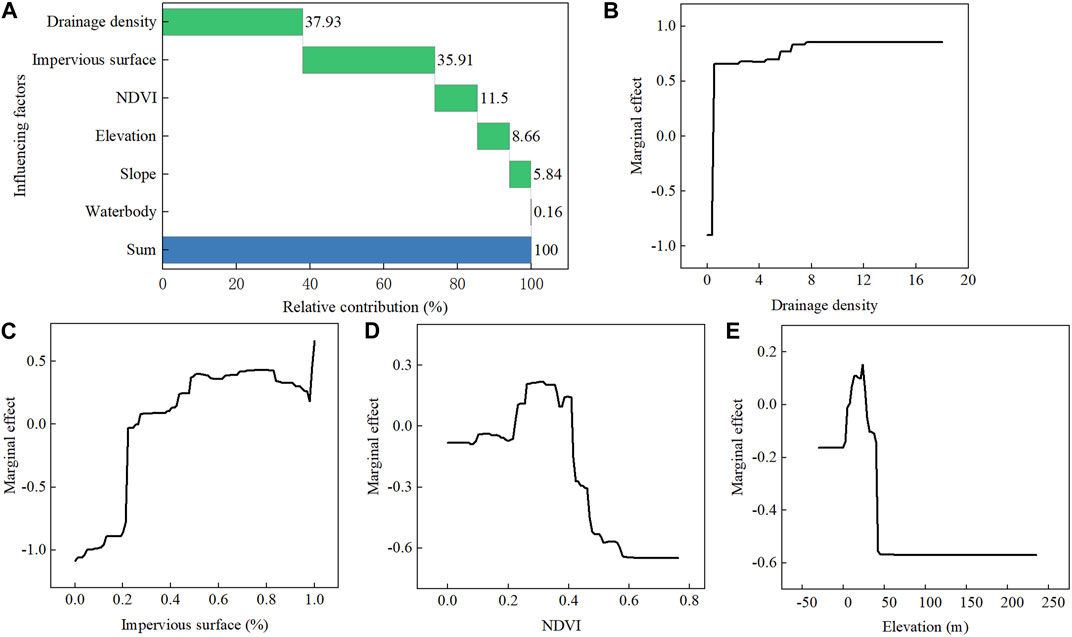
FIGURE 6. GBDT model analysis of the relationship between urban waterlogging and influencing factors.
GBDT models can use partial dependence functions to visualize the impact of each factor on the response variable. As shown in Figures 6B–E, the influence shift diagrams of the top four factors with the highest relative contribution, indicating that their influences on urban waterlogging have changed in tandem with the change of value from influencing factors. When the marginal effect value is greater than 0, the influencing factor has a positive effect on the degree of urban waterlogging. When it is less than 0, it has a negative impact, and when it is equal to 0, there is no impact. In general, the drainage density has a positive influence on alleviating the susceptibility of urban waterlogging. However, as the drainage density increases, the marginal effect value gradually shifts from negative to positive (Figure 6B), indicating that there is a positive correlation between urban waterlogging and drainage density, implying that the drainage density may not be effective in mitigating the occurrence of urban waterlogging. In consideration of the impact on the impervious surface during urban waterlogging (Figure 6C), when the proportion of space unit area occupied by the impervious surface is less than 27%, the marginal effect value is less than 0, and the impact of impervious surface on urban waterlogging susceptibility will be not obvious. The marginal value then demonstrates a clear increasing trend and shifts from negative to positive as the proportion of impervious surface steadily increases, indicating that the areas with a higher proportion of impervious surface are more vulnerable to waterlogging. Regarding the impacts of vegetation coverage on urban waterlogging (Figure 6D), the marginal effect value is negative and shows an obvious downward trend when the NDVI value is higher than 0.41. The findings demonstrates that there is a negative correlation between NDVI and the severity of urban waterlogging. A higher NDVI value indicates a stronger influence that can obviously mitigate urban waterlogging. Our results also show that the marginal effect value is larger than zero when the NDVI value is from 0.21 to 0.41, indicating that when the NDVI value is below 0.41, the marginal effect of vegetation cover on alleviating the susceptibility of urban waterlogging is not obvious. The marginal effect value is negative when the NDVI value is less than 0.21, which may be caused by the existence of rivers and lakes in the region with low NDVI values. However, since rivers and lakes play a positive role in alleviating susceptibility of waterlogging, therefore the marginal effect value is slightly less than 0. When considering the impacts of elevation on urban waterlogging, the marginal effect value shows a “single peak” structure that rises first and then falls as elevation increases (Figure 6E). When the elevation is in the range of 5–28 m, the marginal effect value is positive, indicating that urban waterlogging in the main urban area of Guangzhou is more likely to occur in this elevation range. This is also consistent with the topography of the main urban area of Guangzhou.
Based on the constructed GBDT model and analysis of influencing factors on urban waterlogging, this study intends to anticipate the possibility of waterlogging in each spatial unit of the study area. We began by dividing the study area into about 1.68 million spatial units (30 × 30 m). Then the influencing factors are unified to 30 m spatial resolution and input into the GBDT model. Following that, we obtained the predicted susceptibility values from each spatial unit, which ranged from −2.54 to 2.22, indicating that the higher the susceptibility prediction value, the greater the likelihood of waterlogging in the spatial unit. Finally, we used the natural breaks classification method to categorize the severity of waterlogging into five levels (Figure 7A). The reason for using natural breaks classification method for classification can be found in Section 2.3.3.
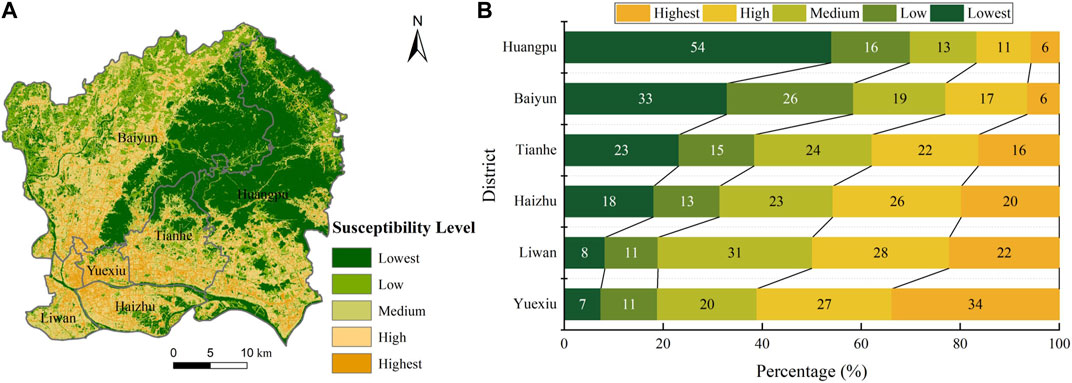
FIGURE 7. Assessment of susceptibility to urban waterlogging (A) and zonal statistics (B) based on GBDT.
From the perspective of spatial distribution (Figure 7A), the distribution of urban waterlogging susceptibility is obviously different, exhibiting characteristics of “high in the southwest and low in the northeast”, with the highest susceptibility areas primarily distributed in Yuexiu District, southern Tianhe District, northern Liwan and Haizhu District, accounting for 9.16% of the entire study area in the northern part; the lowest susceptibility areas are mainly distributed in the eastern part of Baiyun District and northern part of Huangpu District, accounting for 36.41% of the entire study area. We used the regional statistics function based on ArcGIS to compare and evaluate the distribution of waterlogging susceptibility in different administrative divisions, and the area proportions at different susceptibility levels in each region are estimated independently (Figure 7B). According to our results, Huangpu district is dominated by lowest-susceptibility locations, followed by Baiyun district, accounting for more than 50% and 33% of total area, respectively. Whereas Yuexiu district has the highest susceptibility locations (34%), followed by Liwan and Haizhu districts, with Huangpu and Baiyun districts accounting for 6% of the total area.
We used four metrics to evaluate the feasibility and effectiveness of the GBDT model and compared it with multiple linear regression (MLR), SVM, and RF in terms of accuracy. From Table 2, it can be seen that the Kappa coefficient of MLR is low, at 0.518. This is mainly because the explanatory variables in the study are continuous variables, while the response variable is a categorical variable (the number 1 represents flooded points and the number 0 represents non-flooded points), and the relationship between the explanatory variables and the response variable is a nonlinear one. The hyperparameters are searched and optimized while using all three machine learning algorithms, RF and GBDT of ensemble learning outperform SVM in terms of training accuracy. Both RF and GBDT exhibit higher training accuracy in various indicators, with the accuracy of Precision, Recall, and Accuracy all greater than 80% and the Kappa coefficients greater than 0.60, indicating that the training results obtained by applying these two models are highly consistent when compared with actual results. However, as compared to RF, GBDT performed better in terms of training accuracy, accurately classified 83.5% of the spatial units with a Kappa coefficient of 0.669, while RF underperformed (81.2% overall accuracy, Kappa coefficient 0.624). Furthermore, the precision and recall of GBDT are 82.9% and 85.3%, respectively, indicating that 82.9% of data identified to be waterlogging areas are correct, while 85.3% of the real waterlogging locations are accurately determined in all measured data. Consequently, GBDT outperforms SVM and RF in terms of training accuracy in predicting urban waterlogging susceptibility, and it can be used to carry out quantitative analysis and susceptibility assessment of urban waterlogging influencing factors.
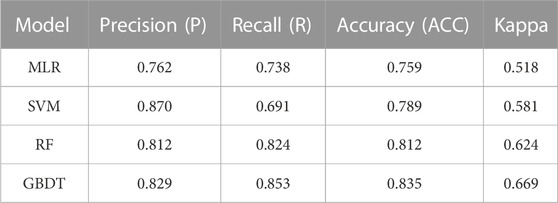
TABLE 2. Classification accuracy comparison.
In the past 10 years, a large number of studies have focused on the analysis of the influencing factors of urban waterlogging, and the research methods used are mainly based on the analysis of traditional regression analysis methods (Naren et al., 2022; Tang et al., 2022). However, traditional regression analysis methods are often based on the assumption that there is a linear relationship between urban waterlogging and various influencing factors, and it is difficult to quantify the relative contribution of each factor to urban waterlogging. Considering the possible complex relationship between urban waterlogging and various influencing factors, this study uses Gradient Boosting Decision Tree with a high Kappa coefficient to reveal the relative contribution of each factor to urban waterlogging, and reflects the relationship between urban waterlogging and various influencing factors through the marginal effect curve. The results show that drainage density, impervious surface and NDVI are the three key factors affecting urban waterlogging, and the contribution rates of each factor are 37.93%, 35.91%, and 11.50% respectively. Jiao et al. (2020) also pointed out that drainage density, impervious surface and vegetation coverage are the three main factors affecting urban waterlogging, and such results are mutually supportive with our results. The difference is that we quantified the relative contribution of each influencing factor, which provides a closer understanding for analyzing influencing factors on urban waterlogging.
The degree of urban waterlogging is mainly positively correlated with the drainage density, and the higher the drainage density, the more prone to waterlogging. The reasons for such findings can be explained as follows: 1) the drainage pipe inlets are typically located in low-lying areas within neighborhoods, making them prone to flooding; 2) the drainage pipe network facilities in the major metropolitan area of Guangzhou are insufficient, that’s why backflow is prone to occur during rainfall, resulting in serious flooding during every rain (Zhao and Wei, 2020); 3) Some drainage outlets in Guangzhou are clogged to varying degrees, resulting in the fact that these existing drainage pipe outlets may no longer function under heavy rain events. From the perspective of the relationship between impervious surface and urban waterlogging, there is a positive correlation between impervious surface and urban waterlogging degree. In areas with a higher proportion of impervious surface area, waterlogging is more likely to occur. This result affirms the findings of other studies (Huang et al., 2021). Therefore, the prevention and control of urban rainstorm waterlogging should pay attention to the optimization and adjustment of urban impervious surface pattern. From the perspective of the relationship between NDVI and urban waterlogging, NDVI has played a positive role in alleviating urban waterlogging. Relevant scholars have also drawn similar conclusions in the research of other cities. This shows that vegetation coverage has a hydrological regulation function. In areas with vegetation coverage, rainwater has good permeability and can reduce the direct flow of rainwater into the drainage system, thereby reducing the pressure on urban drainage systems. However, our study further shows that when the NDVI value is lower than 0.4, its effect on mitigating urban waterlogging susceptibility is not obvious. From the perspective of the relationship between elevation and urban waterlogging, the marginal effect value for areas below 5 m elevation is smaller than zero, which may be because rivers and lakes predominate in low-altitude regions, and there is less susceptibility of waterlogging. While in higher-altitude areas, rainwater flows from high to low altitudes. Hence the susceptibility of floods is likewise minimal. In contrast to previous studies, which primarily uses a single value to reflect the relationship between elevation and urban waterlogging (Jiao et al., 2020; Zhang et al., 2021a; Liu et al., 2021), we employed GBDT, which is able to directly show the changes of influence on urban waterlogging in case of variable value being changed, after average effect being considered for all other variables in models.
This study developed the distribution map of urban waterlogging susceptibility in the main urban area of Guangzhou is drawn, which is particularly important for urban waterlogging susceptibility prevention and future urban renewal planning, and helps local governments and urban planners to fully understand the spatial distribution pattern of urban waterlogging susceptibility. Our research shows that Yuexiu District, Liwan District, and Haizhu District are the main distribution areas with high waterlogging susceptibility, and Yuexiu District has the highest proportion of areas with high waterlogging susceptibility. The main reason for this is that Yuexiu, Liwan and Haizhu District are the three traditional old urban areas in Guangzhou, of which Yuexiu District is the oldest central downtown with large population and higher proportion of impervious area, meanwhile, such old downtown has a long history, and some drainage facilities may have lagged design standards and have not been updated and maintained in a timely manner (Xie, 2013), which results in waterlogging in this area much easier. From the perspective of the spatial pattern of waterlogging susceptibility in the study area, the assessment results of GBDT, SVM and RF all demonstrate the spatial distribution feature of “high in the southwest and low in the northeast”. Among them, the assessment results of RF and GBDT are similar through visual interpretation (Figures 7, 8). However, compared to SVM and RF, GBDT has higher proportion for the lowest susceptibility areas, the low susceptibility areas, and the highest susceptibility areas. The proportion of the high susceptibility areas obtained by GBDT is relatively small (Table 3). Moreover, it is worth noting that SVM evaluation results for waterlogging susceptibility are generally high, especially for identifying high susceptibility areas (42.33%), which is significantly higher than that of RF and GBDT. However, SVM performs poorly in identifying the lowest and low susceptibility areas, with proportions of 16.25% and 15.05%, respectively. This is consistent with the analysis result of low recall rate of SVM in Table 2. In addition, as shown in Figure 8A, SVM did not identify rivers and lakes belonging to the lowest susceptibility areas very well.
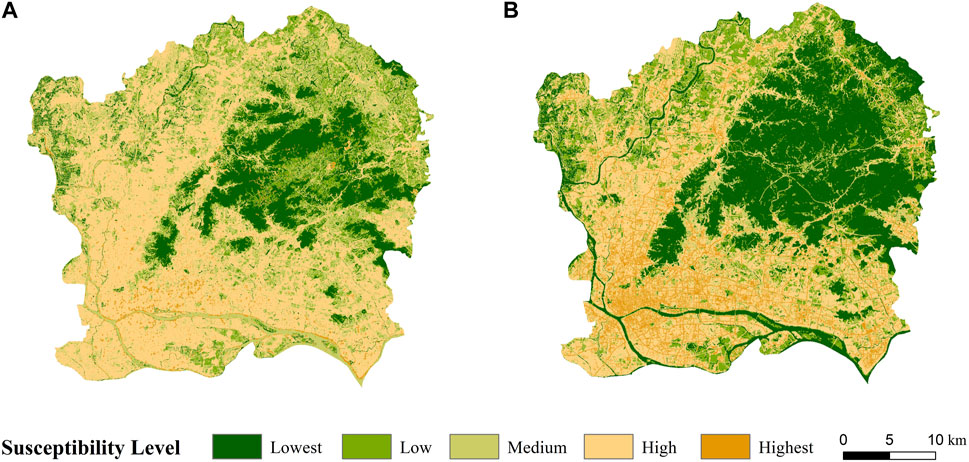
FIGURE 8. Susceptibility assessment of urban waterlogging based on SVM (A) and RF (B).
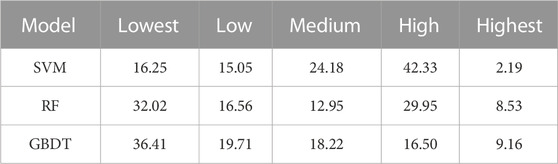
TABLE 3. Comparison of waterlogging susceptibility assessment results (%).
In this study, we quantitatively analyzed the impact of various factors on urban waterlogging, which will help us provide theoretical and practical references for urban waterlogging prevention and sustainable urban development. Among them, drainage density is one of the most important factors affecting urban waterlogging. This study exposed the current situation of insufficient drainage capacity of the pipe network in the main urban area of Guangzhou. Therefore, in the process of future urban renewal planning, it is recommended to strengthen the renovation and upgrading of drainage pipes, especially focusing on the transformation of the drainage network in the old urban area, so as to ensure the smooth flow of the city’s overall drainage pipes. Secondly, it is necessary to take practical and effective measures to do a good job in the daily maintenance of the drainage pipe network, repair and clean the drainage pipe network in time, and ensure that the drainage network can function normally when the summer flood season comes. In addition, according to the natural conditions of the region, rainwater storage tanks can be set up in natural depressions, ponds, park pools, etc., and the water stored in the storage tanks can be evenly discharged after the flood peak flow drops to the design flow of the pipeline.
Although the drainage pipe network has played an important role in alleviating urban waterlogging, simply relying on the improvement of engineering drainage system standards cannot effectively solve the waterlogging problem. Compared with other land use types, impervious surface and NDVI have important impacts on urban waterlogging, and their contributions are higher than that of topography (elevation and slope). In the process of urban renewal planning, it is recommended to consider both the surface impermeable surface and the underground drainage network to achieve the coupling optimization of the two. Therefore, the underground drainage network should be considered while optimizing the spatial pattern of the impervious surface, and vice versa. In addition, in terms of urban green space planning, local governments should try to increase the urban green area, thereby reducing surface runoff and flood peak flow. For example, it can be carried out by building roof gardens, plant-planting walls, and sunken green spaces. From the perspective of topography, in areas above 28 m above sea level, the susceptibility of waterlogging decreases with the increase in altitude. Therefore, it is suggested that local governments can appropriately increase the consideration of terrain conditions when carrying out urban renewal planning, and should scientifically plan and manage urban development in flat areas. In addition, for areas with higher susceptibility, it is urgent to formulate relevant spatial use control plans, strictly control construction activities in high-susceptibility areas, and prevent the occurrence of urban waterlogging disasters from the planning (Zhao and Wei, 2020). At the same time, local governments should improve the construction of drainage and waterlogging emergency response systems in order to strengthen early warning and prevention. By promptly detecting waterlogging issues, they can provide sufficient time for personnel to avert disasters and effectively reduce the impact of waterlogging on cities and citizens (Kong et al., 2021).
It is necessary to point out the limitations of this study. First, causing factors are closely related to climate change, especially the change of precipitation (Deng et al., 2022). Based on the Guangzhou Statistical Yearbooks from 2011 to 2018, the mean annual rainfall remained relatively stable. Besides, it is also difficult to obtain the specific precipitation corresponding to each waterlogging point. Therefore, we assume that the precipitation in this study area is constant. The results of this study might be improved if climate change within the study period could be considered. Secondly, emergency management capability is also an important factor affecting urban waterlogging. Future studies should address the duration of waterlogging to assess the susceptibility of waterlogging disasters more accurately. Third, this study takes the main urban area of Guangzhou as a case study, and the research conclusions are primarily focused on the situation of the main urban area of Guangzhou. Still, research on other cities may need to be further analyzed and verified according to real conditions. In addition, GBDT has some inherent limitations that are worth mentioning. Since each basic decision tree in GBDT needs to be trained based on the residual of the previous one, parallelization of the algorithm can be difficult and training time can be long. If data contains large noise, GBDT may overfit during the training process due to its step-by-step residual fitting approach. Additionally, hyperparameters such as the number of trees, depth of trees, and learning rate need to be tuned for optimal results, making parameter tuning a time-consuming and cumbersome process.
This paper takes the main urban area of Guangzhou with frequent waterlogging as an empirical case, which quantitatively analyzes the relationship between urban waterlogging and various influencing factors based on the GBDT model. And develops the urban waterlogging susceptibility distribution map, which can be used to prevent and manage urban waterlogging disasters and urban renewal planning, providing an auxiliary decision-making basis. The main conclusions are as follows:
(1) The technical framework proposed in this study, based on the GBDT model, can adequately reveal the quantitative relationship between urban waterlogging and various influencing factors, with better prediction performance, with an ACC of 83.5% and a kappa value of 0.669. Furthermore, this model outperforms SVM and RF in terms of performance. (2) The urban waterlogging in Guangzhou represents significant positive spatial autocorrelation characteristics, with a significant spatial agglomeration degree of waterlogging, and obviously distributed block in hot-spot areas. The results contribute to a better understanding of the spatial distribution characteristics of urban waterlogging. (3) Drainage density (37.93%), impervious surface (35.91%), and NDVI (11.5%) are the main influencing factors of urban waterlogging. Among them, drainage density and impervious surface both exhibit positive correlation with waterlogging, while NDVI exhibits a negative correlation. Therefore, the results imply that efforts should be directed toward optimizing the spatial pattern of impervious surfaces and the layout of the drainage network in order to minimize urban waterlogging. In consideration of the positive effects of vegetation coverage with functions of regulating and storing rainwater, especially when the NDVI value is above 0.41, as the NDVI increases, the effect on alleviating disasters caused by urban waterlogging becomes more apparent. Therefore, there is an urgent need to consider urban green space development in order to ensure natural rainfall penetration. (4) Some locations in the main urban area of Guangzhou are more vulnerable to waterlogging. Among them, Yuexiu District is the main distribution area of high susceptibility of waterlogging. In such high-susceptibility locations, urban waterlogging susceptibility prevention and control, as well as planning and construction for a sponge city, should be addressed in the future.
The raw data supporting the conclusion of this article will be made available by the authors, without undue reservation.
Conceptualization, JZ, JW, and YZ; data curation, YZ and YY; methodology, YZ, JZ, and JW; software and code, JZ and ZA; formal analysis, JZ and YZ; resources, YZ and ZA; visualization, JZ and ZA; writing—original draft, JZ; writing—review and editing, JZ, JW, and YZ; supervision, YZ and JW; project administration, YZ.
The study was supported by the National Natural Science Foundation of China (No. 41871292), the Science and Technology Program of Guangdong Province, China (Nos 2018B020207002 and 2021B1212100003), and the Marine Economy Development Foundation of Guangdong Province (No. GDNRC [2022] 21).
The authors declare that the research was conducted in the absence of any commercial or financial relationships that could be construed as a potential conflict of interest.
All claims expressed in this article are solely those of the authors and do not necessarily represent those of their affiliated organizations, or those of the publisher, the editors and the reviewers. Any product that may be evaluated in this article, or claim that may be made by its manufacturer, is not guaranteed or endorsed by the publisher.
Aerospace Information Research Institute, Chinese Academy of Sciences (2020). Gf1-2m land use classification dataset in the Pearl River Delta region. China: Chinese Academy of Sciences. doi:10.12237/casearth.60e55fca819aec59a2af708f
China Ministry Of Water Resources (2018). Bulletin of flood and Drought disasters in China. Beijing: China Water and Power Press.
Deng, G. Q., Chen, H., and Wang, S. Q. (2022). Risk assessment and prediction of rainstorm and flood disaster based on Henan province, China. Math. Problems Eng. 5310920, 1–17. doi:10.1155/2022/5310920
Fang, X. R., Wen, Z. F., Chen, J. L., Wu, S. J., Huang, Y. Y., and Ma, M. H. (2019). Remote sensing estimation of suspended sediment concentration based on Random Forest Regression Model. J. Remote Sens. 23 (04), 756–772. doi:10.11834/jrs.20197498
Febrianto, H., Fariza, A., and Hasim, J. (2016). “Urban flood risk mapping using analytic hierarchy process and natural break classification (Case study: Surabaya, East Java, Indonesia),” in International Conference on Knowledge Creation and Intelligent Computing IEEE, Manado, Indonesia, 15-17 November 2016 (IEEE).
Felix, A. Y., and Sasipraba, T. (2019). “Flood detection using gradient boost machine learning approach,” in Proceedings of 2019 international conference on computational intelligence and knowledge economy (iccike' 2019). Editors P. Maheshwari, V. P. Mishra, S. S. Velan, and V. Naranje (Dubai: IEEE).
Friedman, J. H. (2001). Greedy function approximation: A gradient boosting machine. Ann. Statistics 29 (5), 1189–1232. doi:10.1214/aos/1013203451
Friedman, J. H. (2002). Stochastic gradient boosting. Comput. Statistics Data Analysis 38 (4), 367–378. doi:10.1016/S0167-9473(01)00065-2
Ge, Y., Wang, M. X., Sun, X. W., and Qi, J. D. (2017). Variation analysis of daily PM2. 5 concentrations based on boosted regression tree: A case study in changzhou. Environmetal Sci. 38 (02), 485–494. doi:10.13227/j.hjkx.201607067
Getis, A., and Ord, J. K. (1992). The analysis of spatial association by use of distance statistics. Geogr. Anal. 24 (3), 189–206. doi:10.1111/j.1538-4632.1992.tb00261.x
Holben, B. N. (1986). Characteristics of maximum-value composite images from temporal AVHRR data. Int. J. Remote Sens. 7, 1417–1434. doi:10.1080/01431168608948945
Huang, H. B., Wang, X. W., and Liu, L. (2021). A review on urban pluvial floods: Characteristics, mechanisms, data, and research methods. Prog. Geogr. 06 (40), 1048–1059. doi:10.18306/dlkxjz.2021.06.014
Huang, H., Chen, X., Zhu, Z., Xie, Y., Liu, L., Wang, X., et al. (2018). The changing pattern of urban flooding in Guangzhou, China. Sci. Total Environ. 622-623, 394–401. doi:10.1016/j.scitotenv.2017.11.358
IPCC (2014). Climate change 2014: Impacts, adaptation, and vulnerability: Working group II contribution to the fifth assessment report of the intergovernmental Panel on climate change. Cambridge: Cambridge University Press.
Jenks, G. F. (1967). The data model concept in statistical mapping. Int. Yearb. Cartogr. 7, 186–190.
Jian, W., Li, S. S., Lai, C. G., Wang, Z. L., Cheng, X. J., Lo, E. Y. M., et al. (2021). Evaluating pluvial flood hazard for highly urbanised cities: A case study of the pearl river delta region in China. Nat. Hazards 105 (2), 1691–1719. doi:10.1007/s11069-020-04372-3
Jiao, S., Hu, X., and Han, Z. W. (2020). A study on quantitative evaluation of effect factors of urban waterlogging under multiple scales: Taking five internal zones in changsha as an example. Ecol. Econ. 05 (36), 222–229.
Jongman, B., Ward, P. J., and Aerts, J. C. (2012). Global exposure to river and coastal flooding: Long term trends and changes. Glob. Environ. Change-Human Policy Dimensions 22 (4), 823–835. doi:10.1016/j.gloenvcha.2012.07.004
Khosravi, K., Nohani, E., Maroufinia, E., and Pourghasemi, H. R. (2016). A GIS-based flood susceptibility assessment and its mapping in Iran: A comparison between frequency ratio and weights-of-evidence bivariate statistical models with multi-criteria decision-making technique. Nat. Hazards 83 (2), 947–987. doi:10.1007/s11069-016-2357-2
Koch, L. G. G., and Koch, G. G. (1977). The measurement of observer agreement for categorical data. Biometrics 33 (1), 159–174.
Kohavi, R., and Provost, F. (1998). Special issue on applications of machine learning and the knowledge discovery process. Mach. Learn. 30 (2), 127–132. doi:10.1023/a:1007442505281
Kong, F., Sun, S., and Lei, T. J. (2021). Understanding China’s urban rainstorm waterlogging and its potential governance. Water 13 (7), 891. doi:10.3390/w13070891
Li, B. Y., Zhao, Y. L., and Fu, Y. C. (2015). Spatio-temporal characteristics of urban storm waterlogging in Guangzhou and the impact of urban growth. J. Geo-information Sci. 17 (04), 445–450.
Li, H. H., and Wu, J. D. (2018). Rainstorm characteristics and its relationship with waterlogging disaster in shanghai during 2007-2016. J. Nat. Resour. 33 (12), 2136–2148. doi:10.31497/zrzyxb.20180559
Li, Q., Jiang, X. W., and Liu, D. H. (2013). Analysis and modelling of flood risk assessment using information diffusion and artificial neural network. Water sa. 39 (5), 643–648. doi:10.4314/wsa.v39i5.8
Lin, J. Y., He, X. Y., Lu, S. Y., Liu, D. Y., and He, P. T. (2021). Investigating the influence of three-dimensional building configuration on urban pluvial flooding using random forest algorithm. Environ. Res. 196, 110438. doi:10.1016/j.envres.2020.110438
Liu, F., Liu, X. D., Xu, T., Yang, G., and Zhao, Y. L. (2021). Driving factors and risk assessment of rainstorm waterlogging in urban agglomeration areas: A case study of the Guangdong-Hong Kong-Macao greater Bay area, China. Water 13 (6), 770. doi:10.3390/w13060770
Liu, S., Huang, D., and Chen, T. (2022). Studies on the influence of underlying surface factors on urban waterlogging: A case of Huangpu district, Guangzhou city. Water and Wastewater Eng. 48 (S1), 665–673. doi:10.13789/j.cnki.wwe1964.2021.11.19.0005
Liu, S., Lin, M., and Li, C. (2019a). Analysis of the effects of the river network structure and urbanization on waterlogging in high-density urban areas-A case study of the pudong new area in shanghai. Int. J. Environ. Res. Public Health 16 (18), 3306. doi:10.3390/ijerph16183306
Liu, W. D., Tang, Z. P., Xia, Y., Han, M. Y., and Jiang, W. B. (2019b). Identifying the key factors influencing Chinese carbon intensity using machine learning, the random forest algorithm, and evolutionary analysis. Acta Geogr. Sin. 74 (12), 2592–2603. doi:10.11821/dlxb201912012
Lu, W. (2022). Machine learning formula derivation and code implementation. Beijing: People's Posts and Telecommunications Press.
Marjanović, M., Kovačević, M., Bajat, B., and Voženílek, V. (2011). Landslide susceptibility assessment using svm machine learning algorithm. Eng. Geol. 123 (3), 225–234. doi:10.1016/j.enggeo.2011.09.006
Merz, B., Kreibich, H., and Lall, U. (2013). Multi-variate flood damage assessment: A tree-based data-mining approach. Nat. Hazards Earth Syst. Sci. 13 (1), 53–64. doi:10.5194/nhess-13-53-2013
Naren, M., Gong, L. X., Zhang, H. G., Chun, F., and Guo, E. L. (2022). Spatial and temporal distribution of urban waterlogging and its causes: A case study of hohhot. J. Catastrophology 37 (1), 107–111. doi:10.3969/j.issn.1000-811X.2022.01.019
Nowak, D. J., and Greenfield, E. J. (2020). The increase of impervious cover and decrease of tree cover within urban areas globally (2012-2017). Urban For. Urban Green. 49, 126638. doi:10.1016/j.ufug.2020.126638
Qian, Y., Wang, H., and Wu, J. S. (2021). Protecting existing urban green space versus cultivating more green infrastructures: Strategies choices to alleviate urban waterlogging risks in shenzhen. Remote Sens. 13 (21), 4433. doi:10.3390/rs13214433
Shen, Z. H., and Yong, B. (2021). Downscaling the GPM-based satellite precipitation retrievals using gradient boosting decision tree approach over Mainland China. J. Hydrology 602, 126803. doi:10.1016/j.jhydrol.2021.126803
Shu, Y., Zheng, G., and Yan, X. (2021). Application of Multiple Geographical Units Convolutional Neural Network based on neighborhood effects in urban waterlogging risk assessment in the city of Guangzhou, China. Phys. Chem. Earth, Parts A/B/C 126, 103054. doi:10.1016/j.pce.2021.103054
Singh, R. B., and Singh, S. (2011). Rapid urbanization and induced flood risk in Noida, India. Asian Geogr. 28 (2), 147–169. doi:10.1080/10225706.2011.629417
Tang, X. Z., Hong, H. Y., Shu, Y. Q., Tang, H. J., Li, J. F., and Liu, W. (2019). Urban waterlogging susceptibility assessment based on a PSO-SVM method using a novel repeatedly random sampling idea to select negative samples. J. Hydrology 576, 583–595. doi:10.1016/j.jhydrol.2019.06.058
Tang, Y. Y., Pan, Y. Z., and Fan, J. J. (2022). The influence of landscape pattern on the risk of urban waterlogging disaster. Water Resour. Hydropower Eng. 52 (12), 1–11. doi:10.13928/j.cnki.wrahe.2021.12.001
Tehrany, M. S., Jones, S., and Shabani, F. (2019). Identifying the essential flood conditioning factors for flood prone area mapping using machine learning techniques. Catena 175, 174–192. doi:10.1016/j.catena.2018.12.011
Wang, C. X., Du, S. Q., Wen, J. H., Zhang, M., Gu, H. H., Shi, Y., et al. (2017). Analyzing explanatory factors of urban pluvial floods in Shanghai using geographically weighted regression. Stoch. Environ. Res. Risk Assess. 31 (7), 1777–1790. doi:10.1007/s00477-016-1242-6
Wang, L. W., and Feng, C. C. (2016). Spatial expansion pattern and its driving dynamics of Beijing-Tianjin-Hebei metropolitan region: Based on nighttime light data. Acta Geogr. Sin. 71 (12), 2155–2169. doi:10.11821/dlxb201612007
Wang, W. W., Wang, Q., Lin, H., Gong, D. J., and Zhang, S. W. (2015). Summarization and prospection for the studies on China's urban waterlogging. Urban Probl. 10, 24–28. doi:10.13239/j.bjsshkxy.cswt.151004
Wang, Y. C., Zheng, D. W., and Li, Q. C. (2009). Urban meteorological disaster. Beijing: China Meteorological Press.
Wei, L. F., Huang, C., Wang, Z. X., Wang, Z., Zhou, X. C., and Cao, L. Q. (2019). Monitoring of urban black-odor water based on nemerow index and gradient boosting decision tree regression using uav-borne hyperspectral imagery. Remote Sens. 11, 2402. doi:10.3390/rs11202402
Woznicki, S. A., Baynes, J., Panlasigui, S., Mehaffey, M., and Neale, A. (2019). Development of a spatially complete floodplain map of the conterminous United States using random forest. Sci. Total Environ. 647, 942–953. doi:10.1016/j.scitotenv.2018.07.353
Wu, J. S., and Zhang, P. H. (2017). The effect of urban landscape pattern on urban waterlogging. Acta Geogr. Sin. 03 (72), 444–456. doi:10.11821/dlxb201703007
Wu, Y., Zhong, P. A., Zhang, Y., Xu, B., Ma, B., and Yan, K. (2015). Integrated flood risk assessment and zonation method: A case study in huaihe river basin, China. Nat. Hazards 78 (1), 635–651. doi:10.1007/s11069-015-1737-3
Xiao, S. C., Peng, X. M., and Tian, Q. Y. (2016). Climatic and human drivers of recent lake-level change in East Juyan Lake, China. Reg. Environ. Change 16 (4), 1063–1073. doi:10.1007/s10113-015-0822-1
Xie, L. J., Flynn, A., Tan-Mullins, M., and Cheshmehzangi, A. (2019). Water and land: Environmental governance and Chinese eco-development. J. Clean. Prod. 221, 839–853. doi:10.1016/j.jclepro.2019.02.204
Xie, Y. X. (2013). Development of drainage planning in view of frequent urban waterlogging disasters. City Plan. Rev. 37 (02), 45–50.
Yao, H. M., Huang, Y., Wei, Y. M., Zhong, W. P., and Wen, K. (2021). Retrieval of chlorophyll-a concentrations in the coastal waters of the beibu gulf in guangxi using a gradient-boosting decision tree model. Appl. Sci. Basel 11, 7855. doi:10.3390/app11177855
Yi, J. W., Wang, N., Qian, J. L., Ma, T., Du, Y. Y., Pei, T., et al. (2020). Spatio-temporal responses of urban road traffic and human activities in an extreme rainfall event using big data. Acta Geogr. Sin. 03 (75), 497–508. doi:10.11821/dlxb202003005
Yu, H. F., Zhao, Y. L., Fu, Y. C., and Li, L. (2018). Spatiotemporal variance assessment of urban rainstorm waterlogging affected by impervious surface expansion: A case study of Guangzhou, China. Sustainability 10 (10), 3761. doi:10.3390/su10103761
Yu, H., Zhao, Y., and Fu, Y. (2019). Optimization of impervious surface space layout for prevention of urban rainstorm waterlogging: A case study of Guangzhou, China. Int. J. Environ. Res. Public Health 16 (19), 3613. doi:10.3390/ijerph16193613
Zang, J. L., Guo, Q. Z., Sang, X., Xie, T. Y., and He, C. W. (2020). Coupling relationship between spatial-temporal variation of lakes and waterlogging in the coastal city Tianjin. J. Remote Sens. 24 (02), 199–213. doi:10.11834/jrs.20208303
Zhang, H., Cheng, J., Wu, Z. F., Li, C., Qin, J., and Liu, T. (2018). Effects of impervious surface on the spatial distribution of urban waterlogging risk spots at multiple scales in Guangzhou, south China. Sustainability 10 (5), 1589. doi:10.3390/su10051589
Zhang, Q. F., Wu, Z. F., and Tarolli, P. (2021b). Investigating the role of green infrastructure on urban WaterLogging: Evidence from metropolitan coastal cities. Remote Sens. 13 (12), 2341. doi:10.3390/rs13122341
Zhang, Q., Wu, Z., Guo, G., Zhang, H., and Tarolli, P. (2021a). Explicit the urban waterlogging spatial variation and its driving factors: The stepwise cluster analysis model and hierarchical partitioning analysis approach. Sci. Total Environ. 763, 143041. doi:10.1016/j.scitotenv.2020.143041
Zhang, Q., Wu, Z., Zhang, H., Frontana, G. D., and Tarolli, P. (2020a). Identifying dominant factors of waterlogging events in metropolitan coastal cities: The case study of Guangzhou, China. J. Environ. Manag. 271, 110951. doi:10.1016/j.jenvman.2020.110951
Zhang, T. N., He, W. H., Zheng, H., Cui, Y. P., Song, H. Q., and Fu, S. L. (2021c). Satellite-based ground PM2.5 estimation using a gradient boosting decision tree. Chemosphere 268, 128801. doi:10.1016/j.chemosphere.2020.128801
Zhang, T. Y., Su, H., Yang, X., and Yan, X. H. (2020b). Remote sensing prediction of global subsurface thermohaline and the impact of longitude and latitude based on LightGBM. J. Remote Sens. 24 (10), 1255–1269. doi:10.11834/jrs.20200007
Zhang, W., Li, S. M., and Sui, Z. N. (2012). Formation causes and coping strategies of urban rainstorm waterlogging in China. J. Nat. Disasters 21 (05), 180–184. doi:10.13577/j.jnd.2012.0525
Zhao, G., Pang, B., Xu, Z. X., Peng, D. Z., and Xu, L. Y. (2019). Assessment of urban flood susceptibility using semi-supervised machine learning model. Sci. Total Environ. 659, 940–949. doi:10.1016/j.scitotenv.2018.12.217
Zhao, L. Y., and Wei, J. L. (2020). Impact of urban development on the risk of flooding: A case study of wuhan city, China. Prog. Geogr. 11 (39), 1898–1908. doi:10.18306/dlkxjz.2020.11.010
Keywords: urban waterlogging, influencing factors, Guangzhou, susceptibility assessment, ensemble learning
Citation: Zhao J, Wang J, Abbas Z, Yang Y and Zhao Y (2023) Ensemble learning analysis of influencing factors on the distribution of urban flood risk points: a case study of Guangzhou, China. Front. Earth Sci. 11:1042088. doi: 10.3389/feart.2023.1042088
Received: 12 September 2022; Accepted: 24 April 2023;
Published: 09 May 2023.
Edited by:
Shailesh Kumar Singh, National Institute of Water and Atmospheric Research (NIWA), New ZealandReviewed by:
Feng Kong, China Agricultural University, ChinaCopyright © 2023 Zhao, Wang, Abbas, Yang and Zhao. This is an open-access article distributed under the terms of the Creative Commons Attribution License (CC BY). The use, distribution or reproduction in other forums is permitted, provided the original author(s) and the copyright owner(s) are credited and that the original publication in this journal is cited, in accordance with accepted academic practice. No use, distribution or reproduction is permitted which does not comply with these terms.
*Correspondence: Jin Wang, d2FuZ2ppbkBtLnNjbnUuZWR1LmNu; Yaolong Zhao, emhhb3lhb2xvbmdAbS5zY251LmVkdS5jbg==
Disclaimer: All claims expressed in this article are solely those of the authors and do not necessarily represent those of their affiliated organizations, or those of the publisher, the editors and the reviewers. Any product that may be evaluated in this article or claim that may be made by its manufacturer is not guaranteed or endorsed by the publisher.
Research integrity at Frontiers
Learn more about the work of our research integrity team to safeguard the quality of each article we publish.