 Robin Campion
 Diego Coppola
94% of researchers rate our articles as excellent or good
Learn more about the work of our research integrity team to safeguard the quality of each article we publish.
Find out more
ORIGINAL RESEARCH article
Front. Earth Sci., 07 February 2023
Sec. Volcanology
Volume 11 - 2023 | https://doi.org/10.3389/feart.2023.1040199
This article is part of the Research TopicRemote Sensing of Volcanic Gas Emissions from the Ground, Air, and SpaceView all 18 articles
Lava lakes are a fascinating but somewhat rare form of volcanic activity. Lava lakes are large free surfaces of hot lava that discharge continuously, and almost quietly, heat and volcanic gases into the atmosphere. They are thought to be fed by convection processes that bring hot gas-rich magma to the surface and back downward, after its cooling and outgassing. A lava lake represents a latent threat for the populations living nearby, as it can drain suddenly through fissures and generate dangerously fast lava flows. We present time series of Volcanic Radiative Power (VRP) and SO2 flux measured from satellites (MODIS and OMI, respectively) from several lava lakes on Earth (Erta Ale, Nyiragongo, Kilauea, Nyamuragira, Ambrym, and Villarrica). Based on long-term trends plotted in a simple VRP versus SO2 flux diagram, we propose a new classification of lava lakes in three categories: small lakes, large foam-dominated lakes, and large melt-dominated lakes. Small lakes show a long-term correlation between VRP and SO2 emissions, while large lakes seem to show an anticorrelation between VRP and SO2 emissions. This at-first-glance surprising anticorrelation probably results from the limited heat transport capacity of the gas-rich foam that initially feeds the convection of these lakes. We also show that the formation of three large lava lakes in the last 2 decades at the rift and hotspot volcanoes followed a similar trend of transitioning, in a few months, from foam-dominated to melt-dominated. We deduce that lava lake formation at these volcanoes follows a common sequence of processes that includes the formation of a large shallow magma reservoir and its outgassing through a newly formed pit crater.
Lava lakes can be defined as large free surfaces of magma in contact with the atmosphere, discharging quietly but continuously considerable amounts of heat and volcanic gases into it. This is rather an uncommon form of volcanic activity on Earth. At the time of writing, only six or seven volcanoes are known to host a lava lake (Figure 1). These are Erta Ale (Ethiopia, Le Guern et al., 1979), Masaya (Nicaragua, Aiuppa et al., 2018), Nyamuragira (Democratic Republic of Congo, Campion, 2014; Coppola et al., 2016a), Mt. Erebus (Antarctica, Sweeney et al., 2008), Villarrica (Chile, Witter et al., 2004; Moussallam et al., 2016), and possibly Mt. Michael (South Sandwich Islands, inferred from satellite data by Gray et al. (2019), but not yet observed directly). In the past, notorious permanent lava lakes have been observed at Kilauea (Hawaii Island) and Mt. Nyiragongo (Democratic Republic of Congo). Although being amongst the quietest forms of volcanic activity, a lava lake represents a latent volcanic hazard. Indeed, historical experience has taught us that they can drain suddenly through fissures cutting the volcanic edifices that host them, unleashing fast-flowing lava flows on their outer slopes. Many long-lived lava lakes have disappeared in this way, after several years to decades of activity, such as those of Nyiragongo in 1977 (Tazieff, 1977) and 2021 (Smittarello et al., 2022), Kilauea in 2018 (Patrick et al., 2020), and Ambrym in 2018 (Shreve et al., 2019).
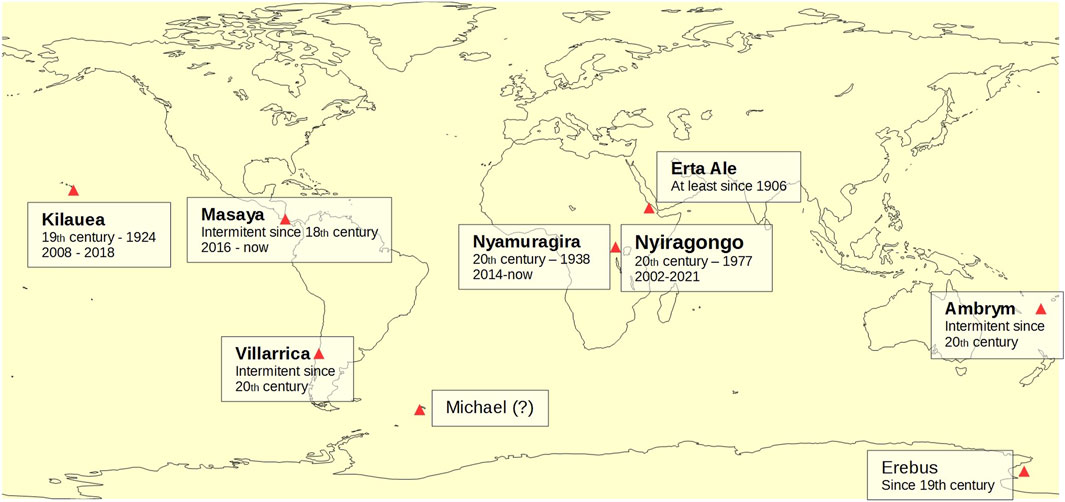
FIGURE 1. Location of the volcanoes that are hosting or have recently hosted a lava lake. Volcanoes in bold are discussed in this study. The periods of existence of each lava lake are mentioned when known.
Lava lakes have also played a historically important role in the development of volcanology because their long-lasting and safely accessible activity allowed the planning and deployment of the first multidisciplinary measurement campaigns on active volcanoes (e.g., Jaggar, 1917; Tazieff, 1966). It soon became evident to these pioneers that the tremendous heat loss by radiation needed to be compensated by a vigorous convection process bringing juvenile hot and volatile-rich magma to the surface and returning it at depth after cooling and degassing. This concept has since then been modeled and refined by various authors (Kazahaya et al., 1994; Stevenson and Blake, 1998; Harris et al., 1999; Witham et al., 2006; Palma et al., 2011). Bouche et al. (2010) proposed an alternative theory to the magmatic convection model that the heat transfer was caused by gas bubbles dragging the magma upward in their wake. Multiparametric observations of the activity of several lava lakes suggest that gas flux, magma viscosity, and lake size exert major controls on its convection dynamics (Moussallam et al., 2016; Lev et al., 2019). In a recent review, Lev et al. (2019) defined two categories of lava lakes based on the velocity field of their surface currents and their percentage of crust-covered surface: Chaotic lakes are stirred by fast (>1 m/s) and turbulent currents and incessant bubble bursting, which maintain their surface mostly crust-free and incandescent, while the surface of organized lakes is covered by a plastic to semi-rigid cooling crust divided in plates that moves in a slower (a few centimeters per second) and more coherent way. Lev et al. (2019) reported a rather good correlation between the surface velocity of the convection currents and the ratio of gas flux emitted by the lake to its surface area. Although these studies are interesting to characterize the activity of a lava lake at a certain time, they paid little attention to the changes of a given lava lake from one type to another and their significance in how lava lakes form and are fed.
In this work, we present time-resolved data sets of SO2 flux and thermal power radiated from the lava lakes worldwide. We propose a new classification based on a simple diagram of Volcanic Radiative Power (VRP) versus SO2 flux, which can be obtained purely from the remote sensing data. We identify, based on this diagram, families of lava lakes and a common trend associated with the formation and maturation of the three new lava lakes that have appeared over the last 2 decades. We interpret these trends in terms of the styles of magma supply to the lakes and propose a model of lava lake formation and evolution at the rifts and hotspot volcanoes.
Since we are interested in long-term trends, the SO2 flux measurements presented here are the monthly average values. Campion (2014) showed that a tight linear correlation exists between the monthly averaged SO2 mass around the volcano and the monthly average of the SO2 fluxes calculated on a daily basis over the same month using the traverse method. The R2 correlation coefficient of these correlations is usually superior to 0.8, and their slope coefficient is specific for each volcano, depending on the plume transport and atmospheric conditions. The SO2 fluxes presented in this study were calculated from the monthly averaged SO2 mass after calibrating the mass to flux relation for each volcano over a period of several months of fluctuating SO2 flux (see calibration details for each volcano in Supplementary Material). When the SO2 emissions are too small to cause a monthly SO2 anomaly that stands consistently out of the sensor noise, we average the images over a year and calibrate with the flux data of Carn et al. (2017). We used the literature values in the cases where no OMI data were available (Nyiragongo during 2002 and 2003)
In this work, we used the MODIS data processed by the MIROVA algorithm (Coppola et al., 2016b; https://www.mirovaweb.it/). This system processes the infrared images at 1 km of resolution acquired daily by the two MODIS sensors on board the polar satellites Terra and Aqua (EOS-NASA missions). The algorithm is built to detect and locate sub-pixel thermal anomalies sourced by the various types of high-temperature volcanic activity, including lava lakes (Coppola et al., 2016a). Once a thermal anomaly is detected the associated VRP is calculated by using the “MIR method” (Wooster et al., 2003), an approach based on the analysis of the mid-infrared (MIR) radiance in excess to the background (see Coppola et al., 2016a for details). The VRP is calculated in Watts (W) and represents a combined measurement of the area of the volcanic emitter (i.e., the lava lake area) and its effective radiating temperature. The MODIS MIR band (Band 21 or 22) is centered at 3,959 μm, with a bandwidth ranging from 3,929–3,989 μm. The CO2 absorption band in the MIR is centered at 4.2 μm and does not produce a significant absorption in the MODIS band 21. H2O does not absorb in that wavelength range either. SO2 does have an absorption band (ν1 +ν2, stretching from 3.95 μm to 4.07 μm) that overlaps marginally on Band 21, but this is a weak absorption band (HITRAN database, https://hitran.org/lbl/, Rothman et al., 2013). Our calculations show that a 200 m thick plume with 200 ppm should produce a band-integrated absorbance of less than 5%. Band 21 can therefore be considered quite transparent to volcanic gases and the atmosphere. Aerosols are more of a concern. The plumes emanating from lava lakes have a quite variable optical thickness that depends strongly on the atmospheric humidity and mixing pattern (see Matsushima and Shinohara, 2006). Several volcanoes in this study are located in the tropical regions where meteorological clouds or water droplets condensing in the plume often mask, partially or totally, the thermal radiance emitted by the lake. To cope with this variable underestimation factor, the VRP values that are used in this study are the maximum values recorded each month. This approach is based on the assumption that most of the data variability over a month is due to the partial masking of the IR radiation by the clouds or the condensed plume so that the maximum VRP of each month is recorded when the volcano is observed on the optimal viewing conditions. We checked this hypothesis by comparing the variability of the monthly means, weekly maxima and monthly maxima calculated for a time series of VRP from Nyiragongo volcano during year 2010, where field observations showed a very stable activity and constant lake dimension. However, we acknowledge that each lava lake’s activity has its own variability and that the abovementioned approach may lead to a slight overestimation of the “true” mean VRP radiated by the lava lake.
In this section, we present the time series of monthly averaged SO2 flux and monthly maximal VRP for several volcanoes that are or have recently been hosting a lava lake, together with a summary of their activity.
Erta Ale (Ethiopia, 13.6°N, 40.67°E) is a broad tholeiitic shield volcano located on the spreading axis of the Danakil Rift. Its 0.7 × 1.6 km, elliptical summit caldera hosts two pit craters. The northern pit crater contained a lava lake until the mid-seventies and has been the seat of permanent fumarolic activity and occasional lava spattering or small intra-crater flows since then (Oppenheimer et al., 2004). The smaller southern pit crater has contained a lava lake discovered in 1969 (Le Guern et al., 1979). The southern lava lake of Erta Ale has shown large variations of activity, size, and level, as shown in Figures 2A, B and sometimes overflowed the rim of its pit, feeding lava flows that have covered the caldera floor (e.g., Field et al., 2012). In January 2017, after a year-long gradual increase in the lake level, with several overflowing events, a dike-fed fissure eruption on the southern flank produced copious lava flows for more than 3 years. The eruption covered ∼30 × 106 m2 with >1 × 10⁸ m3 of lava but it did not lead to the disappearance of the lava lake (Global Volcanism Program, 2018) and did not cause any major collapse in the caldera. Instead, Xu et al. (2020) reported a very wide deflation, extending well beyond the limits of the volcanic edifice, which they attribute to the extraction of magma from a mid-crustal storage area. The long duration of the eruption, the absence of a caldera collapse and the persistence of the lava lake indicate that it was not a draining event, although the lava level rise prior to it and drop during it, indicate some degree of hydraulic connection with the lava lake.
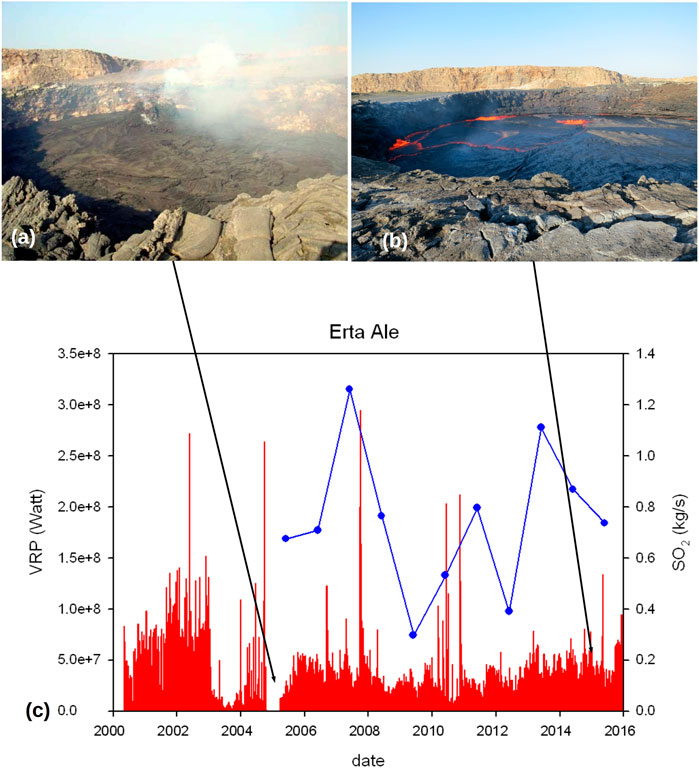
FIGURE 2. (A) Crust-covered lava lake in the south pit of Erta Ale in December 2004. Degassing was focused on a group of hornitos (photo: J.M. Bardintzeff). (B) In February 2015, the lava lake had regained its free surface and had a stable size (∼diameter 50 m) and level (Photo P. Marcel). (C) Time series of the yearly-averaged SO2 flux from Carn et al. (2017) and daily Volcanic Radiative Power from the lava lake of Erta Ale Volcano.
The VRP time series, in Figure 2C, shows a relatively weak thermal emission which shows strong variations, ranging between 107 and 1.5 × 10⁸ W. The stronger VRP spikes that exceed the background values correspond to short-lived lake overflows, either inside the pit crater or on the bottom of the caldera. During a small period in 2005, the thermal emission disappeared completely. The SO2 flux shows small values, between 0.3 and 1.2 kg/s and evolves grossly in a similar way as the VRP. The relatively low values of VRP and SO2 flux emitted by Erta Ale are in agreement with the previous field studies (Le Guern et al., 1979; Oppenheimer et al., 2004)
Nyiragongo, (1.52°S, 29.25°E, Democratic Republic of Congo) is a foiditic stratovolcano located in the Western Branch of the East African Rift. It has hosted a permanent lava lake that was discovered in 1948 (Tazieff 1974) and disappeared in a catastrophic drainage event in 1977 (Tazieff 1977). Hundreds of people were killed by the fast-moving lava flows rushing downslope at initial velocities estimated close to 30 m/s. The crater suffered a massive collapse as a result of the drainage of the upper magmatic system. Intra-crater eruptions in 1982 and 1994–1995 gradually refilled the crater but failed to form a permanent lake (Tazieff, 1994). In January 2002, a new lateral eruption triggered by a regional dyking and rifting event drained the upper magmatic system (Komorowski et al., 2002). The fast-flowing lava flows invaded the city of Goma, again killing hundreds of people. In the summer of 2002, a new lava lake gradually formed, and has since then enlarged considerably to a maximum size of ∼240 m diameter (Burgi et al., 2014; Valade et al., 2018). Figures 3A, B illustrate the growth and rise of the lava lake between 2003 and 2017. The level of the lake followed a step-wise increasing trend, to reach an altitude comparable to that of 1972–1977, considered as critical for the risk of draining (Burgi et al., 2020). Once again in June 2021, , fissures opened suddenly on the south and southeast flank of the volcano, releasing lava flows that rapidly reached the outskirt of Goma (Global Volcanism Program, 2021; Smittarello et al., 2022). The lava lake drained completely and has not yet reformed at the time of writing. The OMI data, which started in late 2004, do not cover the SO2 emissions in the first 2 years of the lake existence. In order to fill this gap, the SO2 flux dataset was completed with the ground-based DOAS measurements of Sawyer et al. (2008), flux measurements from three ASTER (Advanced Spaceborne Thermal Emission and Reflection) images with the band ratio method of Campion et al. (2010), and the data obtained by Carn (2004) with the TOMS (Total Ozone Mapping Spectrometer) spaceborne sensor.
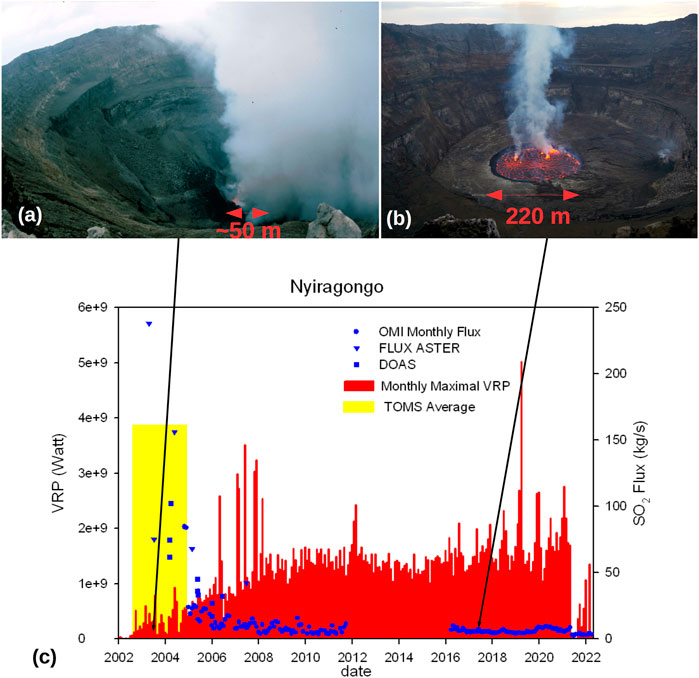
FIGURE 3. (A) Heavily fuming lava lake of Nyiragongo in June 2003 in the early stage of its formation (photo: M. Caillet). (B) View of the lava lake from approximately the same point in June 2017. Note the increase in area and level of the lake (photo: P. Marcel). (C) Time series of the SO2 flux from several methods (TOMS data from Carn (2004), monthly averaged OMI data, daily ground-based mobile DOAS, and daily space-based ASTER) and daily Volcanic Radiative Power from the lava lake of Nyiragongo. The data gap in OMI data between 2012 and 2016 correspond to the period where SO2 emissions from Nyiragongo were dwarfed by those of neighboring Nyamuragira during the formation of its own lava lake.
The SO2 data (Figure 3C) show a 2 year period of extremely high SO2 emissions (100–250 kg/s) at the beginning of the lava lake’s existence, followed by an initially rapid and then slower decrease to reach, by 2009, a relatively stable value of ∼10 kg/s that has persisted until the disappearance of the lake. This decrease in the SO2 flux coincides with a continuous increase of the VRP that materializes the growth of the surface area of the lake and the rise of its level (Burgi et al., 2014). Spikes in the thermal power graph are due to the frequent overflowing events that accompanied the lava lake rise from ∼800 m below the crater rim in 2002 to 400 m in 2011 (Burgi et al., 2014). A drastic drop of both SO2 flux and VRP marks the May 2021 drainage. The activity since then has not completely disappeared but the produced VRP has been weak and discontinuous so far. SO2 fluxes have stayed much lower than before the lava lake drainage, and two orders of magnitude lower than in 2002 and 2003, when the former lake started to form. We conclude that the activity since 2021 has not yet reformed a permanent lava lake.
Nyamuragira, (Democratic Republic of Congo, 1.408°S, 29.2°E), is a basanitic shield volcano located 15 km northeast from Nyiragongo. It has hosted a lava lake between an uncertain date at the beginning of the 20th century and a massive flank eruption that drained the lake in 1938 (Verhoogen, 1948). From 1948 to 2012, Nyamuragira produced frequent voluminous flank eruptions (e.g., Wadge and Burt, 2011). In 2012, after a major lateral eruption that partially drained the upper magmatic system of the volcano, a new lava lake started to form in a new collapse pit in its summit caldera (Campion 2014; Coppola et al., 2016b). The formation of the lava lake started with a 2.5 years period of intense SO2 emission during which only very weak radiant heat emissions were infrequently detected (Figure 4C). A fountaining lava lake was observed from the ground for the first time in June 2014 (Figure 4A) and starting in October 2014, the SO2 flux diminished and the radiant heat emissions increased and became more frequent, as the lava lake had become larger and more stable (Figure 4B). The lava lake has passed through two periods of very reduced activity, from June 2016 to December 2016 and from June 2017 to April 2018, which has shown its surface becoming completely crusted over (Global Volcanism Program, 2017, Global Volcanism Program, 2019), although the emission of SO2 never stopped. The scarce cloud-free images that ASTER took since the end of these reduced activity periods show weak SO2 emissions, below or barely above detection limit, which yield an SO2 flux inferior to 3–5 kg/s, which is dwarfed by the emissions of neighboring Nyiragongo. Burgi et al. (2021) documented a regime of piston-like rising and sinking of the mostly crusted lava lake surface since 2016, possibly differing from the classical convection scheme that is thought to feed lava classical lakes.
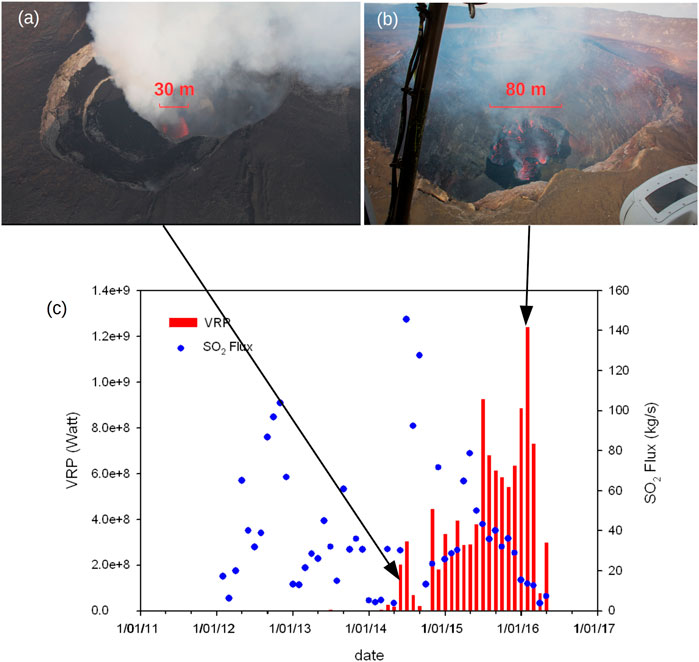
FIGURE 4. (A) Small fountaining lava lake in the newly-formed collapse pit in Nyamuragira’s Caldera in June 2014 (photo: D. Tedesco). (B) View of the mature lava lake in February 2016. Note the increase in lake size and the notable decrease in plume vigor (photo: G. Kourounis). (C) Time series of the SO2 flux and daily Volcanic Radiative Power from Nyamuragira volcano. Inter-eruptive SO2 flux before 2012 was close to 0.
Kilauea (19.421°N, 155.287°W, Big Island of Hawaii, United States of America), is a tholeiitic shield volcano. It hosted a permanent lava lake in the Halemaumau pit crater of its summit caldera until 1924, when it disappeared during a collapse event and explosive eruption, possibly associated with a submarine eruption. Since 1983, Kilauea was in a state of constant effusion of lava through the Puu O’o vent on its East Rift zone. After years of summit inflation, a new lava lake formed gradually, starting in March 2008, in a new pit crater located in the Halemaumau summit caldera (Poland et al., 2010). During its first month of existence, the only surface expressions of the lava lake were the extraordinary degassing and fresh fluidal basaltic glass fragments that were lofted by the gas plume. By the end of 2008, the gas emissions started to decrease and the lake level started to rise, becoming more frequently visible. It often showed rapid filling and draining cycles, or sometimes had the aspect of a cascade. The pit containing the lava lake enlarged over the years by frequent collapses of its rim, resulting in a continuous increase of the lava lake size (Patrick et al., 2013). Figures 5A, B illustrate the spectacular growth of the lake between 2008 and 2017. The large changes of the level of the lava lake were caused by changes in the pressure of the magmatic system of the volcano (Patrick et al., 2015), while the smaller short-term changes were caused by the cycles of foam accumulation below the lake skin and outgassing through spattering (Nadeau et al., 2015). Our measurements with OMI (Figure 5C), confirms extremely high SO2 flux values during the first year of the existence of the lava lake in Halemaumau, reported by Beirle et al. (2014). The monthly averaged flux peaked at ∼300 kg/s, whereas the VRP remained very low. The VRP data show a strong long-term increase that started shortly after the extreme SO2 emissions of the initial phase had declined, and stabilized around 2016. A short but very prominent spike in VRP appeared in April 2018, without any increase in the SO2 flux. It corresponds to a series of large lake overflows that were later considered as a precursor to the massive May-August 2018 eruption which drained the lava lake and summit magma reservoir into Kilauea’s Lower East Rift Zone. Although two effusive eruptions have partly refilled the collapse caldera left by the 2018 draining eruption, they have not reformed a permanent lava lake.
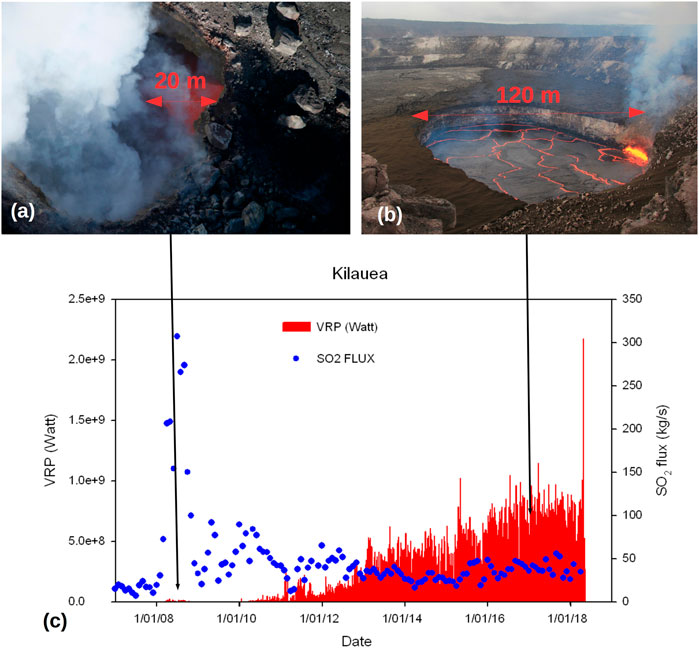
FIGURE 5. (A) Narrow collapse pit in Halemaumau crater containing an embryonic lava lake of Kilauea in May 2008 (photo: USGS). (B) View of the mature lava lake in October 2017 (photo: USGS). (C) Time series of the SO2 flux and daily Volcanic Radiative Power from Kilauea volcano. The SO2 flux of 10–25 kg/s before the formation of the lava lake in Halemaumau crater in 2008 was almost entirely emitted from the long-lasting Pu’u O’o effusive eruption in the East Rift Zone of the volcano.
Ambrym Volcano, (Republic of Vanuatu, 16.25°S, 168.12°E) is a large island arc basaltic to dacitic volcano crowned by a 12 km wide caldera that contains several cones and craters. Two of these cones, Marum and Benbow (Figures 6A, B), have been hosting lava lakes semi-permanently for at least 3 decades (Allard et al., 2016; Coppola et al., 2016c). Short-lived lateral eruptions in the caldera, like those of 1988 and 2015, or in the rift zones, like those of 1914 (Nemeth and Cronin, 2011) and 2018 have partially or completely drained the lava lakes. The degassing of Ambrym’s lava lakes was extremely vigorous (e.g., Bani et al., 2009; Allard et al., 2016), maintaining its surface permanently bubbling and agitated, and placing Ambrym as the long-term strongest permanent emitter of Sulfur Dioxide. However, following a major dyking episode and submarine eruption in December 2018, the lava lakes of Ambrym have disappeared (Shreve et al., 2019). The time series of total VRP emitted from Ambrym, combining the heat emission from both Marum and Benbow, shows a waxing and waning trend with a clear increase since 2012, leading to a fissure eruption in February 2015, and a marked decrease immediately after it (Figure 7C). The time series of the SO2 flux shows very high values, with a prominent peak in 2004–2005, followed by ups and downs usually uncorrelated with the thermal emissions. Interestingly, a general decrease in the SO2 flux is observed during the 3-year-long period of VRP increase preceding the 2015 eruption (Coppola et al., 2016c).

FIGURE 6. Lava lakes of Bembow (A) and Marum (B) in December 2014. At this time, their areas were approximately identical, but both have suffered large variations of their size and level (photos: C. Normand). (C) Time series of the monthly averaged SO2 flux and monthly maximal Volcanic Radiative Power from the lava lakes of Ambrym Volcano. The generally increasing trend of the VRP that culminated with the partial lake draining event of 2015 was decoupled or even anticorrelated with the SO2 Flux.
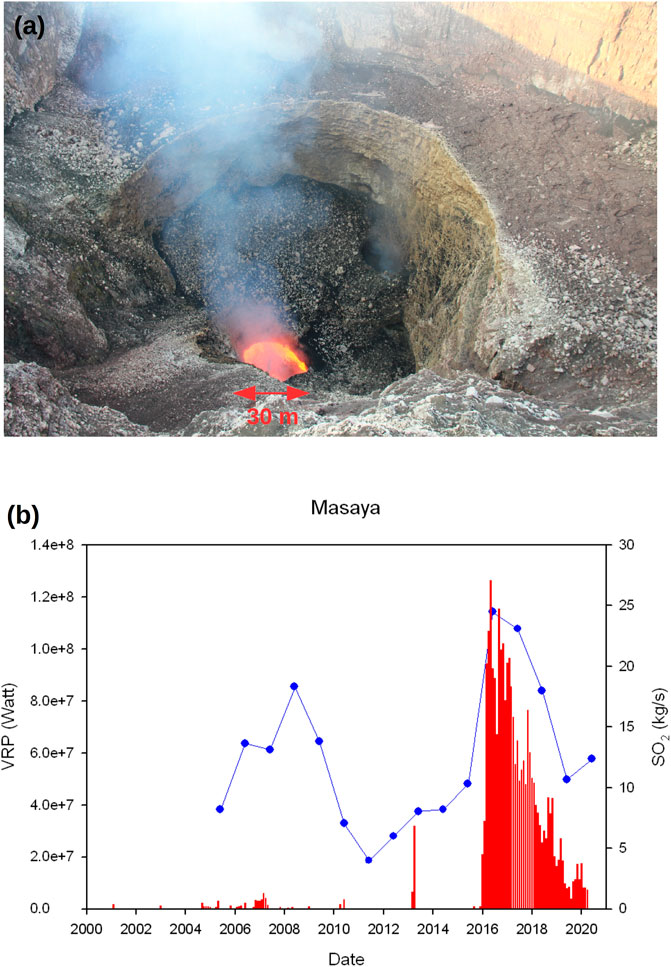
FIGURE 7. (A) Masaya lava lake at its highest level, in May 2016. (B) Time series of the yearly-averaged SO2 flux and daily Volcanic Radiative Power from the Masaya Volcano. Masaya is a permanent SO2 emitter and showed sporadic weak incandescence in its vent area. The appearance of the lava lake at the surface resulted in a significant increase in the SO2 flux and VRP.
Masaya volcano (Nicaragua, 11.98°N, 86.16°W), is a large complex of calderas in central Nicaragua formed by powerful basaltic plinian eruptions (Perez and Freundt, 2006). A small shield volcano crowned by a complex of juxtaposed cones and pit-craters has built since the last caldera-forming eruption (Rymer et al., 1998). It has hosted lava lakes episodically since before the Spanish conquest, and also produced several large effusive effusions (Viramonte and Incer-Barquero, 2008). Masaya has been known as a strong permanent emitter of SO2 and other gases even when no lava lake was visible at the surface (Delmelle et al., 2002). Starting in December 2015, a lava lake appeared in the Santiago crater of Masaya volcano and gradually enlarged until May 2016, when it reached its maximal size of 40 × 30 m (Figure 6A). Aiuppa et al. (2018) reported the changes in gas flux and composition that accompany its formation, most notably an increase in the SO2 flux and the CO2/SO2 ratio. The low altitude and small size of the Masaya plume make it difficult to measure with OMI on a monthly base. We, therefore, averaged images over 1-year periods to produce the long-term trend of SO2 fluxes. Figure 7B shows the SO2 flux and VRP from Masaya. SO2 emission is permanent but shows a pronounced waxing and waning pattern, a behavior that has characterized the volcanoes since at least the seventies (Delmelle et al., 1999). A strong and rapid increase of both the SO2 flux and the VRP marked the appearance of the lava lake in 2016, followed by a gradual decrease over the next 4 years. The detection of low thermal anomalies is occasional before the appearance of the lava lake. These anomalies occurred predominantly during the period of moderately high SO2 flux that prevailed during 2007–2010 and have low VRP values.
Villarrica volcano (Chile, 39.42°S, 71.93°W), is a medium-sized ice-clad stratovolcano built on two recent calderas associated with the basaltic plinian eruptions and pyroclastic flows (Lohmar et al., 2007). Its narrow summit crater is permanently degassing and is often the seat of mild strombolian and lava lake activity (Palma et al., 2008; Moussallam et al., 2016), but has also produced several stronger eruptions (VEI 2-3, Aiuppa et al., 2019). The daily variability of VRP from Villarrica is the highest among the volcanoes studied in this work. Additionally to the cloud-related variability, it might also result from the frequent bursting of large bubbles at the surface of the lake that eject abundant lava spatters out of the lava lake, and/or rapid cycles of building and collapse of cooled scoria benches that partially covered the lava lake. In the long term, the VRP time series (Figure 8C) highlight the intermittency of Villarrica’s lava lake. The periods of heightened activity lasting 2 to 3 years and radiating up to 3 × 10⁸ W are separated by intervals of nearly complete quiescence also lasting 2 to 3 years. The typical SO2 flux from Villarrica is too low to be measured on a daily or even on a monthly basis by OMI. So, in this work we used the time series from Carn et al. (2017) and extended it until 2020. It follows a temporal trend that is strikingly parallel to the VRP time series. This cyclic behavior of both the VRP and the SO2 flux corresponds to periods of alternating periods high and low surface, level, and activity of the lava lake (Figures 8A, B).
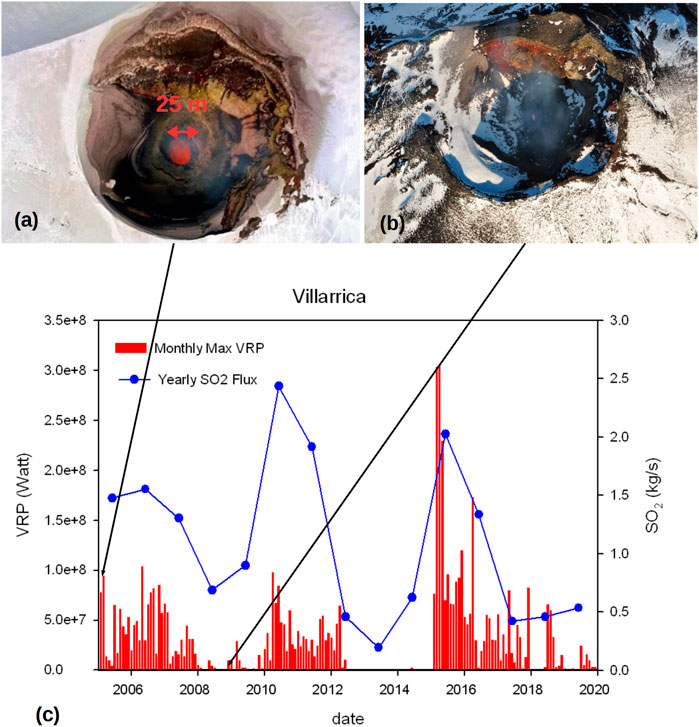
FIGURE 8. Lava lake of Villarrica shows large size and activity variations from a 25 m wide boiling lava lake, as in (A) dating from December 2004 (photo: J.C. Tanguy via GVP), to a narrow glowing hole as in (B) dating from 2009 (photo: T. Dockx). (C) Time series of the yearly averaged SO2 and Monthly Maximal VRP emitted by the lava lake of Villarrica.
Comparing quantitatively lava lakes together is not a straightforward task because their heat and gas emissions span more than two orders of magnitudes (see Table 1). One approach is to compare intensive parameters (i.e. that are not dependent on the lake size). One of them is the equivalent radiating temperature TAR, which is calculated using the inverse of the Stefan–Boltzmann law:
where A is the lake area, ε its emissivity (0.95 for basaltic lava), and σ is the Stefan–Boltzmann constant (5.668 10−8 W/m2K4). The distinction made by Lev et al. (2019) is particularly apparent in Table 1, which clearly shows two populations of TER, which correspond to the chaotic lakes (TAR between 1,100 and 1,200 K) and the ordered lakes (TER between 800 and 900 K). In Figure 9, we plot the apparent radiating temperature against the SO2 flux per unit area of the lake. This shows an expected positive correlation between these two parameters, demonstrating that the chaotic lakes are not only hotter but also richer in gas. The explanation for this is that the TER is dominantly dependent on the percentage of the lake that is covered by a cooling skin and not by the absorption of the gas plume overlying the lake. The gas-poor lakes do have such a crust while the permanent bubbling at the surface of gas-rich lakes hampers its formation.
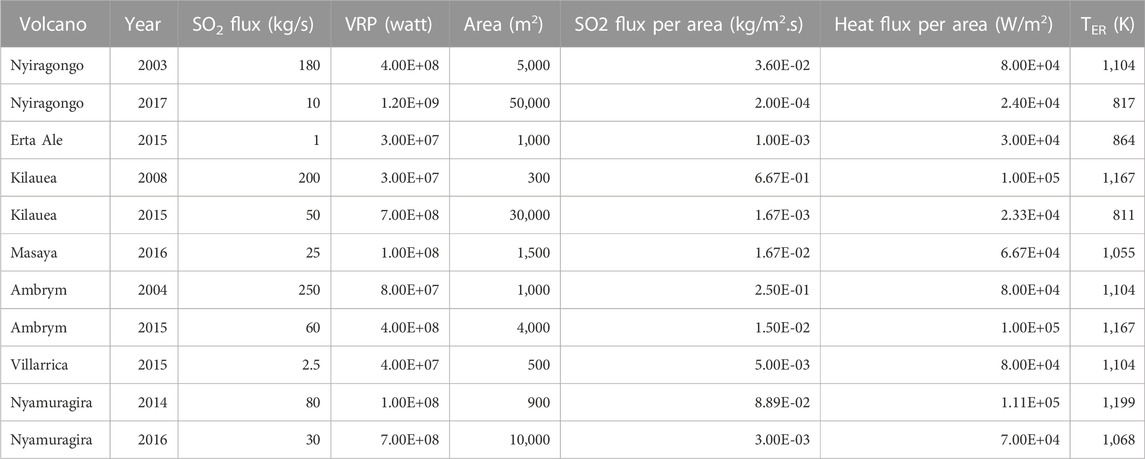
TABLE 1. Main characteristics of the lava lakes at certain stages of their existence. Area is estimated from the photographs shown previously, except for Villarrica taken from Moussallam et al. (2016) and Ambrym in 2004 (T. Dockx, Pers. Com.).
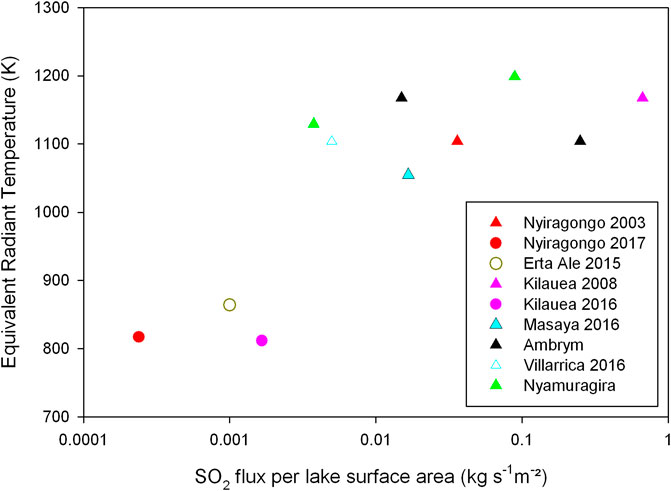
FIGURE 9. Diagram of the apparent radiant temperature versus SO2 flux per area for the data of Table 1. The upper group corresponds to chaotic (hot, gas-rich lakes) while the lower group corresponds to ordered (colder, gas-poor lakes).
More information can be gained by comparing extensive parameters. The VRP vs. SO2 flux diagram in Figure 10 shows that two leagues can be distinguished, those with small SO2 and heat emissions (including Villarrica, Erta Ale, Masaya and likely Erebus although it was not included in our study), and those whose SO2 or VRP emission are higher than either 25 kg/s or 5 × 10⁸ W (Nyamulagira, Nyiragongo, Halemaumau, and Ambrym). Different behaviors seem to characterize these two leagues.
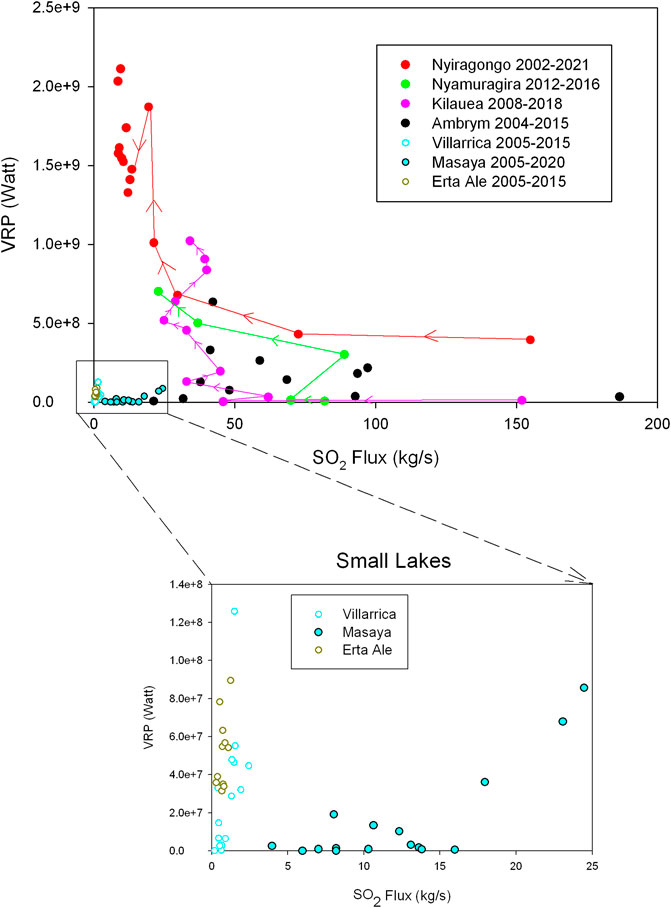
FIGURE 10. Diagram of the SO2 flux versus VRP for lava lakes of the world. For the sake of clarity, each data point represents the average, over a year, of monthly maximum VRP. Arrows between points represent evolutions from year to year.
The group defined as small lakes contains volcanoes that are known for their permanent degassing over very long periods. Their lava lakes, when visible, have surface areas that vary between a few tens and a few thousands of square meters. They show coupled variations of their SO2 flux and VRP, which maintain a certain linear correlation over time. In all cases, these fluctuations correspond to large changes of the height of the magmatic column, sometimes to the point of disappearing from sight in the case of Masaya and Villarrica, or overflowing in the case of Erta Ale. These lakes do not seem to suffer transitions from the chaotic type (to which Masaya and Villarrica belong) to the organized type (to which Erta Ale belongs). The most likely explanation for the long-term coupling of their VRP and SO2 flux is that both are linked to the flow rate of the magmatic convection that feeds the lake. If this is the case, the slope of the regression line in the VRP versus SO2 plots should depend on the initial sulfur content of the convecting magma and the efficiency of the convective process to dissipate heat.
Instead, large lava lakes, especially at the early stages of their existence show a strong anti-correlation between their heat and gas emissions. Within large lava lakes, two groups can clearly be distinguished. The first group is characterized by very high gas emissions and small to moderate VRP. It regroups the early-stage lava lakes of Kilauea, Nyiragongo, and Nyamuragira and the lava lakes of Ambrym. Visually, these lakes have a small size, brightly incandescent and vigorously bubbling surface, are stirred by very fast currents, or may even look like a small permanent lava fountain (e.g., Smets et al., 2014). They belong to the “Chaotic” category of Lev et al. (2019). The second group is characterized by high heat emissions and comparatively low gas emissions, and contains only mature lava lakes from rifts and hotspot volcanoes [“Organized” category according to Lev et al. (2019)]. The visual observations show that more than 80% of their surface is covered by a cooling skin or crust that is stirred by relatively slow convection currents until it sinks back into the lake.
The strong decoupling of SO2 flux and radiant flux during the early stage of all three lava lake formations at Nyiragongo, Kilauea, and Nyamuragira is at a first glance surprising result, as most of the previous studies on lava lakes have reported or assumed a correlation between SO2 emission and lava lake surface (e.g., Oppenheimer et al., 2004; Sweeney et al., 2008). It is, however, easily explained if we consider that the upwelling material feeding the lake is a magmatic foam. We show in the next section that the thermodynamic and phenomenological implications of this hypothesis match all of the observations reported on lava lakes.
A lava lake can be considered, over a large period of time, as a steady state system, where the thermal power brought by the magmatic convection Q is equal to the sum of three following loss terms (Harris et al., 1999).
The VRP, the radiated thermal power from the lake surface, is the dominant heat loss mechanism at these very high temperatures (Harris et al., 1999). The conductive heat loss through the wall of the conduit (CLC) can be considered constant and negligible for a well-established steady-state system (Henley and Hughes, 2016). The conductive heat loss to the atmosphere (CLA) amounts to 10 (for hot lakes) to 30% (for colder lakes) of the VRP (Harris et al., 1999) and is also proportional to the lake surface area. Qg is the heat lost by the transfer of hot gases from the lake to the atmosphere, and its magnitude depends on the total gas flux emitted by the lava lake.
The short-term excursions of the system away from this equilibrium can occur when the magma flux Fm feeding the system at depth varies. When Fm decreases, the heat transported by the magmatic convection is insufficient to balance the heat loss and a portion of the lake’s surface solidifies, reducing the exposed radiating surface until the heat loss is again balanced. This leads to the formation of a bank of solidified lava. When Fm increases, the convection gets more vigorous, and the gas flux also increases so that more bubbling and more incandescent surfaces are exposed to the atmosphere. As a result, the heat loss increases until it balances the heat transported by the convection. Lake may enlarge by thermal erosion of its walls, its level tends to rise (because of the increased volume occupied by the rising magma and its gas) possibly until the point of overflowing, as often observed at the lava lakes of Erta Ale, Nyiragongo, Nyamuragira, and Kilauea.
If the material feeding the lava lake is considered as a bubble-rich liquid, or even as foam, composed of a volumetric fraction of magmatic gas Xg and a fraction of silicate melt equal to 1-Xg. The transported thermal energy flux can be calculated as
where Fm is the volumetric flux of rising magmatic foam, ρl and ρg are the densities of the melt and gas, respectively, Cpl and Cpg are their specific heat, XS is the proportion of melt that solidifies before sinking back, ΔHCS the latent heat of solidification of the melt and TU, TD, and TA are the temperature of the upwelling magma, of the downwelling lava, and of the atmosphere, respectively. Because silicate melts have a much higher density than gases, the thermal energy transported by the melt fraction of the foam is typically one order of magnitude higher than what its gaseous phase can transport. When magmatic gases escape into the atmosphere, they cool rapidly due to their mixing with air. Because of their very low emissivity at the wavelengths used in the MIROVA algorithm (HITRAN database, https://hitran.org/lbl/, Rothman et al., 2013), the gas, once emitted, does not contribute to the radiated power. Additionally, the rise from depth of a bubbly magmatic liquid implies that part of its thermal energy is consumed by the adiabatic expansion of the gas phase during its ascent (Stevenson and Blake 1998). Although the related temperature decrease may be compensated by the latent heat released by the partial crystallization of the foam’s liquid phase (La Spina et al., 2016), the total energy available for radiation into the atmosphere is anyway decreased.
The consequence of all this is that the more gas the foam contains at the bottom of the convection cell, the less thermal energy it can transport to the surface and radiate into the atmosphere. This point is the cornerstone to understand the anticorrelation of heat and gas flux during the early stage of lava lake formation. The gas-rich lava lakes are fed by a material that can be considered true foam, which likely contains more than 80% of gas. The consequences of this are as follows:
1) The density contrast between the undegassed upwelling foam and the degassed downwelling lava is extremely high, which results in a very dynamic convection, with fast superficial currents, a lower exposure time to the atmosphere, and less surface cooling for the downwelling lava.
2) The outgassing of the foam produces a considerable volume loss that hampers the lake to reach a surface area that is much larger than the volcanic conduit feeding the lake. This partly explains why gas-rich lava lakes are relatively small.
3) The thermal energy avaliable to sustain the VRP emission from the lake is also limitted by the melt flux, so that the lake must remain small to remain liquid.
If our hypothesis that the SO2 vs. VRP anticorrelation is due to the changes in the gas/melt ratio of the material feeding the magmatic convection, then why do small lakes show a correlation between their SO2 and VRP? The answer to this question lies probably in the presence or absence of a large and shallow magma storage system, where SO2-rich gas can exsolve and separate from the magma to accumulate as foam. We propose that large lava lakes have a large shallow magma storage system and small lava lakes do not. The presence of a relatively large shallow magma storage area beneath large lava lakes is also the reason why they are affected by catastrophic draining events. These events release massive lava flows with colossal effusion rates and empty, totally or partially, the shallow magma storage associated with the lava lake, to the point of generating massive collapse and smothering for the next several years of the volcanic activity, as happened in Kilauea in 2018 (Patrick et al., 2020), Nyiragongo in 1977 (Tazieff, 1977) and 2021 (Smittarello et al., 2022), and Ambrym in 2018 (Shreve et al., 2019). Small lakes may have storage areas underneath them (Stephens and Wauthier, 2018 for Masaya; Xu et al., 2020 for Erta Ale) but they must be either small or located deeper than the exsolution depth of the SO2 in their magma.
In this section, we highlight a four-stage sequence of processes leading to the formation of a lava lake at the rift and hotspot volcanoes. This sequence is schematized in Figure 11.
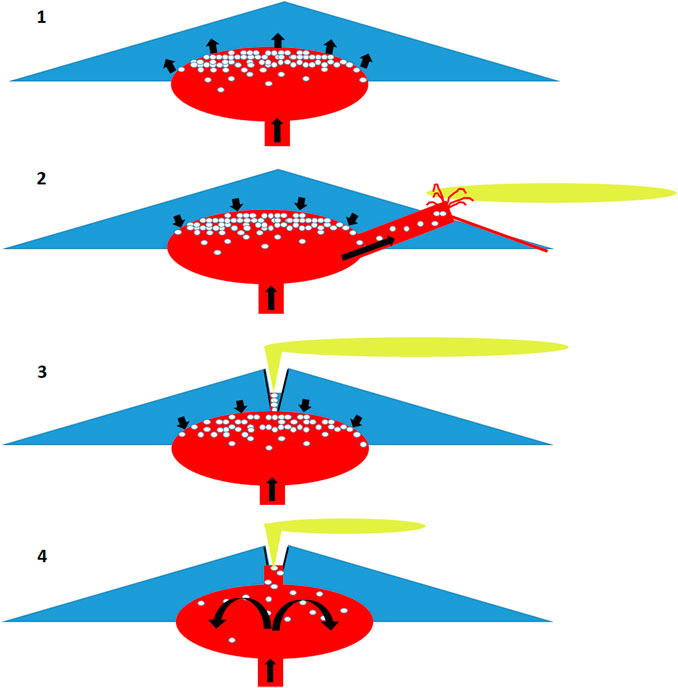
FIGURE 11. Schematic drawings of the four stage common sequence of lava lake formation at rift and hotspot volcanoes (not to scale, the size of the magma reservoir has been exaggerated). 1) Magma accumulation and gas segregation under a closed system condition. 2) Partial drainage of the storage area. 3) Opening of the system through the formation of a pit crater. A small foam-fed lava lake produces an intense degassing but low amounts of VRP. 4) Exhaustion of the foam, establishment of classical magmatic convection, and growth of the lava lake.
The first stage may start years to months before the first visible signs of lava lake formation appear. This stage is the previous accumulation of magma in the plumbing system of the volcanoes, when the upper conduit system of the volcano is still closed and does not allow the release of high-temperature magmatic gases to the surface. Several seismic and/or deformation studies have suggested that significant magma accumulation had taken place before the formation of a new lava lake at Nyiragongo, Kilauea, and Nyamuragira. Intrusion of a massive dyke occurred, after a year of seismic unrest, in January 2002 at Nyiragongo volcano (Wauthier et al., 2012), and preceded by 6 months the appearance of the new lava lake. A pulse of increased magma supply and accumulation was documented by deformation, seismicity, and gas measurement at Kilauea during 2003–2007 (Poland et al., 2012; Wauthier et al., 2013). Large-scale inflation was detected before the 2011 and 2012 eruption of Nyamuragira volcano (Albino et al., 2013) which marked the beginning of the formation process of Nyamuragira volcano. Simultaneously to this magma accumulation, a magmatic foam layer rich in gas is likely to accumulate at the top of the magma storage area (Jaupart and Vergniolle, 1989; Wallace 2001; Allard et al., 2005).
The second stage is the development of an open conduit system that allows magmatic degassing from the summit. In all three cases, the opening of the system was achieved through the migration of magma through laterally propagating dikes, the partial drainage of the upper plumbing system of the volcano, and the formation of a pit crater. At Nyiragongo, this second stage was materialized by the catastrophic eruption of January 2002 and the massive collapse of the caldera floor. At Kilauea, it was much less dramatic, being just materialized by a small fissure eruption in June 2007, generalized deflation (Poland et al., 2012), and the formation of an initially very narrow pit crater. This is probably because magma was already injecting continuously through its rift zone to feed the long-lived Pu’u O’o eruption. At Nyamuragira, this second stage was characterized by the large 2011–2012 eruption, one of the most voluminous in its history, and the collapse of a pit crater in its caldera (Campion, 2014; Coppola et al., 2016b).
The third stage is characterized by a strong degassing with little to no magma yet reaching the surface. This stage may initiate simultaneously to the lateral migration of magma and formation of the collapse pit, as was probably the case at Nyamuragira (Coppola et al., 2016b), or be delayed by a few months as in Nyiragongo and Kilauea. During this stage, the SO2 emission rate typically reaches values of more than 100 kg/s, whereas the lava lake remains very deep in its newly formed collapse pit. If visible, the proto lava lake may look, at this stage, like a small lava fountain (Smets et al., 2014) or like an endless lava cascade (HVO photo archive, 2010), or be subject to huge level variations. All these phenomena result from the dynamics of the gas-rich magmatic foam that is feeding the lake. The duration of this stage of high gas/low heat emission probably corresponds to the time needed for the accumulated foam to be outgassed by the proto lava lake.
The fourth stage, characterized by a high and stable ratio of radiated heat to emitted gas corresponds to a fully mature lava lake fed by magmatic convection. Although the transition from stage three to four is usually progressive, it seems that the drop in SO2 flux is more rapid (a few months) than the increase in VRP, which spans several years. This materializes the exhaustion of the pre-accumulated foam, the resulting increase of the melt/gas ratio in the material feeding the lake, and possibly thermal erosion of the conduit feeding the lava lake. The convection speed slows accordingly because the density contrasts between the ascending magma and the descending degassed lava decrease. The bubble bursting at the top of the magma column decreases and a cooling skin can start to form. It is likely that the magma feeding these mature lava lakes has already partly degassed during stage 3 and/or is a mixture between the partly degassed magma from stage 3 and the juvenile magma that is continuing to enter the system.
The formation sequence described in the previous section applies to the rift and hotspot volcanoes, which are fed by a volatile-poor basaltic magma. Primitive basaltic magmas from arcs are richer in volatiles and more commonly produce explosive basaltic eruptions. However three of the volcanoes studied here, Villarrica, Ambrym, and Masaya, do host most of the time a lava lake. Interestingly, they all share the following three characteristics:
1) They are associated with large calderas (>5 km) that have produced large plinian basaltic eruptions in recent times (<10 ky)
2) They are characterized by a permanent open conduit degassing, whether a lava lake is visible or not
3) The magma that feeds them, known from the most primitive melt inclusions available, contains significantly less volatiles than other primitive arc magmas (see data from Witter et al., 2004 for Villarrica; Sadofsky et al., 2008 for Masaya; Allard et al., 2016 for Ambrym)
We can, thus, reasonably suspect that arc lava lakes, even though they all belong to the gas-rich type, are fed by a previously degassed magma or more likely a mix between a large batch of degassed magma and small repeated injection of juvenile magma, as suggested by the strong variations in our time series of SO2 flux from Ambrym, Villarrica, and Masaya and by recent gas composition time series at these volcanoes (Allard et al., 2016; Aiuppa et al., 2017; Aiuppa et al., 2018, respectively).
Our study presents long-term time series of SO2 flux and Volcanic Radiative Power for most of the lava lakes of the world. We characterize lava lakes in a simple diagram displaying SO2 flux versus VRP, and demonstrate that they fall into three categories: small lakes, which show a correlation between their gas and heat emissions, large lakes with low gas and high VRP, and large lakes with high gas and low VRP. We show that the anticorrelation of VRP and SO2 flux in large lakes is most easily explained by considering that these are fed by magmatic foam, whose gas fraction, responsible for the SO2 emissions is inversely proportional to its liquid fraction, which mostly accounts for the radiated heat emission. We propose that the presence of a large shallow magma storage system beneath large lava lakes allows the accumulation of SO2-rich foam that accounts for the observed anticorrelation. We unraveled a common sequence of events that has characterized the formation of three large lava lakes at volcanoes in the rift and hotspot environments in the last 20 years (Nyiragongo, Kilauea, and Nyamuragira). This sequence is composed of the following four steps:
1) Magma accumulation and foam accumulation at its upper part.
2) Partial drainage of the magma reservoir through a lateral injection of magma.
3) Formation of a pit crater and intense degassing with low heat emissions.
4) Gradual decrease of the gas emissions and concomitant increase of the lake level, area, and heat emissions. In this last step, a steady convective system is established and the lake is considered as mature.
The formation sequence described in our work could be helpful in the future to detect the formation of a true long-term lava lake and discriminate it from the short-lived eruption that occurs in a crater and just accumulate lava in it without establishing a true convective system, such as the 2020 and 2021 events on Kilauea Volcano or the brief effusions spurts that have occurred in Nyiragongo since its lake drained in 2021.
Probably the most interesting outcome of the present work is the discovery that classes of lava lakes, the large lakes, are likely associated with shallow magma reservoirs and are, therefore, more susceptible to drain catastrophically. Nyamuragira volcano hosts, at the time of writing, the last specimen of this class. We highlight that a catastrophic draining event is a likely scenario at this volcano for the next years or decades, considering the recent rise of the lava lake level, and the historical precedent of the 1938 eruption.
The rarity of lava lakes in the world is likely the result of the numerous conditions they require to form and persist. The present study highlights the importance of magma accumulation and outgassing in a large and shallow magma reservoir as a requisite to its formation. A high and sustained supply of relatively volatile-poor magma is also necessary to keep the lake active. The strain state of the volcano is also playing a role. Many volcanoes alternate periods of stable behavior where activity is mostly constrained to their summit area, and unstable periods where spreading and dyke intrusion dominate. Lava lakes obviously need stable conditions to persist, but our work shows the importance of dyke intrusion and pit crater collapse to gently decompress the magma reservoir that will eventually feed the lava lake. This combination of conditions may be relatively uncommon, so only a restricted number of volcanoes recurrently develop lava lakes.
The raw data supporting the conclusions of this article will be made available by the authors, without undue reservation.
RC conceived the research idea, processed the OMI data to calculate the SO2 flux, and wrote most of the manuscript. DC processed the MODIS thermal data, wrote parts of the manuscript, commented on initial versions, and provided additional ideas.
This project benefited from funding by the SEPCONACYT grant for basic science #CB A1-S-30127.
The authors thank Jacques Marie Bardintzeff, Marc Caillet, Thierry Dockx, George Kourounis, Patrick Marcel, Cédric Normand, and Dario Tedesco for sharing their pictures.
The authors declare that the research was conducted in the absence of any commercial or financial relationships that could be construed as a potential conflict of interest.
All claims expressed in this article are solely those of the authors and do not necessarily represent those of their affiliated organizations, or those of the publisher, the editors, and the reviewers. Any product that may be evaluated in this article, or claim that may be made by its manufacturer, is not guaranteed or endorsed by the publisher.
The Supplementary Material for this article can be found online at: https://www.frontiersin.org/articles/10.3389/feart.2023.1040199/full#supplementary-material
Aiuppa, A., Bitetto, M., Francofonte, V., Velasquez, G., Bucarey Parra, C., Guidice, G., et al. (2017). A CO2-gas precursor to the March 2015 Villarrica volcano eruption. Geochem. Geophys. Geosystems 18, 2120–2132. doi:10.1002/2017GC006892
Aiuppa, A., de Moor, J. M., Arellano, S., Coppola, D., Galle, B., Francofonte, V., et al. (2018). Tracking Formation of a lava lake from ground and space: Masaya Volcano (Nicaragua), 2014-2017. Geosystems 19, 496–515. doi:10.1002/2017GC007227
Allard, P., Burton, M., and Murè, F. (2005). Spectroscopic evidence for a lava fountain driven by previously accumulated magmatic gas. Nature 43 (7024), 407–410. doi:10.1038/nature03246
Albino, F., Kervyn, F., Smets, P., and d’Oreye, N. (2013). “InSAR study on the 2011 eruption at Nyamulagira volcano, D.R.C.: Lava flow emplacement and post-eruption ground deformation,” in AGU Fall Meeting Abstracts 2013, G31A-0957
Allard, P., Aiuppa, A., Bani, P., Métrich, N., Bertagnini, A., Gauthier, P-J., et al. (2015). Overview of the precursors and dynamics of the 2012–13 basaltic fissure eruption of Tolbachik Volcano, Kamchatka, Russia. J. Volcanol. Geotherm. Res.Special issue Vanuatu Volcanoes 304, 378. doi:10.1016/j.jvolgeores.2015.08.022
Allard, P., Burton, M., Sawyer, G., and Bani, P. (2016). Degassing dynamics of basaltic lava lake at a top-ranking volatile emitter: Ambrym volcano, Vanuatu arc. Earth Planet Sci. Lett. 448, 69–80. doi:10.1016/j.epsl.2016.05.014
Bani, P., Oppenheimer, C., Tsanev, V. I., Carn, S. A., Cronin, S. J., Crimp, R., et al. (2009). Surge in sulphur and halogen degassing from Ambrym volcano, Vanuatu. Vanuatu. Bull. Volcanol. 71 (10), 1159–1168. doi:10.1007/s00445-009-0293-7
Beirle, S., Hörmann, C., Penning de Vries, M., Dörner, S., Kern, C., and Wagner, T. (2014). Estimating the volcanic emission rate and atmospheric lifetime of SO2 from space: A case study for kīlauea volcano, Hawai`i. Atmos. Chem. Phys. 14, 8309–8322. doi:10.5194/acp-14-8309-2014
Bobrowski, N., Giuffrida, G. B., Arellano, S., Yalire, M., Liotta, M., Brusca, L., et al. (2017). Plume composition and volatile flux of Nyamulagira volcano, Democratic Republic of Congo, during birth and evolution of the lava lake, 2014–2015. Bull. Volcanol. 79, 90. doi:10.1007/s00445-017-1174-0
Bouche, E., Vergniolle, S., Staudacher, T., Nercessian, A., Delmont, J.-C., Frogneux, M., et al. (2010). The role of large bubbles detected from acoustic measurements on the dynamics of Erta ’Ale lava lake (Ethiopia). Earth Planet. Sci. Lett. 295, 37–48. doi:10.1016/j.epsl.2010.03.020
Burgi, P-Y., Darrah, T. H., Tedesco, D., and Eymold, W. K. (2014). Dynamics of the mount Nyiragongo lava lake. J. Geophys Res. Solid Earth 119, 4106–4122. doi:10.1002/2013JB010895
Burgi, P-Y., Boudoire, G., Rufino, F., Karume, K., and Tedesco, D. (2020). Recent activity of Nyiragongo (Democratic Republic of Congo): New insights from field observations and numerical modeling. Geophys. Res. Lett. 47, e2020GL088484. doi:10.1029/2020GL088484
Burgi, P.-Y., Valade, S., Coppola, D., Boudoire, G., Mavonga, G., Rufino, F., et al. (2021). Unconventional filling dynamics of a pit crater. Earth Planet. Sci. Lett. 576, 117230. doi:10.1016/j.epsl.2021.117230
Campion, R. (2014). New lava lake at Nyamuragira volcano revealed by combined ASTER and OMI SO2 measurements. Geophys. Res. Lett. 41, 7485–7492. doi:10.1002/2014GL061808
Campion, R., Salerno, G., Coheur, P., Hurtmans, D., Clarisse, L., Kazahaya, K., et al. (2010). Measuring volcanic degassing of SO2 in the lower troposphere with ASTER band ratios, Journ. Volcanol. Geotherm. Res. J. Volcanol. Geotherm. Res. 194, 42–54. doi:10.1016/j.jvolgeores.2010.04.010
Carbone, D., Poland, M. P., Patrick, M. R., and Orr, T. R. (2013). Continuous gravity measurements reveal a low-density lava lake at Kīlauea Volcano, Hawaii. Earth Planet. Sci. Lett. 376, 178–185. doi:10.1016/j.epsl.2013.06.024
Carn, S. A. (2004). Eruptive and passive degassing of sulfur dioxide at Nyiragongo volcano (D.R. Congo): The 17 january 2002 eruption and its aftermath. Acta Vulcanol. 14-15, 75–86.
Carn, S. A., Fioletov, V. E., McLinden, C. A., Li, C., and Krotkov, N. A. (2017). A decade of global volcanic SO2 emissions measured from space. Sci. Rep. 7, 44095. doi:10.1038/srep44095
Coppola, D., Laiolo, M., Cigolini, C., Delle Donne, D., and Ripepe, M. (2016a). “Enhanced volcanic hot-spot detection using MODIS IR data: Results from the MIROVA system,” in Detecting, modelling and responding to effusive eruptions. Editors A. J. L. Harris, T. De Groeve, F. Garel, and S. A. Carn (London: Geological Society), 426, 181–205. Special Publications. doi:10.1144/SP426.5
Coppola, D., Campion, R., Laiolo, M., Cuoco, E., Balagizi, C., Ripepe, M., et al. (2016b). Birth of a lava lake: Nyamulagira volcano 2011–2015. Bull. Volcanol. 78 (3), 20–13. doi:10.1007/s00445-016-1014-7
Coppola, D., Laiolo, M., and Cigolini, C. (2016c). Fifteen years of thermal activity at Vanuatu's volcanoes (2000-2015) revealed by MIROVA. J. Volcanol. Geotherm. Res. 322, 6–19. doi:10.1016/j.jvolgeores.2015.11.005
de Moor, J. M., Fischer, T. P., Sharp, Z. D., King, P. L., Wilke, M., Botcharnikov, R. E., et al. (2013). Sulfur degassing at Erta Ale (Ethiopia) and Masaya (Nicaragua) volcanoes: Implications for degassing processes and oxygen fugacities of basaltic systems. Geochem. Geophys. Geosyst. 14, 4076–4108. doi:10.1002/ggge.20255
Delmelle, P., Baxter, P., Beaulieu, A., Burton, M., Francis, P., Garcia-Alvarez, J., et al. (1999). Origin, effects of Masaya Volcano's continued unrest probed in Nicaragua, Eos Trans. AGU 80, 575–581. doi:10.1029/EO080i048p00575
Delmelle, P., Stix, J., Baxter, P. J., Garcia-Alvarez, J., and Barquero, J. (2002). Atmospheric dispersion, environmental effects and potential health hazard associated with the low-altitude gas plume of Masaya volcano, Nicaragua. Bull. Volcanol. 64, 423–434. doi:10.1007/s00445-002-0221-6
Field, L., Barnie, T., Blundy, J., Brooker, R. A., Keir, D., Lewi, E., et al. (2012). Integrated field, satellite and petrological observations of the November 2010 eruption of Erta Ale. Bull. Volcanol. 74, 2251–2271. doi:10.1007/s00445-012-0660-7
Global Volcanism Program (2018). Report on Erta Ale (Ethiopia). Bulletin of the global volcanism network. Editors A. E. Crafford, and E. Venzke (Smithsonian Institution), 43, 4. doi:10.5479/si.GVP.BGVN201804-221080
Global Volcanism Program (2017). Report on Nyamulagira (DR Congo). Bulletin of the Global Volcanism Network. Editors A. E. Crafford, and E. Venzke (Smithsonian Institution), 42, 6. doi:10.5479/si.GVP.BGVN201706-223020
Global Volcanism Program (2019). Report on Nyamulagira (DR Congo). Bulletin of the Global Volcanism Network. Editors A. E. Crafford, and E. Venzke (Smithsonian Institution), 44, 5. doi:10.5479/si.GVP.BGVN201905-223020
Gray, D. M., Burton-Johnson, A., and Fretwell, P. T. (2019). Evidence for a lava lake on Mt. Michael volcano, saunders island (south Sandwich islands) from landsat, sentinel-2 and ASTER satellite imagery. J. Volcanol. Geotherm. Res. 379, 60–71. doi:10.1016/j.jvolgeores.2019.05.002
Harris, A. J. L., Flynn, L. P., Rothery, D. A., Oppenheimer, C., and Sherman, S. B. (1999). Mass flux measurements at active lava lakes: Implications for magma recycling. J. Geophys. Res. 104, 7117–7136. doi:10.1029/98JB02731
Head, E. M., Shaw, A. M., Wallace, P. J., Sims, K. W. W., and Carn, S. A. (2011). Insight into volatile behavior at Nyamuragira volcano (D.R. Congo, Africa) through olivine-hosted melt inclusions. Geochem. Geophys. Geosyst. 12, Q0AB11. doi:10.1029/2011GC003699
Henley, R. W., and Hughes, G. (2016). SO2 flux and the thermal power of volcanic eruptions. J. Volcanol. Geotherm. Res. 324, 190–199. doi:10.1016/j.jvolgeores.2016.04.024
HVO photo archive (2010). HVO photo archive. United States Geological Survey. January-June 2010. Available at: https://volcanoes.usgs.gov/volcanoes/kilauea/archive/multimedia/2010/2010_Jan-Jul.shtml accessed on 22/07/2022.
Jaupart, C., and Vergniolle, S. (1989). The generation and collapse of a foam layer at the roof of a basaltic magma chamber. J. Fluid Mech. 203, 347–380. doi:10.1017/S0022112089001497
Kazahaya, G., Shinohara, H., and Saito, G. (1994). Excessive degassing of izu-oshima volcano: Magma convection in a conduit. Bull. Volcanol. 56, 207–216. doi:10.1007/bf00279605
Komorowski, J., et al. (2002). The january 2002 flank eruption of Nyiragongo volcano (democratic republic of Congo): Chronology, evidence for a tectonic rift trigger, and impact of lava flows on the city of goma. Acta Vulcanol. 14, 27–62.
Kyle, P. R., Sybeldon, L. M., McIntosh, W. C., Meeker, K., and Symonds, R. (1994). “Sulfur dioxide emission rates from Mount Erebus, Antarctica,” in Volcanological and environmental studies of mount Erebus. Editor P. R. Kyle (Antarctica: American Geophysical Union Geophysical, Monograph), 66, 69–82.
La Spina, G., Burton, M., Vitturi, M. M., and Arzilli, F. (2016). Role of syn-eruptive plagioclase disequilibrium crystallization in basaltic magma ascent dynamics. Nat. Commun. 7, 13402. doi:10.1038/ncomms13402
Le Guern, F., Carbonnelle, J., and Tazieff, H. (1979). Erta’Ale lava lake: Heat and gas transfer to the atmosphere. J. Volcanol. Geotherm. Res. 6, 27–48. doi:10.1016/0377-0273(79)90045-3
Lev, E., Ruprecht, P., Oppenheimer, C., Peters, N., Patrick, M., Hernández, P. A., et al. (2019). A global synthesis of lava lake dynamics. J. Volcanol. Geotherm. Res. 381, 16–31. doi:10.1016/j.jvolgeores.2019.04.010
Lohmar, S., Robin, C., Gourgaud, A., Clavero, J., Parada, M. Á., Moreno, H., et al. (2007). Evidence of magma-water interaction during the 13,800 years BP explosive cycle of the Licán Ignimbrite, Villarrica volcano (southern Chile). Andean Geol. 34 (2), 233–247.
Matsushima, N., and Shinohara, H. (2006). Visible and invisible volcanic plumes. Geophys. Res. Lett. 33, L24309. doi:10.1029/2006GL026506
Moussallam, Y., Bani, P., Curtis, A., Barnie, T., Moussallam, M., Peters, N., et al. (2016). Sustaining persistent lava lakes: Observations from high-resolution gas measurements at Villarrica volcano, Chile. Earth Planet. Sci. Lett. 454, 237–247. doi:10.1016/j.epsl.2016.09.012
Németh, K., and Cronin, S. J. (2011). Drivers of explosivity and elevated hazard in basaltic fissure eruptions: The 1913 eruption of Ambrym volcano, Vanuatu (SW-pacific). J. Volcanol. Geotherm. Res. 201, 194–209. doi:10.1016/j.jvolgeores.2010.12.007
Oppenheimer, C., McGonigle, A. J. S., Allard, P., Wooster, M. J., and Tsanev, V. I. (2004). Sulfur heat and magma budget of Erta 'Ale lava lake, Ethiopia. Geology 32, 509–512. doi:10.1130/g20281.1
Palma, J. L., Calder, E. S., Basualto, D., Blake, S., and Rothery, D. A. (2008). Correlations between SO2 flux, seismicity, and outgassing activity at the open vent of Villarrica Volcano, Chile. J. Geophys. Res. 113, B10201. doi:10.1029/2008JB005577
Palma, J. L., Blake, S., and Calder, E. S. (2011). Constraints on the rates of degassing and convection in basaltic open-vent volcanoes. Geochem. Geophys. Geosyst. 12, Q11006. doi:10.1029/2011GC003715
Patrick, M. R., Orr, T. A., Sutton, J., Elias, T., and Swanson, D. (2013). The first five years of Kīlauea’s summit eruption in Halema‘uma‘u Crater, 2008–2013. U.S. Geol. Surv. Fact. Sheet 2013–3116, 4. doi:10.3133/fs20133116
Patrick, M. R., Anderson, K. R., Poland, M. P., Orr, T. R., and Swanson, D. A. (2015). Lava lake level as a gauge of magma reservoir pressure and eruptive hazard. Geology 43, 831–834. doi:10.1130/G36896.1
Patrick, M., Johanson, I., Shea, T., and Waite, G. (2020). The historic events at kīlauea volcano in 2018: Summit collapse, rift zone eruption, and mw 6.9 earthquake: Preface to the special issue. Bull. Volcanol. 82, 46. doi:10.1007/s00445-020-01377-5
Perez, W., and Freundt, A. (2006). “The youngest highly explosive basaltic eruptions from Masaya caldera (Nicaragua): Stratigraphy and hazard assessment,” in Volcanic hazards in Central America. Editors W. I. Rose, G. J. S. Bluth, M. J. Carr, J. W. Ewert, L. C. Patino, and J. W. Vallance (Geol Soc Amer Spec Pap), 412, 189–207.
Poland, M., Miklius, A., Jeff Sutton, A., and Thornber, C. R. (2012). A mantle-driven surge in magma supply to Kīlauea Volcano during 2003–2007. Nat. Geosci. 5, 295–300. doi:10.1038/ngeo1426
Rothman, L. S., Gordon, I. E., Babikov, Y., Barbe, A., Chris Benner, D., Bernath, P. F., et al. (2013). The HITRAN 2012 molecular spectroscopic database. J. Quantitative Spectrosc. Radiat. Transf. 130, 4–50. doi:10.1016/j.jqsrt.2013.07.002
Rymer, H., van Wyk de Vries, B., Stix, J., and Williams-Jones, G. (1998). Pit crater structure and processes governing persistent activity at Masaya Volcano, Nicaragua. Bull. Volcanol. 59, 345–355. doi:10.1007/s004450050196
Sadofsky, S. J., Portnyagin, M., Hoernle, K., and van den Bogaard, P. (2008). Subduction cycling of volatiles and trace elements through the central American volcanic arc: Evidence from melt inclusions. Contrib. Mineral. Pet. 155, 433–456. doi:10.1007/s00410-007-0251-3
Sawyer, G. M., Carn, S. A., Tsanev, V. I., Oppenheimer, C., and Burton, M. (2008). Investigation into magma degassing at Nyiragongo volcano, democratic republic of the Congo. Geochem. Geophys. Geosyst. 9, Q02017. doi:10.1029/2007GC001829
Shreve, T., Grandin, R., Boichu, M., Moussallam, Y., Ballu, V., Delgado, F., et al. (2019). From prodigious volcanic degassing to caldera subsidence and quiescence at Ambrym (Vanuatu): The influence of regional tectonics. Sci. Rep. 9, 18868. doi:10.1038/s41598-019-55141-7
Smets, B., D'Oreye, N., and Kervyn, F. (2014). Toward another lava lake in the virunga volcanic field? Eos Trans. AGU 95, 377–378. doi:10.1002/2014eo420001
Smittarello, D., Smets, B., Barrière, J., Michellier, C., Oth, A., Shreve, T., et al. (2022). Precursor-free eruption triggered by edifice rupture at Nyiragongo volcano. Nature 609, 83–88. doi:10.1038/s41586-022-05047-8
Stephens, K., and Wauthier, C. (2018). Satellite geodesy captures offset magma supply associated with lava lake appearance at Masaya volcano, Nicaragua. Geophys. Res. Lett. 45, 2669–2678. doi:10.1002/2017GL076769
Stevenson, D. S., and Blake, S. (1998). Modelling the dynamics and thermodynamics of volcanic degassing. Bull. Volcanol. 60, 307–317. doi:10.1007/s004450050234
Sweeney, D., Kyle, P. R., and Oppenheimer, C. (2008). Sulfur dioxide emissions and degassing behavior of Erebus volcano, Antarctica. J. Volcanol. Geotherm. Res. 177, 725–733. doi:10.1016/j.jvolgeores.2008.01.024
Tazieff, H. (1966). État actuel des connaissances sur le volcan Niragongo (République Démo. du Congo). Bull. Soc. Géol. Fr. t VIII, 176–200.
Tazieff, H. (1977). An exceptional eruption: Mt. Niragongo, jan. 10th, 1977. Bull. Volcanol. 30, 189–200. doi:10.1007/bf02596999
Tazieff, H. (1984). Mt. Niragongo: Renewed activity of the lava lake. J. Volcanol. Geotherm. Res. 20, 267–280. doi:10.1016/0377-0273(84)90043-x
Tazieff, H. (1994). Permanent lava lakes: Observed facts and induced mechanisms. J. Volcanol. Geotherm. Res. 63, 3–11. doi:10.1016/0377-0273(94)90015-9
Valade, S., Ripepe, M., Giuffrida, G., Karume, K., and Tedesco, D. (2018). Dynamics of Mount Nyiragongo lava lake inferred from thermal imaging and infrasound array. Earth Planet Sci. Lett. 500, 192–204. doi:10.1016/j.epsl.2018.08.004
Verhoogen, J. (1948). “Les éruptions 1938–1940 du volcan Nyamuragira, Missions Jean Verhoogen,” in Fascicule 1, 1938–1940 (Brussels, Belgium, 187.
Viramonte, J. G., and Incer-Barquero, J. (2008). Masaya, the "mouth of hell", Nicaragua: Volcanological interpretation of the myths, legends and anecdotes. J. Volcanol. Geotherm. Res. 176, 419–426. doi:10.1016/j.jvolgeores.2008.01.038
Wadge, G., and Burt, L. (2011). Stress field control of eruption dynamics at a rift volcano: Nyamuragira, D.R. Congo. J. Volcanol. Geotherm. Res. 207 (1–2), 1–15. doi:10.1016/j.jvolgeores.2011.06.012
Wallace, P. J. (2001). Volcanic SO2 emissions and the abundance and distribution of exsolved gas in magma bodies. J. Volcanol. Geotherm. Res. 108, 85–106. doi:10.1016/S0377-0273(00)00279-1
Wauthier, C., Cayol, V., Kervyn, F., and d'Oreye, N. (2012). Magma sources involved in the 2002 Nyiragongo eruption, as inferred from an InSAR analysis. J. Geophys. Res. 117, B05411. doi:10.1029/2011JB008257
Wauthier, C., Roman, D. C., and Poland, M. P. (2013). Moderate-magnitude earthquakes induced by magma reservoir inflation at Kīlauea Volcano, Hawai‘i. Geophys. Res. Lett. 40, 5366–5370. doi:10.1002/2013GL058082
Witham, F., Woods, A. W., and Gladstone, C. (2006). An analogue experimental model of depth fluctuations in lava lakes. Bull. Volcanol. 69 (1), 51–56. doi:10.1007/s00445-006-0055-8
Witter, J. B., Kress, V. C., Delmelle, P., and Stix, J. (2004). Volatile degassing, petrology, and magma dynamics of the Villarrica lava lake, southern Chile. J. Volcanol. Geotherm. Res. 134 (4), 303–337. doi:10.1016/j.jvolgeores.2004.03.002
Keywords: lava lake, SO2 flux, Volcanic Radiative Power, magmatic convection, magmatic foam, satellite remote sensing, OMI, MODIS
Citation: Campion R and Coppola D (2023) Classification of lava lakes based on their heat and SO2 emission: Implications for their formation and feeding processes. Front. Earth Sci. 11:1040199. doi: 10.3389/feart.2023.1040199
Received: 09 September 2022; Accepted: 20 January 2023;
Published: 07 February 2023.
Edited by:
Georg Rümpker, Goethe University Frankfurt, GermanyReviewed by:
Karoly Nemeth, Institute of Earth Physics and Space Sciences, HungaryCopyright © 2023 Campion and Coppola. This is an open-access article distributed under the terms of the Creative Commons Attribution License (CC BY). The use, distribution or reproduction in other forums is permitted, provided the original author(s) and the copyright owner(s) are credited and that the original publication in this journal is cited, in accordance with accepted academic practice. No use, distribution or reproduction is permitted which does not comply with these terms.
*Correspondence: Robin Campion, cm9iaW5AZ2VvZmlzaWNhLnVuYW0ubXg=
Disclaimer: All claims expressed in this article are solely those of the authors and do not necessarily represent those of their affiliated organizations, or those of the publisher, the editors and the reviewers. Any product that may be evaluated in this article or claim that may be made by its manufacturer is not guaranteed or endorsed by the publisher.
Research integrity at Frontiers
Learn more about the work of our research integrity team to safeguard the quality of each article we publish.