 Dee Ninis
 Andy Howell
 Timothy Little
 Nicola Litchfield4
94% of researchers rate our articles as excellent or good
Learn more about the work of our research integrity team to safeguard the quality of each article we publish.
Find out more
ORIGINAL RESEARCH article
Front. Earth Sci. , 23 March 2023
Sec. Structural Geology and Tectonics
Volume 11 - 2023 | https://doi.org/10.3389/feart.2023.1028445
This article is part of the Research Topic Tectono-Magmatism, Metallogenesis, and Sedimentation at Convergent Margins View all 13 articles
Theoretical studies of the seismic cycle at convergent plate boundaries anticipate that most coseismic deformation is recovered, yet significant permanent vertical displacement of the overriding plate is observed at many subduction margins. To understand the mechanisms driving permanent vertical displacement, we investigate tectonic uplift across the southern Hikurangi subduction margin, Aotearoa New Zealand, in the last ∼200 ka. Marine terraces preserved along the Wellington south coast have recently been dated as Marine Isotope Stage (MIS) 5a (∼82 ka), 5c (∼96 ka), 5e (∼123 ka) and 7a (∼196 ka) in age. We use these ages, together with new reconstructions of shoreline angle elevations, to calculate uplift rates across the margin and to examine the processes responsible for their elevation. The highest uplift rate—1.7 ± 0.1 mm/yr–and maximum tilting—2.9° to the west–are observed near Cape Palliser, the closest site to (∼50 km from) the Hikurangi Trough. Uplift rates decrease monotonically westward along the Palliser Bay coast, to 0.2 ± 0.1 mm/yr at Wharekauhau (∼70 km from the trough), defining a gently west-tilted subaerial forearc domain. Locally, active oblique-slip upper-plate faults cause obvious vertical offsets of the marine terraces in the axial ranges (>70 km from the trough). Uplift rates at Baring Head, on the upthrown side of the Wairarapa-Wharekauhau fault system, are ∼0.7–1.6 mm/yr. At Tongue Point, uplift on the upthrown side of the Ōhāriu Fault is 0.6 ± 0.1 mm/yr. Dislocation and flexural-isostatic modelling shows that slip on faults within the overriding plate—specifically the Palliser-Kaiwhata Fault and the Wairarapa-Wharekauhau fault system—may dominate uplift in their immediate hanging walls. Depending on their slip rate and geometry, slip on these two upper-plate fault systems could plausibly cause >80% of late Pleistocene uplift everywhere along the south coast of North Island. Our modelling suggests that subduction of the buoyant Hikurangi Plateau contributes uplift of 0.1–0.2 mm/yr and uplift due to sediment underplating at Tongue Point and Wharekauhau is likely ≤0.6 mm/yr but could be significantly lower. Earthquakes on the subduction interface probably contribute ≤0.4 mm/yr of late Pleistocene uplift, with ≤10% of uplift due to each earthquake being stored permanently, similar to other subduction zones. These results indicate a significant contribution of slip on upper-plate faults to permanent uplift and tilting across the subduction margin and suggest that in regions where upper-plate faults are prevalent, strong constraints on fault geometry and slip rate are necessary to disentangle contributions of deeper-seated processes to uplift.
Marine terraces preserved along coastal regions can be used to infer rates and patterns of tectonic uplift across active margins. By combining shore platform (specifically shoreline angle) elevation data with the age of the corresponding terrace, uplift rates can be quantified (e.g., Bradley and Griggs, 1976; Ota et al., 1981; Muhs et al., 1990; Muhs et al., 1992; Zazo et al., 2003; Yildirim et al., 2013; Karymbalis et al., 2022). Accruing over tens to hundreds of thousands of years, patterns of uplift of the overriding plate have the potential to provide insight into local subduction margin processes (e.g., Merritts and Bull, 1989; Berryman, 1993a; 1993b; Wilson et al., 2007a; Wilson et al., 2007b; Matsu’ura, 2015; Meschis et al., 2022).
Beneath the east coast of the northern and central North Island of New Zealand, the Hikurangi subduction interface is weakly to moderately elastically coupled (e.g., Walcott, 1984; Reyners, 1998; Wallace et al., 2004; Wallace et al., 2012) (Figure 1). Previous marine terrace studies in this region have attributed the observed coastal uplift to some combination of rupture on upper-plate faults, subduction of an overthickened and buoyant Hikurangi Plateau with occasional seamounts, and sediment underplating (e.g., Berryman et al., 1989; Ota et al., 1991; Wilson et al., 2007a; Wilson et al., 2007b; Litchfield et al., 2007; Berryman et al., 2011; Mouslopoulou et al., 2016; Litchfield et al., 2022). In contrast to the northern and central North Island, the subduction interface beneath the southern North Island has been shown to be elastically almost fully coupled or “locked” (φic = 0.8–1.0—e.g., Walcott, 1984; Reyners, 1998; Darby and Beavan, 2001; Wallace et al., 2004; Wallace et al. 2007; Wallace et al. 2012) (Figure 1). Investigations along the southeast coast of the North Island concluded that elevated Holocene marine terraces preserved there are the result of coseismic uplift from rupture on nearby offshore faults, such as the reverse Palliser-Kaiwhata Fault (Berryman et al., 2011; Litchfield and Clark, 2015) (Figure 2). Rupture of the subduction interface at the southern Hikurangi Margin, which dislocation models suggest could be Mw 8.0–8.5 or larger (Wallace et al., 2009; Stirling et al., 2012; Clark et al., 2019), has also contributed to uplift since the Holocene, with recent analyses of marine terraces indicating uplift from at least one subduction earthquake within the locked area (Litchfield et al., 2021). Whether or not other processes influence permanent vertical displacement across the southern Hikurangi Margin over longer periods, and their relative contributions, remains largely unknown.
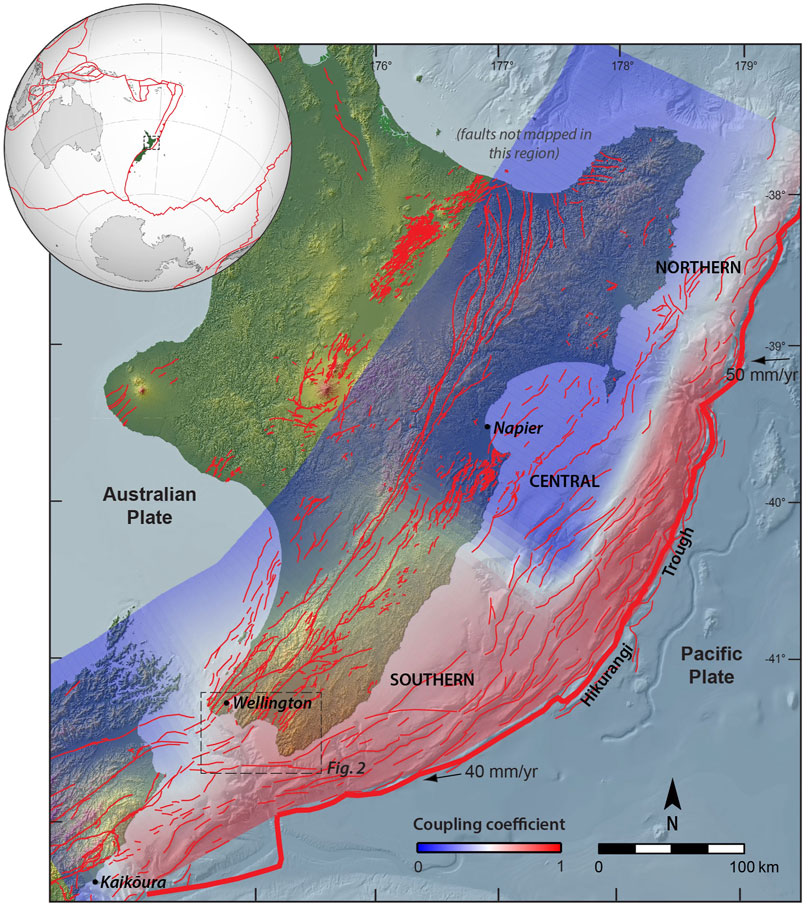
FIGURE 1. Tectonic setting of New Zealand showing plate boundary components and motion rates (DeMets et al., 1990; DeMets et al., 1994; DeMets et al., 2010), and Hikurangi subduction interface coupling of the North Island - regions in blue are weakly coupled (undergoing aseismic slow slip), regions in red are fully elastically coupled (locked) (from Wallace et al., 2012). Also shown are active crustal faults (red lines) (onshore faults from the New Zealand Community Fault Model (NZ CFM) - Seebeck et al., 2022; offshore active faults from Barnes and Audru, 1999; Barnes et al., 2002; Nodder et al., 2007; Mountjoy et al., 2009; Barnes et al., 2010; Pondard and Barnes, 2010; Mountjoy and Barnes, 2011; Barnes et al., 2019; Litchfield et al., 2022).
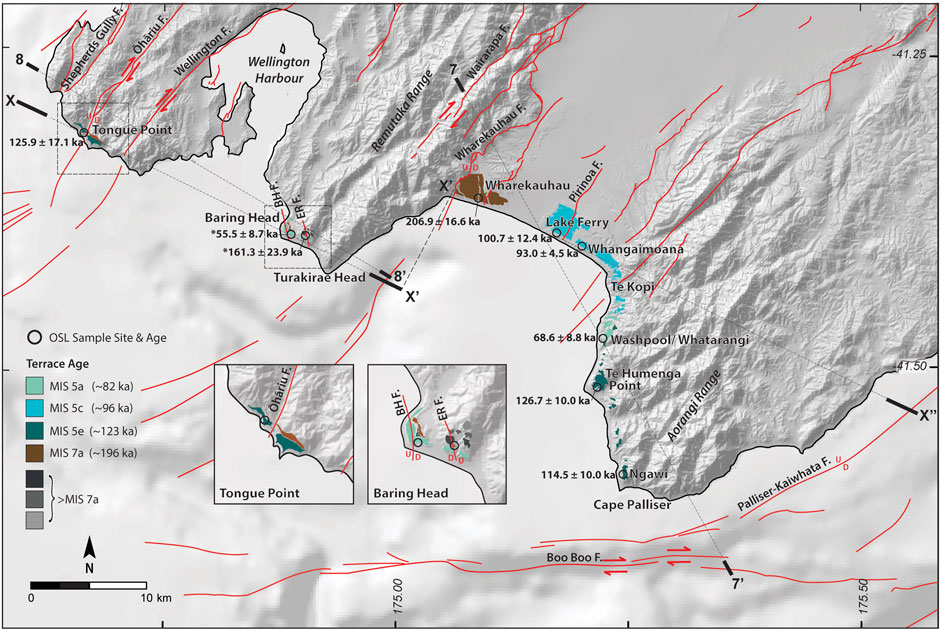
FIGURE 2. Late Pleistocene marine terrace MIS ages and distribution along the Wellington south coast, including OSL sample collection sites (black open circles) and corresponding ages (asterisks denotes minimum age)—only ages relevant to dating the shore platform are shown; MIS and OSL ages from Ninis et al. (2022). Also shown are active crustal faults (red lines) (onshore faults from the New Zealand Community Fault Model (NZ CFM) - Seebeck et al., 2022; offshore faults from Barnes et al., 2008) (BHF, Baring Head Fault; ERF, East River Fault). Location of profiles for Figure 7, Figure 8 and Profile X of Figure 6, Figure 9 are shown. Figure modified from Ninis et al., 2022.
This investigation is the first to present late Pleistocene coastal uplift rates along the Wellington south coast of the North Island of New Zealand using emergent shoreline angle elevations (rather than terrace tread elevations, which include the thickness of coverbed deposits) in a margin-wide and systematic way, and to evaluate the causes of vertical displacement along this southernmost part of the Hikurangi subduction margin. Our study area spans ∼100 km of coastline between Tongue Point west of Wellington, and Ngawi near Cape Palliser to the east (Figure 2), where a series of late Pleistocene marine terrace remnants are today elevated to up to ∼400 m above current day sea level (e.g., Ghani, 1974; Ghani, 1978; Ota et al., 1981; Begg and Johnston, 2000; Ninis et al., 2022). Seven marine terraces have previously been identified and recently dated; the youngest four of which have been shown to correspond to formation during Marine Isotope Stage (MIS) 5a (peak age 82 ka), 5c (96 ka), 5e (123 ka) and MIS 7a (196 ka) (Ninis et al., 2022) (Figure 2). In this paper, we apply recently published shore platform elevation data (Ninis et al., 2022) to reconstruct shoreline angle elevations for these terraces. Using available paleo-sea level data, we then correct these elevations for sea level at the time of their formation. We are thus able to provide robust uplift estimates for a margin-normal transect across the southern Hikurangi Margin since the late Pleistocene. Finally, we consider the distribution of uplift across this transect and compare this with results of coupled elastic dislocation and flexural-isostatic models. These models allow us to quantify the likely contribution to late Pleistocene uplift from slip on known upper-plate fault systems, and to constrain likely contributions to uplift from other processes such as the subduction of a buoyant Hikurangi Plateau, the earthquake cycle on the Hikurangu subduction interface, and sediment underplating.
Vertical displacement due to megathrust earthquakes such as the 2011 Mw 9.1 Tohoku-Oki earthquake, the 2004 Mw 9.3 Sumatra-Andaman earthquake, the 1964 Mw 9.4 in Alaska, and the 1960 Mw 9.5 Chile earthquake, generally results in coseismic uplift of the coast closest to the subduction trench (within ∼150 km), and a similarly-oriented region of subsidence further from the trench (between ∼150 and 250 km) (Figure 3A) (e.g., Grantz et al., 1964; Plafker, 1965; Plafker, 1972; Briggs et al., 2006; Subarya et al., 2006; Vigny et al., 2011), the precise distances being controlled by the geometry of the underlying subduction interface and the distribution of coseismic fault slip. Earthquake ruptures of upper-plate faults can also result in coastal uplift; as a result of the Mw 7.8 Hawke’s Bay earthquake of 1931, the coast near Napier was uplifted by up to ∼2.7 m to a distance of ∼20 km from a mostly blind source fault (Hull, 1990) (Figure 3C). The above coseismic displacements are indicative of global observations which propose that the wavelength of deformation can be used to infer whether uplift is the result of slip on the subduction interface or rupture of upper-plate faults; typically, broad-wavelength (100s of km wide) zones of uplift result from megathrust earthquakes, whereas short wavelength (up to ∼20 km) are more likely sourced by a more steeply-dipping upper-plate fault. More complex earthquakes at convergent margins may involve rupture on both an upper-plate fault as well as along the subduction interface. A currently documented example is the 1855 Mw 8.2 Wairarapa earthquake, which resulted in uplift of the Wellington coast to the west of the Wairarapa Fault (e.g., Turakirae Head, Wellington Harbour and Porirua Harbour) across a distance of >30 km (Darby and Beanland, 1992; Beavan and Darby, 2005; Begg and McSaveney, 2005; Downes, 2005; McSaveney et al., 2006). Another example of simultaneous rupture of upper-plate faults and the subduction interface is the 2016 Mw7.8 Kaikōura earthquake (e.g., Hamling et al., 2017; Furlong and Herman, 2017; Wang et al., 2018; Mouslopoulou et al., 2019).
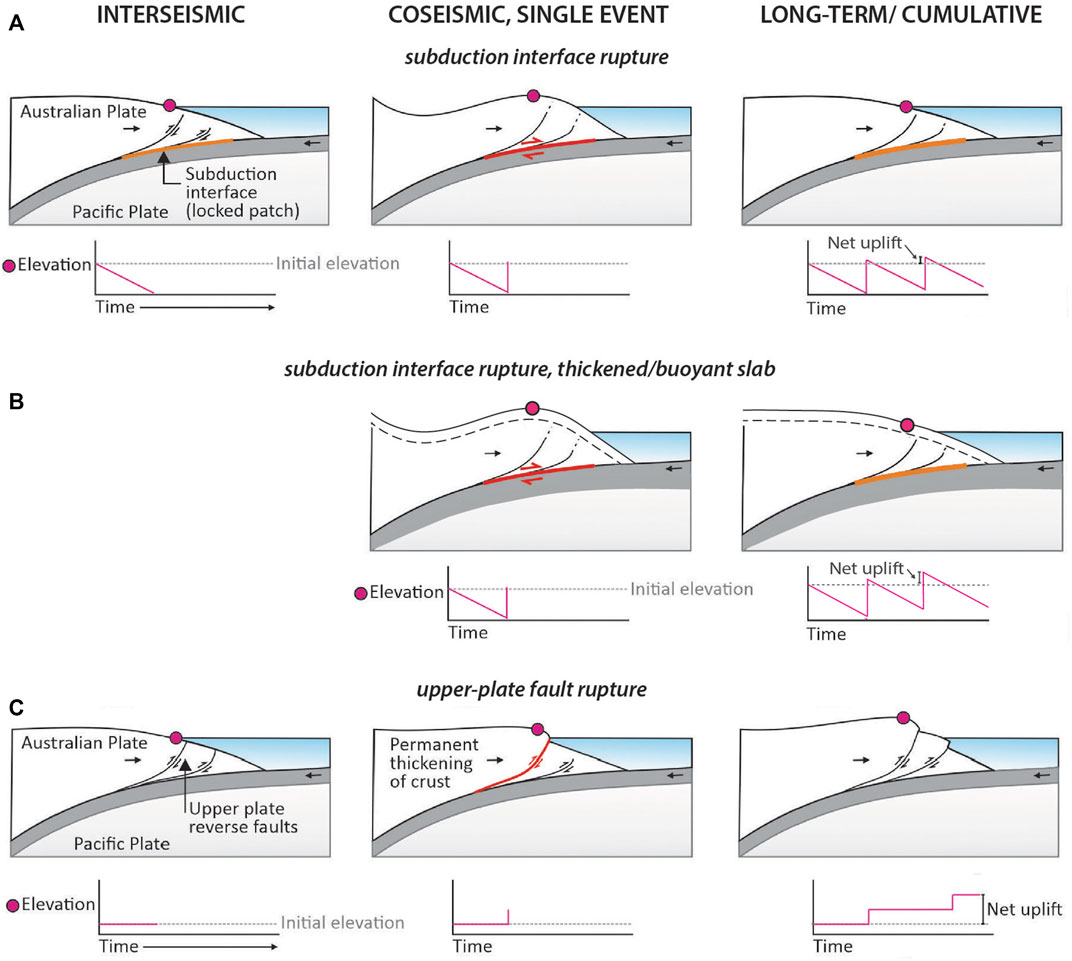
FIGURE 3. Possible causes of long-term vertical deformation at the Hikurangi Margin, and their likely expression: (A) subduction interface rupture; (B) subduction interface rupture involving a thickened buoyant Hikurangi Plateau (dashed line depicts vertical deformation without the down-going buoyant slab); (C) upper-plate fault rupture. Figure modified after Howell and Clark (2022).
Vertical displacement can also be the result of ongoing aseismic movement. Following a megathrust earthquake, post-seismic relaxation followed by longer-term interseismic elastic strain accumulation generally results in vertical motion in the opposite sense to the coseismic displacement. For example, after the 1950 Mw 7.7 Nicoya Peninsula, Costa Rica earthquake, post-seismic relaxation removed the uplift which accompanied the earthquake; locals reported the shoreline dropping in elevation at the time of the earthquake, only to return to its former elevation 40 years later (Marshall and Anderson, 1995). Slow slip events (SSEs) can also contribute to vertical displacement, with uplift and subsidence expressed in a similar sense to subduction zone earthquakes. For example, offshore of the southwestern North Island, New Zealand, SSEs have resulted in uplift of up to ∼2 cm onland (Wallace, 2020). Similarly, the SSE offshore of the northeastern South Island triggered by the 2016 Mw 7.8 Kaikōura earthquake produced coastal uplift at the southern end of North Island of up to ∼2 cm (Wallace et al., 2018).
When vertical coseismic displacement is not completely removed by post-seismic relaxation and interseismic strain accumulation, megathrust earthquakes can leave a permanent signal of uplift in the landscape. In these instances, over many seismic cycles (1,000s of years) evidence of coseismic uplift as a result of multiple earthquakes can be preserved as a stepped pattern in the coastal topography. For example, each of the Holocene marine terraces preserved at Cape Mendocino, California, are thought to be a result of separate ruptures on the Cascadia megathrust (e.g., Merritts and Bull, 1989; Carver et al., 1994; Merritts, 1996; Murray et al., 1996), as are some of the emergent terraces along the coast of south-central Chile (e.g., Nelson and Manley, 1992; Bookhagen et al., 2006). Multiple ruptures on upper-plate faults could also be expressed as a stepped pattern in the coastal topography. For example, at Kaikōura Peninsula, on the east coast of the South Island, New Zealand, a suite of uplifted and tilted Pleistocene to Holocene-aged marine terraces have been inferred to be the result of repeated rupture on nearby faults (Ota et al., 1996; Gardner, 2011; Duffy, 2020; Howell and Clark, 2022; Nicol et al., 2022). This coastline was again uplifted by up to 6.5 m during the 2016 Mw 7.8 Kaikōura multi-fault rupture earthquake (Clark et al., 2017; Hamling et al., 2017).
Over 100,000s of years, characteristics of the subducting plate such as variations in crustal thickness, density and topography, or deep-seated processes such as sediment underplating, can also drive long-term uplift of the upper-plate (e.g., Merritts and Bull, 1989; Saillard et al., 2011) (Figure 3B). In summary, long-term net vertical displacement can be the result of a number of both seismic and aseismic processes combined; the challenge is to disentangle the different causes as expressed in the topography.
New Zealand straddles the Pacific-Australian plate boundary (Figure 1). Offshore of the northeast of the North Island, and to its southernmost extent at the northernmost South Island, the oceanic Pacific Plate subducts westward beneath the continental crust of the Australian Plate at the Hikurangi Trough; a process which began ∼23 Ma ago (e.g., Kamp, 1999). During the past ∼1–2 Ma, the subducting Pacific Plate has consisted of the Hikurangi Plateau, a thick and buoyant igneous province (e.g., Davy and Wood, 1994; Nicol et al., 2002; Reyners et al., 2006; Wallace et al., 2009). Convergence rates vary along the plate boundary (DeMets et al., 1990; Plafker, 1994; Wallace et al., 2007; Plafker, 2010) (Figure 1) and a subtle change in plate convergence direction and orientation of the plate boundary results in greater obliquity in plate convergence towards the south, such that in the South Island of New Zealand the two plates collide through oblique continental transpression (e.g., Van Dissen and Yeats, 1991).
The Hikurangi Trough is located ∼50 km offshore of the east coast of the southern North Island (Figure 1). Onshore, long term contractional upper-plate deformation is expressed by folding and reverse faulting, with associated features including the uplifted Remutaka, Aorangi, and Tararua ranges trending northeast (Begg and Mazengarb, 1996; Begg and Johnston, 2000). The majority of margin-parallel motion (>50->70%) is taken up by slip on several predominately dextral strike-slip upper-plate faults in the exposed forearc; these include the Wairarapa, Wellington, Ōhāriu, and Shepherds Gully/Pukerua faults (Figure 2). The Wellington Fault (slip rate 5.5 ± 2.3 mm/yr–New Zealand Community Fault Model (NZ CFM), Seebeck et al. (2022)) has a near-vertical dip and exhibits minimal dip-slip motion where it crosses the coast, while the Wairarapa [slip rate 11 ± 3 mm/yr–Seebeck et al. (2022)] and Ōhāriu faults [slip rate 1.5 ± 0.5 mm/yr–Seebeck et al. (2022)] dip steeply northwest and host a larger component of dip-slip motion. Many of these faults may be listric at depth (Henrys et al., 2013), and the Wairarapa Fault may connect at a relatively shallow depth (∼5–10 km) with the nearby Wharekauhau Thrust Fault [slip rate 2.5 ± 1 mm/yr—Seebeck et al. (2022)] depending on their respective geometries. Most (∼80%) of the margin-perpendicular motion is believed to be accommodated by slip on the subduction interface and connected imbricate thrusts in the offshore accretionary wedge (Darby and Beavan, 2001; Nicol and Beavan, 2003; Wallace et al., 2004; Nicol et al., 2007), the closest of which, at ∼5 km from the coast, is the west-dipping, dextral reverse Palliser-Kaiwhata Fault (e.g., Barnes and Mercier de Lepinay, 1997; Barnes et al., 1998; Barnes and Audru, 1999; Mountjoy et al., 2009) (vertical slip rate 5.0 ± 2.0 mm/yr (Seebeck et al., 2022) (Figure 2).
Results from the 2009–2011 Seismic Array Hikurangi Experiment (SAHKE) (e.g., Henrys et al., 2013; Williams et al., 2013) show that across the southern Hikurangi Margin (41°S latitude), the subduction interface has a dip of <5° at shallow depths (within ∼15 km of the surface) west of which there is a sudden increase in dip to >15° at greater depths. This kink in the interface occurs beneath the Tararua Ranges where a zone of sediment underplating may exist near the juncture between the Wairarapa Fault and the plate interface. Here, the seismogenic behaviour of the subduction interface changes, from weakly elastically coupled to strongly coupled (Walcott, 1984; Henrys et al., 2013). Historically (post-1840 AD), no significant (>Mw 7.2) earthquakes have occurred on the southern Hikurangi subduction interface, however previous studies have revealed evidence of several pre-historic subduction earthquakes (e.g., Cochran et al., 2007; Clark et al., 2011; Clark et al., 2015; Clark et al. 2019; Litchfield et al., 2021; Pizer et al., 2021). Rupture of the currently strongly coupled subduction interface, in the form of a megathrust earthquake, was modelled by Clark et al. (2015) to determine the areas that are likely to experience coseismic uplift or subsidence. According to their elastic dislocation model, which assumes a megathrust recurrence interval of 500 years, the expected maximum coseismic uplift of the southern North Island would be ∼1.0–1.5 m along the east coast ∼50 km from the Hikurangi Trough, ∼1 m between Cape Palliser and Te Kopi, <0.5 m at Wharekauhau, and negligible at Turakirae Head ∼90 km from the trough; sites further to the west were estimated to experience subsidence.
Continuous Global Navigation Satellite System (GNSS) and Interferometric Synthetic Aperture Radar (InSAR) data from the last few decades from the lower North Island show that interseismic strain in this region, presumed to be the result of interseismic coupling on the subduction interface, is currently causing the area to subside (Beavan and Litchfield, 2012; Houlié and Stern, 2017; Hamling et al., 2022). The rates increase towards the Hikurangi Trough, from 0 mm/yr at Tongue Point, to 3 mm/yr at Turakirae Head, and 7 mm/yr in the area between Te Humenga Point and Cape Palliser (Hamling et al., 2022).
The elevated late Pleistocene shore platforms of the Wellington south coast are discontinuously preserved between near Tongue Point, west of Wellington, and Ngawi near Cape Palliser to the east (Figure 2). These terraces are variably cut into Triassic-Cretaceous Torlesse Supergroup bedrock or Neogene to Pleistocene-aged sedimentary rocks that mantle the Torlesse bedrock (Begg and Johnston, 2000). The original shore platforms, including the former shorelines, are typically overlain by marine/beach deposits, and are now mostly obscured by younger terrestrial coverbeds (alluvium, loess, colluvium) ranging from a few metres to up to ∼30 m in thickness (Ninis et al., 2022). The terraces are best preserved and most continuous within the Hikurangi Margin forearc, along the coast of Palliser Bay, where they decrease in altitude towards the west, indicating long wavelength, westward tectonic tilting across this region. Further from the Hikurangi Trough, the terraces are locally offset by a number of active crustal faults, most notably the Wairarapa and Ōhāriu faults (Ninis et al., 2022).
Previous investigations of the late Pleistocene marine terraces along the south coast of the North Island by Ghani (1974); Ghani (1978) and Ota et al. (1981) calculated local uplift using the terrace tread as the elevation datum (i.e., including the thickness of coverbed deposits). To calculate uplift for the terraces preserved along the Palliser Bay and southern Wairarapa coasts only (Figure 2), Ghani (1974); Ghani (1978) estimated that sea level during MIS 5e at 125 ka was exactly equal to that of the current day and, assuming a constant uplift rate, yielded rates of 1.5–2.0 mm/yr at Cape Palliser, decreasing to 0.5 mm/yr at Lake Ferry, and slightly increasing again to 1.0 mm/year at the westernmost site of his study, at Wharekauhau. For their study along the Wellington south coast west of the Wairarapa Fault only (Figure 2), Ota et al. (1981) had assumed that all of the “main” preserved terraces were created during the “main high sea level event of the last interglacial”, which at the time was estimated to be 120 ka. In their uplift rate calculations, Ota et al. (1981) inferred that sea level during this time was the same as that of the current day, based on work by Chappell (1974); their uplift rate estimates ranged from ∼0.6 mm/yr at Tongue Point to 0.9–1.0 mm/yr at Baring Head.
Subsidence of inferred Last Interglacial beach deposits has been documented on the north side of Wellington Harbour (Figure 2). Using drillhole core logs, Mildenhall (1995) and Begg and Mazengarb (1996) identified a marginal marine facies sequence on the downthrown side of the Wellington Fault, ∼48–105 m below sea level. These deposits were not dated, but were correlated to MIS 5 (71–128 ka) in age. This subsidence has resulted from localised extension at a releasing bend (e.g., Begg and Johnston, 2000) on the otherwise predominately strike-slip Wellington Fault (e.g., Van Dissen et al., 1992; Little et al., 2010; Langridge et al., 2011; Ninis et al., 2013).
More recently, Ninis et al. (2022) undertook an investigation of the emergent marine terraces along the entire length of the Wellington south coast. Their study employed Optically Stimulated Luminescence (OSL) dating of shore platform coverbeds which provided the first numerical ages for the majority of these terraces, most of which were shown to be between MIS 5a (peak age 82 ka) and MIS 7a (196 ka) in age (Figure 2). They also employed differential Global Navigation Satellite System (GNSS) elevation measurements of exposures of the wave-cut bedrock shore platform straths (i.e., excluding the variable thickness of coverbeds) allowing for their attitudes to be determined and for the terraces to be temporally correlated across the margin.
For each of the late Pleistocene marine terraces preserved along the Wellington south coast, we apply the formative ages provided by Ninis et al. (2022) (Figure 2) who made the assumption that shore platforms were cut during sea level highstands. They used OSL ages of marine (beach) deposits directly overlying the ancient shore platforms to determine the corresponding marine isotope stage (MIS), and then assigned them peak sea level ages as defined by Lisiecki and Raymo (2005). They also dated younger coverbed deposits, higher in the stratigraphic sequence (loess, colluvium), in order to provide assurance that the OSL ages defined a coherent “younging upwards” stratigraphic sequence. The terraces preserved at each site are listed by their corresponding MIS age in Table 1.
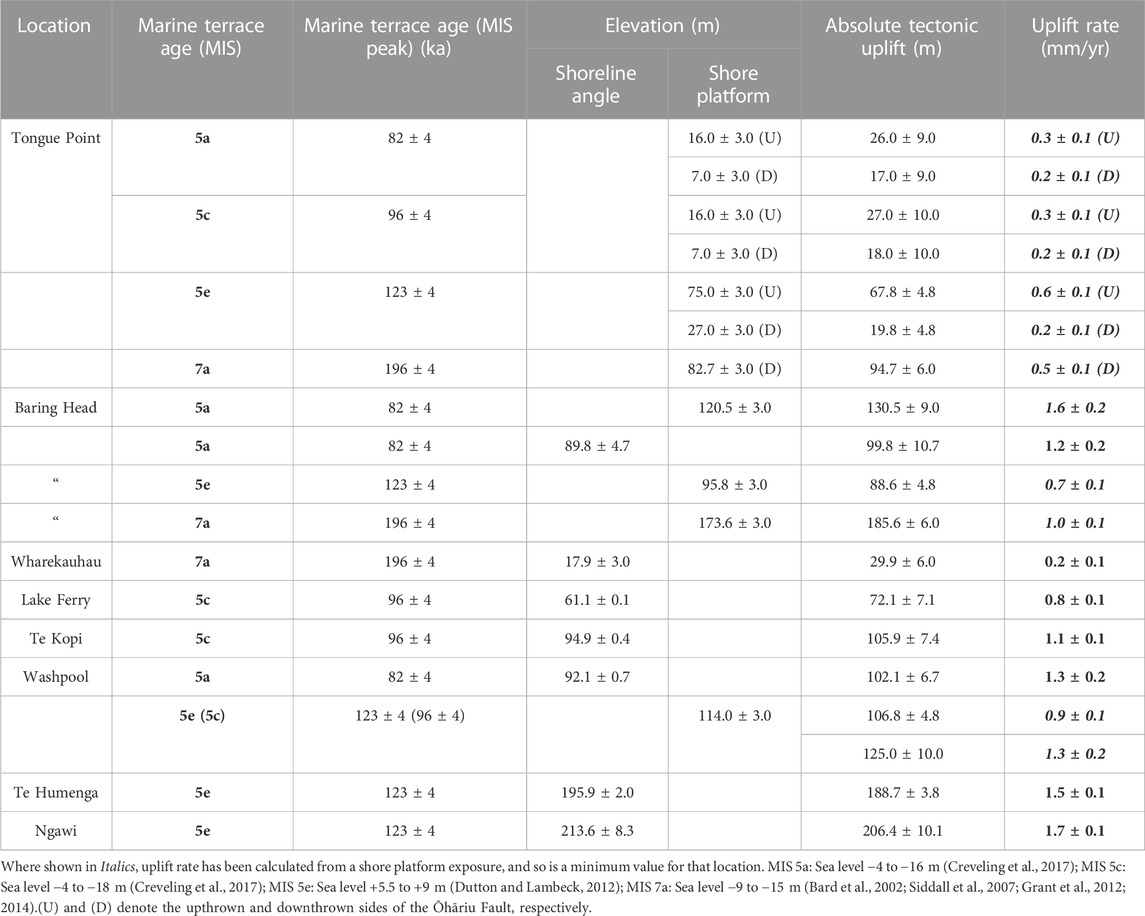
TABLE 1. Wellington south coast late Pleistocene marine terraces ages, shoreline angle elevations, absolute tectonic uplift and corresponding uplift rates. Marine terrace MIS ages are from Ninis et al. (2022) and peak ages are from Lisiecki and Raymo (2005).
The elevation measurement required to calculate uplift of a shore platform is that of the ancient shoreline, which we refer to as the shoreline angle (Lajoie, 1986) (Figure 4). This feature coincides with the most landward extent of the shore platform–the back edge, at the base of the ancient sea cliff–and is assumed to have been cut at the maximum reach of sea-level at the time of formation (Jara-Muñoz et al., 2016). During our study, exposures of the shoreline angle in bedrock were not found, due to shore platform cover bed deposits at the back edge of the terrace (predominately loess and colluvium) obscuring them. For this reason, the position and corresponding elevation of the shoreline angle beneath the younger coverbeds had to be reconstructed.
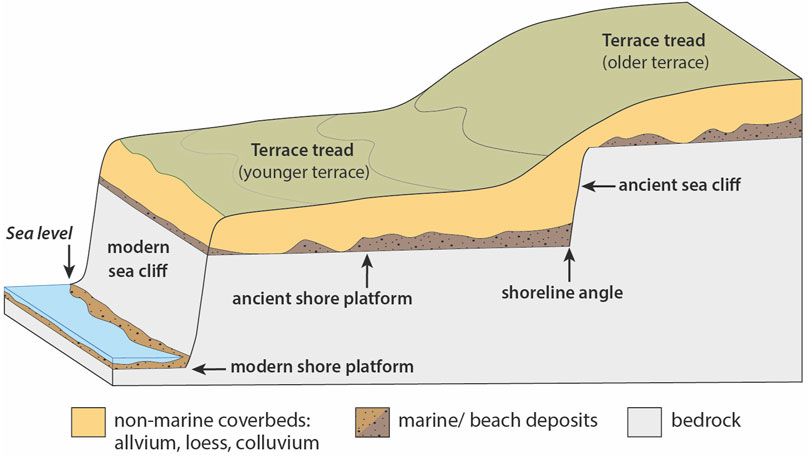
FIGURE 4. Schematic diagram showing typical geomorphic and geological features of marine terraces. Figure modified after Pillans (1990). Thickness of marine deposits and non-marine coverbeds (e.g., loess, colluvium) are illustrative only - they do not represent true thickness.
We use the mean planar attitude (strike/dip/dip direction) of the shore platform at each site, as calculated by Ninis et al. (2022). These were determined from GNSS Real-Time Kinematic (RTK) surveyed elevations of the shore platform wherever it was exposed, mainly in the coastal cliffs at the current-day front edge of the terrace, but also in drainage channels which cut through the terraces, as well as in man-made track cuttings. Ninis et al. (2022) describe the precision of the instrumentation and surveying technique used to collect these elevation points as within the natural variation of relief of the shore platform, which they estimated to be ±3 m. The shore platform data points (latitude, longitude, elevation), were then used to calculate a plane of best fit. The accuracy of their fitted plane was governed by the number of elevation points used, the effects of any outliers within the elevation dataset (for instance, measuring local lows due to channels, or highs due to stacks on the shore platform) and the spatial distribution of the data points. Each plane was associated with a corresponding residual of the fit - the smaller the residual, the better the fit.
In this study, we reconstruct the position and elevation of the shoreline angle using a series of profiles (e.g., Figure 5) parallel to the calculated dip of the shore platform. Because the paleo-shoreline is located at the intersection of the shore platform and the ancient sea cliff behind it, for each profile the shore platform surface was projected (with the appropriate dip angle) from a surveyed exposure site towards the sea cliff at the rear of the terrace. Since the ancient sea cliff has been modified by subsequent erosion and deposition, its original slope was estimated for each profile using the mid-point of the local modern-day sea cliff as an analogue for that site, with the assumption that the mid-point is least modified by erosion (which is most likely to be experienced at the top of the sea cliff) and least obscured by colluvial deposition (likely to occur at the bottom of the sea cliff). On each profile, the intersection of these two lines–representing the shore platform and ancient sea cliff–provided the elevation of the shoreline angle for that site. The uncertainty value of each calculated shoreline angle elevation is dependent on how well the calculated shore platform “fit” the surveyed elevation data at that site; we have used the residual of the plane fit (the average distance of each surveyed elevation point to the corresponding calculated shore platform) to define this uncertainty. Strandline elevations and associated uncertainties are listed in Table 1, and the full set of shoreline angle reconstruction profiles are provided in the Supplementary Material accompanying this manuscript.
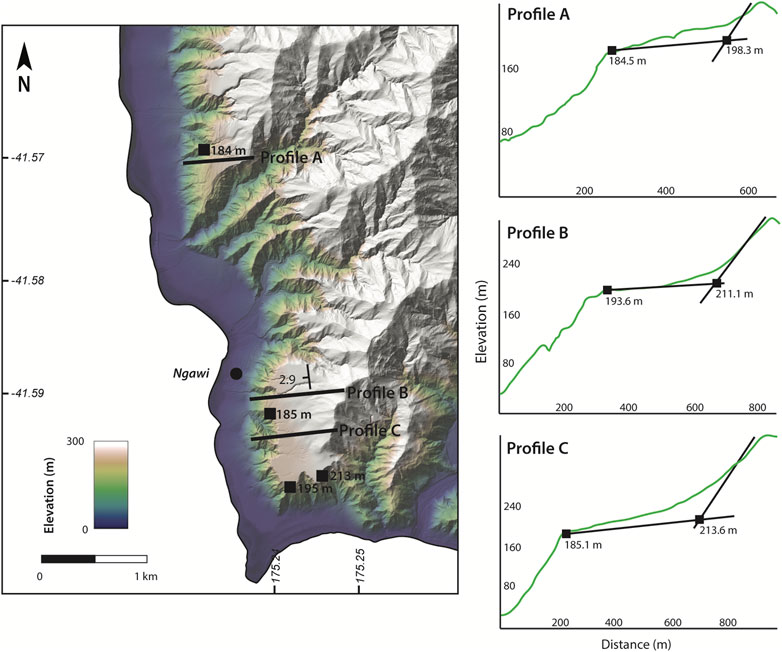
FIGURE 5. Late Pleistocene marine terraces at Ngawi, near Cape Palliser, showing shoreline angle elevation profiles reconstructions - Profiles (A–C) - on a 1 m lidar shaded hillslope model (courtesy GWRC/https://data.linz.govt.nz/layer/53621-wellington-lidar-1m-dem-2013-2014/).
The formation of the sequence of preserved late Pleistocene shore platforms on the Wellington south coast spans several highstands, between which sea level has varied. As a result, shoreline angle elevations measured above current-day mean sea level may be more or less than the absolute value of tectonic uplift, depending on whether sea level was lower or higher, respectively, at the time of their formation. Absolute tectonic uplift of a shore platform is calculated by the difference between the present-day shoreline angle elevation and paleo-sea level at the time that it was formed.
Some eustatic sea level reconstructions are based on radiometric dating and elevation measurements of paleo-sea level indicators–sediments or landforms whose position relative to sea level at the time of their formation is known (e.g., Huon Peninsula in Papua New Guinea - Chappell et al., 1996; Stirling et al., 1998; Chappell, 2002; Potter et al., 2004; Thompson and Goldstein, 2005; O'Leary et al., 2008; Thompson et al., 2011). Others are based on the ratio of oxygen-18 (18O) and oxygen-16 (16O) in fossil calcite contained within benthic and planktonic foraminifera of marine sediments, which is a function of the total global ice volume and deep ocean temperature (e.g., Red Sea - Rohling et al., 2008; Grant et al., 2012; Grant et al., 2014). Results of method-specific and site-specific sea level studies can depart significantly from the global mean; the latter is particularly true for sites where sea level is strongly influenced by glacio-hydro-isostatic effects (e.g., Lambeck and Nakada, 1992). As a result, studies using different methods and/or from different sites often result in varying paleo-sea level estimates. Although eustatic sea level reconstructions are available for New Zealand for the Holocene (e.g., Gibb, 1986; Clement et al., 2016), reliable estimates are not available for the MIS highstands relevant to this investigation - MIS 5a (peak age 82 ka), 5c (96 ka), 5e (123 ka) and 7a (196 ka). As such, for this study, we use eustatic sea level estimates determined from the “pooling” of high-quality data derived from a number of global sites, which have been corrected for isostatic contributions and probabilistically analysed.
A study of sea level that encompasses the penultimate interglacial, MIS 7, by Bard et al. (2002), measured the depth of, and radiometrically dated the calcite within, drowned speleothems in Italy. They compared their results to the depth and age of speleothems in the Bahamas (Li et al., 1989) to constrain sea level during MIS 7a to between −18 m and −9 m. This data was included in a review of all previously published data by Siddall et al. (2007) who constrained sea level for MIS 7a to between −5 and −15 m. In this study, we apply the overlapping values of the estimates of Bard et al. (2002) and Siddall et al. (2007) to obtain 9–15 m below present.
All recent studies for MIS 5e agree that sea level was higher than at present, with some studies suggesting that it was higher even than the previous long-standing estimates of +2–6 m (e.g., Neumann and Hearty, 1996; Stirling et al., 1998; McCulloch and Esat, 2000). Using a compilation of previously published sea level data from >40 different sites around the world, Kopp et al. (2009) undertook a probabilistic assessment of sea level during MIS 5e; their results showed a 95% probability that it had exceeded +6.6 m. In a review of global data which also takes into consideration glacio-hydro-isostatic effects, Dutton and Lambeck (2012) estimate sea level during MIS 5e at +5.5–9 m, which we apply in this study.
Estimates of peak sea level for MIS 5a and 5c vary widely depending on the study site, due to stronger glacio-hydro-isostatic effects resulting from the load of the Northern Hemisphere ice sheets (Lambeck, 2004; Potter and Lambeck, 2004; Thompson and Goldstein, 2005; Dumas et al., 2006). To reduce uncertainty in the variable sea level estimates for MIS 5a and 5c, Creveling et al. (2017) considered regional sea level estimates determined from geomorphic paleo-sea level indicators from 38 sites across the world. The data were included in a sensitivity analysis incorporating glacial isostatic adjustment simulations to constrain peak global sea level bounds for MIS 5a to ∼4–16 m below present, and for MIS 5c to ∼4–18 m below present, which we assume in our calculations.
Although applying these eustatic sea level estimates to the lower North Island means that any local glacio-hydro-isostatic effects are not taken into consideration, it is likely that such effects to New Zealand were small due to the relative isolation of New Zealand from the ice sheets; <1 m during the Holocene (Clement et al., 2016) and as far back as MIS 5c (Creveling et al., 2017).
To calculate the tectonic uplift rate, we apply the equation:
Uplift Rate (mm/yr) = Absolute Tectonic Uplift (m)/MIS Peak Age (ka)
The uncertainties in the uplift rate calculations incorporate those described in Ninis et al. (2022), namely: 1) the geologically-observed variability of each surveyed elevation point of ±3 m (1σ) which was included in the shore platform best-fit plane calculations; 2) the residual value of each calculated shore platform plane, representing the average distance (m) each surveyed shore platform elevation point deviated from the calculated best-fit plane, which was assigned as the uncertainty to the calculated shoreline angle elevation of that shore platform; these ranged from 0.1 to 8.3 m (Table 1). In addition, we consider 3) the full range of sea level estimated for each MIS under consideration and 4) ± 4 ka to each corresponding peak sea level age, as defined by Lisiecki and Raymo (2005).
Although uplift is most accurately determined from shoreline angle elevations, in some instances, where a shoreline angle elevation could not be reconstructed, we have used surveyed elevation measurements from shore platform exposures as close to the rear of the terrace as possible (i.e., nearest to the shoreline angle) to estimate a minimum uplift rate for that site.
We combine elastic dislocation models with simple isostatic calculations to assess contributions to uplift across the southern Hikurangi Margin since the late Pleistocene from four subduction-related processes: 1) slip on upper-plate faults; 2) subduction of the buoyant Hikurangi Plateau beneath the North Island; 3) permanent strain in the upper-plate associated with the earthquake cycle on the Hikurangi subduction interface; and 4) crustal thickening due to underplating of subducted sediment. The possible combined contributions of these processes to uplift rates were explored by Litchfield et al. (2007) using thermomechanical finite element models. We here build on that work by considering each process separately, with the aim of establishing upper bounds on the contribution to observed uplift from each process, rather than estimating combined uplift rates due to multiple processes together. We introduce our modelling of faulting within the upper-plate here, and include the simple calculations underpinning our estimates of uplift rates associated with the other processes in the Discussion (Section 5.2).
Slip on reverse faults within the overriding Australian Plate thickens the crust and would therefore be expected to contribute to permanent uplift (Figure 3C). The aim of this analysis is to identify approximate end member models, representing the likely minimum and maximum contributions of slip on upper-plate faults to uplift since the late Pleistocene. We model deformation using the elastic dislocation method of Okada (1985). Strictly, our use of this method models terrace uplift as the elastic response of a homogeneous solid to hundreds of metres of slip on a fault, as many previous studies have done (e.g., Anderson and Menking, 1994; Jara-Muñoz et al., 2019; Jara-Muñoz et al., 2022; Nicol et al., 2022). Since surface displacement scales linearly with fault slip in this formulation, the calculated uplift response is equivalent to the cumulative sum of the metre-scale individual elastic response to each earthquake. Although this form of elastic support is not a plausible mechanism to explain permanent uplift, the distribution of modelled uplift is closely related to the distribution of rates of crustal thickening through fault slip, which does lead to permanent uplift.
The overall pattern of westward tilting and corresponding decreasing uplift of the marine terraces closest to the Hikurangi Trough, between Cape Palliser and Wharekauhau, suggests that the structures responsible for this uplift are likely to be offshore of the east coast. This uplift pattern is abruptly interrupted across the Wairarapa Fault, west of which the marine terraces are preserved less continuously and are obviously vertically displaced by upper-plate faults (Ninis et al., 2022) (Figure 2). Based on these observations, we consider two separate sets of elastic dislocation models to represent permanent uplift that might be contributed to by repeated slip on 1) the Palliser-Kaiwhata Fault–the main active fault offshore of the east coast, which has previously been shown to be responsible for uplifted Holocene marine terraces on the southeast coast of the North Island (Berryman et al., 2011; Litchfield and Clark, 2015), and 2) the Wairarapa-Wharekauhau fault system, respectively. At Wharekauhau we also consider the possible opposing contributions associated with the site being located on the downthrown site of the Wairarapa Fault. Although there are several other faults in the hanging walls of both these fault systems, their dip-slip rates are an order of magnitude smaller; they can therefore be neglected in our modelling, which seeks to explain the large-scale features of Late Pleistocene marine terrace uplift. We choose not to model slip on the Wellington Fault, because there are no late Pleistocene marine terraces preserved nearby to where the fault crosses the coast, from which to quantify vertical displacement. Moreover Van Dissen et al. (1992) have shown little dip-slip motion across the fault near where it crosses the Wellington south coast, even though some vertical displacement has been observed across the fault further north, away from our modelled profile.
Although the upper-plate faults we consider are dextral-reverse, the strike-slip component causes negligible crustal thickening and would not lead to uplift on the timescale of multiple seismic cycles. Consequently, we only model deformation associated with the dip-slip component of these faults (i.e., we assume pure reverse slip). We experiment with a variety of fault geometries–both planar and listric–and slip rates, using a trial-and-error approach to match absolute uplift, within the constraints of the available data and informed by previous interpretations (e.g., Berryman et al., 2011; Henrys et al., 2013; Litchfield and Clark, 2015; Seebeck et al., 2022). The fault geometry is represented by one or more rectangular patches, and we assume uniform slip and Lamé parameters μ and ν of 3 × 10¹⁰ Pa and 0.25 respectively. We extend our modelled fault 100 km along strike from the marine terrace transect, in effect producing a 1D profile transect rather than a 2D map of modelled displacements. This approach is reasonable because the sites where we calculate uplift rates lie close to a line sub-perpendicular to the strike of faults of interest; it also allows us to model the possible influences of flexure and isostasy on terrace elevations, which we describe next.
One limitation of our dislocation modelling is that it does not consider a key prerequisite of permanent uplift: support of the uplifted topographic load through some combination of flexure and isostatic compensation. Both these mechanisms require that not all crustal thickening is translated to an equivalent amount of permanent uplift; they are often neglected in slip rate studies involving marine terraces (e.g., Jara-Munoz et al., 2022; Nicol et al., 2022), but we model them to avoid underestimating slip rates for our end-member models.
We model flexural isostatic responses to topographic loading by fault slip using gFlex (Wickert, 2016). We assume that the crust of the overriding Australian Plate is much weaker than that of the Pacific Plate (Watts et al., 2013), so that any flexural support is dominated by the subducting plate. We use 500 km-wide 1D flexural profiles, and assume a Young’s modulus (E) of 2 × 10¹¹ Nm−2, a Poisson’s ratio of 0.25 and a mantle density
The models presented are intended to be indicative and are based on several simplifying assumptions described above, so a perfect fit to the observed uplift rates should not be expected. Despite their simplicity, we assess the root mean square misfit of our models to available data.
For our models of slip on the Palliser-Kaiwhata Fault, we assess their fit to observations by calculating the RMS misfit between modelled and observed uplift at five sites: east of Lake Ferry, at Te Kopi, Washpool/Whatarangi, Te Humenga Point and Ngawi (Figure 2). We also model uplift at Wharekauhau, but exclude the site from our RMS misfit calculation because it lies in the immediate footwall of the Wharekauhau Thrust Fault. Footwall subsidence due to slip on that fault may influence the elevation of the terraces at Wharekauhau. Moreover, Ninis et al. (2022) highlight a likely complex history of both subsidence and uplift at this site, which is contributed to by movement on other nearby faults in addition to the Wairarapa-Wharekauhau fault system. We therefore do not use observed uplift at this site to constrain slip on the Palliser-Kaiwhata Fault.
For the Wairarapa-Wharekauhau fault system, it is harder to use terrace elevations to constrain fault slip rates as there are far fewer sites with preserved late Pleistocene marine terraces (Ninis et al., 2022); they are restricted to two broad areas: at Tongue Point, and the area around Baring Head. Marine terrace elevations at these sites are influenced by slip on the Ōhāriu Fault, and the Baring Head and East River faults, respectively, so it would be challenging to use terrace uplift to constrain the slip rate on the deeper Wairarapa-Wharekauhau fault system. Instead, our models test whether slip on the Wairarapa-Wharekauhau fault system could plausibly be responsible for uplift at Tongue Point, where in addition to the terraces being offset by the Ōhāriu Fault, the site is overall uplifted. For this test, we attempt to match the uplift rate of the MIS 5e marine terrace averaged across the fault (Ninis et al., 2022).
In order to observe temporal variations in uplift rates, it would be required that shore platforms from each of MIS 5a, 5c, 5e and 7a be preserved at every site across the Wellington south coast–this is not the case. As we are constrained by the available preservation of marine terraces, and that, the terraces at the sites used to constrain our models are of different ages (MIS 5a, 5c and 5e), in this investigation it is necessary to assume that uplift rates have been constant across the southern Hikurangi Margin since the late Pleistocene. This assumption is widespread in studies that aim to constrain uplift rates by matching terrace elevations to sea-level curves (e.g., Pedoja et al., 2006; Authemayou et al., 2017; Jara-Munoz et al., 2017; De Gelder et al., 2020), but has been challenged by Mouslopoulou et al. (2016) and McKenzie et al. (2022). We prefer the assumption of constant uplift rates to alternative approaches—such as attempting to fit uplift of an inferred MIS 5e terrace in places where there are no direct dating constraints—for two reasons. First, Mouslopoulou et al. (2016) suggest that fluctuations in uplift rate over the time period of interest (∼80–120 ka) are relatively small (a factor of 1–2 compared with an order of magnitude for shorter timescales). Second, and more importantly, if variability in uplift rates is significant, we should not be able to achieve an adequate fit between our model and observed uplift.
We run 30 different model scenarios (Table 2) to determine the possible contribution to observed uplift from slip on the Palliser-Kaiwhata Fault, and to demonstrate the effects of different parameters on the spatial distribution of modelled uplift. The parameters considered are: fault geometry (listric or planar); Te, (Section 3.5.2); Wharekauhau Thrust Fault slip rate; and regional uplift rate. Our modelled listric and planar fault geometries are provided in Table 3. The planar modelled geometry has a constant dip of 40°—based primarily on shallow seismic reflection data (Barnes et al., 1998; Seebeck et al., 2022)—from the surface to its junction with the subduction interface of Williams et al. (2013). The modelled listric geometry reflects the possibility that the dip of the Palliser-Kaiwhata Fault may become shallower at depth, and is loosely based on faults in the profiles presented by Henrys et al. (2013). We consider three different values for Te—our preferred value of 40 km and maximum and minimum likely values of 100 km and 15 km, respectively. The regional uplift rate parameter is designed to represent long-wavelength uplift due to processes such as subduction of the buoyant Hikurangi Plateau and the subduction interface earthquake cycle, and is applied as a spatially-uniform uplift across our whole modelled profile. Finally, the Wharekauhau Thrust Fault slip rate parameter is included to demonstrate the possible effect of slip on this structure on uplift further east; for some models we impose a slip rate of 0 mm/yr, and for others we use a slip rate of 2.5 mm/yr and assume a dip of 45° from the surface to 10 km depth (Seebeck et al., 2022).
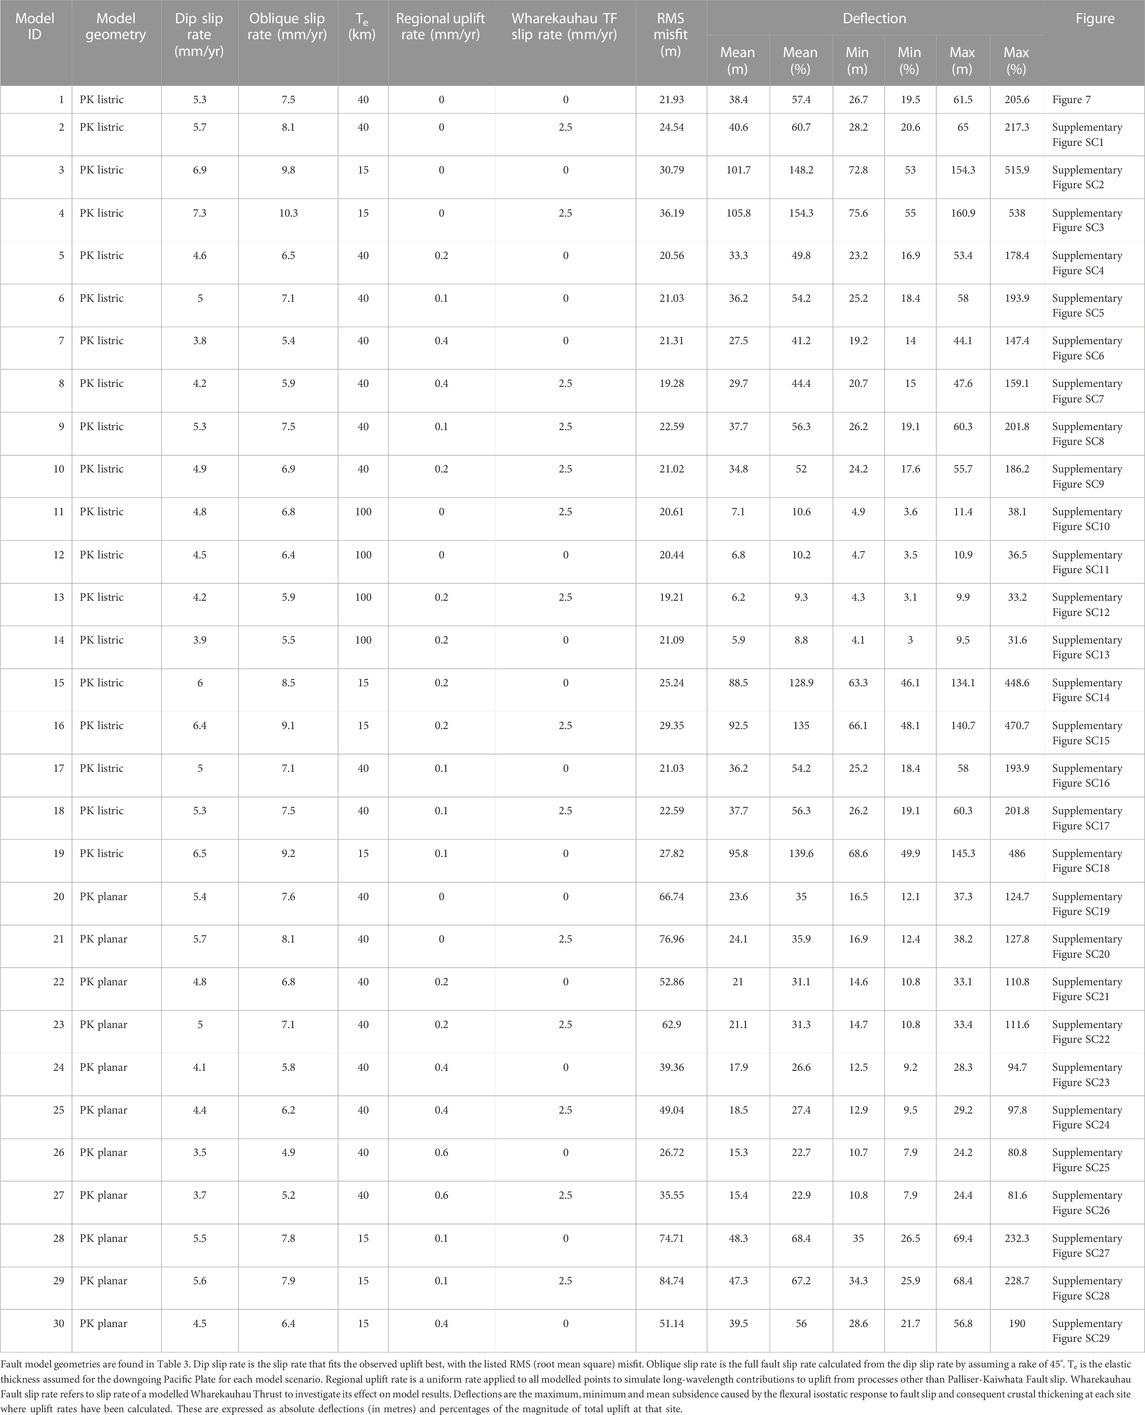
TABLE 2. Elastic dislocation model scenarios for our model of the Palliser-Kaiwhata Fault.
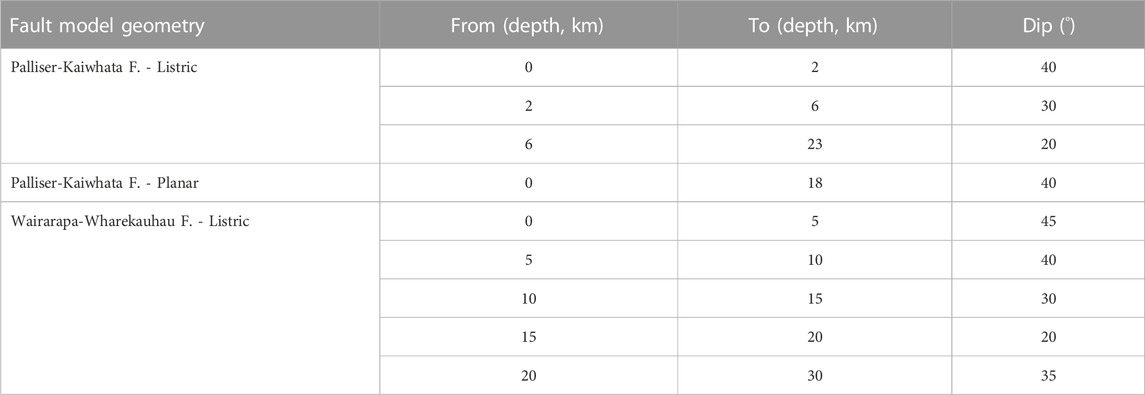
TABLE 3. Fault model geometries for the model scenarios in Table 2. Depths shown are vertically downwards from the surface.
Since the purpose of our Wairarapa-Wharekauhau fault system models is to test whether slip on that fault could contribute to uplift at Tongue Point, we run a much narrower range of models than for the Palliser-Kaiwhata Fault. We use a single listric fault model geometry (Table 3), based on that inferred for the Wairarapa Fault further north by Henrys et al. (2013). We experiment with different values for
In this section we apply the marine terrace shore platform mean planar attitudes from Ninis et al. (2022) and create profiles across each shore platform and corresponding sea cliff, in order to determine the shoreline angle elevations of the late Pleistocene terraces preserved along the Wellington south coast. We then use the reconstructed shoreline angle elevations, corrected for sea level during the relevant, formative highstand, to determine absolute tectonic uplift and calculate uplift rates. Calculations have been made for shore platforms corresponding to MIS 5a (peak age 82 ka), 5c (96 ka), 5e (123 ka) and 7a (196 ka) (Ninis et al., 2022), and are described by field site, presented west to east. Results are summarised in Figure 6 and Table 1.
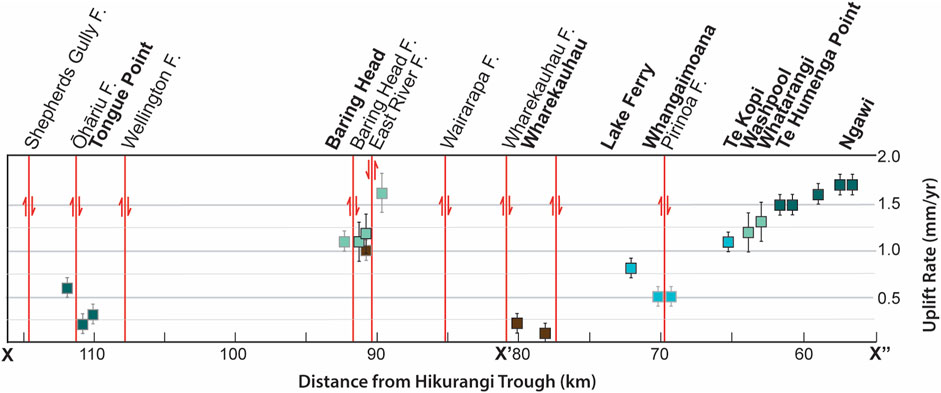
FIGURE 6. Uplift rates and associated uncertainties calculated from the shore platforms preserved along the Wellington south coast; black outline–rates determined from shoreline angle reconstructions; grey outline–minimum uplift rates calculated from shore platfrom spot elevations, where shoreline angle elevations could not be determined. The different colours denote the different aged marine terraces (coloured as in Figure 2).
There are three late Pleistocene marine terraces preserved at Tongue Point. The youngest has been inferred as MIS 5c (or possibly MIS 5a), based on its position in the terrace sequence; it is lower than the main terrace at this site, which OSL dating indicates formed during MIS 5e. One older, higher terrace is inferred to have formed during MIS 7a. The terraces are offset–uplifted on the western side–by the Ōhāriu Fault (Figure 2).
With only a few remnant stacks of the youngest late Pleistocene terrace remaining at Tongue Point, this shore platform was not expansive enough to meaningfully determine a shore platform attitude. Instead, to estimate uplift rates, we use surveyed shore platform spot elevations of 16 ± 3 m on the west of the fault, and 7 ± 3 m on the east; these yield values of 0.3 ± 0.1 mm/yr and 0.2 ± 0.1 mm/yr respectively, whether the shore platform was cut during MIS 5a or MIS 5c. These values provide a vertical slip rate across the fault of ∼0.1 mm/yr at this site since the formation of this shore platform.
The MIS 5e shore platform attitudes show that they are strongly tilted on both sides of the Ōhāriu Fault. On the western side, the shore platform is oriented 111/8.8° NE; it dips in an inland direction, in contrast to the modern-day shore platform which is near-horizontal. Ninis et al. (2022) inferred that this dip reflects localised deformation by the Ōhāriu Fault. Alternatively, this dip could be the result of an erroneously high elevation point (e.g., a preserved stack) at the coastal extent of the terrace. For this reason, a shoreline angle elevation was not reconstructed here; instead, we use a surveyed elevation at a shore platform exposure of 75 ± 3 m to calculate a minimum uplift rate of 0.6 ± 0.1 mm/yr since 123 ka. On the eastern side of the fault, the shore platform attitude was determined as 118/16.8° SW. Ninis et al. (2022) observed that elevation data here showed a bimodal distribution, with several lower elevation points occurring where the shore platform abuts the Waiariki Stream; they attributed this unusually steep apparent dip of the MIS5e shore platform here to localised tectonic tilting adjacent to the Ōhāriu Fault, possibly in combination with erosion of the bedrock by the Waiariki Stream producing a local topographic low; this latter scenario is consistent with the shore platform here being repeatedly downthrown and exposed to river and marine erosion. To constrain uplift for this east side of the fault, we use a shore platform elevation surveyed near to the fault, of 27.0 ± 3 m, to yield a minimum uplift rate of 0.2 ± 0.1 mm/yr; further from the eastern side of the fault, where a shore platform elevation is 48.0 ± 3 m, uplift is calculated at 0.3 ± 0.1 mm/yr. The difference in uplift observed between the two MIS 5e shore platforms on either side of the Ōhāriu Fault, provides a vertical slip rate of ∼0.3–0.4 mm/yr across this fault at this site. Using absolute tectonic uplift from the MIS 5e shoreline platform on the upthrown (67.3 ± 3.0 m) and downthrown (19.3 ± 3.0 m) side of the Ōhāriu Fault gives a mean uplift rate of ∼0.35 mm/yr since 123 ka.
The oldest marine terrace preserved at Tongue Point, corresponding to MIS7a, is only exposed to the east of the Ōhāriu Fault; it is buried by colluvium deposits on the western side of the fault. The corresponding shore platform is not expansive enough to determine a shoreline angle elevation. Instead, a spot elevation of 82.7 ± 3 m provides a minimum uplift rate of 0.5 ± 0.1 mm/yr on this eastern side of the Ōhāriu Fault since 196 ka.
There are six late Pleistocene terraces preserved at Baring Head; the youngest three correlate to MIS 5a, MIS 5e and MIS 7a (Figure 2) with OSL dating constraining the ages of the youngest and oldest of these. The terraces are dissected by the Baring Head Fault, the Wainuiomata River, and the East River Fault. Due to the potential tectonic deformation of the shore platforms by the two faults, shore platform orientation calculations were considered separately west of the Baring Head Fault, between the Baring Head and East River fault, and east of East River Fault.
There were too few elevation measurements to calculate a shore platform attitude and shoreline angle elevation for the inferred MIS 5e terrace preserved to the west of Baring Head Fault; we have instead used a surveyed shore platform spot elevation of 79.1 ± 3 m to calculate a minimum uplift rate of 1.1 ± 0.1 mm/yr for the last 82 ka yr. In order to quantify uplift across the Baring Head Fault, we use a shore platform elevation surveyed directly on the other side of the fault, of 66.2 ± 3 m; this yields a minimum uplift rate of 0.9 ± 0.1 mm/yr for this downthrown side of the fault. The difference between the uplift rates calculated for either side of the Baring Head Fault suggest that this structure has a vertical slip rate of ∼0.2 mm/yr at this location since 82 ka.
Between the Baring Head Fault and the East River Fault, a shore platform attitude of 136/3.0 SW was calculated for the MIS 5a terrace. Here, two profiles were constructed to determine shoreline angle elevations. Results from both profiles were consistent, providing values of 82.8 ± 4.7 m and 89.8 ± 4.7 m. From these elevations we calculate uplift rates of 1.1 ± 0.2 mm/yr and 1.2 ± 0.2 mm/yr, respectively, for the MIS 5a terrace between the Baring Head Fault and the East River Fault since 82 ka. To quantify vertical displacement across the East River Fault that offsets the MIS 5a terrace, we used a surveyed elevation measurement from either side of the fault. To the west and on the downthrown side of the fault, from a shore platform exposure at 108.5 ± 3 m, we have calculated a minimum uplift rate of 1.5 ± 0.2 mm/yr. To the east of the fault, a minimum uplift rate of 1.6 ± 0.2 mm/yr was calculated from a shore platform elevation measurement of 120.5 m ± 3; this gives a vertical slip rate on the East River Fault of ∼0.1 mm/yr for the last 82 ka. Because these uplift rates were calculated from points ∼300–350 m on either side of the fault, and in combination with the shore platform tilting to the west and the fault uplifting the eastern side, we consider this slip rate to be a maximum.
A narrow strip (∼100 m at its widest point) of the inferred MIS 5e terrace is preserved at Baring Head, between the Baring Head Fault and the East River Fault. Because this shore platform was not expansive enough to collect many elevation data points from which to calculate its attitude, we have not reconstructed a corresponding shoreline elevation. We have instead used a spot elevation surveyed directly from a shore platform exposure at the rear of the terrace, near to (<20 m from) where we anticipate the shoreline angle to be located. The elevation here is 95.8 ± 3 m, which yields a minimum uplift rate of 0.7 ± 0.1 mm/yr since 123 ka.
Similarly, the limited size of what remains of the inferred MIS 7a terrace at Baring Head, coupled with the limited elevation data available from exposures of this shore platform, did not warrant a calculation of its attitude. Instead, we use a shore platform spot elevation to the west of East River Fault of 173.6 m ± 3 m to calculate a minimum uplift rate of 1.0 ± 0.1 mm/yr at this location since 196 ka.
One terrace is preserved along the coast between Wharekauhau and Lake Onoke (Figure 2). The available OSL data, obtained from marine deposits overlying this shore platform, range in ages which correspond to all the main highstands of MIS 5 (Schermer et al., 2009), through to MIS 7a (Ninis et al., 2022); this has been interpreted by Ninis et al. (2022) to indicate that this shore platform was occupied by the sea during all of these highstands. The orientation of the shore platform along this stretch of coast has been calculated as 132/0.2° SW. Two profiles were constructed across this terrace, providing two shoreline angle elevations of 17.9 ± 3.0 m and 15.5 ± 3.0 m. These yield uplift rates of 0.2 ± 0.1 mm/yr and 0.1 ± 0.1 mm/yr, respectively, for this site since 196 ka.
The main coastal terrace preserved between Lake Ferry and Te Kopi has been identified as MIS 5c in age. The terrace is offset by ∼3 m west-side-up near Whangaimoana Beach, most likely by the coastal extension of the Pirinoa Fault, which has been mapped further inland (e.g., Begg and Johnston, 2000; Ninis et al., 2022). As such, the orientation of the shore platform and elevation of the shoreline angle were calculated separately for either side of this fault.
West of the Pirinoa Fault, the shore platform has a calculated orientation of 156/0.7° W. One profile was constructed at the western extent of this shore platform, near Lake Ferry, and the shoreline angle on this profile was located at an elevation of 61.1 ± 0.1 m. This yields an uplift rate of 0.8 ± 0.1 mm/yr since 96 ka. Close to the Pirinoa Fault, uplift rates determined from surveyed shore platform elevations of 41.1 ± 3 m on the western, upthrown side yields a minimum uplift rate of 0.5 ± 0.1 mm/yr; to the immediate east of the fault, a shore platform elevation of 39.1 ± 3 also yields a minimum uplift rate of 0.5 ± 0.1 mm/yr. Although not significantly contributing to a difference in uplift on either side of it, the Pirinoa Fault is likely responsible for the slight change in dip and dip direction of the shore platform, which to the east of the fault is 028/0.6° W. A profile constructed near Te Kopi, at the eastern end of this area, gives a shoreline angle elevation of 94.9 ± 0.4 m. This elevation yields an uplift rate of 1.1 ± 0.1 mm/yr for the last 96 ka.
The age of the main marine terrace at Washpool/Whatarangi has been constrained as MIS 5a. At the southern end of the site, a higher terrace is preserved locally along the coast; this terrace then curves inland and is preserved behind the expansive MIS 5a terrace.
The orientation of the MIS 5a shore platform at Washpool/Whatarangi has been calculated as 024/1.5 W. Two profiles were constructed at this site, with the shoreline angle elevations determined from these yielding values of 92.1 ± 0.7 m and 89.9 ± 0.7 m. These produce uplift rates of 1.3 ± 0.2 mm/yr and 1.2 ± 0.2 mm/yr, respectively, for the last 82 ka.
The higher terrace preserved along the coast at Washpool/Whatarangi has been inferred to be MIS 5e in age, based on the shore platform and terrace tread elevations, which in the field appear to be approximately consistent with those of the dated MIS 5e terrace preserved further southeast, between Te Humenga Point and Cape Palliser (Ninis et al., 2022). There were too few shore platform exposures for the MIS 5e terrace preserved locally at Washpool/Whatarangi from which to calculate a shore platform orientation and shoreline angle elevation for the inferred MIS 5e terrace preserved here. Instead, we use a surveyed shore platform elevation of 114.0 ± 3.0 m to calculate a minimum uplift rate from this terrace of 0.9 ± 0.1 mm/yr. If the inferred age for this terrace of MIS 5e is incorrect, and this terrace is instead MIS 5c in age, then the calculated uplift rate would be 1.3 ± 0.1 mm/yr, which is within error of the rates calculated from the dated MIS 5a terrace at this site.
There is one main terrace preserved between Te Humenga Point and Cape Palliser (Figure 2), which has been shown to be MIS 5e. Due to the distance over which this terrace is discontinuously preserved (∼10 km along the coast), we analysed the elevation data at Te Humenga Point and Ngawi separately, to assess whether the shore platform attitude is consistent between these locations. Where it is preserved at Te Humenga Point, the shore platform has a calculated orientation of 167/2.5 W. The calculation of the orientation of the shore platform at Ngawi yielded a similar result of 173/2.9 W.
Five shoreline angle elevations were calculated for the Te Humenga Point–Cape Palliser terrace, two from Te Humenga Point, two from Ngawi, and one profile in between (Figure 5). The two profiles constructed at Te Humenga Point give consistent shoreline angle elevations of 193.4 ± 2.0 m and 195.9 ± 2.0 m. These shoreline angle elevations yield an uplift rate of 1.5 ± 0.1 mm/yr for the last 123 ka yr at this location. At Ngawi, the two calculated shoreline angle elevations were again consistent, yielding values of 213.6 ± 8.3 m and 211.1 ± 8.3 m, providing an uplift rate of 1.7 ± 0.1 mm/yr. The profile constructed in between the Te Humenga Point and Ngawi sites provides a shoreline angle elevation of 198.3 ± 8.3 m and a corresponding uplift rate of 1.6 ± 0.1 mm/yr.
Although we estimate uplift rates due to four separate processes (slip on upper-plate faults, subduction of the buoyant Hikurangi Plateau, the subduction earthquake cycle and sediment underplating), most of the estimates are in the form of simple calculations rather than formal modelling. We therefore present only the results of our dislocation and flexural-isostatic upper-plate fault models here, leaving the estimates of uplift due to other processes until the Discussion (Section 5.2). Hereafter, discussion of uplift due to slip on upper-plate faults refers to the coupled results of our elastic dislocation and flexural-isostatic models.
Modelling of uplift from slip on upper-plate faults shows that it is possible to achieve a good fit with observed terrace uplift and uplift rates, but results exhibit a strong dependence on fault geometry. Uplift from 5.3 mm/yr of dip-slip motion on a modelled Palliser-Kaiwhata Fault with a listric geometry and assuming a
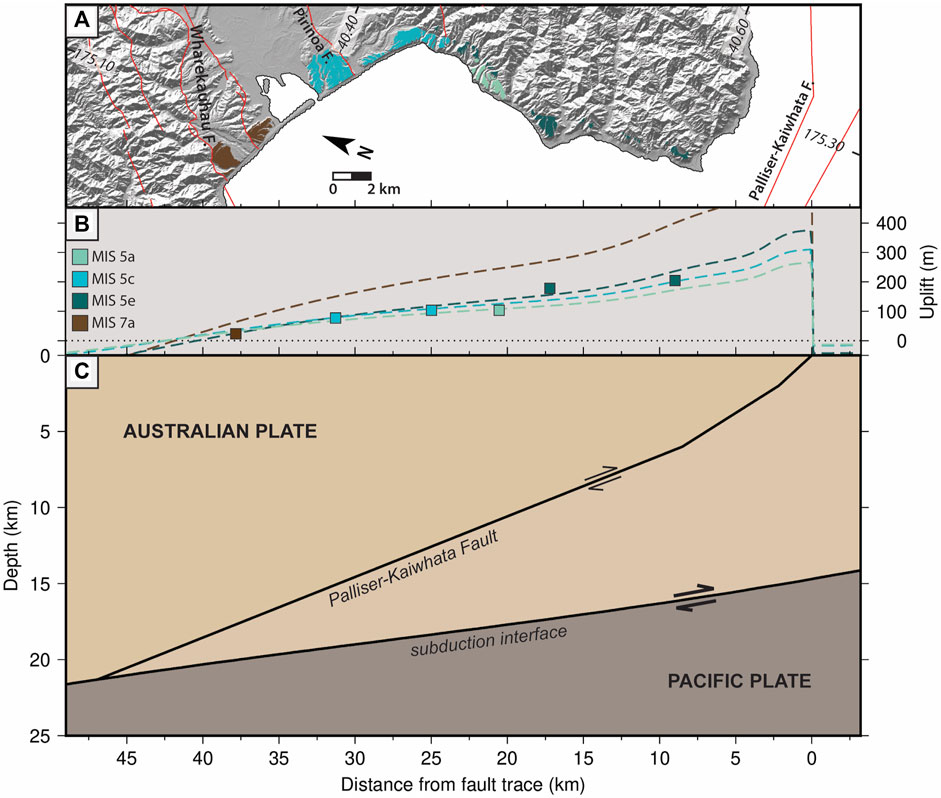
FIGURE 7. Dislocation modelling results of uplift from 5.3 mm/yr of dip-slip motion on the Palliser-Kaiwhata Fault with a listric geometry and assuming a
Models that assume a listric geometry but a
A “minimum upper-plate fault” model, with a planar Palliser-Kaiwhata Fault that dips 40° NW between the surface and 18 km matches uplift at Ngawi with 5.3 mm/yr of dip-slip motion if
Our preferred Wairarapa-Wharekauhau fault system model (Supplementary Table SD1; Figure 8) shows that it is possible for slip on that fault to drive uplift of 0.35 mm/yr at Tongue Point, across both sides of the Ōhāriu Fault. Assuming the geometry taken from Henrys et al. (2013) and a
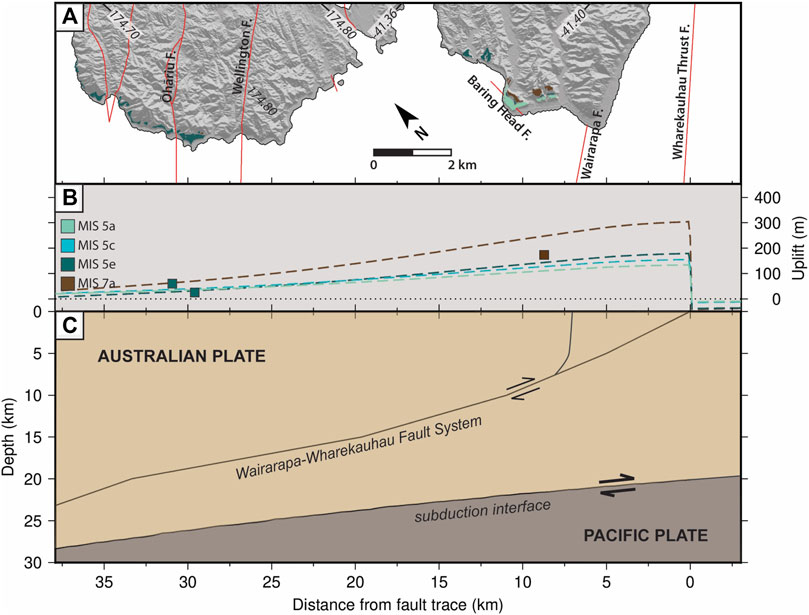
FIGURE 8. Dislocation modelling results of uplift from 2 mm/yr slip on a listric Wairarapa-Wharekauhau fault system—selected to mimic the geometry inferred by Henrys et al. (2013) further north—and assuming a Te of 40 km. The modelled fault system dips 45° W between the surface and 5 km vertical depth; 40° between 5 and 10 km depth; 30° from 10 to 15 km depth; and 20° to 20 km depth. The fault then steepens, dipping at 35° W to 30 km depth. (A) Hillshaded topography, major onshore and offshore fault zones and mapped marine terrace treads (coloured by terrace age) in the area of our modelled profile. (B) Modelled and observed uplift along the profile. Dashed lines show modelled uplift and coloured squares show observed uplift; both modelled and observed uplift are colour-coded by age. (C) Modelled fault geometry and depth to the Hikurangi Subduction interface along our profile. Note 2x vertical exaggeration.
In many of the figures showing our model results, the modelled uplift (or subsidence) is not zero at the edge of the figure. This is a consequence of our use of flexural-isostatic models, for which the subsidence in response to an imposed topographic load can be in the order of 10s or 100s of km. We include a profile showing modelled vertical motions over a much longer wavelength in the Supplementary Figure SB1 to show that modelled vertical motions do tend to zero in the far field.
Uplift rates along the Wellington south coast, between Cape Palliser and Wharekauhau, gradually decrease from east to west (Figures 6, 7, 9), despite the fact that rates have been determined from different-aged terraces. The uplift rate calculated from the MIS 5e terrace near Cape Palliser, the eastern-most preserved terrace on the Wellington south coast and the closest to the Hikurangi Trough, is 1.7 ± 0.1 mm/yr, decreasing slightly to 1.5 ± 0.1 mm/yr at Te Humenga Point. This terrace is tilted by 2.5°–2.9° towards the west. At Washpool, the uplift rate determined from the younger MIS 5a terrace preserved locally is 1.3 ± 0.2 mm/yr; this terrace is tilted less than the nearby older terraces, with a dip of 1.5° towards the west. This is consistent with what we would expect–that the older terraces, being exposed to tectonic deformation over a longer period of time, are more tilted than the younger terraces. A comparison of the degree of tilting of these two different-aged shore platforms over time provides us with a tilt rate of ∼0.02°/ka. Uplift determined from the MIS 5c terrace preserved along the coast at Te Kopi yields a rate of 1.0 ± 0.1 mm/yr; to the west near Lake Ferry, this terrace has been uplifted by 0.8 ± 0.1 mm/yr (Figure 6). Despite being older than the MIS 5a terrace preserved at Washpool, the MIS5c terrace between Te Kopi and Lake Ferry is only tilted by 0.6°–0.7° to the west. At Wharekauhau, uplift determined from the MIS 7a terrace yields a rate of 0.2 ± 0.1 mm/yr. Despite this terrace being the oldest along this length of coast, it is tilted the least, with a calculated dip of only 0.2° towards the southwest. With such a shallow dip in a direction towards the coast, it may be that this shore platform still maintains much of its original, formative gradient, despite being located near to the Wairarapa and Wharekauhau Thrust faults.
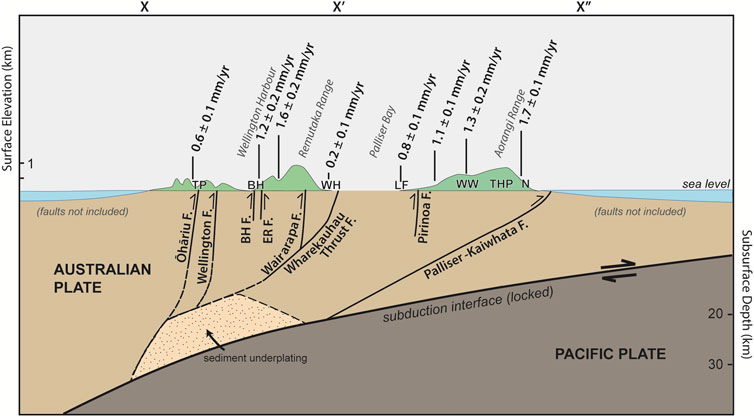
FIGURE 9. Schematic cross Section X-X′-X’’ (see Figure 2 for location of profile) across the Wellington south coast, showing representative topography (vertically exaggerated), calculated uplift rates and locations of major faults and those observed to offset the late Pleistocene marine terraces; “BH F” is Baring Head Fault, “ER F” is East River Fault. Locations from west to east: TP, Tongue Point; BH, Baring Head; WH, Wharekauhau; LF, Lake Ferry; WW, Washpool/Whatarangi; THP, Te Humenga Point; N, Ngawi. Figure modified after Little et al. (2009) and updated using subsurface data from Begg and Johnston (2000), Henrys et al. (2013), Williams et al. (2013) and this study.
Although our uplift calculations yield results similar to earlier estimates by Ghani (1974; 1978) for Cape Palliser, and are within error of his estimates at Lake Ferry, our uplift evaluation for Wharekauhau is much less than the 1.0 mm/yr reported by Ghani (1974; 1978). This is likely due to the additional three terraces Ghani (1974; 1978) allocated to this site, which Ninis et al. (2022) interpreted as a series of fan deposits that give the appearance of additional older terrace treads.
West of Palliser Bay, at a distance of ∼70–100 km from the Hikurangi Trough, marine terrace elevations are visibly influenced by upper-plate faults (Figures 6, 8, 9). Uplift rates calculated from the marine terraces preserved on either side of the Wairarapa-Wharekauhau fault system, at Wharekauhau and Baring Head (Figure 6), provide an estimate of vertical slip on this structure of ∼1.4 mm/yr. This is a minimum value; uplift quantified from sites closer to the fault system would yield an even higher uplift rate. At Baring Head, vertical offsets are also observed, albeit to a lesser extent, across the Baring Head and East River faults which cut the marine terraces. The closest late Pleistocene shore platform exposure to the west of the Wairarapa-Wharekauhau fault system, which is MIS 5a in age, yields a minimum uplift rate of 1.6 ± 0.2 mm/yr. This is higher than that estimated by Ota et al. (1981) who inferred an age of MIS 5e for this terrace, and also slightly higher than the Holocene uplift rate of ∼1.3 mm/yr estimated for this location by Begg and McSaveney (2005). The uplift rates calculated from the MIS 5a, MIS 5e and MIS 7a shore platforms where they are preserved between the Baring Head and East River faults are inconsistent across the different time periods, yielding values of 1.2 ± 0.2 mm/yr since 82 ka, 0.7 ± 0.1 mm/yr since 123 ka, and 1.0 ± 0.1 mm/yr since 196 ka. Some factors which could explain this variability include 1) alternating periods of activity and quiescence on the nearby Wairarapa Fault, much like that reported on the Wellington Fault (Robinson et al., 2011; Ninis et al., 2013), 2) a complex interaction between overall uplift at the Baring Head site due to slip on the Wairarapa Fault, and localised down-throwing as a result of slip on the Baring Head and East River faults, and 3) the competing vertical displacement processes resulting from coseismic subsidence from megathrust earthquakes (Clark et al., 2015) and possible localised uplift from sediment underplating at the subduction interface beneath this region (Henrys et al., 2013).
When comparing uplift rates calculated from either side of the Ōhāriu Fault at our westernmost field site at Tongue Point (Figure 6), it is evident that movement on this structure has vertically displaced the locally preserved marine terraces. The calculated uplift rates for the MIS 5e terrace preserved on the western, upthrown side of the Ōhāriu Fault is 0.6 ± 0.1 mm/yr, equivalent to that estimated by Ota et al. (1981). This rate is higher than that calculated from the younger terrace preserved beneath it, irrespective of whether the younger terrace formed during MIS 5a or 5c, both of which yield an uplift rate of 0.3 ± 0.1 mm/yr. On the eastern and downthrown side of the Ōhāriu Fault, the uplift rate calculated from the youngest Pleistocene terrace - 0.2 ± 0.1 mm/yr - is within error of that calculated from MIS 5e, irrespective of whether the younger terrace is MIS 5a or 5c in age. The minimum uplift rate calculated from the MIS 7a terrace on this same side of the fault is slightly higher, at 0.5 ± 0.1 mm/yr. Though the Ōhāriu Fault has vertically offset the marine terraces at Tongue Point, both sides of the fault are uplifted by a mean rate of ∼0.35 mm/yr since 123 ka. The manifestation of uplift at this site during the last ∼123 ka likely reflects a complex interaction of factors in addition to deformation by the Ōhāriu Fault, which potentially also shows alternating periods of activity and then relative quiescence. As the late Pleistocene marine terraces preserved on the downthrown sides of the faults at both Baring Head and Tongue Point have been elevated relative to sea level, some other process, or processes, must be contributing to the broader uplift across this region.
Several processes may contribute to late Pleistocene uplift of the Wellington south coast. It is likely that slip on upper-plate faults is a major contributor to uplift, and possible that Hikurangi Plateau buoyancy, the subduction earthquake cycle and sediment underplating also contribute in some areas. We here discuss the likely upper bounds on the contribution to uplift from each process, and whether the contribution of each is on the order of mm/yr, or less.
The dislocation modelling results (Figure 7; Figure 8) indicate that slip on upper-plate faults is likely a major contributor to the late Pleistocene uplift observed along the Wellington south coast. Even when making very conservative assumptions about fault geometry, slip rate and
The model of slip on the Palliser-Kaiwhata Fault (Figure 7) requires a relatively high slip rate to match observed terrace elevations. If we convert the dip-slip rate of 5.3 mm/yr required by this model to a full slip rate by assuming the best estimate of rake (135°—NZ CFM, Seebeck et al., 2022), the slip rate required by this model is 7.5 mm/yr. This is slightly higher than the 5 ± 2 mm/yr slip rate specified for the Palliser-Kaiwhata Fault in the NZ CFM (Seebeck et al., 2022). However, the reported slip rate is derived from Pleistocene marine terrace uplift (Litchfield et al., 2014) and does not account for flexural or isostatic effects, which may explain why it is slightly lower than our modelled rate. A better comparison is with the slip rate of the dextral strike-slip Boo Boo Fault to the immediate west of the Palliser-Kaiwhata Fault (Figure 2), which is well constrained at 8.3 ± 1.2 mm/yr and is not derived from terrace elevations, but rather on the measured offset of seafloor geomorphic features (Wallace et al., 2012; Seebeck et al., 2022). Despite their different orientations, both the Boo Boo and Palliser-Kaiwhata faults accommodate east-west shortening and probably have a similar horizontal azimuth of slip vector. Due to an absence of other fast-slipping faults nearby, it is likely that most of the slip rate of the Boo Boo Fault is transferred onto the Palliser-Kaiwhata Fault, in which case 7.5 mm/yr is a plausible slip rate for the Palliser-Kaiwhata Fault. If a
The slip rates above are calculated based on an assumption that processes other than slip on the Palliser-Kaiwhata Fault do not contribute to uplift along the transect of interest. If the aggregated effect of other processes—such as subduction of a buoyant Hikurangi Plateau, the subduction earthquake cycle and sediment underplating—is included in the form of a regional uplift rate, the dip-slip rate required to match terrace uplift is significantly reduced. For example, Model 7 (Table 2; Supplementary Figure SC6) includes a regional uplift rate of 0.4 mm/yr and achieves an adequate fit to observed uplift with a dip-slip of 3.8 mm/yr (oblique slip of 5.4 mm/yr). We discuss the processes that could contribute to regional uplift below, but the magnitude of their contribution to uplift remains poorly constrained, in turn making it difficult to constrain the slip rate of the Palliser-Kaiwhata Fault. In the absence of better data, we suggest that the NZ CFM slip rate could be adjusted to 6 +3/−2 mm/yr to reflect these uncertainties and the results of our modelling.
For our modelled Wairarapa-Wharekauhau fault system, independent of the value we assume for Te, a dip-slip rate of 2 mm/yr is required to match the observed uplift rate at Tongue Point of 0.35 mm/yr since ∼123 ka; this is consistent with the 2.5 ± 1 mm/yr dip-slip quoted for this fault in the NZ CFM. We note that although our modelled listric geometry is based on the interpretation of Henrys et al. (2013), theirs is not the only geometry consistent with available data. Based on our modelling, it is plausible that slip on this fault system could uplift both sides of the Ōhāriu Fault. This accords with observations from the 1855 Mw 8.2 Wairarapa earthquake (Darby and Beanland, 1992), where uplift at Tongue Point was documented at between 0.3 m and <2 m, and suggests that the previous inference of rupture on the subduction interface at depth during this earthquake is not required to explain the co-seismic uplift at Tongue Point.
Subduction of the buoyant crust of the Hikurangi Plateau has previously been suggested as a significant contributor to uplift across the southern North Island (Litchfield et al., 2007). We here estimate a maximum value for the isostatic component of this contribution. The subducted crust of the plateau appears to thicken from 9.5–10 km beneath the Wanganui Basin (Tozer et al., 2017) to ∼12 km at the Hikurangi Trough (Herath et al., 2020). To account for the uncertainties in these estimates, we assume a maximum of 4 km (linear) increase in thickness over the ∼150 km between the Wanganui Basin and the trough, so that the thickness of the plateau increases by ∼27 m every kilometre towards the trough. If we assume a dip-slip rate for the subduction interface of 30 mm/yr (a likely maximum based on results from Wallace et al., 2012) and ignore the dip of the subduction interface (assuming a dip of 0° instead of 20° affects results by <5%), it follows that beneath the southern North Island, the rate of thickening of the subducting Hikurangi Plateau is ∼0.8 mm/yr at any given locality. We assume that the thicker crust is supported isostatically, because the ∼500–1,000 km width of the Hikurangi Plateau is too long for flexural support by the upper mantle to be significant. Assuming Airy isostasy, a density of plateau crust
The maximum uplift rate above is lower than the uplift rates associated with subduction of the Hikurangi Plateau modelled by Litchfield et al. (2007), who estimated rates lower than 1 mm/yr but often ≳0.4 mm/yr. There are at least two reasons for this difference. First, their study (which covered the whole Hikurangi Margin) used a convergence rate of 45 mm/yr to calculate uplift rates, while we used a value of 30 mm/yr that is more appropriate for our study area. Second, the two models implicitly include different processes; the Litchfield et al. (2007) estimate includes secondary processes, such as upper-plate faulting and sedimentary underplating, which we explicitly treat as separate contributors to uplift in this study.
It is widely suggested that some part of the subduction interface earthquake cycle may cause permanent vertical deformation of the overriding plate and thereby contribute to marine terrace uplift (e.g., Briggs et al., 2008; Wesson et al., 2015; Melnick, 2016; Jolivet et al., 2020). However, a significant proportion of any coseismic uplift is typically recovered by subsidence during the interseismic period (Figure 3), like that currently observed in our study area (Hamling et al., 2022). The net uplift associated with each earthquake cycle is therefore expected to be significantly less than coseismic and/or postseismic uplift during that cycle. In Sumatra, Briggs et al. (2008) estimated that <4% of coseismic uplift was preserved permanently. In Chile, Wesson et al. (2015) suggested that 10%–20% of uplift over a seismic cycle is preserved in the long term. Here, we estimate maximum long-term uplift rates due to subduction earthquakes at two sites, to determine whether the behaviour of the Hikurangi Margin is similar to those other subduction zones.
Tongue Point is the most suitable site from which to estimate uplift due to the subduction interface earthquake cycle, because although the terraces preserved there are offset by slip on the Ōhāriu Fault, both sides of the fault have been uplifted, presumably from some combination of slip on other upper-plate faults, subduction of the buoyant Hikurangi Plateau, permanent deformation due to subduction earthquakes, and sediment underplating. There is no clear evidence for any processes that promote long-term subsidence in this region; consequently, we can estimate a maximum subduction earthquake contribution to the observed ∼0.35 mm/yr uplift at Tongue Point by neglecting all drivers other than subduction earthquakes. Note that this value is clearly a maximum because it neglects the possible contribution of slip on the Wairarapa-Wharekauhau fault system, which could plausibly explain all of this uplift.
To estimate the vertical component of slip on the subduction interface, we assume a margin-normal rate of ∼25 mm/yr (Wallace et al., 2012) and a change in dip immediately beneath Tongue Point to 15° (Williams et al., 2013); using these values gives a vertical slip rate of 6.5 mm/yr. More details of our modelling strategy (which involves simple geometric calculations rather than elastic dislocation models) are found in the Supplementary Section SB. Our calculated maximum uplift rate contribution from subduction earthquakes of ∼0.35 mm/yr is 5.4% of this, indicating that the vast majority of coseismic uplift is recovered interseismically. We note that our value of 6.5 mm/yr for the vertical component of slip on the subduction interface is probably an overestimate, since it comprises the total of footwall subsidence and hanging-wall uplift during subduction earthquakes. However, hanging-wall uplift will be at least twice as great as footwall subsidence. Conservatively, we conclude that at Tongue Point, <10% of coseismic and postseismic uplift associated with subduction earthquakes is preserved as permanent uplift. This percentage is similar to those calculated from Sumatra and Chile (Briggs et al., 2008; Wesson et al., 2015), suggesting that buoyancy of the Hikurangi Plateau does not necessarily enhance uplift due to subduction earthquakes.
It is possible to perform a similar calculation at Wharekauhau, where we infer an uplift rate of 0.16 mm/yr over the past 196 ka. If this uplift rate is assumed to be entirely due to subduction earthquakes, it would equate to 4.6% of the vertical component of slip on the subduction interface (again assuming a dip-slip rate of 25 mm/yr, but a dip of 8° for the subduction interface beneath Wharekauhau). However, this percentage is a less reliable maximum than at Tongue Point; Wharekauhau lies in the immediate footwall of the Wharekauhau Thrust Fault, so that footwall subsidence may counteract long-term uplift due to subduction earthquakes and other processes. Nevertheless, based on our dislocation modelling, we suggest that any footwall subsidence is almost certainly less than 0.4 mm/yr. An uplift rate due to subduction earthquakes at Wharekauhau of 0.56 mm/yr—0.4 mm/yr to counteract footwall subsidence and 0.16 mm/yr of long-term uplift—would equate to permanent preservation of ∼16% of vertical displacement due to subduction earthquakes.
The calculations presented above do not discount subduction earthquakes as a significant contributor to late Pleistocene uplift (up to ∼0.35 mm/yr maximum at Tongue Point), although equally subduction earthquakes are not required to explain observed terrace uplift. However, if <10% of uplift due to subduction earthquakes is permanent, there are important implications for Holocene marine terrace formation as a recorder of past subduction earthquakes. For example, for a subduction earthquake that caused 2 m of combined coseismic and postseismic uplift, less than 0.2 m of that uplift would be preserved permanently. In some settings, this small amount of permanent uplift might be insufficient to form a distinct Holocene marine terrace, reducing the likelihood of a complete subduction earthquake record.
If sediment underplating is treated as a wholly separate process from upper-plate faulting, the same arguments apply to its contribution to uplift as for permanent deformation associated with subduction earthquakes. The maximum uplift rate due to sediment underplating at Tongue Point—estimated by neglecting uplift due to other processes—would be ∼0.4 mm/yr and potentially much lower. Since slip on the Wharekauhau Thrust Fault can explain uplift at Baring Head, significant uplift due to underplating would not be required there either. However, the inferred Wairarapa Fault geometry of Henrys et al. (2013) intersects with their region of inferred underplating at depth. If some (presently unknown) processes links underplating at depth with slip on the Wairarapa Fault, then it may not be appropriate to consider underplating and slip on upper-plate faults as separate processes. Better constraints on fault geometry and more detailed modelling than we present here are required to explore the relative roles of sediment underplating and upper-plate fault slip. We note that episodes of sediment underplating may occur over longer timescales than the ∼200 kyr considered here (e.g., Mouslopoulou et al., 2016), but underplating may nevertheless contribute to uplift over our timescale of interest.
During our modelling of slip on the Palliser-Kaiwhata Fault (Figure 7; Table 2 and Supplementary Sections SC, SD), we attempted to fit observed uplift by varying fault slip rate, making different assumptions about elastic thickness Te. An acceptable fit to the data was achieved for Te values of 100, 40 and 15 km, but the slip rate required to match uplift was much higher for lower (but plausible) Te values. This result is unsurprising, since a lower Te means less flexural support of topography, with more fault slip required to uplift a terrace to the observed elevations. For the example of an otherwise identical pair of models, the dip-slip rate required to match observed uplift assuming our preferred Te of 40 km (5.3 mm/yr; Model 1, Figure 7) is 18% greater than when a very high Te of 100 km is assumed (4.5 mm/yr for Model 12, Supplementary Figure SC11). The magnitude of the difference varies depending on model parameters such as regional uplift rate, but the required slip rate is typically ∼15–25% higher if Te is 40 km than if Te is 100 km. This effect is important because flexural-isostatic effects are sometimes neglected in studies that use terrace uplift to constrain fault slip rates (e.g., Jara-Muñoz et al., 2022; Nicol et al., 2022). We acknowledge that it is often difficult to constrain Te, but recommend that future studies consider the possible impact of flexural-isostatic compensation on their estimated slip rates and adjust their uncertainties where appropriate.
We have used shore platform elevation data and corresponding attitudes to reconstruct the otherwise buried shoreline angle elevations for the late Pleistocene marine terraces along the Wellington south coast, North Island New Zealand. Together with the age of formation of these shore platforms, uplift rates have been calculated across this region–at the southern Hikurangi subduction margin–since the late Pleistocene. In general, uplift rates are highest closest to the Hikurangi Trough, with 1.7 ± 0.1 mm/yr observed at the easternmost preserved terraces, near Cape Palliser, ∼50 km from the trough. Uplift rates decreases steadily along the Palliser Bay coast to 0.2 ± 0.1 mm/yr at Wharekauhau, ∼70 km from the trough. Further from the Hikurangi Trough, at distances >70 km, uplift rates increase again at Baring Head, on the upfaulted side of the Wairarapa-Wharekauhau fault system, to between 0.7 ± 0.1 and 1.6 ± 0.2 mm/yr. At Tongue Point, west of Wellington, uplift rates across the Ōhāriu Fault are 0.2 ± 0.1 mm/yr (downthown side) and 0.6 ± 0.1 mm/yr (upthrown side) for the MIS 5e shore platform preserved there. The abrupt increases in uplift rates across the major upper-plate faults suggest that movement on these structures is a major contributor to tectonic uplift across this region. Dislocation and flexural-isostatic modelling shows that slip on faults within the overriding plate—specifically the Palliser-Kaiwhata Fault and the Wairarapa-Wharekauhau fault system—may dominate uplift in their immediate hanging walls. Depending on their slip rate and geometry, slip on these two upper-plate fault systems could plausibly cause >80% of late Pleistocene uplift along the entire length of the south coast of North Island; for example, at Tongue Point, uplift of both sides of the Ōhāriu Fault by ∼0.35 mm/yr may be due to slip on the Wairarapa-Wharekauhau Fault System. Our modelling shows that subduction of the buoyant Hikurangi Plateau contributes uplift of 0.16 mm/yr which is broadly consistent with previous estimates. Earthquakes on the subduction interface probably contribute ≤0.4 mm/yr of late Pleistocene uplift, with ≤10% of uplift due to each earthquake being stored permanently, similar to other subduction zones. Uplift rates due to sediment underplating at Tongue Point and Wharekauhau are likely ≤0.4 mm/yr but could be significantly lower. These results highlight the complex processes driving uplift in subduction settings, and demonstrate the important contribution upper-plate faults can make to such uplift.
The original contributions presented in the study are included in the article/Supplementary Material, further inquiries can be directed to the corresponding author.
DN, TL, and NL conceptualised the investigation and successfully applied for funding. DN undertook the strandline elevation reconstructions and uplift rate analysis, drafted the manuscript and produced figures. AH undertook the elastic dislocation modelling, produced associated text and figures and reviewed the manuscript. TL and NL supervised this investigation (DN’s PhD), and contributed to, and edited the manuscript.
Earthquake Commission (EQC) Grant No. 09/U576.
The authors would like to thank Brad Pillans, John Begg and Tim Stern for helpful comments on an earlier version of this manuscript. We are grateful to our reviewers - Julius Jara-Muñoz for his constructive suggestions and Vasiliki Mouslopoulou for her feedback. Sincere thanks to our Handling Editor–Marco Meschis–for his guidance during the submission process. We appreciate the feedback of Camilla Penney on the modelling in this study. DN, TL, and NL would like to thank the Earthquake Commission for funding (Grant No. 09/U576) to undertake this investigation. NL and AH were supported by the New Zealand Ministry of Business, Innovation and Employment (MBIE) through the Te Riu a Maui Understanding Zealandia programme (Strategic Science Investment Fund, contract C05X1702), as well as the It’s Our Fault Programme, funded by Toka Tū Ake EQC, Wellington City Council and the Wellington Regional Emergency Management Organisation.
The authors declare that the research was conducted in the absence of any commercial or financial relationships that could be construed as a potential conflict of interest.
All claims expressed in this article are solely those of the authors and do not necessarily represent those of their affiliated organizations, or those of the publisher, the editors and the reviewers. Any product that may be evaluated in this article, or claim that may be made by its manufacturer, is not guaranteed or endorsed by the publisher.
The Supplementary Material for this article can be found online at: https://www.frontiersin.org/articles/10.3389/feart.2023.1028445/full#supplementary-material
Anderson, R. S., and Menking, K. M. (1994). The quaternary marine terraces of santa cruz, California: Evidence for coseismic uplift on two faults. Geol. Soc. Am. Bull. 106, 649–664. doi:10.1130/0016-7606(1994)106<0649:tqmtos>2.3.co;2
Authemayou, C., Pedoja, K., Heddar, A., Molliex, S., Boudiaf, A., Ghaleb, B., et al. (2017). Coastal uplift west of algiers (Algeria): Pre-and post-messinian sequences of marine terraces and rasas and their associated drainage pattern. Int. J. Earth Sci. 106 (1), 19–41. doi:10.1007/s00531-016-1292-5
Bard, E., Antonioli, F., and Silenzi, S. (2002). Sea-level during the penultimate interglacial period based on a submerged stalagmite from Argentarola Cave (Italy). Earth Planet. Sci. Lett. 196 (3), 135–146. doi:10.1016/s0012-821x(01)00600-8
Barnes, P. M. (2009). Postglacial (after 20 ka) dextral slip rate of the offshore Alpine fault, New Zealand. Geology 37 (1), 3–6.
Barnes, P. M., and Audru, J. C. (1999). Quaternary faulting in the offshore flaxbourne and Wairarapa basins, southern cook strait, New Zealand. New zeal. J. Geol. geophys. 42 (3), 349–367. doi:10.1080/00288306.1999.9514851
Barnes, P. M., Lamarche, G., Bialas, J., Henrys, S., Pecher, I., Netzeband, G. L., et al. (2010). Tectonic and geological framework for gas hydrates and cold seeps on the Hikurangi subduction margin, New Zealand. Mar. Geol. 272 (1–4), 26–48.
Barnes, P. M., Mercier de Lepinay, B., Collot, J-Y., Delteil, J., and Audru, J-C. (1998). Strain partitioning in the transition area between oblique subduction and continental collision, Hikurangi margin, New Zealand. Tectonics 17, 534–557. doi:10.1029/98tc00974
Barnes, P. M., and Mercier de Lepinay, B. (1997). Rates and mechanics of rapid frontal accretion along the very obliquely convergent southern Hikurangi margin, New Zealand. J. Geophys. Res. 102 (B11), 24931–24952. doi:10.1029/97jb01384
Barnes, P. M., Nodder, S. D., Woelz, S., and Orpin, A. R. (2019). The structure and seismic potential of the Aotea and Evans Bay faults, Wellington, New Zealand. J. Geol. 62 (1), 46–71.
Beavan, J., and Darby, D. (2005). “Fault slip in the 1855 Wairarapa earthquake, based on new and reassessed vertical motion observations: Did slip occur on the subduction interface?,” in The 1855 Wairarapa earthquake symposium — proceedings volume (Wellington: Greater Wellington Regional Council Publication Number: GW/RINV-T-05/205). ISBN: 0-909016-87-9.
Beavan, R. J., and Litchfield, N. J. (2012). Vertical land movement around the New Zealand coastline: Implications for seasea-level rise, 41. GNS Science Report 2012/29 https://shop.gns.cri.nz/sr_2012-029-pdf/.
Begg, J., and McSaveney, M. J. (2005). “Wairarapa Fault rupture – vertical deformation in 1855 and a history of similar events from Turakirae Head,” in The 1855 Wairarapa earthquake symposium — proceedings volume. Greater Wellington regional Council publication number: GW/RINV-T-05/205. ISBN: 0-909016-87-9.
Begg, J. G., and Johnston, M. R. (2000). Geology of the Wellington area. 1: 250 000 geological map 10. Lower Hutt, New Zealand: Institute of Geological and Nuclear Sciences.
Begg, J. G., and Mazengarb, C. (1996). Geology of the Wellington area. 1: 50,000 geological map 22. Lower Hutt: Institute of Geological and Nuclear Sciences.
Berryman, K. (1993a). Age, height, and deformation of Holocene marine terraces at Mahia Peninsula, Hikurangi subduction margin, New Zealand. Tectonics 12 (6), 1347–1364. doi:10.1029/93tc01542
Berryman, K. R. (1993b). Distribution, age, and deformation of late Pleistocene marine terraces at Mahia Peninsula, Hikurangi subduction margin, New Zealand. Tectonics 12 (6), 1365–1379. doi:10.1029/93tc01543
Berryman, K., Ota, Y., Miyauchi, T., Hull, A., Clark, K., Ishibashi, K., et al. (2011). Holocene paleoseismic history of upper-plate faults in the southern Hikurangi subduction margin, New Zealand, deduced from marine terrace records. Bull. Seismol. Soc. Am. 101 (5), 2064–2087. doi:10.1785/0120100282
Berryman, K. R., Ota, Y., and Hull, A. G. (1989). Holocene paleoseismicity in the fold and thrust belt of the Hikurangi subduction zone, eastern North Island, New Zealand. Tectonophysics 163, 185–195. doi:10.1016/0040-1951(89)90256-4
Bookhagen, B., Echtler, H. P., Melnick, D., Strecker, M. R., and Spencer, J. Q. G. (2006). Using uplifted Holocene beach berms for paleoseismic analysis on the Santa María Island, south-central Chile. Geophys. Res. Lett. 33 (15), L15302. doi:10.1029/2006GL026734
Bradley, W. C., and Griggs, G. B. (1976). Form, Genesis, and deformation of central California wave-cut platforms. Geol. Soc. Am. Bull. 87 (3), 433–449. doi:10.1130/0016-7606(1976)87<433:fgadoc>2.0.co;2
Brideau, M-A., Massey, C. I., Carey, J. M., and Lyndsell, B. (2022). Geomechanical characterisation of discontinuous greywacke from the Wellington region based on laboratory testing. New zeal. J. Geol. geophys. 65 (2), 265–282. doi:10.1080/00288306.2020.1853181
Briggs, R. W., Sieh, K., Amidon, W. H., Galetzka, J., Prayudi, D., Suprihanto, I., et al. (2008). Persistent elastic behavior above a megathrust rupture patch: Nias island, West Sumatra. J. Geophys. Res. 113 (B12), B12406. doi:10.1029/2008JB005684
Briggs, R. W., Sieh, K., Meltzner, A. J., Natawidjaja, D., Galetzka, J., Suwargadi, B., et al. (2006). Deformation and slip along the Sunda megathrust in the great 2005 Nias-Simeulue earthquake. Science 311 (5769), 1897–1901. doi:10.1126/science.1122602
Carver, G. A., Jayko, A. S., Valentine, D. W., and Li, W. H. (1994). Coastal uplift associated with the 1992 Cape Mendocino earthquake, northern California. Geology 22 (3), 195–198. doi:10.1130/0091-7613(1994)022<0195:cuawtc>2.3.co;2
Chappell, J. (1974). Geology of coral terraces, Huon Peninsula, new Guinea: A study of quaternary tectonic movements and sea-level changes. Geol. Soc. Am. Bull. 85 (4), 553–570. doi:10.1130/0016-7606(1974)85<553:gocthp>2.0.co;2
Chappell, J., Omura, A., Esat, T., McCulloch, M., Pandolfi, J., Ota, Y., et al. (1996). Reconciliaion of late Quaternary sea levels derived from coral terraces at Huon Peninsula with deep sea oxygen isotope records. Earth Planet. Sci. Lett. 141 (1-4), 227–236. doi:10.1016/0012-821x(96)00062-3
Chappell, J. (2002). Sea level changes forced ice breakouts in the last glacial cycle: New results from coral terraces. Quat. Sci. Rev. 21 (10), 1229–1240. doi:10.1016/s0277-3791(01)00141-x
Clark, K., Howarth, J., Litchfield, N., Cochran, U., Turnbull, J., Dowling, L., et al. (2019). Geological evidence for past large earthquakes and tsunamis along the Hikurangi subduction margin, New Zealand. Mar. Geol. 412, 139–172. doi:10.1016/j.margeo.2019.03.004
Clark, K. J., Hayward, B. W., Cochran, U. A., Grenfell, H. R., Hemphill–Haley, E., Mildenhall, D. C., et al. (2011). Investigating subduction earthquake geology along the southern Hikurangi margin using palaeoenvironmental histories of intertidal inlets. New zeal. J. Geol. geophys. 54 (3), 255–271. doi:10.1080/00288306.2011.562903
Clark, K. J., Hayward, B. W., Cochran, U. A., Wallace, L. M., Power, W. L., and Sabaa, A. T. (2015). Evidence for past subduction earthquakes at a plate boundary with widespread upper plate faulting: Southern Hikurangi margin, New Zealand. Bull. Seismol. Soc. Am. 105, 1661–1690. doi:10.1785/0120140291
Clark, K. J., Nissen, E. K., Howarth, J. D., Hamling, I. J., Mountjoy, J. J., Ries, W. F., et al. (2017). Highly variable coastal deformation in the 2016 MW7.8 Kaikōura earthquake reflects rupture complexity along a transpressional plate boundary. Earth Planet. Sci. Lett. 474, 334–344. doi:10.1016/j.epsl.2017.06.048
Clement, A. J., Whitehouse, P. L., and Sloss, C. R. (2016). An examination of spatial variability in the timing and magnitude of Holocene relative sea-level changes in the New Zealand archipelago. Quat. Sci. Rev. 131, 73–101. doi:10.1016/j.quascirev.2015.09.025
Cochran, U., Hannah, M., Harper, M., Van Dissen, R., Berryman, K., and Begg, J. (2007). Detection of large, Holocene earthquakes using diatom analysis of coastal sedimentary sequences, Wellington, New Zealand. Quat. Sci. Rev. 26 (7), 1129–1147. doi:10.1016/j.quascirev.2007.01.008
Cohen, S. C., and Darby, D. J. (2003). Tectonic plate coupling and elastic thickness derived from the inversion of a steady state viscoelastic model using geodetic data: Application to southern North Island, New Zealand. J. Geophys. Res. 108 (B3), 2164. doi:10.1029/2001JB001687
Creveling, J. R., Mitrovica, J. X., Clark, P. U., Waelbroeck, C., and Pico, T. (2017). Predicted bounds on peak global mean sea level during marine isotope stages 5a and 5c. Quat. Sci. Rev. 163, 193–208. doi:10.1016/j.quascirev.2017.03.003
Darby, D., and Beavan, J. (2001). Evidence from GPS measurements for contemporary interplate coupling on the southern Hikurangi subduction thrust and for partitioning of strain in the upper plate. J. Geophys. Res. 106 (12), 30881–30891. doi:10.1029/2000jb000023
Darby, D. J., and Beanland, S. (1992). Possible source models for the 1855 Wairarapa earthquake, New Zealand. J. Geophys. Res. 97 (B9), 12375–12389. doi:10.1029/92jb00567
Davy, B., and Wood, R. (1994). Gravity and magnetic modelling of the Hikurangi Plateau. Mar. Geol. 118 (1-2), 139–151. doi:10.1016/0025-3227(94)90117-1
De Gelder, G., Jara-Muñoz, J., Melnick, D., Fernández-Blanco, D., Rouby, H., Pedoja, K., et al. (2020). How do sea-level curves influence modeled marine terrace sequences? Quat. Sci. Rev. 229, 106132. doi:10.1016/j.quascirev.2019.106132
DeMets, C., Gordon, R. G., and Argus, D. F. (2010). Geologically current plate motions. Geophys. J. Int. 181 (1), 1–80. doi:10.1111/j.1365-246x.2009.04491.x
DeMets, C., Gordon, R. G., Argus, D. F., and Stein, S. (1990). Current plate motions. Geophys. J. Int. 101, 425–478. doi:10.1111/j.1365-246x.1990.tb06579.x
DeMets, C., Gordon, R. G., Argus, D. F., and Stein, S. (1994). Effect of recent revisions to the geomagnetic reversal time scale on estimates of current plate motions. Geophys. Res. Lett. 21, 2191–2194. doi:10.1029/94gl02118
Downes, G. L. (2005). “The 1855 January 23 M8+ Wairarapa Earthquake – what contemporary accounts tell us about it,” in The 1855 Wairarapa earthquake symposium — proceedings volume (Wellington: Greater Wellington Regional Council Publication Number: GW/RINV-T-05/205). ISBN: 0-909016-87-9.
Duffy, B. (2020). A geometric model to estimate slip rates from terrace rotation above an offshore, listric thrust fault, Kaikōura, New Zealand. Tectonophysics 786, 228460. doi:10.1016/j.tecto.2020.228460
Dumas, J. A., Flato, G. M., and Brown, R. D. (2006). Future projections of landfast ice thickness and duration in the Canadian Arctic. J. Clim. 19 (20), 5175–5189. doi:10.1175/jcli3889.1
Dutton, A., and Lambeck, K. (2012). Ice volume and sea level during the last interglacial. Science 337 (6091), 216–219. doi:10.1126/science.1205749
Evanzia, D., Lamb, S., Savage, M. K., and Stern, T. (2019). Illumination of deformation by bending stresses and slab pull within the southern Hikurangi double benioff zone. New zeal. J. Geol. geophys. 62 (1), 111–120. doi:10.1080/00288306.2018.1532439
Furlong, K. P., and Herman, M. (2017). Reconciling the deformational dichotomy of the 2016 Mw 7.8 Kaikoura New Zealand earthquake. Geophys. Res. Lett. 44 (13), 6788–6791. doi:10.1080/00288306.2018.1532439
Gardner, T. (2011). “Late Holocene deformation, fold, growth and the seismic cycle, Kaikōura peninsular, South Island, New Zealand,” in GSA annual meeting in minneapolis.
Ghani, M. A. (1978). Late Cenozoic vertical crustal movements in the southern North Island, New Zealand. New zeal. J. Geol. geophys. 21 (1), 117–125. doi:10.1080/00288306.1978.10420728
Ghani, M. A. (1974). Late Cenozoic vertical crustal movements in the southern North Island, New Zealand. Dissertation thesis. Wellington, New Zealand: Victoria University of Wellington.
Gibb, J. G. (1986). “A New Zealand regional Holocene eustatic sea-level curve and its application to determination of vertical tectonic movements,” in Recent Crustal Movements of the Pacific Region. Editors W. I. Reilly, and B. E. Harford 24, 377–395.
Grant, K. M., Rohling, E. J., Bar-Matthews, M., Ayalon, A., Medina-Elizalde, M., Ramsey, C. B., et al. (2012). Rapid coupling between ice volume and polar temperature over the past 150,000 years. Nature 491 (7426), 744–747. doi:10.1038/nature11593
Grant, K. M., Rohling, E. J., Ramsey, C. B., Cheng, H., Edwards, R. L., Florindo, F., et al. (2014). Sea-level variability over five glacial cycles. Nat. Comm. 5, 5076. doi:10.1038/ncomms6076
Grantz, A., Plafker, G., and Kachadoorian, R. (1964). Alaska's good friday earthquake, march 27, 1964: A preliminary geologic evaluation, 491. Washington, D.C., United States: US Department of the Interior, Geological Survey.
Hamling, I. J., Hreinsdóttir, S., Clark, K., Elliott, J., Liang, C., Fielding, E., et al. (2017). Complex multifault rupture during the 2016 Mw 7.8 Kaikōura earthquake, New Zealand. Science 356 (6334), eaam7194. doi:10.1126/science.aam7194
Hamling, I. J., Wright, T. J., Hreinsdóttir, S., and Wallace, L. M. (2022). A snapshot of New Zealand's dynamic deformation field from Envisat InSAR and GNSS observations between 2003 and 2011. Geophys. Res. Lett. 49 (2), e2021GL096465. doi:10.1029/2021gl096465
Henrys, S., Wech, A., Sutherland, R., Stern, T., Savage, M., Sato, H., et al. (2013). SAHKE geophysical transect reveals crustal and subduction zone structure at the southern Hikurangi margin, New Zealand. Geochem. Geophys. Geosyst. 14 (7), 2063–2083. doi:10.1002/ggge.20136
Herath, P., Stern, T. A., Savage, M. K., Bassett, D., Henrys, S., and Boulton, C. (2020). Hydration of the crust and upper mantle of the Hikurangi Plateau as it subducts at the southern Hikurangi margin. Earth Planet. Sci. Lett. 541, 116271. doi:10.1016/j.epsl.2020.116271
Houlié, N., and Stern, T. A. (2017). Vertical tectonics at an active continental margin. Earth Planet. Sci. Lett. 457, 292–301. doi:10.1016/j.epsl.2016.10.018
Howell, A., and Clark, K. J. (2022). Late Holocene coseismic uplift of the Kaikōura coast, New Zealand. Geosphere 18 (3), 1104–1137. doi:10.1130/ges02479.1
Hull, A. G. (1990). Tectonics of the 1931 Hawke’s Bay earthquake. New zeal. J. Geol. geophys. 33, 309–320. doi:10.1080/00288306.1990.10425689
Jara-Muñoz, J., Melnick, D., Li, S., Socquet, A., Cortés-Aranda, J., Brill, D., et al. (2022). The cryptic seismic potential of the Pichilemu blind fault in Chile revealed by off-fault geomorphology. Nat. Comm. 13, 3371. doi:10.1038/s41467-022-30754-1
Jara-Muñoz, J., Melnick, D., Pedoja, K., and Strecker, M. R. (2019). TerraceM-2: A Matlab® interface for mapping and modeling marine and lacustrine terraces. Front. Earth Sci. 7, 1–18. doi:10.3389/feart.2019.00255
Jara-Muñoz, J., Melnick, D., and Strecker, M. R. (2016). TerraceM: A MATLAB® tool to analyze marine and lacustrine terraces using high-resolution topography. Geosphere 12, 176–195. doi:10.1130/ges01208.1
Jara-Muñoz, J., Melnick, D., Zambrano, P., Rietbrock, A., González, J., Argandoña, B., et al. (2017). Quantifying offshore fore-arc deformation and splay-fault slip using drowned Pleistocene shorelines, Arauco Bay, Chile. J. Geophys. Res. 122 (6), 4529–4558. doi:10.1002/2016jb013339
Jolivet, R., Simons, M., Duputel, Z., Olive, J. A., Bhat, H. S., and Bletery, Q. (2020). Interseismic loading of subduction megathrust drives long-term uplift in northern Chile. Geophys. Res. Lett. 47 (8), e2019GL085377. doi:10.1029/2019gl085377
Kamp, P. J. (1999). Tracking crustal processes by FT thermochronology in a forearc high (Hikurangi margin, New Zealand) involving Cretaceous subduction termination and mid-Cenozoic subduction initiation. Tectonophysics 307 (3), 313–343. doi:10.1016/s0040-1951(99)00102-x
Karymbalis, E., Tsanakas, K., Tsodoulos, I., Gaki-Papanastassiou, K., Papanastassiou, D., Batzakis, D. V., et al. (2022). Late quaternary marine terraces and tectonic uplift rates of the broader neapolis area (SE peloponnese, Greece). J. Mar. Sci. Eng. 10 (1), 99. doi:10.3390/jmse10010099
Kopp, R. E., Simons, F. J., Mitrovica, J. X., Maloof, A. C., and Oppenheimer, M. (2009). Probabilistic assessment of sea level during the last interglacial stage. Nature 462 (7275), 863–867. doi:10.1038/nature08686
Lajoie, K. R. (1986). Coastal tectonics” in studies in geophysics, active tectonics. Washington, D.C., United States: National Academy Press, 95–124.
Lambeck, K., and Nakada, M. (1992). Constraints on the age and duration of the last interglacial period and on sea-level variations. Nature 357 (6374), 125–128. doi:10.1038/357125a0
Lambeck, K. (2004). sea-level change through the last glacial cycle: Geophysical, glaciological and palaeogeographic consequences. Comptes Rendus Geosci. 336, 677–689. doi:10.1016/j.crte.2003.12.017
Langridge, R., Van Dissen, R., Rhoades, D., Villamor, P., Little, T., Litchfield, N., et al. (2011). Five thousand years of surface ruptures on the Wellington Fault, New Zealand: Implications for recurrence and fault segmentation. Bull. Seismol. Soc. Am. 101 (5), 2088–2107. doi:10.1785/0120100340
Li, W. X., Lundberg, J., Dickin, A. P., Ford, D. C., Schwarcz, H. P., McNutt, R., et al. (1989). High-precision mass-spectrometric uranium-series dating of cave deposits and implications for palaeoclimate studies. Nature 339, 534–536. doi:10.1038/339534a0
Lisiecki, L. E., and Raymo, M. E. (2005). A Pliocene-Pleistocene stack of 57 globally distributed benthic 18O records. Paleoceanography 20, PA1003. doi:10.1029/2004PA001071
Litchfield, N., Ellis, S., Berryman, K., and Nicol, A. (2007). Insights into subduction-related uplift along the Hikurangi Margin, New Zealand, using numerical modeling. J. Geophys. Res. 112, F02021. doi:10.1029/2006JF000535
Litchfield, N. J., Howell, A., Clark, K. J., and Coffey, G. (2021). It’s Our Fault Hikurangi subduction zone hazard: South Palliser Bay Holocene marine terraces. Lower Hutt (NZ): GNS Science, 47. GNS Science report; 2021/28). doi:10.21420/8VDN-AE32
Litchfield, N. J., and Clark, K. J. (2015). Fluvial terrace formation in the lower awhea and pahaoa river valleys, New Zealand: Implications for tectonic and sea-level controls. Geomorphology 231, 212–228. doi:10.1016/j.geomorph.2014.12.009
Litchfield, N. J., Van Dissen, R., Sutherland, R., Barnes, P. M., Cox, S. C., Norris, R., et al. (2014). A model of active faulting in New Zealand. New zeal. J. Geol. geophys. 57 (1), 32–56. doi:10.1080/00288306.2013.854256
Litchfield, N., Morgenstern, R., Clark, K., Howell, A., Grant, G., and Turnbull, J. (2022). Holocene marine terraces as recorders of earthquake uplift: Insights from a rocky coast in southern Hawke's Bay, New Zealand. Earth Surf. Process. Landforms 48, 452–474. doi:10.1002/esp.5496
Little, T. A., Van Dissen, R., Rieser, U., Smith, E. G., and Langridge, R. M. (2010). Coseismic strike slip at a point during the last four earthquakes on the Wellington fault near Wellington, New Zealand. J. Geophys. Res. Solid Earth 115 (B5), B05403. doi:10.1029/2009jb006589
Little, T. A., Van Dissen, R., Schermer, E., and Carne, R. (2009). Late Holocene surface ruptures on the southern Wairarapa fault, New Zealand: Link between earthquakes and the uplifting of beach ridges on a rocky coast. Lithosphere 1 (1), 4–28.
Marshall, J. S., and Anderson, R. S. (1995). Quaternary uplift and seismic cycle deformation, Peninsula de Nicoya, Costa Rica. Geol. Soc. Am. Bull. 107 (4), 463–473.
Matsu'ura, T. (2015). Late Quaternary uplift rate inferred from marine terraces, Muroto Peninsula, southwest Japan: Forearc deformation in an oblique subduction zone. Geomorphology 234, 133–150. doi:10.1016/j.geomorph.2015.01.012
McCulloch, M. T., and Esat, T. (2000). The coral record of last interglacial sea levels and sea surface temperatures. Chem. Geol. 169 (1), 107–129. doi:10.1016/s0009-2541(00)00260-6
McKenzie, K. A., Kelsey, H. M., Kirby, E., Rittenour, T. M., and Furlong, K. P. (2022). Differential coastal uplift quantified by luminescence dating of marine terraces, central Cascadia forearc, Oregon. Quat. Sci. Rev. 298, 107853. doi:10.1016/j.quascirev.2022.107853
McSaveney, M. J., Graham, I. J., Begg, J. G., Beu, A. G., Hull, A. G., Kim, K., et al. (2006). Late Holocene uplift of beach ridges at Turakirae Head, south Wellington coast, New Zealand. New zeal. J. Geol. geophys. 49 (3), 337–358. doi:10.1080/00288306.2006.9515172
Melnick, D. (2016). Rise of the central Andean coast by earthquakes straddling the Moho. Nat. Geosci. 9 (5), 401–407. doi:10.1038/ngeo2683
Merritts, D., and Bull, W. B. (1989). Interpreting Quaternary uplift rates at the Mendocino triple junction, northern California, from uplifted marine terraces. Geology 17 (11), 1020–1024. doi:10.1130/0091-7613(1989)017<1020:iqurat>2.3.co;2
Merritts, D. J. (1996). The Mendocino triple junction: Active faults, episodic coastal emergence, and rapid uplift. J. Geophys. Res. 101 (B3), 6051–6070. doi:10.1029/95jb01816
Meschis, M., Roberts, G. P., Robertson, J., Mildon, Z. K., Sahy, D., Goswami, R., et al. (2022). Out of phase Quaternary uplift-rate changes reveal normal fault interaction, implied by deformed marine palaeoshorelines. Geomorphology 416, 108432. doi:10.1016/j.geomorph.2022.108432
Mildenhall, D. C. (1995). Pleistocene palynology of the petone and seaview drillholes, petone, lower Hutt valley, North Island, New Zealand. J. Roy. Soc. N. Z. 25 (2), 207–262. doi:10.1080/03014223.1995.9517488
Mountjoy, J. J., and Barnes, P. M. (2011). Active upper plate thrust faulting in regions of low plate interface coupling, repeated slow slip events, and coastal uplift: Example from the Hikurangi Margin, New Zealand. Geochem. Geophys. Geosyst. 12 (1). doi:10.1029/2010gc003326
Mountjoy, J. J., Barnes, P. M., and Pettinga, J. R. (2009). Morphostructure and evolution of submarine canyons across an active margin: Cook Strait sector of the Hikurangi Margin, New Zealand. Mar. Geol. 260 (1-4), 45–68. doi:10.1016/j.margeo.2009.01.006
Mouslopoulou, V., Oncken, O., Hainzl, S., and Nicol, A. (2016). Uplift rate transients at subduction margins due to earthquake clustering. Tectonics 35, 2370–2384. doi:10.1002/2016TC004248
Mouslopoulou, V., Saltogianni, V., Nicol, A., Oncken, O., Begg, J., Babeyko, A., et al. (2019). Breaking a subduction-termination from top to bottom: The large 2016 Kaikōura earthquake, New Zealand. Earth Planet Sci. Lett. 506, 221–230. doi:10.1016/j.epsl.2018.10.020
Muhs, D. R., Kelsey, H. M., Miller, G. H., Kennedy, G. L., Whelan, J. F., and McInelly, G. W. (1990). Age estimates and uplift rates for late Pleistocene marine terraces' Southern Oregon portion of the Cascadia forearc. J. Geophys. Res. 95 (B5), 6685–6698. doi:10.1029/jb095ib05p06685
Muhs, D. R., Rockwell, T. K., and Kennedy, G. L. (1992). Late Quaternary uplift rates of marine terraces on the Pacific coast of North America, southern Oregon to Baja California Sur. Quat. Int. 15, 121–133. doi:10.1016/1040-6182(92)90041-y
Murray, M. H., Marshall, G. A., Lisowski, M., and Stein, R. S. (1996). The 1992 M= 7 Cape Mendocino, California, earthquake: Coseismic deformation at the south end of the Cascadia megathrust. J. Geophys. Res. 101 (B8), 17707–17725. doi:10.1029/95jb02623
Nelson, A. R., and Manley, W. F. (1992). Holocene coseismic and aseismic uplift of Isla Mocha, south-central Chile. Quat. Int. 15, 61–76. doi:10.1016/1040-6182(92)90036-2
Neumann, A. C., and Hearty, P. J. (1996). Rapid sea-level changes at the close of the last interglacial (substage 5e) recorded in Bahamian island geology. Geology 24 (9), 775–778. doi:10.1130/0091-7613(1996)024<0775:rslcat>2.3.co;2
Nicol, A., and Beavan, J. (2003). Shortening of an overriding plate and its implications for slip on a subduction thrust, central Hikurangi Margin, New Zealand. Tectonics 22 (6). doi:10.1029/2003tc001521
Nicol, A., Begg, J., Saltogianni, V., Mouslopoulou, V., Oncken, O., and Howell, A. (2022). Uplift and fault slip during the 2016 Kaikōura earthquake and late quaternary, Kaikōura Peninsula, New Zealand. New zeal. J. Geol. geophys., 1–16. doi:10.1080/00288306.2021.2021955
Nicol, A., Mazengarb, C., Chanier, F., Rait, G., Uruski, C., and Wallace, L. (2007). Tectonic evolution of the active Hikurangi subduction margin, New Zealand, since the Oligocene. Tectonics 26 (4). doi:10.1029/2006tc002090
Nicol, A., Van Dissen, R., Vella, P., Alloway, B., and Melhuish, A. (2002). Growth of contractional structures during the last 10 m.y. at the southern end of the emergent Hikurangi forearc basin, New Zealand. New Zeal. J. Geol. Geophys. 45 (3), 365–385. doi:10.1080/00288306.2002.9514979
Ninis, D., Little, T. A., Van Dissen, R. J., Litchfield, N. J., Smith, E. G., Wang, N., et al. (2013). Slip rate on the Wellington Fault, New Zealand, during the late quaternary: Evidence for variable slip during the Holocene. Bull. Seismol. Soc. Am. 103 (1), 559–579. doi:10.1785/0120120162
Ninis, D., Little, T., Litchfield, N., Wang, N., Jacobs, K., and Henderson, C. M. (2022). Pleistocene marine terraces of the Wellington south coast–their distribution across multiple active faults at the southern Hikurangi subduction margin, Aotearoa New Zealand. New zeal. J. Geol. geophys. 65 (1), 242–263. doi:10.1080/00288306.2021.2011329
Nodder, S. D., Lamarche, G., Proust, J. N., and Stirling, M. (2007). Characterizing earthquake recurrence parameters for offshore faults in the low-strain, compressional Kapiti-Manawatu Fault System, New Zealand. J. Geophys. Res. Solid Earth 112 (B12).
O'Leary, M. J., Hearty, P. J., and McCulloch, M. T. (2008). Geomorphic evidence of major sea-level fluctuations during marine isotope substage-5e, Cape Cuvier, Western Australia. Geomorphology 102 (3), 595–602. doi:10.1016/j.geomorph.2008.06.004
Okada, Y. (1985). Surface deformation due to shear and tensile faults in a half-space. Bull. Seismol. Soc. Am. 75 (4), 1135–1154. doi:10.1785/BSSA0750041135
Ota, Y., Hull, A. G., and Berryman, K. R. (1991). Coseismic uplift of Holocene marine terraces in the pakarae river area, eastern North Island, New Zealand. Quat. Res. 35 (3), 331–346. doi:10.1016/0033-5894(91)90049-b
Ota, Y., Pillans, B., Berryman, K., Beu, A., Fujimori, T., Miyauchi, T., et al. (1996). Pleistocene coastal terraces of Kaikōura Peninsula and the marlborough coast, South Island, New Zealand. New zeal. J. Geol. geophys. 39 (1), 51–73. doi:10.1080/00288306.1996.9514694
Ota, Y., Williams, D. N., and Berryman, K. R. (1981). Late quaternary tectonic map of New Zealand 1:50,000 parts sheets Q27, R27 and R28. Lower Hutt: New Zealand Geological Survey.
Pedoja, K., Ortlieb, L., Dumont, J. F., Lamothe, M., Ghaleb, B., Auclair, M., et al. (2006). Quaternary coastal uplift along the Talara Arc (Ecuador, Northern Peru) from new marine terrace data. Mar. Geol. 228 (1-4), 73–91. doi:10.1016/j.margeo.2006.01.004
Pillans, B. (1990). Pleistocene marine terraces in New Zealand: A review. New zeal. J. Geol. geophys. 33 (2), 219–231. doi:10.1080/00288306.1990.10425680
Pizer, C., Clark, K., Howarth, J., Garrett, E., Wang, X., Rhoades, D., et al. (2021). Paleotsunamis on the southern Hikurangi subduction zone, New Zealand, show regular recurrence of large subduction earthquakes. Seismic Rec. 1 (2), 75–84. doi:10.1785/0320210012
Plafker, G. (1972). Alaskan earthquake of 1964 and Chilean earthquake of 1960: Implications for arc tectonics. J. Geophys. Res. 77 (5), 901–925. doi:10.1029/jb077i005p00901
Plafker, G. (1965). Tectonic deformation associated with the 1964 Alaska earthquake. Science 148 (3678), 1675–1687. doi:10.1126/science.148.3678.1675
Pondard, N., and Barnes, P. M. (2010). Structure and paleoearthquake records of active submarine faults, Cook Strait, New Zealand: Implications for fault interactions, stress loading, and seismic hazard. J. Geophys. Res. Solid Earth 115 (B12).
Potter, E. K., Esat, T. M., Schellmann, G., Radtke, U., Lambeck, K., and McCulloch, M. T. (2004). Suborbital-period sea-level oscillations during marine isotope substages 5a and 5c. Earth Planet. Sci. Lett. 225 (1), 191–204. doi:10.1016/j.epsl.2004.05.034
Potter, E. K., and Lambeck, K. (2004). Reconciliation of sea-level observations in the Western North Atlantic during the last glacial cycle. Earth Planet Sci. Lett. 217 (1), 171–181. doi:10.1016/s0012-821x(03)00587-9
Reyners, M., Eberhart-Phillips, D., Stuart, G., and Nishimura, Y. (2006). Imaging subduction from the trench to 300 km depth beneath the central North Island, New Zealand, with vp and vp/vs. Geophys. J. Int. 165 (2), 565–583. doi:10.1111/j.1365-246x.2006.02897.x
Reyners, M. (1998). Plate coupling and the hazard of large subduction thrust earthquakes at the Hikurangi subduction zone, New Zealand. New zeal. J. Geol. geophys. 41, 343–354. doi:10.1080/00288306.1998.9514815
Robinson, R., Van Dissen, R., and Litchfield, N. (2011). Using synthetic seismicity to evaluate seismic hazard in the Wellington region, New Zealand. Geophys. J. Int. 187 (1), 510–528. doi:10.1111/j.1365-246x.2011.05161.x
Rohling, E. J., Grant, K., Hemleben, C. H., Siddall, M., Hoogakker, B. A. A., Bolshaw, M., et al. (2008). High rates of sea-level rise during the last interglacial period. Nat. Geosci. 1 (1), 38–42. doi:10.1038/ngeo.2007.28
Saillard, M., Hall, S. R., Audin, L., Farber, D. L., Regard, V., and Hérail, G. (2011). Andean coastal uplift and active tectonics in southern Peru: 10Be surface exposure dating of differentially uplifted marine terrace sequences (san juan de Marcona, ∼15.4°S). Geomorphology 128 (3), 178–190. doi:10.1016/j.geomorph.2011.01.004
Schermer, E. R., Little, T. A., and Rieser, U. (2009). Quaternary deformation along the Wharekauhau fault system, North Island, New Zealand: Implications for an unstable linkage between active strike-slip and thrust faults. Tectonics 28 (6), TC6008. doi:10.1029/2008TC002426
Seebeck, H., Van Dissen, R., Litchfield, N., Barnes, P., Nicol, A., Langridge, R., et al. (2022). New Zealand community Fault Model – version 1.0. Lower Hutt (NZ): GNS science, 96. (GNS Science report; 2021/57). doi:10.21420/GA7S-BS61
Siddall, M., Chappell, J., and Potter, E-K. (2007). 7. Eustatic sea level during past interglacials. Dev. Quat. Sci. 7, 75–92.
Stirling, C. H., Esat, T. M., Lambeck, K., and McCulloch, M. T. (1998). Timing and duration of the last interglacial: Evidence for a restricted interval of widespread coral reef growth. Earth Planet. Sci. Lett. 160 (3), 745–762. doi:10.1016/s0012-821x(98)00125-3
Stirling, M., McVerry, G., Gerstenberger, M., Litchfield, N., Van Dissen, R., Berryman, K., et al. (2012). National seismic hazard model for New Zealand: 2010 update. Bull. Seismol. Soc. Am. 102 (4), 1514–1542. doi:10.1785/0120110170
Subarya, C., Chlieh, M., Prawirodirdjo, L., Avouac, J. P., Bock, Y., Sieh, K., et al. (2006). Plate-boundary deformation associated with the great Sumatra–Andaman earthquake. Nature 440 (7080), 46–51. doi:10.1038/nature04522
Thompson, W. G., Curran, H. A., Wilson, M. A., and White, B. (2011). Sea-level oscillations during the last interglacial highstand recorded by Bahamas corals. Nat. Geosci. 4 (10), 684–687. doi:10.1038/ngeo1253
Thompson, W. G., and Goldstein, S. L. (2005). Open-system coral ages reveal persistent suborbital sea-level cycles. Science 308 (5720), 401–404. doi:10.1126/science.1104035
Tozer, B., Stern, T. A., Lamb, S. L., and Henrys, S. A. (2017). Crust and upper-mantle structure of Wanganui Basin and southern Hikurangi margin, North Island, New Zealand as revealed by active source seismic data. Geophys. J. Int. 211 (2), 718–740. doi:10.1093/gji/ggx303
Van Dissen, R. J., Berryman, K. R., Pettinga, J. R., and Hill, N. L. (1992). Paleoseismicity of the wellington-hutt valley segment of the Wellington Fault, North Island, New Zealand. N. Z. J. Geol. Geophys. 35 (2), 165–176. doi:10.1080/00288306.1992.9514511
Van Dissen, R., and Yeats, R. S. (1991). Hope fault, Jordan thrust, and uplift of the seaward Kaikoura Range, New Zealand. Geology 19 (4), 393–396. doi:10.1130/0091-7613(1991)019<0393:hfjtau>2.3.co;2
Vigny, C., Socquet, A., Peyrat, S., Ruegg, J. C., Métois, M., Madariaga, R., et al. (2011). The 2010 Mw 8.8 Maule megathrust earthquake of Central Chile, monitored by GPS. Science 332 (6036), 1417–1421. doi:10.1126/science.1204132
Walcott, R. I. (1984). The kinematics of the plate boundary zone through New Zealand: A comparison of short-and long-term deformations. Geophys. J. Int. 79 (2), 613–633. doi:10.1111/j.1365-246x.1984.tb02244.x
Wallace, L. M., Barnes, P., Beavan, J., Van Dissen, R. J., Litchfield, N. J., Mountjoy, J., et al. (2012). The kinematics of a transition from subduction to strike-slip: An example from the central New Zealand plate boundary. J. Geophys. Res. 117, B11402. doi:10.1029/2011JB008640
Wallace, L. M., Beavan, J., McCaffrey, R., Berryman, K., and Denys, P. (2007). Balancing the plate motion budget in the South Island, New Zealand using GPS, geological and seismological data. Geophys. J. Int. 168 (1), 332–352. doi:10.1111/j.1365-246x.2006.03183.x
Wallace, L. M., Beavan, J., McCaffrey, R., and Darby, D. (2004). Subduction zone coupling and tectonic block rotations in the North Island, New Zealand. J. Geophys. Res. 109, B12406. doi:10.1029/2004JB003241
Wallace, L. M., Hreinsdóttir, S., Ellis, S., Hamling, I., D'Anastasio, E., and Denys, P. (2018). Triggered slow slip and afterslip on the southern Hikurangi subduction zone following the Kaikōura earthquake. Geophys. Res. Lett. 45 (10), 4710–4718. doi:10.1002/2018gl077385
Wallace, L. M., Reyners, M., Cochran, U., Bannister, S., Barnes, P. M., Berryman, K., et al. (2009). Characterizing the seismogenic zone of a major plate boundary subduction thrust: Hikurangi Margin, New Zealand. Geochem. Geophys. Geosyst. 10 (10). doi:10.1029/2009gc002610
Wallace, L. M. (2020). Slow slip events in New Zealand. Ann. Rev. Earth Planet. Sci. 48, 175–203. doi:10.1146/annurev-earth-071719-055104
Wang, T., Wei, S., Shi, X., Qiu, Q., Li, L., Peng, D., et al. (2018). The 2016 Kaikōura earthquake: Simultaneous rupture of the subduction interface and overlying faults. Earth Planet. Sci. Lett. 482, 44–51. doi:10.1016/j.epsl.2017.10.056
Watts, A. B., Zhong, S. J., and Hunter, J. (2013). The behavior of the lithosphere on seismic to geologic timescales. Ann. Rev. Earth Planet. Sci. 41 (1), 443–468. doi:10.1146/annurev-earth-042711-105457
Wesson, R. L., Melnick, D., Cisternas, M., Moreno, M., and Ely, L. L. (2015). Vertical deformation through a complete seismic cycle at Isla Santa María, Chile. Nat. Geosci. 8 (7), 547–551. doi:10.1038/ngeo2468
Wickert, A. D. (2016). Open-source modular solutions for flexural isostasy: gFlex v1.0. Geosci. Model. Dev. 9, 997–1017. doi:10.5194/gmd-9-997-2016
Williams, C. A., Eberhart-Phillips, D., Bannister, S., Barker, D. H., Henrys, S., Reyners, M., et al. (2013). Revised interface geometry for the Hikurangi subduction zone, New Zealand. Seismol. Res. Lett. 84 (6), 1066–1073. doi:10.1785/0220130035
Wilson, K., Berryman, K., Cochran, U., and Little, T. (2007b). Holocene coastal evolution and uplift mechanisms of the northeastern Raukumara Peninsula, North Island, New Zealand. Quat. Sci. Rev. 26 (7), 1106–1128. doi:10.1016/j.quascirev.2007.01.005
Wilson, K., Litchfield, N., Berryman, K., and Little, T. (2007a). Distribution, age, and uplift patterns of Pleistocene marine terraces of the northern Raukumara Peninsula, North Island, New Zealand. New zeal. J. Geol. geophys. 50 (3), 181–191. doi:10.1080/00288300709509830
Yildirim, C., Melnick, D., Ballato, P., Schildgen, T. F., Echtler, H., Erginal, A. E., et al. (2013). Differential uplift along the northern margin of the central anatolian plateau: Inferences from marine terraces. Quat. Sci. Rev. 81, 12–28. doi:10.1016/j.quascirev.2013.09.011
Zazo, C., Goy, J. L., Dabrio, C. J., Bardajı́, T., Hillaire-Marcel, C., Ghaleb, B., et al. (2003). Pleistocene raised marine terraces of the Spanish mediterranean and atlantic coasts: Records of coastal uplift, sea-level highstands and climate changes. Mar. Geol. 194 (1), 103–133. doi:10.1016/s0025-3227(02)00701-6
Keywords: subduction, active crustal fault, marine terrace, coastal uplift, Hikurangi margin, Wellington, Aotearoa New Zealand
Citation: Ninis D, Howell A, Little T and Litchfield N (2023) Causes of permanent vertical deformation at subduction margins: Evidence from late Pleistocene marine terraces of the southern Hikurangi margin, Aotearoa New Zealand. Front. Earth Sci. 11:1028445. doi: 10.3389/feart.2023.1028445
Received: 26 August 2022; Accepted: 24 February 2023;
Published: 23 March 2023.
Edited by:
Marco Meschis, Instituto Nazionale di Geofisica e Vulcanologia (Sezione Palermo) - INGV, ItalyReviewed by:
Julius Jara-Muñoz, University of Potsdam, GermanyCopyright © 2023 Ninis, Howell, Little and Litchfield. This is an open-access article distributed under the terms of the Creative Commons Attribution License (CC BY). The use, distribution or reproduction in other forums is permitted, provided the original author(s) and the copyright owner(s) are credited and that the original publication in this journal is cited, in accordance with accepted academic practice. No use, distribution or reproduction is permitted which does not comply with these terms.
*Correspondence: Dee Ninis, ZGVlLm5pbmlzQHNyYy5jb20uYXU=
Disclaimer: All claims expressed in this article are solely those of the authors and do not necessarily represent those of their affiliated organizations, or those of the publisher, the editors and the reviewers. Any product that may be evaluated in this article or claim that may be made by its manufacturer is not guaranteed or endorsed by the publisher.
Research integrity at Frontiers
Learn more about the work of our research integrity team to safeguard the quality of each article we publish.