 Luis E. Pineda
 Juan A. Changoluisa
 Ángel G. Muñoz
95% of researchers rate our articles as excellent or good
Learn more about the work of our research integrity team to safeguard the quality of each article we publish.
Find out more
ORIGINAL RESEARCH article
Front. Earth Sci. , 10 August 2023
Sec. Atmospheric Science
Volume 11 - 2023 | https://doi.org/10.3389/feart.2023.1027609
This article is part of the Research Topic Pacific Multi-Decadal Variability and Enso Impact on the South American Climate View all 5 articles
In January 2016, a high-precipitation event (HPE) affected northwestern Ecuador, leading to devastating flooding in the Esmeraldas River Basin. The HPE appeared in the aftermath of the 2015/16 El Niño as an early onset of heavy rainfalls, normally expected in the peak rainy season between March and April. We investigate the local HPE atmospheric setting and the regional “weather-within-climate” characteristics of the growing-season rainfall between December and January using gauge data, satellite imagery, and reanalysis. The unusual convective environment in late January 2016 involved local and synoptic drivers leading the development of a mesoscale convective complex (MCC) during the nighttime of 24th January. The genesis of the MCC was related to an early-arriving thermal weather state and orographic lifting; the Andean ranges acted as both a channel boosting upslope flow and convective updrafts and as a heavy rain divide for inner valleys. The synoptic controls were associated with 1) a southern boundary of the inter-tropical convergence zone, abnormally displaced to 4°N as response to the 2015/16 El Niño where eastward air surges merge upward vertical mass fluxes; 2) the arrival to the Ecuadorian coast of an equatorially propagating Kelvin wave; and 3) a low-mid level moisture influx coming from the Amazon associated with ascent due to changes in the Walker circulation. Lastly, we suggest that the convective environment in late January was also favored by cross-time-scale interference of the very strong El Niño event and a strong and persistent Madden-Julian oscillation (MJO) in the central Pacific.
The coastal region of Ecuador is one of the most climate-sensitive regions in northwestern South America. The region is characterized by large inter-annual climate variations that bring years with abundant rainfall and flooding. Such rainfall anomalies intensify the core rainy season (March-April) and are often related to above-normal conditions of sea surface temperatures (SSTs) in the tropical Pacific Ocean off the coast of Ecuador, a key region for the development of the El Niño/Southern Oscillation (ENSO) phenomenon (Rasmusson & Carpenter, 1982; McPhaden, 2004; Lenssen et al., 2020). The impact of this climate mode of variability is very important for the coastal region of Ecuador. For example, in the late 20th century, sea surface warming associated with the ENSO resulted in abnormal precipitation and floods, which caused considerable economic and human losses in coastal Ecuador and Northern Peru in 1983 (CEPAL, 1983; Goldberg et al., 1987) and 1998 (Rossel & Cadier, 2009).
In the 21st century, the relation between El Niño and heavy rainfall over this region has been less obvious. The 2010 El Niño event did not result in storms and flooding over coastal Ecuador (Bendix et al., 2011), whereas the 2015/2016 El Niño event led to an unusual early onset of high-precipitation events (HPEs) over the northern coast of Ecuador, a region traditionally considered as a buffer zone of moderate-to-high rainfall anomalies during ENSO episodes (Rossel & Cadier, 2009). In particular, the Esmeraldas River Basin was affected by a series of HPEs in January 2016, triggering floods and landslides. On the 25th of January, the rain gauge station in Esmeraldas, the provincial capital city, registered values of record-breaking precipitation of 244.5 mm in 24 h. Several rivers overflowed on the coastal plain and lower basin, causing major damages to the population living near the riverbanks. The flood displaced over 900 people, caused one casualty, and was the largest in 20 years (Davies, 2016).
Of course, ENSO is not the only climate mode of variability impacting Ecuador. At global scale, the dominant tropical mode of intraseasonal variability (∼30–60 days) is the Madden–Julian Oscillation (Recalde-Coronel et al., 2020; Schreck, 2021), which propagates eastward and, when active, organizes the tropical atmospheric circulation in terms of suppressed and enhanced convective activity regions. The MJO tends to be classified in eight phases, defined in terms of where the enhanced convective activity tends to occur; each phase persists between 3 and 7 days (Pohl and Matthews, 2007). The MJO is known to impact rainfall patterns in South America, depending on the MJO phases, season, and location (e.g., Grimm & Ambrizzi, 2009; Muñoz et al., 2015; Doss-Gollin et al., 2018; Recalde-Coronel et al., 2020). Combinations of ENSO and MJO, a particular example of so-called cross-timescale interferences (e.g., Muñoz et al., 2015; Muñoz et al., 2016; Doss-Gollin et al., 2018), are important as they can modify rainfall characteristics (such as intensity, frequency, onset, and spatial distribution) in different regions.
In coastal Ecuador, the rainy season starts approximately in late November when initial traces, i.e., rains <10 mm/month, appear as a result of limited hygric conditions over the coastal plains due to being the annual coolest period in the Pacific Ocean and the South Pacific low-level trade-wind counterflow towards the inter-tropical convergence zone (ITCZ) (Emck, 2007). A high frequency of HPEs occur around March and April, the peak rainy season, as a response to the surplus of atmospheric water vapor driven by offshore waters, which at that time reach their annual thermal high in the El Niño 1 + 2 region. During the same time period, a zone of low winds lying off the Ecuadorian coast and the ITCZ is displaced near the equator, after which conditions for convective rain improve over the coastal plains and Andean foothills. Furthermore, warmer equatorial SSTs interacting with weakened NE trades allow monsoonal currents with warm moist air to reach the Ecuadorian coast, thus adding up to the rains (Bendix & Lauer, 1992; Pineda & Willems, 2018).
In such a setting, heavy storms are usually triggered by mesoscale convective complexes (MCCs) since warm water, orographic lifting and large-scale low-level convergence combine to focus and enhance deep convection. The December-January period is thus the bridge between two contrasting hygric conditions for storm development: 1) the moisture-limited environment and 2) the unstable atmospheric surface layer. Not surprisingly, the frequency of MCCs and deep convective core occurrences over coastal Ecuador in December/January is substantially lower than in March/April (Mohr & Zipser, 1996; Bendix et al., 2003; Campozano et al., 2018) and in June/July/August (Poveda et al., 2020); the exceptions are the El Niño years when a higher frequency of MCCs over the eastern Pacific and northwestern South American coast is reported (Velasco & Fritsch, 1987; Zolman et al., 2000).
With regard to HPEs during the December-January sub-season in coastal Ecuador, little is known of their characteristics and associated atmospheric conditions. Much work had been concentrated on storm analysis in the March-April peak rainy season, with a focus on El Niño episodes. For example, Bendix et al. (2003) studied the extreme episode of El Niño 1997/1998 and showed that the heavy precipitation during this event was characterized by three mechanisms: 1) mesoscale thermal systems (land–sea breezes), 2) enhanced deep convection in coastal plains by the spill-over effects of cirrus remainders from the Amazon region, and 3) extended convection organized by MCCs in combination with anomalous westerly winds over the eastern Pacific. Those mechanisms were also observed during the 1991/92 El Niño; despite the large inter-event variability and its varying impact on rainfall anomalies, some regional climate patterns recurred during the El Niño events of the last century. In a quest for regional differences in the sea-air setting off the shore of Ecuador during moderate and strong El Niño episodes, Bendix and Bendix (2006) showed that high SSTs in combination with strong latitudinal and local SST gradients off the coast drove regional differences in moist instability and heavy rainfall. Both the reversal of the Walker cell and extended land-sea breeze systems were proven to contribute to HPEs during El Niño episodes. Although these findings shed light on the regional ocean-atmosphere dynamics and associated mesoscale processes during HPEs, they only focused on events within the peak rainy season. HPEs do also occur during the onset rainy season of normal and El Niño years; however, they have been overlooked, and therefore, their dynamics, driving mechanisms, and climatological background have not yet been reported. This has hampered the development of early warning systems that can help to mitigate the impacts of HPEs on society, as was the case during the January 2016 floods in Esmeraldas.
In this study, we investigate the climatological characteristics of the growing season rainfall in December-January using weather state decomposition and use its dynamic interpretation to describe the HPE atmospheric setting that led to flooding over the Esmeraldas River Basin in January 2016. We 1) identify the daily to submonthly weather regimes in the December-January season and 2) examine the processes of the life cycle of the major storm in a weather-within-climate context. The characterization of this is an important step to fill knowledge gaps and provide some basis on the mechanisms and potential predictability of extreme precipitation events over this region.
This paper is organized as follows: the data and methodology are given in Section 2 and Section 3. In Section 4, we describe the December-January weather regimes and their relevance for the onset of the rainy season over coastal Ecuador. Then, we describe the 25th January 2016 HPE storm properties and unveil the mechanisms underlying the development of this extreme event on the northern coast of Ecuador.
Surface, satellite, and reanalysis datasets were used in this study (Table 1). These different datasets were selected because together they provide both physical and historical context to the extreme precipitation event in northwestern Ecuador. Daily precipitation at 92 observing stations across the Pacific-Andean basin of Ecuador and Peru (1–5°S) (Pineda & Willems, 2016), including the Esmeraldas River Basin together with streamflow data from two stations (Figure 1A), were used for the climatological and event analysis, in addition to data from the Instituto Nacional de Meteorología e Hidrología de Ecuador (INAMHI) (INAMHI, 2018). Moreover, satellite data were used for the HPE characterization, daily precipitation estimates from the Climate Hazards Group Infrared Precipitation with Stations (CHIRPS) (Funk et al., 2015) were used for the climatological description of the rainy season onset, and the Tropical Rainfall Measuring Mission (TRMM) 3B42 version 7 dataset (Huffman and Coauthors, 2007) was employed for sub-daily event investigation. Infrared satellite brightness temperatures from the Geostationary Operational Environmental Satellite (GOES) and convective available potential energy (CAPE) from the ERA-Interim reanalysis dataset from the European Centre for Medium-Range Weather Forecasts (Dee et al., 2011) were examined from 24 to 26 January 2016 to describe the storm evolution.
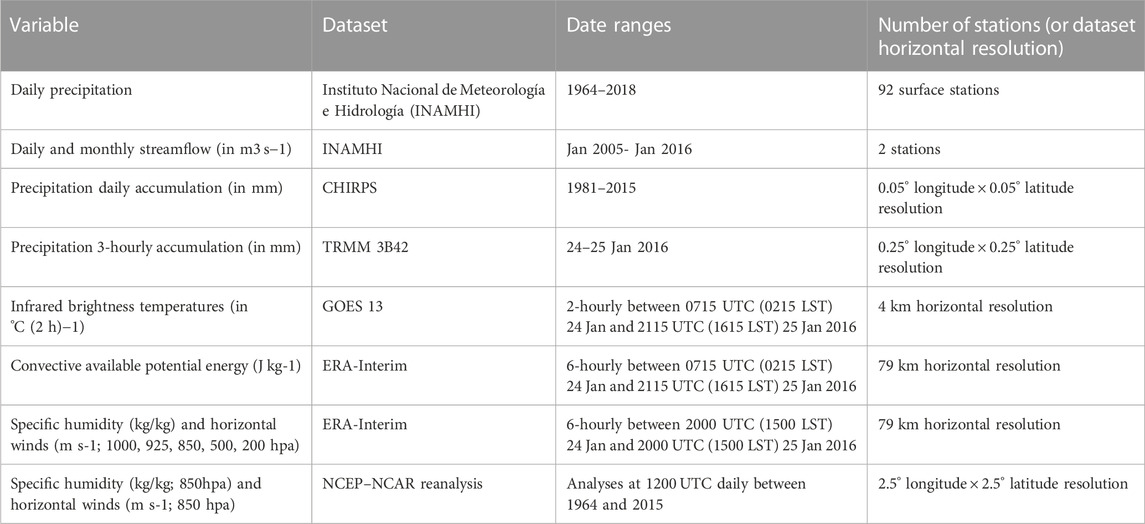
TABLE 1. Datasets, date ranges, and number of stations (or resolution) used in this study.
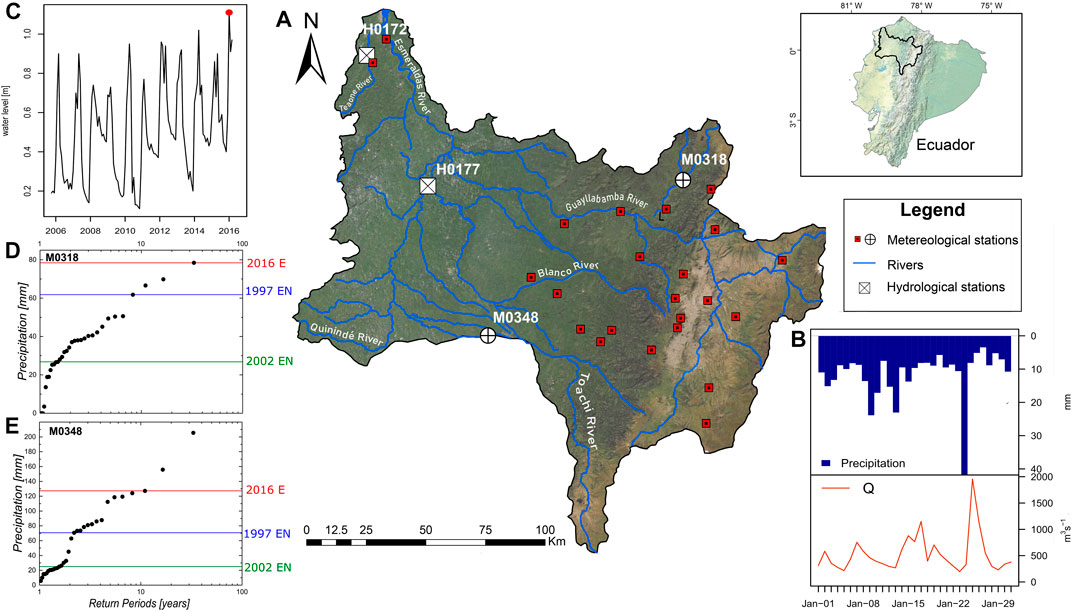
FIGURE 1. (A) Study area showing INAMHI stations: hydrological (white squares), meteorological (white squares and red circles), and the main rivers in the Esmeraldas basin. H0172 (Teaone) and H0177 (Quininde). (B) River discharge in Quininde station (H0177) in January 2016 and average catchment precipitation. (C) Water level in Teaone station (D, E). Empirical return period (years) vs. monthly maximum precipitation (mm) in January for 1987–2018 period (dots) in meteorological stations M0318 (Apuela-Intag) and M0348 (Santa Anita). Horizontal lines show 25th January 2016 event (red) and the 2002 and 1997 ENSO years (green and blue, respectively).
To identify the weather regimes commonly affecting the coastal region of Ecuador, we performed a weather type (WT) classification (Robertson et al., 2004; Muñoz et al., 2015; Pineda & Willems, 2016) on the 850-hPa specific humidity and zonal and meridional wind anomalies. These data are derived from the National Centers for Environmental Prediction-National Center for Atmospheric Research (NCEP-NCAR) reanalysis dataset (Kalnay and Coauthors., 1996). The WT characterization was performed for the December-January sub-season over the 1964–2015 time period. To focus on the coastal region of Ecuador, the domain used for the WT analysis ranged from 15°N to 15°S and from 120°W to 75°W (Pineda & Willems, 2016).
The Esmeraldas River Basin (ERB) drains into the Pacific Ocean and is one of the most water-rich regions in Ecuador. Its watershed has an extension of about 21,418 km2, with headwaters located on the western Cordillera and on the western flanks of the Cordillera Real (Figure 1A). Its main tributaries are the Guayllabamba, Blanco, and Quininde rivers in the middle and lower catchments and Teaone in the coastal plain. In Ecuador, the highest precipitation volumes occur in the Amazon region and the northwestern part of the ERB; thus, its river network drains vast water volumes to the sea. The seasonal rainfall distribution varies across the basin; the influence of air masses coming from the Pacific Ocean defines two rainy seasons in the southern part of the basin: a wet season running from January to May and a dry season from August to September. This contrasts with the humid north, which receives rainfall throughout the year. The annual precipitation total overpasses 3000 mm, and monthly values are usually above 200–500 mm. The eastern upper ERB is more sensitive to Amazon weather influences, where easterly trade winds bring almost year-round precipitation to the upper basin, but within the December-January period there are substantially lesser precipitation volumes (Cruz et al., 1977; Pourrut, 1995).
On 25th January, after record-breaking night rains of 244.5 mm recorded in Esmeraldas city and more than 100 mm in nearby locations—Between 1900 LST on 24th January and 1900 LST on 25th January—Several rivers in the region overflowed, affecting both coastal cities and inland towns. The 25th January flood was the last and largest event of a series of flood pulses triggered by unusual heavy rainfall events starting early in January. During 24th and 25th January, the ERB received large rainfall pulses, resulting in a sharply increased discharge in most of the Esmeraldas River’s tributaries. For example, the Quininde River recorded a value of about 2000 m3/s at the Quininde gauge station (H0177), that is, a two-fold increase of water volume in respect to the previous 10 days (Figure 1B); the flood wave traveled quickly downstream, adding to the likewise high discharge of the Blanco and Guayllabamba rivers. This fast-flood routing in the middle and upper catchment of the rivers was felt mostly in the coastal city of Esmeraldas. There, the Esmeraldas River overflowed its banks, causing extensive damage; flooding and mud flow developed quickly, affecting settlements alongside the river and in downstream areas of the city. The flood and back-water effects propagated over floodplains and tributaries such as the Teaone River; notably, the Teaone DJ Tabiazo gauge station (H0172), located near the confluence with the Esmeraldas River, recorded a water level increase overpassing the past 10-year record (Figure 1C). According to the Ecuadorian Risk Management Secretary (Secretaría Nacional de Gestión de Riesgos) 2,460 persons were affected by the flooding.
Over the northeastern region, at the Apuela-Intag station (M0318), the HPE showed record-breaking values that correspond with the highest return period in the past 30-year record, though over the southern region, at the Santa Rita station (M0348), there were other historical extreme events that were larger than the one of 25th January (Figures 1D, E). In both locations, the January 2016 HPE exceeded the heavy rainfall recorded during the 1997 and 2002 ENSO years. This agrees with the idea that the ENSO impacts over the ERB, although important, did not trigger the largest historical HPEs; thus, the region is deemed a transition zone of moderate-to-high rainfall anomalies during ENSO episodes (Rossel and Cadier, 2009).
We used the 0.05° CHIRPS daily rainfall dataset over coastal Ecuador for the 1981–2015 period to form a first estimate of the rainy season onset date based on the analysis of in-season rainfall variability and related this with the 2016 January HPE. A pixel-to-point comparison between the satellite rainfall and ground amounts on the event day broadly agreed, so we used raw satellite data to set a reference onset date. A hydro-climatological identification of the onset date has not been conducted yet for the region, and it is beyond the scope of this paper. We defined the local-scale onset date of the rainy season (December-May) in terms of four parameters that characterize daily rainfall evolution (Marteau et al., 2009): 1) the duration of the initial wet spell; 2) the amount of rainfall received during the initial wet spell; 3) the length of post-onset dry spell to avoid “false starts” related to pre-rainfall pulses. In northwestern Ecuador, the 50-year seasonal varying return period quantile for the monthly maxima of daily precipitation in January was about 75 mm (c.f. Figure 15, station Puerto Ila (PTO) in Pineda and Willems, 2018), and the mean length of wet spells (a continuum of days when it rained more than 1 mm) in December-January across all satellite grid points, as shown in Figure 2, equaled to 3.5 d. Moreover, in situ observations found that the first season showers often appeared as solar-induced convective afternoon downpours in a 3–4 d block period and that dry spells lasted 3 d (0 mm) and 8 d (<1 mm). Thus, we assumed an initial wet spell to last at least 4 d across the region and that the mean length of dry spells equals to 8 d. In such a setting, a post-onset dry spell of 8 d would avoid frequent “false” starts. The estimation of the onset date was performed using the “onsetDate” function of the International Research Institute (IRI) climate data library (Moron & Robertson, 2014). https://iridl.ldeo.columbia.edu/dochelp/Documentation/details/index.html?func=onsetDate.
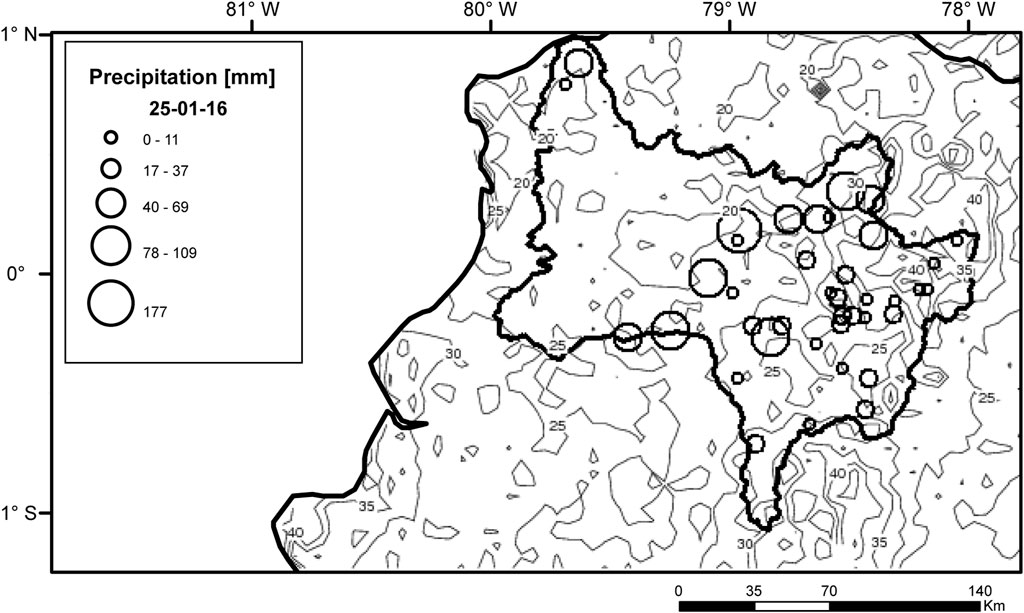
FIGURE 2. The onset day of the rainy season in the Esmeraldas River Basin (color scale). The onset day is computed as number of days after 1st January. Daily precipitation on 25th January 2016 (graded circles).
Figure 2 shows the contours of the climatological onset day of the rainy season after 1st January together with the rainfall depths in the ERB during the HPE day. The onset day corresponds to the first wet day greater than 1 mm within the first 4-day running window that totals 40 mm or more of precipitation and with at least 1 wet day and, that is, not followed by one 8-day dry spell within the 21 days following the identified onset date. Gauge-based hyetographs for January 2016 showed that the 25th January HPE was very intense compared to those of preceding and following days in the mountain-to-coast transition, while outlet stations near the basin recorded low values. The latest rainy season onset took place over the northeastern ERB before the first half of February, whereas in the middle and lower basin, the onset appeared during the third-to-fourth week of January. Notice that this climatological onset criterion includes the occurrence of precipitation totals as high as 75 mm. The 25th January HPE brought, however, to late January rainfall depths greater than 170 mm, which are typical values for the annual heaviest rainfalls in March and April over the western Andean slope (c.f. Figure 15, station Puerto Ila (PTO) in Pineda and Willems, 2018).
We used a hidden Markov model (HMM; Hughes & Guttorp, 1994) as a diagnostic tool to provide a compact description of the December-February daily rainfall in terms of weather states and their climatic background. A state-based HMM was used to describe 51 December–February seasons with daily rainfall data at 92 ground stations. The HMM structure and assumptions were fully presented in Robertson et al. (2004, 2006) and have been successfully applied for weather state characterization in South America: northeastern Brazil (Robertson et al., 2004), central-northern Chile (Verbist et al., 2010), and the Pacific-Andean region of Ecuador and northern Peru (Pineda & Willems, 2016). The fitting of the HMM and derivation of weather states proceeded as follows:
(1) For each location, conditional on the hidden state, the rainfall simulated by the HMM on a given day was drawn from a mixture model. The Bayesian information criterion (BIC; Schwarz, 1978) was used as a guide for choosing the number of states k and assessing the performance of different mixture models. In this way, a four-state model with two mixed-exponential distributions to represent rainfall intensity and a delta function at zero amounts to model dry days was found to effectively represent the 3162 December-January daily rainfall sequences within the 1964–2010 period, following the analysis by Pineda and Willems (2016).
(2) Mathematically, the December–January daily rainfall distributions for 92 ground stations were expressed by a two-component mixed-exponential model [Eq. 1]:
where Rt is a multivariate vector of daily rainfall r; St is the hidden rainfall state for day t; λ are the parameters of exponential distributions; t is time in days; and indices i, m, and c refer to state, station, and mixture component, respectively. The pimc are weights. In the summation, C refers to the number of exponential components. The model parameter estimation was performed by maximum likelihood, using the iterative expectation maximization (EM) algorithm (Dempster et al., 1977; Ghahramani, 2001).
(3) The weather state path was computed using the Viterbi algorithm (Forney, 1973). The algorithm identifies the days falling into each state and returns the most likely sequence of states for the transition matrix of the four-state HMM. Then, the identified days were clustered to represent each of the states and create atmospheric composites associated with each of them. The atmospheric composites allowed the investigation of the lower circulation dynamics. They were generated using NCEP–NCAR reanalyses (Kalnay and Coauthors., 1996), fields of specific humidity (qa), and horizontal winds at 850 hPa. This way, a climatology of the most likely sequence of weather states for the December-February season was derived.
(4) Time-lagged composite anomalies for specific humidify and low-level winds up to and after the HPE date allowed for investigation of the dynamics of moisture and wind circulation patterns during the HPE life span and to contrast them with the climatology of the most likely sequence of weather states for the December-January season. The limitation of the reanalyses data is obvious, and statements at the edge of the synoptic scale should be made carefully. Nevertheless, reanalyses data are invaluable in placing local weather in the synoptic context, especially in regions such as the ERB, which lacks synoptic long-term meteorological observations.
Infrared brightness temperatures computed from the 10.7 μm IR channel from the NOAA’s Geostationary Operational Environmental Satellite (GOES) 13 data were used for tracking cloud features to estimate atmospheric motion during the HPE. MCCs can be identified using IR information, and several authors agree on MCCs’ features, i.e., cloud shield with repeatedly low IR temperatures, colder than −32°C, and with a coverage area up to 100,000 km2. In such a setting, the inner core often shows a cold cloudy region with temperatures colder than −52°C over an area of about 50,000 km2. The 4 km GOES IR brightness temperatures data are thus suitable to estimate cloud features. Additionally, MCCs regularly have a duration around 6–12 h and produce heavy amounts of rain, thick hail, harsh winds, and tornadoes in the first phase of the MCC progression (Maddox, 1980).
Precipitation observations from TRMM (Huffman and Coauthors., 2007) were used to represent the storm pattern during the MCC. This product is available at 3 h intervals on a regular grid of 0.25°. The product combines and intercalibrates passive microwave (PMW) precipitation estimates from satellites in the GlobalPrecipitation Measurement Mission (GPM) constellation with observations from the dual-frequency precipitation radar (DPR) and a conical-scanning multichannel microwave imager [GPM Microwave Imager (GMI)] on board the GPM Core Observatory, using the method developed for the Tropical Rainfall Measuring Mission (TRMM) by Huffman and Coauthors. (2007).
Data from the European Centre for Medium-Range Weather Forecasts (ECMWF) interim reanalysis (ERA-Interim) (Dee and Coauthors, 2011) on a 0.7° grid with 37 pressure levels, convective available potential energy (CAPE), and monthly mean profiles of horizontal winds and specific humidity were used to analyze the vertical circulation of both the HPE and climatological conditions over the Pacific-Andean basin (2°N-3°S, 78°-81°W). The ERA-Interim data thus allowed a synoptic representation of the atmospheric circulation that influences the ERB.
The analysis of the December-January season in terms of the four hidden weather states provides a description of the prevailing atmospheric conditions during this season (Table 2). First, state 1, the wettest state, shows an excess of humidity in the eastern Pacific, offshore of Ecuador, that extends over the entire country (Figure 3A). Its high positive atmospheric moisture anomalies are accompanied by weak landward winds south of the equator and easterly flow to the north. This rich moisture-bearing air will drive the occurrence of wet days both east and west of the Andes in January. State 2, drier than the first one, shows mild positive atmospheric moisture anomalies at 850 hPa and weak easterlies north of the equator. It can be considered as oceanic moisture (state 1) at the upper levels of the troposphere, leaving the Pacific–Andean bottom valleys with a moisture deficit (Figure 3B). State 3, the driest one, shows negative moisture anomalies bounded by the Andes. It represents moisture-limited conditions prior to the start of the rainy season and the dry episodes of the mountain-to-coast rainfall; its associated atmospheric circulation shows a very low-speed zone offshore of Ecuador (Figure 3C). Finally, state 4 shows substantial amounts of moisture in the region with high anomalies east of the Andes. The wind circulation also shows a very low speed pattern over Ecuador and a prominent flow north of the equator (Figure 3D). This can be considered as the ITCZ southern displacement and, to a lesser extent, the eastward expansion of the South American monsoon, both contributing to the December-January rainfall. Note that easterlies north of the equator are consistent among all the states featuring the NE trade winds in January over northwestern South America and the eastern Pacific, which are of relevance for the ITCZ displacement (state 4).

TABLE 2. Weather state characteristics.
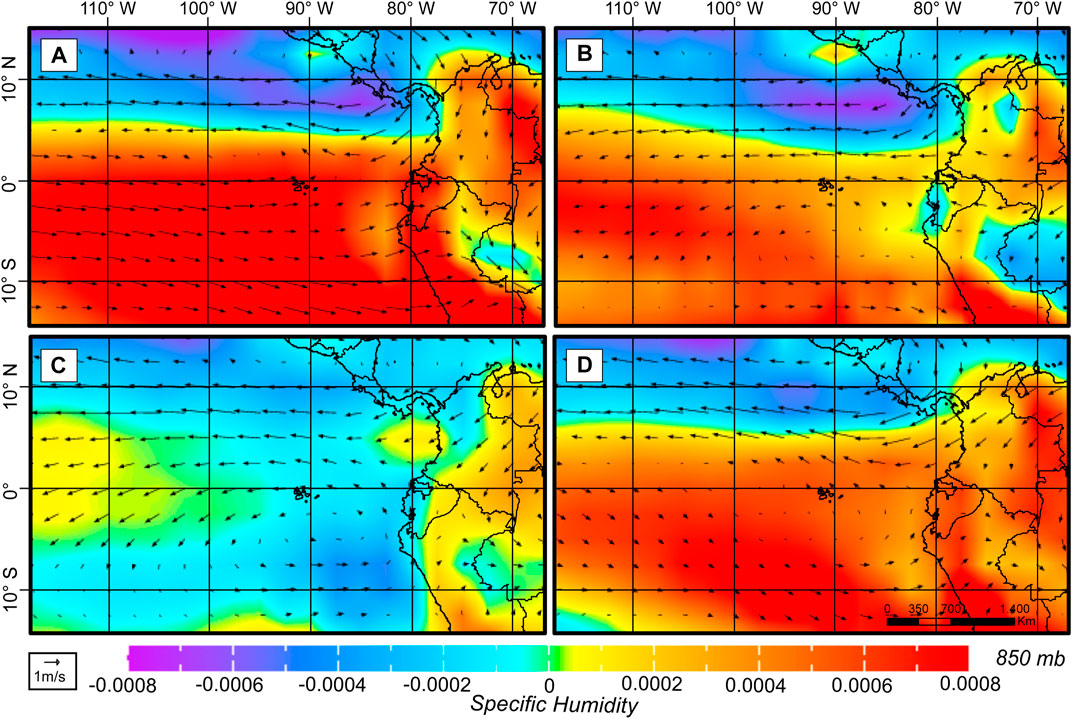
FIGURE 3. HMM state anomaly composites of horizontal winds (vectors) and specific humidity at 850 hPa (colors) with respect to December-January climatology for 1964–2015. (A–D) represent state 1-4, respectively. Also shown is the location of the Esmeraldas River Basin.
Figures 4A, B show the daily sequence of weather states and the number of days for each state as the output of the HMM, specifically the output of the Viterbi algorithm (e.g., Rabiner, 1989), which unveils features of the intra-seasonal and inter-annual variability of the December-January season within a 50-year period. In the first 2 weeks of December, the dry state (state 3) prevails over the other states, except during the El Niño years in which the wet states 1 and 2 are persistent through the sub-season. The second half of December is dominated by state 4, and then state 1, the wettest one, progressively leads the occurrence of rainfall all the way to January. In January, state 1 remains as a leading factor, and the wet states 2 and 4 are evenly important. The climatological rainy season onset of the ERB, in the last week of January, is then dictated by a non-looped sequence and feedbacks of states 1, 2, and 4.
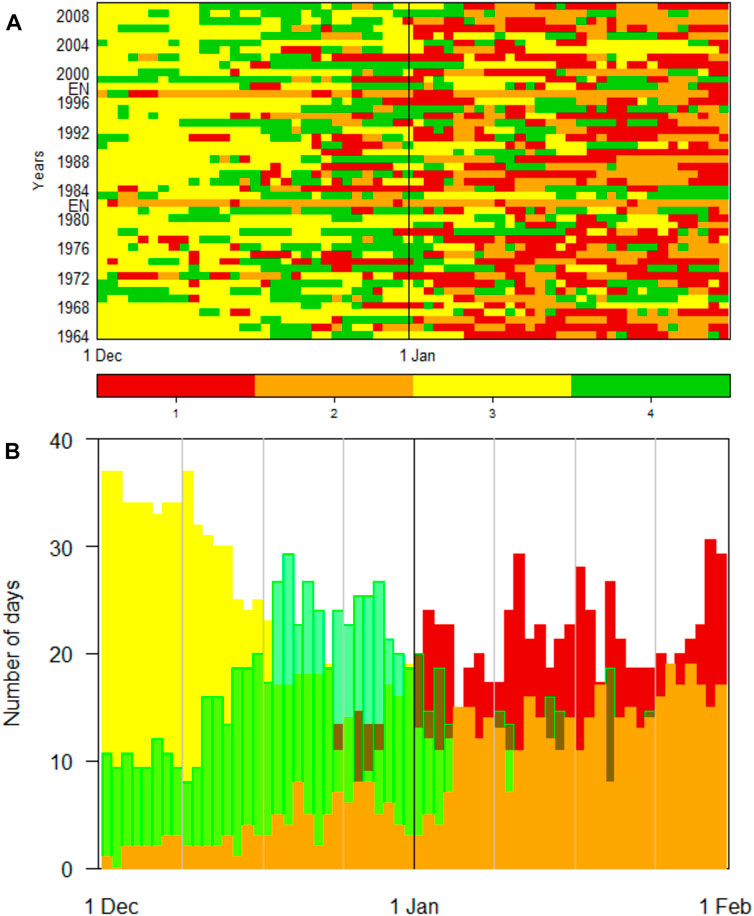
FIGURE 4. (A) Viterbi sequence of most likely states in the December-January sub-season for the 1964–2015 period. (B) Number of days of each state in the December-January sub-season. Colors represent the most likely states 1-4.
The HPE of 25th January 2016 in Esmeraldas started in the early morning and lasted around 16 h until late in the afternoon. The heavy rains with the largest cloud shield and cold core occurred between 0900 and 1300 LST (Supplementary Table S1) (Figure 5). Those patterns are consistent with the storm features observed in the mesoscale convective events near Piura region (Peru) between November 1982 and June 1983 during the El Niño, in which 6-h heavy rains were observed in 16 fully developed storms (Goldberg et al., 1987). They are also similar to those reported for mesoscale convective systems in northwestern South America in April 1993 (Mohr & Zipser, 1996).
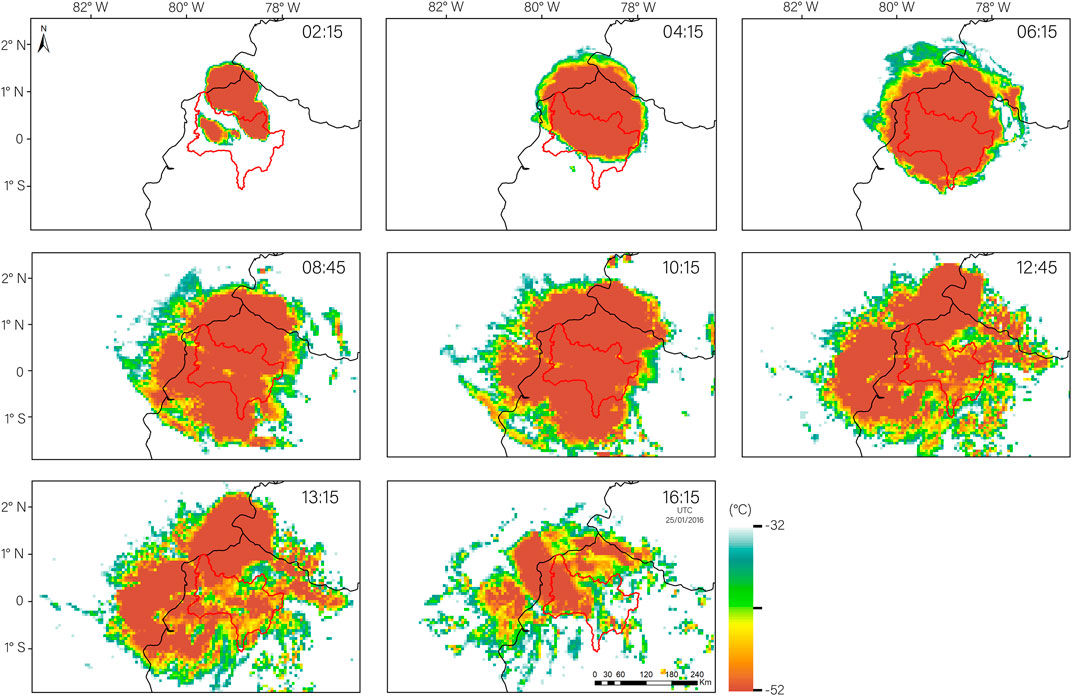
FIGURE 5. Development of the storm cloud during the event day (25/01/2016) as observed via satellite GOES 13.
The HPE formation began around 2100 LST on 24th January and 0200 LST on 25th January when moisture-laden air and high CAPE near the coastal line allowed deep convection to be triggered (Supplementary Figure S1). Three isolated convective cells first appeared and grew over the northern basin, expanding later to the south, being part of the first updrafts that boosted the MCCs’ formation (Figure 5). Then, mature convective clouds were formed by easterly winds at around 0415 LST. At this stage, the upstream of the convective cloud created a broadening anvil, that is, possible to recognize on satellite imagery. Then, the bright band cloud shield area, comprising melted ice particles in the stratiform region, increased rapidly. This MCC stage was caused by enhanced updrafts due to feedback mechanisms (Morrison et al., 2012). All these features suggest that the HPE’s structure is that of a typical tropical inland MCC (Liu et al., 2007). Figure 7 a-d show that the low-level circulation propagated at about 10 m/s, producing a moderate wind shear. As the MCC was fully developed, the winds blew away from the unstable air, and the convective pattern disappeared so that precipitation slowly died out.
The terrain structure helps to explain the storm development over the basin (Supplementary Figure S2). The ERB’s elevation gradient is large because of the presence of the high eastern mountain range, the Cordillera Real, the Guayllabamba valley in the middle-upper basin, and the western Cordillera with an average elevation of about 4000 masl. This latter feature acted as both a barrier in the southern basin and as a gateway for moist air masses to the northeastern innermost valleys, the headwater regions of the Guayllabamba River. The region seems naturally shaped to catch moisture, moving it to the northeast and funneling it to higher altitudes, where due to orographic lifting, moist air masses expand and cool adiabatically, thus creating clouds and rain. The convective activity involving orographic effects and synoptic controls (Section 4.3) led to the development of an MCC that then spread back across the plains and over the northwestern ERB. On land, this resulted in two daily precipitation patterns: 1) a region of moderate rainfall volumes on the wind and leeward side of the western Cordillera (stations M0318, M0327, and M0337), and 2) a region of high rainfall volumes over the western plains (stations M0160, M0348, M0190, and M0191). The sub-daily HPE evolution between 24 and 25 January (Figure 6) shows the start of the storm was characterized by above-normal moisture confined to the northeastern ERB at 2230 LST that was conducive to the upscale convective growth of a first cluster. This resulted in the first nocturnal convective showers at 0130 LST that appeared inland, depositing rain over the foothills of the Cordillera Real. Because of the up- and downdraft feedback mechanisms, orographic effects, and low-level easterlies over the western Cordillera, a second cluster was added to the storms at 0430 LST, reinvigorating the convective activity over the central ERB and its plains, which later migrated to the lower basin where the highest intensities fell on the shore at 0730 LST.
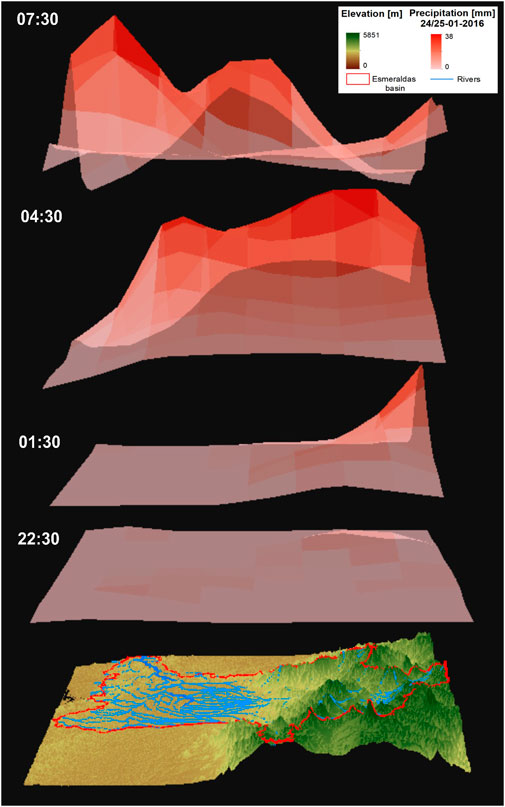
FIGURE 6. A 3D terrain model, as in Supplementary Figure S2, of Esmeraldas River Basin (red line) overlapped by TRMM precipitation data for a time sequence of storm events recorded every 3 h on 24–25 January 2016. The sequence starts at 24 January at 22:30.
In the ERB, the rainy season onset takes place around the last week of January (Figure 2) when oceanic warm air masses driven by low-level westerlies have saturated both the low and middle levels of the troposphere (weather states 1 and 2), leading to favorable conditions for convection. In addition, low-level southerly trades from the South Pacific anticyclone generate low-tropospheric airflow that distributes moisture over the western Andean foothills in the central and northern Ecuadorian Pacific–Andean basin during both normal and El Niño years (Bendix & Bendix, 2006; Pineda & Willems, 2018). Then, afternoon downpours and aftermath precipitation that produce more than 2/3 of the mean daily total (Emck, 2007) signal the start of the rainy season. The presence of the Amazonian humidity embedded in upper-level easterlies (weather state 4) is important for rain cloud development on the higher Andean slopes but not a pre-requirement for the occurrence of the first rains pulses, which are essentially solar-induced convective rains of oceanic moist origin embedded in landward sea breezes.
During extreme conditions, such as those during the El Niño years, the heavy rains over central and northern Ecuador are accompanied by a boosted westerly flow at low levels and well-developed upper easterlies, a reversed Walker circulation, that is, a hallmark of both strong and moderate El Niño episodes (Bendix & Bendix, 2006). Regarding large-scale forcing during episodes of anomalously high SSTs, there is evidence of synoptic control for the occurrence of HPEs, specifically a low-level westerly flow enhancement associated with synoptic-scale weakening of easterlies observed on rainy days over northwestern Peru during the 1997/98 El Niño (Takahashi, 2004). Although modest, a similar relationship between anomalous westerly winds and enhanced rainfall has been reported along the coast from near the equator to ∼7°S during the 1997/98 El Niño (Douglas et al., 2009). The 2016 El Niño showed, however, an unprecedented out-of-phase atmospheric response over the eastern Pacific with negative precipitation anomalies, high SLP, and the ITCZ located northward of its climatology position during El Niño years (Sanabria et al., 2019).
Figure 7 shows time-lagged composite anomalies for specific humidity and low-level winds up to and after the HPE date. At t = -2d, the low-level specific humidity shows the highest anomalies over the eastern Pacific that extend to the continent. The moisture-laden air followed the SST latitudinal gradients observed in January 2016 over the eastern Pacific, showing the highest values around the equator. Note that the specific humidity color scale in Figure 7 is the same as in Figure 3, but the magnitude of anomalies in the former is about 3.5 times the latter. This mirror effect of SST anomalies on the troposphere is a signal of the strong water vapor feedback over the eastern Pacific (Hu et al., 2016). This somehow differs from the expected moist conditions of weather states 1 and 2, which, in the long-term, tend to be dominated by the climatological SST development in the region 1 + 2 (Pineda & Willems, 2016). Regarding the wind circulation, the most notable feature is a southeasterly flow that pushes the humid air to the Andes, which is likely the low-level moisture convergence over the Amazon observed during January-April 2016 (Sanabria et al., 2019). At t = -1d, the low-level moisture pattern remains the same as the previous day, with the southerly flow keeping moisture over the Andes while drying out the eastern Andean foothills-to-Amazon transition. A remarkable feature leading HPE development is a northeasterly enhancement over the Colombian Pacific region, which we found to be instrumental in organizing convection. On the HPE day, the moisture-laden region had shrunk offshore of Ecuador and over the continent, west of the Andes, due to the northeasterly flow enhancement, which converged to the Gulf of Guayaquil near the ERB region. At t = 1d, the high moisture anomalies moved offshore of Ecuador, and an anti-cyclonic circulation was established over the Gulf of Guayaquil. On the northern edge of the ERB, strong easterly winds followed the MCC dissipation; these winds were responsible for moving away from the unstable air convective cells.
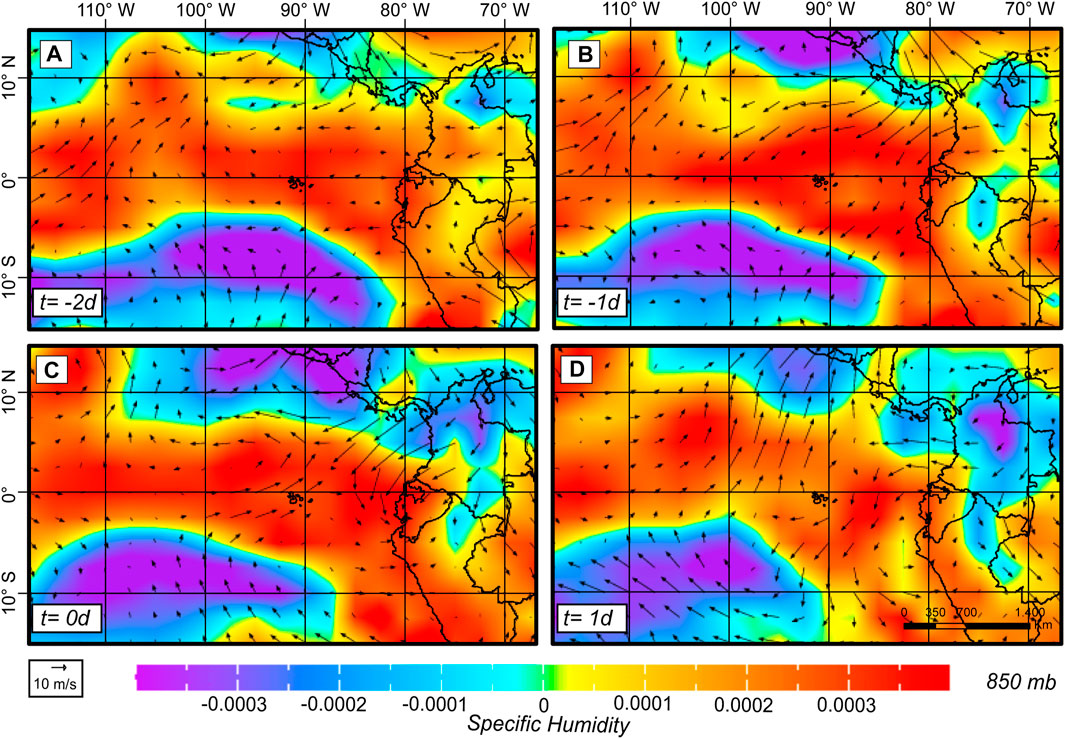
FIGURE 7. Time-lagged composite anomalies for specific humidify and low-level winds. t = −2d (23rd January), t = −1d (24th January), t = 0d (25th January), t = 1d (26th January 2016).
The atmospheric setting fostered a local environment for deep convection over the ERB in late January 2016, a period that in normal years brings the first mild rains of the wet season. The 2016 El Niño caused enhanced evaporation to produce a warmer and moister atmosphere at the surface that during 24–25 January showed a q about 1.2 g kg−1 larger than its climatological value in January (Figure 8). The out-of-phase atmosphere response to the 2016 El Niño located the ITCZ northward, at about 4°N, of its climatological position during El Niño years, which was sustained by moist air from the Amazon basin and a strengthened sub-tropical anticyclone (Sanabria et al., 2019). This provided an east-west (E-W) boundary for the northward extent of the coastal moisture surge movement. The zonal winds during 24–25 January showed little change compared to climatological values (Figure 8), and moderate low-level westerlies will likely represent either the early arrival of a fully developed thermal weather state typical for the March-April period (weather state 1 in Pineda and Willems, 2016) or an intensified land-sea breeze phenomenon. During the HPE, the middle and upper levels also showed an easterly wind similar to the climatology with the highest values at about 6 km, suggesting that these easterlies helped with the MCC formation first and then decoupled the convergence and storm, causing the storm to dissipate. The meridional winds showed strong southerlies up to about 4 km and northerlies at about 6 km, representing high wind shear in the low-middle level, indicating the synoptic control of the southern bound of the ITCZ displaced to the north.
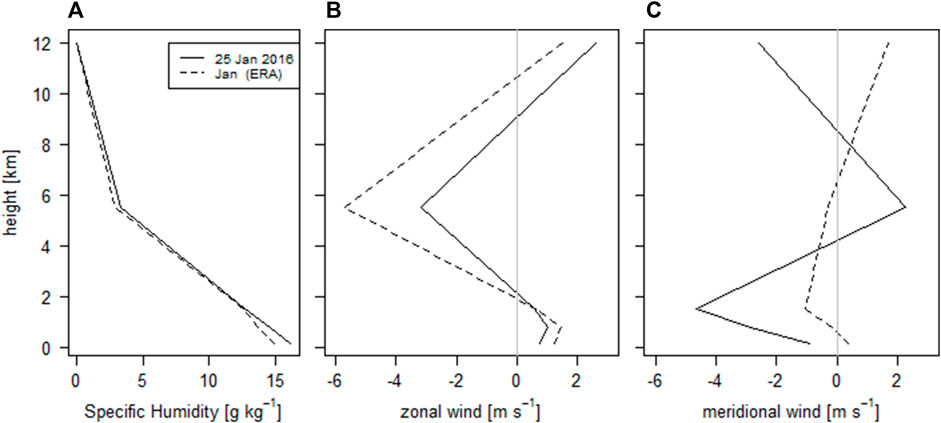
FIGURE 8. (A) Mean specific humidity, (B) mean zonal wind, and (C) mean meridional wind. Data taken over a 24 h period from 1500 LST 24thJanuary to 1500 LST 25th January 2016.
The saturation of the lower and middle troposphere during late January 2016 was due to a surplus of moisture-laden air similar to that driven by the El Niño 1 + 2 SST development in February-March (weather state 1 in Pineda and Willems, 2016), when the presence of the December-January weather states 1, 2, and 4 (see Section 4.1) was still expected. This surface moisture excess created conditions for a rich environment for deep convection, which at the regional and synoptic scale appears bounded by the ITCZ displaced to the north. This boundary could, then, generate lower tropospheric air surges traveling eastward. Along this boundary, convective action might be triggered by the merging of eastward surges with the moisture-laden flow from an early-arriving El Niño thermal weather state but also with a low-middle level moisture influx coming from the Amazon (Sanabria et al., 2019), all these factors then producing outflow boundaries. Interaction between the outflow boundaries, low-level jets, radiational cooling of cloud tops, and orographic effects produce large multi-cluster and MCC-type systems (Goldberg, 1987). This helps to explain the short-lived cycle and much localized action of the MCC over the ERB.
As mentioned in the Introduction, the regional atmospheric dynamics seem to also be connected to interactions involving the very strong 2015/16 El Niño and tropical wave disturbances. The passage of the MJO over tropical South America has been associated with anomalies in the Walker cell driving precipitation variability over central-east Brazil and northeast Brazil (De Souza and Ambrizzi, 2005; Grimm & Ambrizzi, 2009). Specifically, over northwestern tropical South America in ENSO-neutral years, an enhancement of precipitation and deep convection has been found in the February-April rainy season (e.g., Recalde-Coronel et al., 2020), associated with the MJO phases 8 and 1 (enhanced convection over the Western Hemisphere and Africa). In particular, the propagation of the MJO convective core onto land in northwestern South America tends to result in positive February-April precipitation anomalies of ∼20–50% relative to the climatology (Recalde-Coronel et al., 2020). The timing of deep convection in the February-April season has been found to be consistent with the MJO convective activity, an eastward propagation that counteracts prevailing descent associated with the Walker circulation, rather than with the propagation of the equatorial Rossby and Kelvin waves. Because of these impacts, a possible question is whether the MJO can be counted as one of the co-causal factors of the HPE of 25th January 2016, which implies that it can be a source of predictability for similar future events.
In late January 2016, the MJO—as measured by the RMM index (Wheeler and Hendon, 2004)—persisted in phases 2 and 3 (enhanced convection over the Indian Ocean) for an anomalously large number of days (Supplementary Figure S3, S4); nonetheless, this persistence cannot explain the event of interest as it happened after 25th January, and the MJO teleconnection would take a few days to impact Ecuador all the way from the Indian Ocean. Right before the HPE, between 20th and 25th January, the MJO was actually inactive (Supplementary Figure S4), so it does not seem plausible that the MJO directly caused the event of interest.
An analysis of propagating tropical waves (Figure 9) shows that an equatorial Kelvin wave reached the coast of Ecuador between 24th and 25th January (right yellow square in Figure 9; Kelvin waves are shown in blue lines), suggesting that it could have indeed been a co-causal factor of the HPE (e.g., Mayta et al., 2021), by locally increasing moisture flows in the zone and promoting atmospheric instability conducive to high convective activity, as described at the beginning of this section. Tracing back its trajectory, the Kelvin wave originated around 180° W on 18th-19th January (left yellow square in Figure 9). Certainly, a Kelvin wave traveling on average at ∼20 m/s (1728 km/day) could have reached the coast of Ecuador in ∼6.5 days.
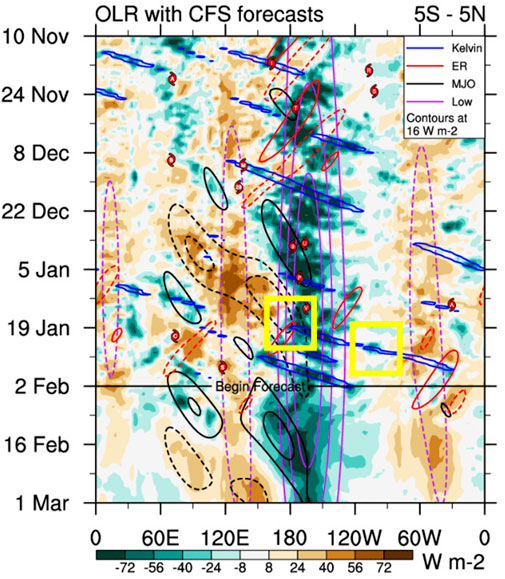
FIGURE 9. Hovmöller diagram for 10th November 2015 to 1st March 2016 showing filtered outgoing long-wave radiation (OLR) anomalies (shaded colors) and equatorial waves (contours): low-frequency waves (purple), MJO (black), equatorial Rossby waves (red), and Kelvin waves (blue). Forecasts are based on the Climate Forecast System v2 model and start on 2nd February 2016; previous dates correspond to observations. Yellow squares reference the time and longitudes discussed in the main text (see Section 4.3). The figure was generated by the Cooperative Institute for Climate and Satellites-North Carolina (CICS-NC), available at the Tropical Monitoring Archive from the North Carolina Institute for Climate Studies. For details on the particular data and methods used to generate this figure, see https://ncics.org/portfolio/monitor/mjo/.
For at least the first 2 weeks and a half of January 2016, large positive OLR anomalies dominated a region of the tropical Pacific roughly defined between 120° E and 180° W (see Figure 9). During that time, persistent increased solar radiation and enhanced westerlies on the eastern flank of the region, promoted by a zonal temperature contrast of at least 2°C—i.e., an average of ∼0.5°C west of the date line and an average of ∼2.5°C El Niño-related anomalies between the date line and 140° W—set the stage for the generation of the equatorial Kelvin wave via a Matsuno-Gill-like mechanism (e.g., Gill, 1980). A concurrent equatorial Rossby wave was also created more or less at the same time and place (see Figure 9; equatorial Rossby waves are shown in red lines).
Although the MJO, as stated before, did not directly cause the HPE analyzed in this study, it is possible that it contributed indirectly. The persistent large positive OLR anomalies in the region of the Pacific west of the date line occurred concurrently with the convection-inhibiting envelope of a strong MJO episode in phases 6–8 (see Supplementary Figure S4 and the black dashed lines starting around 22nd December 2015 in Figure 9).
Putting all the pieces together, the present analysis suggests that the HPE on 25th January was produced by a complex interaction of multiple drivers. The strong El Niño produced conditions conducive to an anomalous northward displacement of the ITCZ, changes in the atmospheric circulation patterns, and enhanced moisture availability along the coast of Ecuador, as well as the generation of strong (i.e., more energetic, e.g., Rydbeck et al., 2019; Rahkman et al., 2017) Kelvin waves. The Kelvin wave that reached the coast of Ecuador right before the HPE and that probably worked as a catalyzer for the event was partially caused by a persistent period of positive OLR anomalies and enhanced westerly winds, concurrent with the presence in the western and central Pacific of the convective inhibition envelope of a strong MJO.
Because of the economic and societal losses driven by heavy rains and floods in Ecuador and the lack of information on high-precipitation events (HPEs) and accompanying atmospheric dynamics, a climatological characterization of these events is of scientific and practical value. In this study, we analyzed the record-breaking HPE of 25th January 2016 that occurred in the aftermath of the 2015/16 El Niño as an early onset of heavy rains normally expected in the peak rainy season of March-April over the Esmeraldas River Basin (ERB) in northwestern Ecuador. We investigated the HPE’s physical characteristics in the December-January season with a climatological background in connection to the 2015/16 El Niño using surface, satellite, and reanalysis datasets.
We described, firstly, the December-January daily rainfall variability and its atmospheric setting with focus on the onset period of the normal rainy season in terms of weather states as a basis for the HPE diagnosis. Four different states characterize the long-term December-January in-season rainfall variability: two wet states (states 1 and 4), one dry state (state 3), and one wet/dry state (state 2). States 1 and 2 are regarded as thermally driven moisture of oceanic origin found in the lower and middle troposphere, state 3 represents a moisture deficit in the regional rainfall, while state 4 represents large moisture import to the region. The climatological rainy season onset in the ERB appears in the last week of January and is defined as a non-looped sequence and feedbacks of the thermally driven states 1 and 2, plus, to a lesser extent, a contribution of moisture arriving from the ITCZ and the Amazon in state 4.
With regard to the life cycle of the HPE, its driving processes, and atmospheric characteristics, we showed that the slopes of the Cordillera Real were a key driver for the horizontal and vertical distribution of moisture-laden air over land, where convection was enhanced due to orographic lifting creating updrafts, clouds, and first rains. This convective activity, also involving synoptic controls, led to the development of a meso-scale convective complex (MCC), which then migrated away from the Cordillera to the coast before dissipating. The storm duration was about 16h, with heavy rain events of about 6h, showing nighttime growth and maturation. These features have also been observed in MCCs inland and offshore of western Colombia (Mapes et al., 2013; Yepes et al., 2019). Ground precipitation data and satellite imagery showed that the core of the storm was located in the north-central part of the basin. The maximum area of the cloud shield at < −32°C at its largest extent was about 178 K km2, while the cold core at <-52°C was about 88 K km2, showing that the scale size of the rainfall system was that of a meso-β convective complex, which agrees with previous MCCs observed in northern Peru (Goldberg et al., 1987) and on the northwestern South American coast (Mohr & Zipser, 1996).
The synoptic controls were associated with the particular response of the tropical atmosphere to the 2015/16 El Niño. Namely, a southern bound of the ITCZ, abnormally displaced to 4°N, which could generate eastward lower tropospheric air surges. On this boundary, convective action produced a short-lived and localized MCC over the ERB driven by eastward surges, moist air over land from an early-arriving February-April thermal weather state, and a low-middle level moisture influx from the Amazon associated with ascent motion due to changes in the Walker circulation. This latter state was maintained by the anomalous moisture in the eastern Pacific and Amazon basin during the El Niño 2015/2016 episode (Sanabria et al., 2019). The convective environment in late January was favored by a Kelvin wave that reached the coast of Ecuador between 24th and 25th January.
Since our approach is based on the state decomposition of the weather-within-climate using a HMM, it inherits its basic assumptions. That is, the existence of independence and stationarity of the observed rainfall states and of a first-order Markov process for the hidden weather states. The latter allows an estimation of the expected sequences of weather states within a long-term period and to compare them with atmospheric conditions during the HPE; the weather states, in this way, may be seen as a continuous process. In reality, the rainy season onset period may be better regarded as a discontinuous non-hierarchical weather state process, which is a challenge to summarize via a reduced set of hidden states; then, the assessment of HPE atmospheric conditions against a state-based reference climatology is mostly descriptive.
Overall, our results suggest that, among local and regional drivers, the onset of the unusual heavy rainfall episode in late January 2016 over northwestern Ecuador was caused by a complex cross-timescale interaction of multiple drivers: a very strong El Niño conducive to enhanced convection over coastal Ecuador and promoting energetic Kelvin waves, and the arrival to Ecuador of an equatorial Kelvin wave generated during a persistent period of convective inhibition and suitable wind anomalies in the central Pacific, linked to a concurrent strong and persistent MJO event. If similar configurations—windows of opportunity—could be skillfully predicted in the future at the subseasonal-to-seasonal scale, society could be better prepared for this type of extreme precipitation event.
Most datasets utilized in this study are readily available in permanent repositories. Daily precipitation data from CHIRPS (Funk et al., 2015) are available from the Climate Hazards Center at https://data.chc.ucsb.edu/products/CHIRPS-2.0/. Hourly precipitation data from TRMM3B42 (Huffman and Bolvin, 2018) are available from the NAASA Goddard Earth Science Data and Information Services Center at https://disc.gsfc.nasa.gov/datasets/WC_MULTISEN_PREC_025_001/summary. Hourly satellite imagery from GOES 13 are available from the Comprehensive Large Array-Data Stewardship System (CLASS) developed by the National Oceanic and Atmospheric Administration (NOAA) at https://www.avl.class.noaa.gov/saa/products/search?datatype_family=GVAR_IMG. Other data supporting this research are the ERA-Interim reanalysis (Dee and Coauthores., 2011) whose upgraded version ERA5 is available in the Copernicus Climate Change Service (C3S) services at https://cds.climate.copernicus.eu/cdsapp#!/home; C3S data are governed by the license of use Copernicus products. Moreover, the NCAR-NCEP reanalysis (Kalnay and Coauthors., 1996) is available at https://psl.noaa.gov/data/gridded/data.ncep.reanalysis.html. Surface station data from INAMHI (https://www.inamhi.gob.ec/) were made available to the authors for research purposes under the Yachay Tech University and INAMHI non-disclosure agreement. The data can be made available from the corresponding author under the data-sharing terms of the institutional agreement.
LP designed the study. JC collected and curated the databases. LP, JC, and ÁM analyzed the data and created the figures. LP and JC drafted the original manuscript. All authors contributed to the article and approved the submitted version.
This study was supported by the “Universidad Yachay Tech”. ÁM was supported by Grant RYC2021-034691-I, funded by MCIN/AEI/10.13039/501100011033 and the European Union NextGenerationEU/PRTR.
The authors thank the Instituto Nacional de Meteorología e Hidrología in Ecuador for providing hydro-meteorological data. Financial support for this research was provided by Yachay Tech University. The authors also are thankful to Carl Schreck for the useful discussions regarding Figure 9 and acknowledge the use of the Tropical Monitoring Archive from the North Carolina Institute for Climate Studies.
The authors declare that the research was conducted in the absence of any commercial or financial relationships that could be construed as a potential conflict of interest.
All claims expressed in this article are solely those of the authors and do not necessarily represent those of their affiliated organizations, or those of the publisher, the editors and the reviewers. Any product that may be evaluated in this article, or claim that may be made by its manufacturer, is not guaranteed or endorsed by the publisher.
The Supplementary Material for this article can be found online at: https://www.frontiersin.org/articles/10.3389/feart.2023.1027609/full#supplementary-material
Bendix, A., and Bendix, J. (2006). Heavy rainfall episodes in Ecuador during El Niño events and associated regional atmospheric circulation and SST patterns. Adv. Geosciences 6, 43–49. doi:10.5194/adgeo-6-43-2006
Bendix, J., Gaemmerler, S., Reudenbach, C., and Bendix, A. (2003). A case study on rainfall dynamics during El Niño/La Niña 1997/99 in Ecuador and surrounding areas as inferred from GOES-8 and TRMM-PR observations. Erdkunde 57 (2), 81–93. doi:10.3112/erdkunde.2003.02.01
Bendix, J., and Lauer, W. (1992). Die Niederschlagsjahreszeiten in Ecuador und ihre klimadynamische Interpretation. Erdkunde 46, 118–134. doi:10.3112/erdkunde.1992.02.04
Bendix, J., Trache, K., Palacios, E., Rollenbeck, R., Goettlicher, D., Nauss, T., et al. (2011). El Niño meets La Niña – anomalous rainfall patterns in the “traditional” El Niño region of southern Ecuador. Erdkunde, 65(2), 151–167. doi:10.3112/erdkunde.2011.02.04
Campozano, L., Trachte, K., Célleri, R., Samaniego, E., Bendix, J., Albuja, C., et al. (2018). Climatology and teleconnections of mesoscale convective systems in an Andean basin in southern Ecuador: The case of the paute basin. Adv. Meteorology, 2018, 1–13. doi:10.1155/2018/4259191
CEPAL (1983). Los desastres naturales de 1982–1983 en Bolivia, Ecuador y Perú. Naciones Unidas—Consejo Económico Social—Comisión Económica para América Latina. Santiago. CEPAL, 227.
Cruz, A., Cadier, E., Pourrut, P., Gomez, G., Rovere, O., Toscano, G., et al. (1977).Estudio hidro-meteorológico e hidrogeológico preliminar de las cuencas de los ríosEsmeraldas y del Norte ecuatoriano. Available at: https://horizon.documentation.ird.fr/exl-doc/pleins_textes/divers16-07/32966.pdf.
Davies, R. (2016). Ecuador – 1 dead after floods and landslides – 14cm of rain in 24 hours in Esmeraldas, floodlist. Avialable at: http://floodlist.com/america/ecuador-floods-esmeraldas-january-2016.
De Souza, E. B., and Ambrizzi, T. (2006). Modulation of the intraseasonal rainfall over tropical Brazil by the Madden–Julian oscillation. Int. J. Climatol. 26, 1759–1776. doi:10.1002/joc.1331
Dee, D. P., Uppala, S. M., Simmons, A. J., Berrisford, P., Poli, P., Kobayashi, S., et al. (2011). The ERA-Interim reanalysis: Configuration and performance of the data assimilation system. Q. J. R. Meteorological Soc. 137, 553–597. doi:10.1002/qj.828
Dempster, A. P., Laird, N. M., and Rubin, D. R. (1977). Maximum likelihood from incomplete data via the EM algorithm. J. R. Stat. Soc. 39B (1), 1–22. doi:10.1111/j.2517-6161.1977.tb01600.x
Doss-Gollin, J., Muñoz, Á. G., Mason, S. J., and Pastén, M. (2018). Heavy rainfall in Paraguay during the 2015/16 austral summer: Causes and subseasonal-to-seasonal predictive skill. J. Clim. 31 (17), 6669–6685. doi:10.1175/JCLI-D-17-0805.1
Douglas, M. W., Mejia, J., Ordinola, N., and Boustead, J. (2009). Synoptic variability of rainfall and cloudiness along the coasts of northern Peru and Ecuador during the 1997/98 el Niño event. Mon. Weather Rev. 137, 116–136. doi:10.1175/2008MWR2191.1
Emck, P. (2007). A climatology of south Ecuador–with special focus on the major Andean ridge as Atlantic–Pacific climate divide. Friedrich-Alexander-Universität: Erlangen-Nürnberg.
Funk, C., Peterson, P., Landsfeld, M., Pedreros, D., Verdin, J., Shukla, S., et al. (2015). The climate hazards infrared precipitation with stations—A new environmental record for monitoring extremes. Sci. Data 2 (1), 150066. doi:10.1038/sdata.2015.66
Goldberg, R., Tisnado, M. G., and Scofield, R. (1987). Characteristics of extreme rainfall events in northwestern Peru during the 1982–1983 El Niño period. J. Geophys. 92, 14225. doi:10.1029/jc092ic13p14225
Ghahramani, Z. (2001). An introduction to hidden Markov models and Bayesian networks. Int. J. Pattern Recognit. Artif. Intell. 15, 9–42. doi:10.1142/S0218001401000836
Gill, A. E. (1980). Some simple solutions for heat-induced tropical circulation. Q. J. R. Meteorological Soc. 106 (449), 447–462. doi:10.1002/QJ.49710644905
Grimm, A. M., and Ambrizzi, T. (2009). “Teleconnections into South America from the tropics and extratropics on interannual and intraseasonal timescales,” in Past climate variability in South America and surrounding regions F. Vimeux, F. Sylvestre, and M. Khodri (Netherlands: Springer), 159–191. doi:10.1007/978-90-481-2672-9_7
Hu, X., Yang, S., and Cai, M. (2016). Contrasting the eastern pacific el Niño and the central pacific el Niño: Process-based feedback attribution. Clim. Dyn. 47, 2413–2424. doi:10.1007/s00382-015-2971-9
Huffman, G. J., and Bolvin, D. T. (2018). TRMM and other data precipitation data set documentation. Available at: https://docserver.gesdisc.eosdis.nasa.gov/public/project/GPM/3B42_3B43_doc_V7.pdf
Huffman, G. J., Bolvin, D. T., Nelkin, E. J., Wolff, D. B., Adler, R. F., Gu, G., et al. (2007). The TRMM Multisatellite Precipitation Analysis (TMPA): Quasi-global, multiyear, combined-sensor precipitation estimates at fine scales. J. Hydrometeorol. 8, 38–55. doi:10.1175/JHM560.1
Hughes, J. P., and Guttorp, P. (1994). A class of stochastic models for relating synoptic atmospheric patterns to regional hydrologic phenomena. Water Resour. Res. 30, 1535–1546. doi:10.1029/93WR02983
Instituto Nacional de Meteorología e Hidrología, INAMHI (2018). Datos hidrologicos y meteorológicos de la Cuenca hidrográfica del Río Esmeraldas 1985–2018. Germany: INAMHI.
Kalnay, E., and Coauthors, (1996). The NCEP/NCAR 40-year reanalysis project.Bull. Am. Meteorological Soc. 77, 437–471. doi:10.1175/1520-0477(1996)077<0437:TNYRP>2.0.CO;2
Lenssen, N. J. L., Goddard, L., and Mason, S. (2020). Seasonal Forecast skill of ENSO teleconnection maps. Weather Forecast. 35, 2387. doi:10.1175/WAF-D-19-0235.1
Liu, C., Zipser, E. J., and Nesbitt, S. W. (2007). Global distribution of tropical deep convection: Different perspectives from TRMM infrared and radar data. J. Clim. 20, 489–503. doi:10.1175/JCLI4023.1
Maddox, R. (1980). Mesoscale convective complexes. Bull. Am. Meteorological Soc., 61(11), 1374–1387. doi:10.1175/1520-0477(1980)061<1374:mcc>2.0.co;2
Marteau, R., Moron, V., and Philippon, N. (2009). Spatial coherence of monsoon onset over western and central sahel (1950–2000). J. Clim. 22, 1313–1324. doi:10.1175/2008JCLI2383.1
Mayta, V. C., Kiladis, G. N., Dias, J., Silva Dias, P. L., and Gehne, M. (2021). Convectively coupled Kelvin waves over tropical South America. J. Clim. 34, 6531–6552. doi:10.1175/JCLI-D-20-0662.1
McPhaden, M. J. (2004). Evolution of the 2002/03 el Niño. Bull. Am. Meteorological Soc. 85 (5), 677–696. doi:10.1175/BAMS-85-5-677
Mohr, K. I., and Zipser, E. J. (1996). Mesoscale Convective Systems defined by their 85–GHz ice scattering signature: Size and intensity comparison over tropical Oceans and continents. Mon. Weather Rev. 124, 2417–2437. doi:10.1175/1520-0493(1996)124<2417:MCSDBT>2.0
Moron, V., and Robertson, A. W. (2014). Interannual variability of Indian summer monsoon rainfall onset date at local scale. Int. J. Climatol. 34, 1050–1061. doi:10.1002/joc.3745
Morrison, H., Tessendorf, S. A., and Thompson, G. (2012). Sensitivity of a simulated midlatitude squall line to parameterization of raindrop breakup. Mon. Weather Rev. 140, 2437–2460. doi:10.1175/MWR-D-11-00283.1
Muñoz, A. G., Goddard, L., Mason, S. J., and Robertson, A. W. (2016). Cross-time scale interactions and rainfall extreme events in southeastern south America for the austral summer. Part II: Predictive skill. J. Clim. 29 (16), 5915–5934. doi:10.1175/JCLI-D-15-0699.1
Muñoz, Á. G., Goddard, L., Robertson, A. W., Kushnir, Y., and Baethgen, W. (2015). Cross–time scale interactions and rainfall extreme events in southeastern South America for the austral summer. Part I: Potential predictors. J. Clim. 28 (19), 7894–7913. doi:10.1175/jcli-d-14-00693.1
Pineda, L. E., and Willems, P. (2016). Multisite downscaling of seasonal predictions to daily rainfall characteristics over pacific–andean river basins in Ecuador and Peru using a nonhomogeneous hidden Markov model. J. Hydrometeorol., 17(2), 481498. doi:10.1175/jhm-d-15-0040.1
Pineda, L. E., and Willems, P. (2018). Rainfall extremes, weather and climate drivers in complex terrain: A data-driven approach based on signal enhancement methods and EV modeling. J. Hydrology 563, 283–302. doi:10.1016/j.jhydrol.2018.05.062
Pohl, B., and Matthews, A. J. (2007). Observed changes in the lifetime and amplitude of the madden–julian oscillation associated with interannual ENSO sea surface temperature anomalies. J. Clim. 20, 2659–2674. doi:10.1175/JCLI4230.1
Pourrut, P. (1995). El agua en el Ecuador, clima, precipitaciones. Available at: https://horizon.documentation.ird.fr/exl-doc/pleins_textes/pleins_textes_7/divers2/010014823.pdf.
Poveda, G., Espinoza, J. C., Zuluaga, M. D., Solman, S. A., Garreaud, R., and van Oevelen, P. J. (2020). High impact weather events in the Andes. Front. Earth Sci. 8, 162. doi:10.3389/feart.2020.00162
Robertson, A. W., Kirshner, S., and Smyth, P. (2004). Downscaling of daily rainfall occurrence over northeast Brazil using a hidden Markov model. J. Clim. 17, 4407–4424. doi:10.1175/JCLI-3216.1
Rabiner, L. R. (1989). A tutorial on hidden Markov models and selected applications in speech recognition. Proc. IEEE 77, 257–286. doi:10.1109/5.18626
Rakhman, S., Lubis, S. W., and Setiawan, S. (2017). Impact of ENSO on seasonal variations of Kelvin waves and mixed rossby-gravity waves. IOP Conf. Ser. Earth Environ. Sci. 54 (1), 012035. doi:10.1088/1755-1315/54/1/012035
Rasmusson, E. M., and Carpenter, T. H. (1982). Variations in tropical sea surface temperature and surface wind fields associated with the Southern Oscillation/El Niño. Mon. Weather Rev., 110(5), 354–384. doi:10.1175/1520-0493(1982)110<0354:VITSST>2.0.CO
Recalde-Coronel, G. C., Zaitchik, B., and Pan, W. K. (2020). Madden-Julian Oscillation influence on sub-seasonal rainfall variability on the west of South America. Clim. Dyn. 54 (3-4), 2167–2185. doi:10.1007/s00382-019-05107-2
Rossel, F., and Cadier, E. (2009). El Niño and prediction of anomalous monthly rainfalls in Ecuador. Hydrol. Process. 23, 3253–3260. doi:10.1002/hyp.7401
Rydbeck, A. v., Jensen, T. G., and Flatau, M. (2019). Characterization of intraseasonal Kelvin waves in the equatorial Pacific ocean. J. Geophys. Res. Oceans 124 (3), 2028–2053. doi:10.1029/2018JC014838
Sanabria, J., Carrillo, C. M., and Labat, D. (2019). Unprecedented rainfall and moisture patterns during el Niño 2016 in the eastern pacific and tropical Andes: Northern perú and Ecuador. Atmosphere 10 (12), 768. doi:10.3390/atmos10120768
Schreck, C. J. (2021). Global survey of the MJO and extreme precipitation. Geophys. Res. Lett. 48 (19), e2021GL094691. doi:10.1029/2021GL094691
Schreck, C. J., Molinari, J., and Mohr, K. I. (2011). Attributing tropical cyclogenesis to equatorial waves in the western north pacific. J. Atmos. Sci. 68 (2), 195–209. doi:10.1175/2010jas3396.1
Schwarz, G. (1978). Estimating the dimension of a model. The Annals of Statistics. Ann. Stat. 6, 461–464. doi:10.1214/aos/1176344136
Takahashi, K. (2004). The atmospheric circulation associated with extreme rainfall events in Piura, Peru, during the 1997--1998 and 2002 El Niño events. Ann. Geophys. 22, 3917–3926. doi:10.5194/angeo-22-3917-2004
Velasco, I., and Fritsch, J. M. (1987). Mesoscale convective complexes in the Americas. J. Geophys. Res. 92, 9591–9613. doi:10.1029/JD092iD08p09591
Verbist, K., Robertson, A. W., Cornelis, W. M., and Gabriels, D. (2010). Seasonal predictability of daily rainfall characteristics in central northern Chile for dry-land management. J. Appl. Meteorology Climatol. 49, 1938–1955. doi:10.1175/2010JAMC2372.1
Wheeler, M. C., and Hendon, H. H. (2004). An all-season real-time multivariate MJO index: Development of an index for monitoring and prediction. Mon. Weather Rev. 132 (8), 1917–1932. doi:10.1175/1520-0493(2004)132<1917:aarmmi>2.0.co;2
Yepes, J., Poveda, G., Mejía, J. F., Moreno, L., and Rueda, C. (2019). Chocojex: A research experiment focused on the choco low-level jet over the far eastern pacific and western Colombia. Bull. Am. Meteorological Soc. 100, 779–796. doi:10.1175/BAMS-D-18-0045.1
Keywords: weather regimes, heavy rainfall, El Niño, Andes, Madden-Julian oscillation, interference
Citation: Pineda LE, Changoluisa JA and Muñoz ÁG (2023) Early onset of heavy rainfall on the northern coast of Ecuador in the aftermath of El Niño 2015/2016. Front. Earth Sci. 11:1027609. doi: 10.3389/feart.2023.1027609
Received: 25 August 2022; Accepted: 03 July 2023;
Published: 10 August 2023.
Edited by:
Everaldo Barreiros De Souza, Federal University of Pará, BrazilCopyright © 2023 Pineda, Changoluisa and Muñoz. This is an open-access article distributed under the terms of the Creative Commons Attribution License (CC BY). The use, distribution or reproduction in other forums is permitted, provided the original author(s) and the copyright owner(s) are credited and that the original publication in this journal is cited, in accordance with accepted academic practice. No use, distribution or reproduction is permitted which does not comply with these terms.
*Correspondence: Luis E. Pineda, bHBpbmVkYUB5YWNoYXl0ZWNoLmVkdS5lYw==
Disclaimer: All claims expressed in this article are solely those of the authors and do not necessarily represent those of their affiliated organizations, or those of the publisher, the editors and the reviewers. Any product that may be evaluated in this article or claim that may be made by its manufacturer is not guaranteed or endorsed by the publisher.
Research integrity at Frontiers
Learn more about the work of our research integrity team to safeguard the quality of each article we publish.